
Geophysical Characterization and Seepage Detection of the Chimney Rock Dam Embankment Near Salina, Oklahoma

1
Boone Pickens School of Geology, Oklahoma State University, Stillwater, OK 74075, USA
2
Maxima Geophysics LLC, Dallas, TX 75098, USA
*
Author to whom correspondence should be addressed.
†
These authors contributed equally to this work.
Water 2024, 16(9), 1224; https://0-doi-org.brum.beds.ac.uk/10.3390/w16091224
Submission received: 22 March 2024
/
Revised: 14 April 2024
/
Accepted: 22 April 2024
/
Published: 25 April 2024
(This article belongs to the Special Issue Safety Evaluation of Dam and Geotechnical Engineering, Volume II)
Abstract
:The operator of Chimney Rock Dam observed the emergence of increasing seepage at the toe of the dam when the water level in the reservoir exceeded a particular elevation. However, the source and the pathways of the seepage were not identified. To address this issue, integrated geophysical methods were employed to delineate the different units of the dam embankment and identify potential seepage zones and pathways. The methods utilized in this study included electrical resistivity tomography (ERT), self-potential (SP), and multichannel analysis of surface waves (MASW). The ERT profiles revealed variations in the dam’s fill properties, including areas with anomalously low resistivity, interpreted as zones of relatively high moisture content. The two long SP profiles conducted along the dam embankment displayed similar spatial correlations with these low-resistivity zones, suggesting potential preferential seepage pathways. The SP map generated from a suite of parallel SP profiles conducted over the abutment depicts a pattern of positive background and negative potential anomalies, which may suggest fluid movement or seepage potential. The MASW profile along the top of the dam characterized an upper low shear-wave velocity layer corresponding to the top dry section of the embankment underlain by a higher shear-wave velocity layer, interpreted as saturated zone. The utilized geophysical methods successfully characterized the different materials of the embankment and identified zones of potential seepage.
1. Introduction
Dam serves critical roles in hydroelectric power, flood control, and water management ([1,2,3]). The safety and integrity of these structures is therefore of utmost importance, as failure could result in significant environmental damage, property loss, and loss of life. The Chimney Rock Dam is experiencing seepage at its toe, which causes ponded water nearby, raising concerns for the safety and integrity of the dam. This seepage can cause internal erosion, downstream flooding, loss of reservoir storage capacity, and potential structural failure ([4,5,6]). Understanding the source of seepage and preferential pathway is crucial for making informed decisions about maintenance, operation, mitigation, and rehabilitation to ensure long-term dam stability and performance.
Visual inspection and borehole techniques are routinely used for the monitoring and assessment of dams ([7,8]). Visual inspections are often conducted regularly by dam operators and engineers to inspect the dam for signs of distress or wear, such as cracks, erosion, or leaks. This can include walking the dam length, inspecting the spillway and outlet works, and examining the foundation and abutments. The borehole techniques involve measuring various geotechnical and physical parameters at specific points in the dam or its foundation, such as stress, strain, water level, temperature, and pressure, as well as chemical characteristics such as pH and dissolved oxygen ([9,10]). However, these point measurements may not provide a comprehensive understanding of the overall condition of the dam, as the data are usually sparse. Detailed knowledge of the hydrologic condition is required to identify seepage sources and differentiate seepage through the dam from seepage through connected/unconnected conduits away from the dam.
To ensure a comprehensive understanding of the state and condition of dams, geophysics is been recognized as an essential and complementary tool for dam safety assessments. Geophysical techniques offer several benefits for monitoring seepage which include the following. (1) Spatial coverage: geophysical data can be collected over a wide area, providing a more comprehensive understanding of seepage patterns across the dam and its foundation. (2) Noninvasive nature: geophysical methods do not require the excavation or disturbance of the dam or its foundation, making them a noninvasive way to collect data on seepage patterns ([11]). This can be particularly beneficial for dams that are in operation, as it minimizes the risk of disruption to their functions. (3) Cost advantage: geophysical methods can often be more cost-effective than other techniques, such as borehole drilling or instrument installation, particularly for large dams where multiple measurement points may be needed ([12]).
Geophysical techniques have been widely utilized for dam safety assessments over the past several decades. Numerous authors have employed various geophysical methods to investigate the subsurface conditions of dams to identify potential issues that may compromise their safety ([13,14,15,16]). For instance, the self-potential (SP) method exploits the electrical voltage generated by flowing water through porous materials. By measuring these voltage variations, researchers can gain valuable information about the hydraulic regime within the dam, which is crucial for detecting and characterizing seepage. Studies by [17,18,19] have demonstrated the effectiveness of the SP method in identifying and characterizing seepage in embankment dams. The electrical resistivity tomography (ERT) method measures the electrical resistivity/conductivity of the subsurface by galvanic coupling, allowing researchers to visualize variations in the dam’s composition and identify potential anomalies such as weak zones, cracks, or excessive moisture. These anomalies can indicate potential pathways for seepage or structural vulnerabilities. Study by [20] has shown the application of ERT in investigating seepage pathways and monitoring newly constructed dams. His work, along with influential contributions by [21,22], further emphasize the effectiveness of ERT in dam safety assessments.
Multichannel analysis of surface waves (MASW) is a method that utilizes seismic sources to generate surface waves, which can be used to infer subsurface properties such as soil and rock type, compaction, zones of weakness, and saturation. This information is crucial for identifying potential failure zones within the dam or its foundation. Studies by [23,24,25] demonstrate the effectiveness of MASW in near-surface characterization for dam safety assessments. Combining various geophysical techniques can provide a comprehensive understanding of the subsurface. Studies by several authors like [26] exemplify this combined approach, utilizing SP, ERT, and seismic refraction to offer a more reliable assessment of dam stability and seepage characteristics. By employing these noninvasive methods, dam safety engineers can gain valuable insights without causing any physical damage to the structure. This proactive approach plays a vital role in ensuring the safety and longevity of these critical infrastructure assets. This study integrated multiple geophysical techniques to provide a more comprehensive understanding of the dam’s internal conditions. The main objectives of this study were to characterize the dam units and their hydrologic conditions, investigate zones of potential seepage, and use this information to design effective monitoring surveys. The subsequent sections provide a discussion of the study area, methodology employed for data acquisition and processing techniques, and interpretation of the results.
2. Description and Geology of the Study Area
The Chimney Rock Dam, also known as the W.R. Holway Reservoir, is a crucial infrastructure owned and operated by the Grand River Dam Authority (GRDA) in Mayes County, Oklahoma, which was constructed in 1968. As an upper reservoir for the Salina Pumped Storage Project (SPSP), it possesses the capacity to produce 260 MW of electricity ([27]). The dam’s primary purpose is to provide vital water resources, flood control, and electricity to the local community, while also supporting the recreation and tourism industry in the state. The GRDA is responsible for the maintenance and management of the dam, reservoir, and hydroelectric power generation facility, while also ensuring the safety of visitors and preserving the natural resources in the area through the regulation of recreational activities. The location of the dam is depicted in Figure 1.
The geology of the region is characterized by the Upper Devonian–Lower Mississippian system, as documented by [28,29,30]. H.R. Holway Dam site is distinguished by three significant formations that shape the local landscape: the Chattanooga Formation, St. Joe Group, and Reed Spring Formation. Refs. [31,32] provide a thorough examination of the stratigraphy of the dam site area. The Chattanooga Formation, which is predominantly black shale of varying thickness, underlies the St. Joe Group. The St. Joe Group comprises three lithologic units, starting with the Pierson Formation, which is characterized by gray, thick-bedded coarse-grained limestone. The middle unit, the Northview Formation, consists mainly of mudstone/shaly limestone. The uppermost unit, the Compton Limestone, contains fossils of marine life. The Lower Reeds Spring Formation is composed of intercalation of limestone, shale, and cherts, while the Middle and Upper Reeds Spring consists of limestone and chert. The Pineville Tripolite facies, which is the top unit, is composed of diatom-rich chert, suggesting deposition in shallow marine environments. The dam embankment lies within the Reed Springs Formation, where rock units comprise alternating thin-bedded limestone and chert. The chert exhibits a high degree of fracturing, which might serve as a conduit for seepage, as recent excavations have revealed the presence of karst features in the vicinity.
3. Data Acquisition and Processing
Integrated geophysical methods involving electrical resistivity tomography (ERT), self-potential (SP), and multichannel analysis of surface waves (MASW) were employed as a comprehensive approach to gather and analyze critical information needed for better understanding of the internal characteristics and hydraulic behavior within the dam. Figure 2 shows the basemap of the geophysical data acquired, which includes transects of three geophysical methods: four electrical resistivity tomography (ERT), six self-potential (SP), and multichannel analysis of surface waves (MASW). These techniques were employed to collect data on the subsurface properties and structures of the area, providing insights into the geological and hydrological characteristics of the Chimney Rock Dam. Table 1 presents the acquisition parameters and details of the three geophysical methods utilized for this project. The following section provides the specifics of the techniques and methodology applied to provide interpretable models.
3.1. Electrical Resistivity Tomography
A total of four ERT profiles, each extending 498 m in length, were acquired utilizing a Syscal Pro resistivity meter equipped with 72 electrodes. For data collection, the Wenner–Schlumberger configuration was employed with an electrode spacing of 7.0 m. The collected data were subjected to a thorough processing workflow. Initially, Prosys II software version 3.14 was employed to eliminate any erroneous data points, outliers, and measurements associated with negative electrical potentials. Subsequently, the processed data were imported into RES2DINV software version 4.9.11 for further refinement and inversion. Within RES2DINV, the data underwent additional noise removal and inversion using a nonlinear least squares optimization method. This method iteratively reduces the discrepancy between a mathematical model predicted response and the actual measured resistivity data, ultimately generating a geoelectrical resistivity model of the dam’s interior and surrounding rock formations ([33]).
3.2. Self-Potential
In this study, we acquired a total of six SP profiles at the dam site (see Figure 2 consisting of four profiles in a grid configuration, spanning an area of 100 m × 40 m and two long profiles along SP-1 and SP-2, with lengths of 240 m and 400 m, respectively. We utilized a fixed-base configuration technique for the SP data acquisition, with a station interval of 1 m. This survey configuration employs a reference electrode placed at a fixed location, while the potential difference associated with subsurface phenomena is measured between the reference and the other electrode. To ensure that any anomalies related to seepage are captured and to avoid correlating seepage to nonseepage zones, we selected a nonseepage zone for the base station (or reference electrode). We employed two nonpolarizing copper sulfate electrodes connected through a wire and a Fluke 289 true RMS digital voltmeter for the SP measurements. Following the procedure outlined by [34], we applied an in-house MATLAB routine to drift-correct the SP data. We then processed the data to eliminate any anomalous spiking measurements using moving average with a window size of 3. Utilizing a small window size has the benefit of concentrating the filtering process on immediate, local regions of the data, rather than incorporating information from more distant areas. This approach helps to prevent the filter from excessively smoothing the data, enabling anomalies to remain relatively intact. For visualization purposes, we plotted the two SP transects as SP profiles and used the Golden Surfer software version 11.0 to generate a 2D map by contouring the processed gridded data using the kriging technique.
3.3. Multichannel Analysis of Surface Wave
A 500 m long seismic line was acquired along transect S-1 at the crest near the downslope of the dam embankment utilizing the MASW technique. The data acquisition process involved deploying a land streamer system equipped with 24 geophones, a 10 kg sledgehammer source, and a Geometrics Geode recording system. The geophone spacing was set at 1.5 m, and the source interval was 10 m. The data acquisition was carried out using a sampling rate of 0.5 ms and a record length of 1 s. After acquiring the data, we rolled along the line by moving the source–receiver array to the next line using a truck, which allowed for a quick and labor-efficient exercise. A total of 20 shot-gathers were recorded. The MASW data processing and inversion were performed using the Kansas Geological Survey (KGS) SurfSeis software version 6. The processing steps involved combining all shot records into a single file and assigning geometry. The next step was to stack the data, which helped to eliminate random noise and improve the horizontal resolution and data quality ([35,36]). The subsequent task was to identify the surface wave and mute portion of the data above and below the Rayleigh wave where necessary. A crucial step was the dispersion curve analysis using the fundamental mode. At this stage, elevation profile was added to the data. The final step included inversion to yield a 1D shear wave velocity profile and spatial interpolation to generate a 2D shear wave velocity image.
4. Results
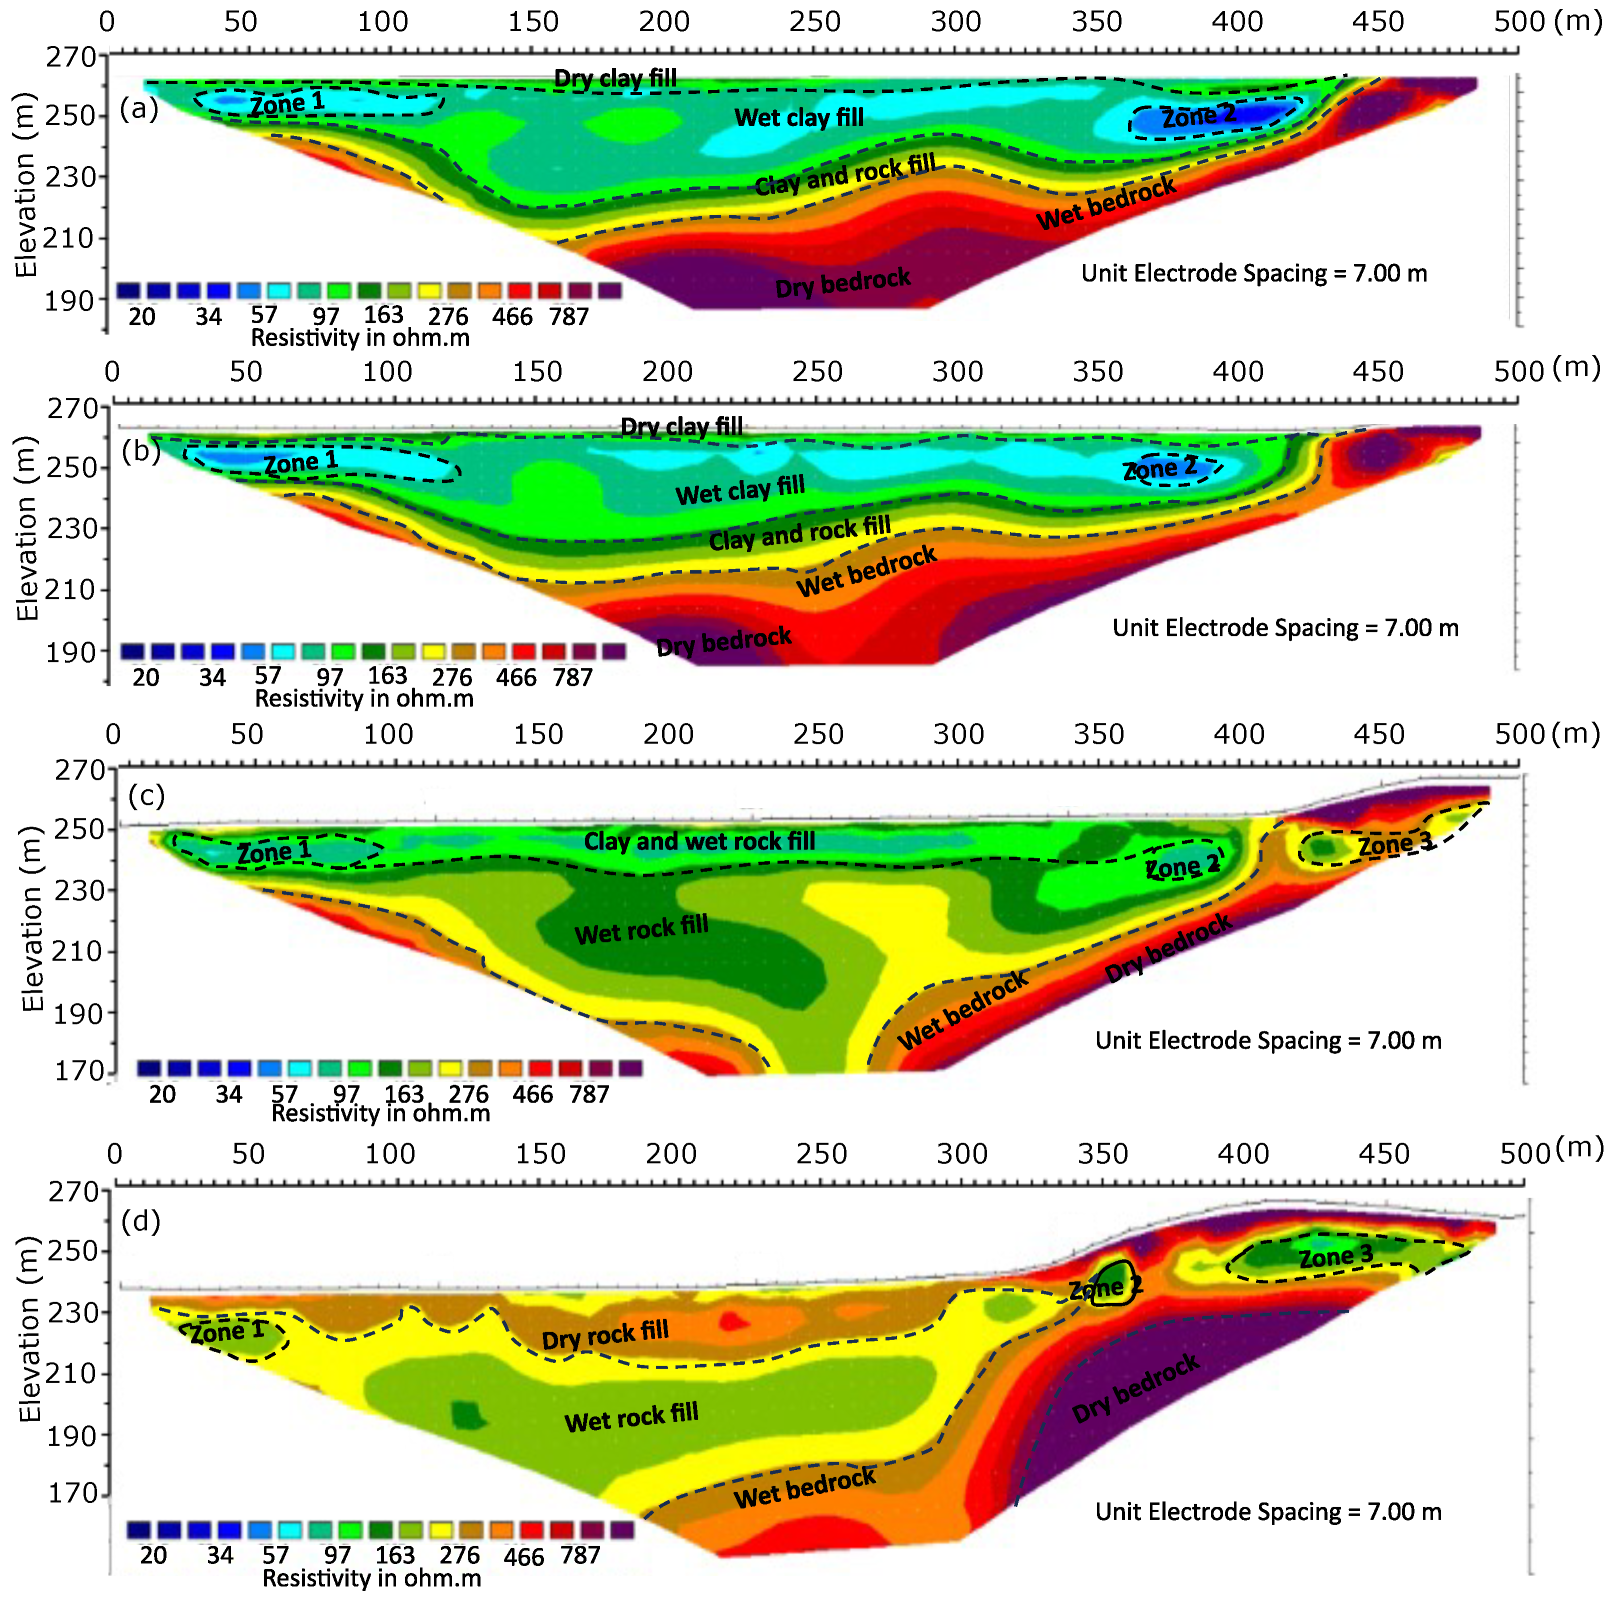
The ERT profile acquired along the crest of the dam at the upstream section effectively imaged the interior of the dam down to a depth of 180 m ground elevation with resistivity distribution ranging from 20 to 1000 ohm-m. The profile delineated a distinct surficial layer characterized by moderate resistivity, interpreted as dry clay fill. The layer was relatively dry because it was above the lake water level of 261 amsl. Underlying the surficial layer is a thick geoelectric unit of relatively low resistivity. Within this unit are lenses of anomalously low-resistivity regions marked as zone 1 and 2, occurring laterally at 20–120 m and 360–420 m, respectively (Figure 3a). These lenses are interpreted as saturated zones with significantly higher moisture content compared to their surrounding rocks. The resistivity progressively increases with depth below this layer, which is consistent with the anticipated presence of both the rock fill material and dry bedrock at these depths.
The ERT profile shown in Figure 3b represents a cross-section of the downstream region, which comprises semipermeable materials. This profile was collected at a water level of 261 amsl along transect ER-2. The resistivity ranges from 20 to 1000 ohms, which is consistent with the upstream region. Four geoelectric layers were identified based on the resistivity distribution. The upper layer is a shallow, moderately resistive layer interpreted as dry clay fill. Beneath this is a low-resistivity layer, which is interpreted to represent saturated clay fill. Two anomalously wet zones are present within this layer, spanning a lateral distance of 25 to 125 m and 360 to 380 m. Beneath this, the resistivity gradually increases with depth. The third layer has resistivities ranging from 300 to 500 ohm-m and is interpreted as a layer of clay and rock fill. The fourth layer is believed to be bedrock, which is partially saturated with resistivities ranging from 500 to 700 ohm-m and is partially dry with resistivities ranging from 800 to 1000 ohm. This is probably the dam foundation rock.
Figure 3c shows the resistivity profile along transect ER-3 of the dam’s downstream slope at the semipervious materials–rock fill contact. The profile delineates three geoelectric layers: a clay and wet rock fill top layer, wet rock fill, and partly saturated and partly dry bedrock, with resistivity values ranging between 160 and 1000 ohm-m. The top layer exhibits a relatively low resistivity, while resistivity gradually increases with depth due to the presence of more rock fill materials. It is noteworthy that the anomalously low resistivity zones 2 and 3 were observed at slightly greater depths. Additionally, zone 3 was detected at this depth. However, due to the zone extending beyond our transect, its size and geometry were not well captured.
Figure 3d depicts the resistivity profile along transect ER-4 of the downstream slope of the dam, located on top of rock fill materials, at a lake water level of 262 m. This profile delineates three rock units: dry rock fill with resistivity ranging between 200 and 450 ohm-m, wet rock fill with resistivity ranging between 100 and 200 ohm-m, saturated bedrock with resistivity ranging between 400 and 700 ohm-m, and dry bedrock with resistivity ranging between 700 and 1000 ohm-m. The profile reveals anomalously local-resistivity zones within the bedrock plateau and dam fill marked as zones 1, 2, and 3. Zone 1 appears near the north abutment at approximately 6 m depth below the top of the dam with a lateral extension of 40 m. Zone 2 appears within the dam fill and next to the south abutment at approximately 9 m depth below the top of the dam with over 60 m lateral extension. The low-resistivity zone 3 appears partially within the plateau next to the south abutment at around 7.6 m below ground surface and with ground elevation of 262 m. The zone appears continuous away from the profile.
The shear wave velocity profile depicted in Figure 4, generated by the collocated multichannel analysis of surface waves (MASW) along transect S-1, corroborated the understanding of the hydrologic condition of the upper section of the dam. This profile characterizes the upper 14.0 m of the dam into three layers. The first layer, with an average thickness of 4.6 m, exhibits low shear-wave velocity and is interpreted as dry clay fill materials. The low velocity in this zone can be attributed to the presence of air and voids, as dry materials allow for greater interparticle space and less wave energy transmission. The second seismic layer, with an average thickness of 5 m and relatively higher shear-wave velocity, is interpreted as a wet-clay zone. The higher shear-wave velocity in this zone can be attributed to the presence of water, as water increases the bulk density of the materials and, thus, the shear-wave velocity. The relatively higher shear-wave velocity in this zone suggests that the water content is higher than that of the upper zone. The base layer, mapped by the MASW profile, shows relatively low shear-wave velocity. This low-velocity zone is most likely because the MASW profile images the impervious and semipervious fill materials at greater depth, where water content is likely lower, resulting in a lower shear-wave velocity.
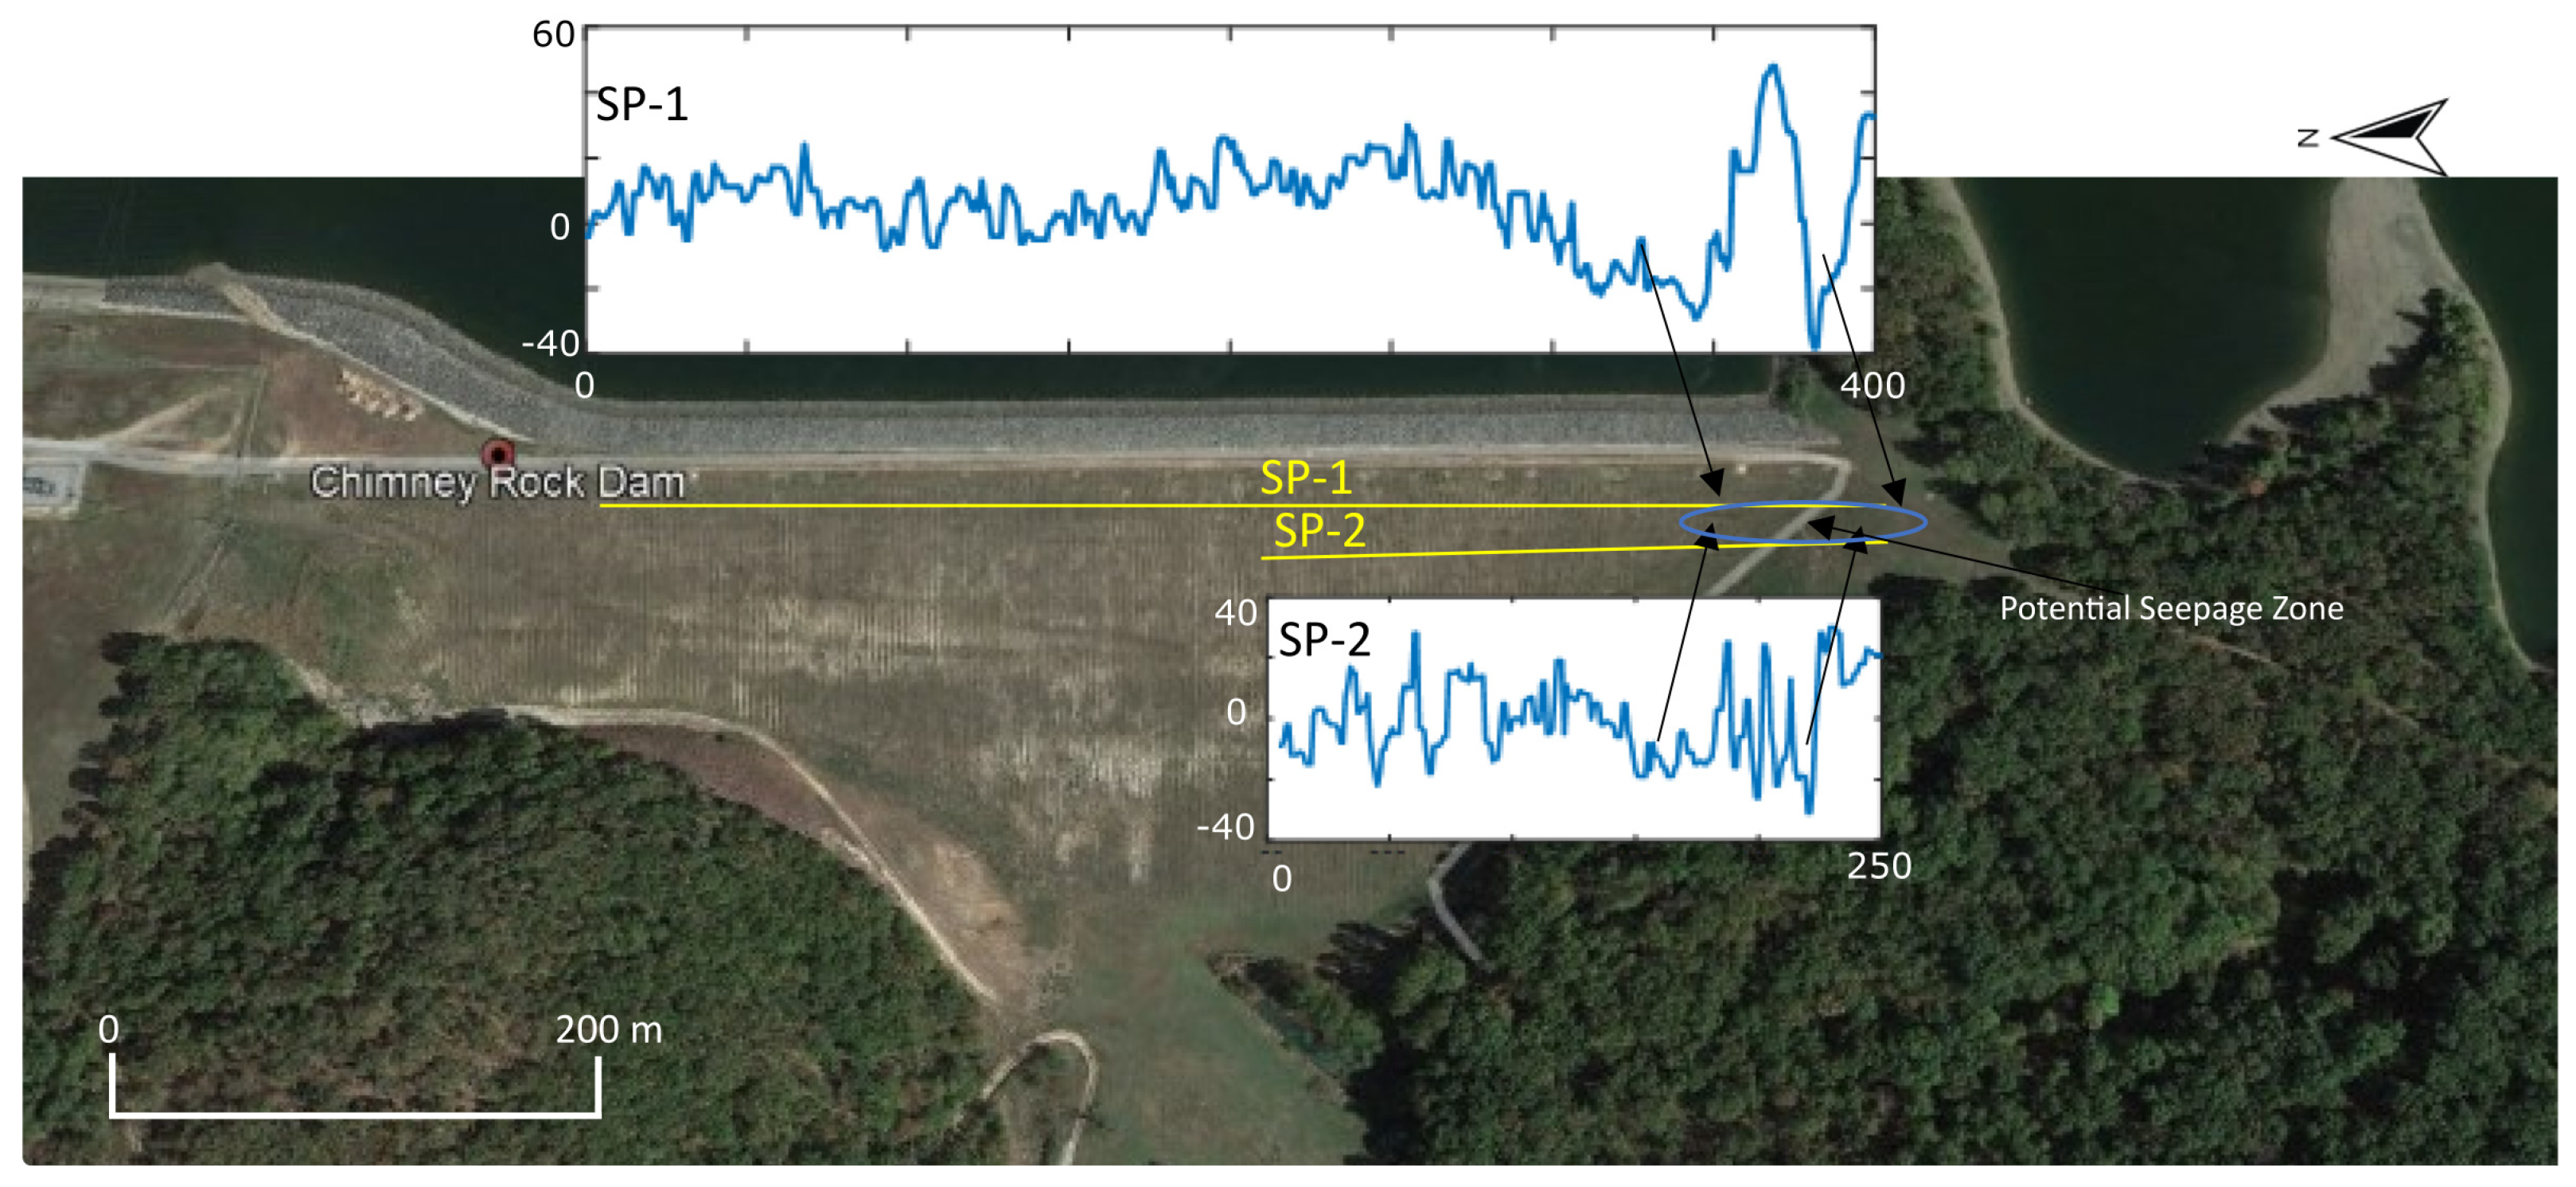
The SP profiles along SP-1 and SP-2 typically exhibit two patterns of background positive and anomalously high negative potential anomalies. The low negative potential, indicated by the black arrow (Figure 5), is interpreted as zones of relatively high moisture content. The zones correlate with zones 2 and 3 of the ERT profile, which may suggest preferential seepage zones within the embankment.
To further investigate potential seepage at the site, four SP parallel lines were acquired, covering an area of 100 by 40 m, using nonpolarizing electrodes. The area of investigation was selected based on the ERT and collocated SP profiles. The data are presented as a contour map in Figure 6, which is overlaid on a Google Earth map of the area for spatial context and intuitive and meaningful interpretation. The SP map displays two distinct patterns, one characterized by a high-SP range (20–65 mV), represented by yellow to brown colors, and another by a low-SP range (<15 mV), represented by green to blue colors. The low SPs are attributed to water-saturated zones. More data are needed to conclude whether it is static as a result of rainfall, snow melt, or is related to hydrodynamic process within the embankment itself or connected conduit away from it.
5. Discussion
The geophysical investigation integrating ERT, SP, and MASW conducted at Chimney Rock Dam yielded valuable information about its construction and potential seepage areas. The ERT successfully delineated the internal features of the dam, including the bedrock interface, variations in electrical properties potentially related to moisture content, and low-resistivity anomalies interpreted as wet zones. The local resistivity zones identified along the ERT profiles, labeled as zones 1, 2, and 3, appeared at similar spatial locations but with depths that increased towards the downslope direction. This is attributed to the 3D geometry and heterogeneous construction materials of the dam, as previously highlighted by [37]. It is evident that zone 3 extends beyond the model and is probably connected to the two laterally separated conduits to the south, which may contribute to the source of seepage to the embankment downslope and abutments. This is a reasonable scenario, as there is no evidence of erosion of the embankment’s clayey materials despite indications of seepage and toe ponding at the abutment of the downstream section.
The interpretation of SP data aligns with the findings of ERT and delineates areas of high moisture content; however, the data are insufficient to identify seepage corridors due to the limitations of a single measurement, which may not adequately capture dynamic processes. Moreover, low potentials on the SP map are disseminated and exhibit no evidence of a continuous pathway caused by piping and internal erosion. Consequently, the integrated results do not provide sufficient support for seepage through the dam crest.
The MASW data provided valuable insights into the higher water content within the embankment materials by examining the shear-wave velocity structure. The limitation of the study stems from the 3D geometry and varying fill materials of the dam embankment (Figure 7), as highlighted by [38,39]. These complexities can lead to out-of-plane effects that may impact depth estimation accuracy in resistivity measurements. Future investigations could benefit from quantitative SP amplitude interpretation to estimate the depth of potential seepage zones and time-lapse SP measurements to capture the dynamic nature of seepage processes, potentially yielding more definitive evidence. Despite these limitations, the integrated geophysical approach effectively overcame challenges by integrating diverse datasets to provide a comprehensive understanding of the internal structure of the dam and hydrology and supporting informed dam safety management strategies.
6. Conclusions
A comprehensive investigation of the Chimney Rock Dam near Salina, Oklahoma, was carried out using integrated geophysical methods that incorporated electrical resistivity tomography (ERT), self-potential (SP), and multichannel analysis of surface waves (MASW) to characterize the internal structure of the embankment and potential for seepage. The ERT profiles revealed variations in the geoelectric properties, identifying low-resistivity zones that indicated high moisture content. These zones were found to correlate with anomalies detected by the SP profiles and map, suggesting potential seepage areas. The MASW provided information about the dam’s fill structure, revealing layers of varying moisture content.
In this study, utilizing a multigeophysical approach for evaluating dam embankments provided valuable insights into the internal structure, seepage zones, and hydrogeological conditions. By integrating diverse datasets, including geological, geotechnical, and borehole data, the geophysical interpretation can be further improved. To safeguard and preserve the dam embankments, it is recommended to apply the findings of this study to design time-lapse SP and ERT. This approach allows the assessment and monitoring of spatial and temporal patterns of seepage, thereby facilitating the precise identification of its origin and pathways.
Author Contributions
Conceptualization: A.I.; investigation: P.A., F.M., O.S. and A.I.; resources: A.I.; data curation: P.A., F.M., O.S. and A.I.; methodology: P.A., F.M., O.S. and A.I.; formal analysis: P.A., F.M., O.S. and A.I.; visualization: P.A., F.M., O.S. and A.I.; writing—original draft: P.A., A.I., F.M. and O.S.; writing—review and editing: P.A. and A.I.; project administration: A.I.; funding acquisition: A.I. All authors have read and agreed to the published version of the manuscript.
Funding
This research was funded by Grand River Dam Authority (GRDA), grant number 43910.
Institutional Review Board Statement
This work was published having been approved by the GRDA committee.
Data Availability Statement
This information is restricted, and may be accessible upon request pending approval.
Acknowledgments
The authors would like to acknowledge the Oklahoma State University for providing support and computing facilities for this project.
Conflicts of Interest
Author Ahmed Ismail was employed by the company Maxima Geophysics LLC. The remaining authors declare that the research was conducted in the absence of any commercial or financial relationships that could be construed as a potential conflict of interest.
References
- Ahn, J.M.; Lee, S.; Kang, T. Evaluation of dams and weirs operating for water resource management of the Geum River. Sci. Total Environ. 2014, 478, 103–115. [Google Scholar] [CrossRef] [PubMed]
- Boulange, J.; Hanasaki, N.; Yamazaki, D.; Pokhrel, Y. Role of dams in reducing global flood exposure under climate change. Nat. Commun. 2021, 12, 417. [Google Scholar] [CrossRef] [PubMed]
- Chaudhari, S.; Pokhrel, Y. Alteration of river flow and flood dynamics by existing and planned hydropower dams in the Amazon River Basin. Water Resour. Res. 2022, 58, e2021WR030555. [Google Scholar] [CrossRef]
- Panthulu, T.V.; Krishnaiah, C.; Shirke, J.M. Detection of seepage paths in earth dams using self-potential and electrical resistivity methods. Eng. Geol. 2001, 59, 281–295. [Google Scholar] [CrossRef]
- Nthaba, B.; Shemang, E.M.; Atekwana, E.A.; Selepeng, A.T. Investigating the earth fill embankment of the lotsane dam for internal defects using time-lapse resistivity imaging and frequency domain electromagnetics. J. Environ. Eng. Geophys. 2020, 25, 325–339. [Google Scholar] [CrossRef]
- Guo, Y.; Cui, Y.A.; Xie, J.; Luo, Y.; Zhang, P.; Liu, H.; Liu, J. Seepage detection in the earth-filled dam from self-potential and electrical resistivity tomography. Eng. Geol. 2022, 306, 106750. [Google Scholar] [CrossRef]
- Wieland, M.; Kirchen, G.F. Long-term dam safety monitoring of Punt dal Gall arch dam in Switzerland. Front. Struct. Civ. Eng. 2012, 6, 76–83. [Google Scholar] [CrossRef]
- Fergason, K.C.; Rucker, M.L.; Panda, B.B. Methods for monitoring land subsidence and earth fissures in the Western USA. Proc. Int. Assoc. Hydrol. Sci. 2015, 372, 361–366. [Google Scholar] [CrossRef]
- Mathur, R.K.; Sehra, R.S.; Gupta, S.L. Instrumentation of concrete dams. Int. J. Eng. Appl. Sci. 2017, 4, 257508. [Google Scholar]
- Adamo, N.; Al-Ansari, N.; Sissakian, V.; Laue, J.; Knutsson, S. Dam safety: Use of instrumentation in dams. J. Earth Sci. Geotech. Eng. 2021, 11, 145–202. [Google Scholar] [CrossRef]
- Michalis, P.; Sentenac, P. Subsurface condition assessment of critical dam infrastructure with non-invasive geophysical sensing. Environ. Earth Sci. 2021, 80, 556. [Google Scholar] [CrossRef]
- Camarero, P.L.; Moreira, C.A. Geophysical investigation of earth dam using the electrical tomography resistivity technique. REM-Int. Eng. J. 2021, 70, 47–52. [Google Scholar] [CrossRef]
- Cardarelli, E.; Cercato, M.; De Donno, G. Characterization of an earth-filled dam through the combined use of electrical resistivity tomography, P-and SH-wave seismic tomography and surface wave data. J. Appl. Geophys. 2014, 106, 87–95. [Google Scholar] [CrossRef]
- Martínez-Moreno-Moreno, F.J.; Delgado-Ramos, F.; Galindo-Zaldívar, J.; Martín-Rosales, W.; López-Chicano, M.; González-Castillo, L. Identification of leakage and potential areas for internal erosion combining ERT and IP techniques at the Negratín Dam left abutment (Granada, southern Spain). Eng. Geol. 2018, 240, 74–80. [Google Scholar] [CrossRef]
- Gołębiowski, T.; Piwakowski, B.; Ćwiklik, M.; Bojarski, A. Application of combined geophysical methods for the examination of a water dam subsoil. Water 2021, 13, 2982. [Google Scholar] [CrossRef]
- Sanuade, O.; Ismail, A. Geophysical and geochemical pilot study to characterize the dam foundation rock and source of seepage in part of Pensacola Dam in Oklahoma. Water 2023, 15, 4036. [Google Scholar] [CrossRef]
- Sheffer, M.R. Response of the Self-Potential Method to Changing Seepage Conditions in Embankment Dams. Ph.D. Thesis, University of British Columbia, Vancouver, BC, Canada, 2002. [Google Scholar]
- Tchoumkam, L.A.N.; Chouteau, M.; Giroux, B.; Rivard, P.; Saleh, K.; Côté, A. A case study of self–potential detection of seepage at the junction of two embankment dams. In Proceedings of the Symposium on the Application of Geophysics to Engineering and Environmental Problems Proceedings, Keystone, CO, USA, 11–15 April 2010; Society of Exploration Geophysicists: Houston, TX, USA, 2010; pp. 118–125. [Google Scholar]
- Minsley, B.J.; Burton, B.L.; Ikard, S.; Powers, M.H. Hydrogeophysical investigations at hidden dam, Raymond, California. J. Environ. Eng. Geophys. 2011, 16, 145–164. [Google Scholar] [CrossRef]
- Ikard, S.J.; Rittgers, J.; Revil, A.; Mooney, M.A. Geophysical investigation of seepage beneath an earthen dam. Groundwater 2015, 53, 238–250. [Google Scholar] [CrossRef] [PubMed]
- Sirles, P. Seepage investigation using geophysical techniques at Coursier Lake Dam, British Columbia, Canada. Nondestruct. Eval. Aging Struct. Dams 1995, 2457, 226. [Google Scholar]
- Chouteau, M.; Bouchedda, A.; Rivard, P.; Larget, M.; Hamoni, M.; Côté, A.; Saleh, K. Seepage at les cèdres embankment dam (part 2): Self-potential tomography and additional surveys. In Proceedings of the Symposium on the Application of Geophysics to Engineering and Environmental Problems, Denver, CO, USA, 17–21 March 2013; Society of Exploration Geophysicists and Environment and Engineering Geophysical Society: Houston, TX, USA, 2013; p. 710. [Google Scholar]
- Ivanov, J.; Miller, R.D.; Lacombe, P.; Johnson, C.D.; Lane, J.W., Jr. Delineating a shallow fault zone and dipping bedrock strata using multichannal analysis of surface waves with a land streamer. Geophysics 2006, 71, A39–A42. [Google Scholar] [CrossRef]
- Rahimi, S.; Moody, T.; Wood, C.; Kouchaki, B.M.; Barry, M.; Tran, K.; King, C. Mapping subsurface conditions and detecting seepage channels for an embankment dam using geophysical methods: A case study of the Kinion Lake Dam. J. Environ. Eng. Geophys. 2019, 24, 373–386. [Google Scholar] [CrossRef]
- Al-Heety, A.J.; Hassouneh, M.; Abdullah, F.M. Application of MASW and ERT methods for geotechnical site characterization: A case study for roads construction and infrastructure assessment in Abu Dhabi, UAE. J. Appl. Geophys. 2021, 193, 104408. [Google Scholar] [CrossRef]
- Nwokebuihe, S.C.; Alotaibi, A.M.; Elkrry, A.; Torgashov, E.V.; Anderson, N.L. Dam seepage investigation of an Earthfill dam in Warren County, Missouri using geophysical methods. AIMS Geosci. 2017, 3, 1–13. [Google Scholar] [CrossRef]
- Wagman, D.C. Salina pumped storage project. Power Eng. 2006, 110, 6–7. [Google Scholar]
- Buchanan, G.S. The distribution and correlation of the Mississippian of Oklahoma. AAPG Bull. 1927, 11, 1307–1320. [Google Scholar]
- Campbell, G. New Albany Shale. AAPG Bull. 1946, 57, 829–908. [Google Scholar] [CrossRef]
- Gore, C.E., Jr. The Geology of a Part of the Drainage Basins on Spavinaw, Salina and Spring Creeks. Tulsa Geolological Soc. Dig. 1952, 20, 144–179. [Google Scholar]
- Huffman, G.G. Geology of the south and west flanks of the Ozark uplift, northeast Oklahoma. Okla. Geol. Surv. Bull. 1958, 77, 27–41. [Google Scholar]
- Starke, J.M. Geology of northeastern Cherokee County, Oklahoma. Okla. Geol. Surv. Circ. 1961, 57, 62. [Google Scholar]
- Loke, M.H.; Barker, R.D. Rapid least-squares inversion of apparent resistivity pseudosections by a quasi-Newton method. Geophys. Prospect. 1996, 44, 131–152. [Google Scholar] [CrossRef]
- Barde-Cabusson, S.; Finizola, A.; Grobbe, N. A practical approach for self-potential data acquisition, processing, and visualization. Interpretation 2021, 9, T123–T143. [Google Scholar] [CrossRef]
- Neducza, B. Stacking of surface waves. Geophysics 2007, 72, V51–V58. [Google Scholar] [CrossRef]
- Naskar, T.; Kumar, J. MATLAB codes for generating dispersion images for ground exploration using different multichannel analysis of surface wave transforms. Geophysics 2022, 87, F15–F24. [Google Scholar] [CrossRef]
- Sjödahl, P.; Dahlin, T.; Zhou, B. 2.5 D resistivity modeling of embankment dams to assess influence from geometry and material properties. Geophysics 2006, 71, G107–G114. [Google Scholar] [CrossRef]
- Norooz, R.; Olsson, P.I.; Dahlin, T.; Günther, T.; Bernstone, C. A geoelectrical pre-study of Älvkarleby test embankment dam: 3D forward modelling and effects of structural constraints on the 3D inversion model of zoned embankment dams. J. Appl. Geophys. 2021, 191, 104355. [Google Scholar] [CrossRef]
- Cho, I.K.; Ha, I.S.; Kim, K.S.; Ahn, H.; Lee, S.; Kang, H.J. 3D effects on 2D resistivity monitoring in earth-fill dams. Near Surf. Geophys. 2014, 12, 73–81. [Google Scholar] [CrossRef]
Figure 1.
Location map of the surveyed area of the chimney rock dam (marked by the blue polygon) behind the lake.
Figure 1.
Location map of the surveyed area of the chimney rock dam (marked by the blue polygon) behind the lake.

Figure 2.
A basemap showing the location of the acquired geophysical data at the Chimney Rock Dam which included four resistivity profiles (ER-1–ER-4), six self-potential profiles (SP-1, SP-2, and 4 SP grids bounded by the yellow box), and one multichannel analysis of surface waves profile (S-1). All survey lines run from north to south.

Figure 3.
The resistivity profiles ER-1–ER-4 along the Chimney Rock Dam. ER-1 is along the top of the dam (a), ER-2, ER-3, and ER-4 (b–d respectively) are along the downstream slope of the dam. The four resistivity profiles show anomalously low resistivity zones 1, 2, and 3, interpreted as zones of relatively high moisture content.

Figure 4.
Shear-wave velocity profile derived from the MASW line acquired along the top of the dam.

Figure 5.
Self–potential profiles, SP-1 and SP-2, at their respective locations along the dam embankment. The two profiles show low SP anomalies, interpreted as a potential seepage zone.
Figure 5.
Self–potential profiles, SP-1 and SP-2, at their respective locations along the dam embankment. The two profiles show low SP anomalies, interpreted as a potential seepage zone.

Figure 6.
SP contour map generated from a grid of four parallel 100 m profiles shows low–SP patterns (shown in blue) interpreted as potential seepage zones.
Figure 6.
SP contour map generated from a grid of four parallel 100 m profiles shows low–SP patterns (shown in blue) interpreted as potential seepage zones.

Figure 7.
Schematic cross-section of the chimney rock dam. The arrows mark the locations of the acquired ERT profiles (ER-1 to ER-4).
Figure 7.
Schematic cross-section of the chimney rock dam. The arrows mark the locations of the acquired ERT profiles (ER-1 to ER-4).


Table 1.
Field data acquisition and survey parameters.
| Survey Method | Acquisition and Survey Parameters |
|---|---|
| ERT | Electrodes: 72 steel electrodes |
| Array type: Wenner–Schlumberger | |
| Device: IRIS Instrument Syscal Pro resistivity meter | |
| Number of survey lines: 4 | |
| Electrode spacing: 7.0 m | |
| Profile length: 498 m | |
| Self-Potential | Electrodes: Cu/CuSO4 nonpolarized |
| Survey type: Fixed-based configuration | |
| Device: Fluke 289 true RMS digital voltmeter | |
| Number of survey lines: 6 | |
| Station spacing: 1.0 m spacing | |
| MASW | Number of receivers per shot: 24 geophones |
| Receiver interval: 1.5 m | |
| Shot interval: 10 m | |
| Record length: 1.0 s | |
| Stack number: 3 | |
| Device: Geometrics Geode | |
| Source: 10-kg sledgehammer |
Disclaimer/Publisher’s Note: The statements, opinions and data contained in all publications are solely those of the individual author(s) and contributor(s) and not of MDPI and/or the editor(s). MDPI and/or the editor(s) disclaim responsibility for any injury to people or property resulting from any ideas, methods, instructions or products referred to in the content. |
© 2024 by the authors. Licensee MDPI, Basel, Switzerland. This article is an open access article distributed under the terms and conditions of the Creative Commons Attribution (CC BY) license (https://creativecommons.org/licenses/by/4.0/).
Share and Cite
MDPI and ACS Style
Adetokunbo, P.; Ismail, A.; Mewafy, F.; Sanuade, O. Geophysical Characterization and Seepage Detection of the Chimney Rock Dam Embankment Near Salina, Oklahoma. Water 2024, 16, 1224. https://0-doi-org.brum.beds.ac.uk/10.3390/w16091224
AMA Style
Adetokunbo P, Ismail A, Mewafy F, Sanuade O. Geophysical Characterization and Seepage Detection of the Chimney Rock Dam Embankment Near Salina, Oklahoma. Water. 2024; 16(9):1224. https://0-doi-org.brum.beds.ac.uk/10.3390/w16091224
Chicago/Turabian StyleAdetokunbo, Peter, Ahmed Ismail, Farag Mewafy, and Oluseun Sanuade. 2024. "Geophysical Characterization and Seepage Detection of the Chimney Rock Dam Embankment Near Salina, Oklahoma" Water 16, no. 9: 1224. https://0-doi-org.brum.beds.ac.uk/10.3390/w16091224
Note that from the first issue of 2016, this journal uses article numbers instead of page numbers. See further details here.