
Prevention of Water Seepage Impact on the Soluble Rocks Using Colloidal Silica

Department of Civil and Environmental Engineering, Amirkabir University of Technology, Tehran 1591634311, Iran
*
Author to whom correspondence should be addressed.
Water 2024, 16(9), 1211; https://0-doi-org.brum.beds.ac.uk/10.3390/w16091211
Submission received: 26 March 2024
/
Revised: 4 April 2024
/
Accepted: 12 April 2024
/
Published: 24 April 2024
(This article belongs to the Special Issue Renewable Energy System Flexibility for Water Desalination: Volume II)
Abstract
:Water seepage flow can dissolve soluble minerals that exist in rock formations. With the development of the excavated area due to dissolution, the water seepage velocity (discharge) into the dissolved rock will also increase. Therefore, water seepage and dissolution propagation are two interrelated processes. Mosul Dam foundation has experienced these processes since its construction, resulting in karstification in the reservoir and foundation of the dam. The present seepage-dissolution measure to minimize this phenomenon relies on traditional cementitious grouts. However, this measure has not been able to address the issue effectively. Currently, there are a few studies on the chemical remediation of soluble rocks under the influence of high-velocity water flow and water pressure. Therefore, the first part of the current study focuses on the impact of high-velocity water flow and water pressure on the dissolution acceleration of gypsum/anhydrite rocks. In the second part, the waterproof capacity of silica colloidal and its impact on the solubility reduction of the rocks is evaluated. Two distinct laboratory models were designed to simulate rock dissolution in the dam abutments and under the dam. Two sets of experiments were conducted on untreated and silica-treated samples. The experiments were executed on the samples extracted from Fatha Formation outcrop and problematic layers of brecciated gypsum situated at varying depths of the Mosul Dam foundation. The obtained findings reveal that the colloidal silica grout markedly prevents the water seepage impact on the soluble rock and that it can be very useful as an alternative to cement-based grouts.
1. Introduction
The dissolution of evaporite rocks due to water seepage under hydraulic structures poses various challenges globally. The process is considered the crucial factor in the deterioration of rock [1]; a major concern associated with the dissolution of soluble rocks involves karstification features, such as caves and sinkholes. These features facilitate the discharge of water leakage and increase the possibility of dam collapse [2,3,4,5,6,7,8].
Sulfate rocks, i.e., gypsum (CaSO4·2H2O) and anhydrite (CaSO4), represent a prominent variety of evaporite deposits and commonly occur in the Earth’s crust [9,10].
Several dams in different parts of the world face the challenges of sulfate rock dissolution and the emergence of sinkholes within their foundations and/or abutments. Notable examples include the Anchor Dam in Wyoming, the Kama Dam in Russia, the Bratsk Reservoir in Siberia, the Caspe Dam in Spain [11], the Mahuangtian Reservoirs in China, and the Sangtuda Dam in Tajikistan [12]. In addition, the United States has experienced numerous cases [13,14].
Among the dams that suffer from gypsum dissolution and karstification phenomena, Mosul Dam in Iraq stands as a prominent example. The karstification phenomenon manifested at the dam site and in the reservoir area, extending approximately 100 m below the dam [15,16]. The above instances emphasize the imperative of implementing effective approaches to controlling gypsum dissolution using an alternative to cement-based grouts.
Grouting is applied as a conventional strategy to tackle seepage concerns and regulate the dissolution rate of soluble rocks beneath hydraulic structures. Owing to their easy accessibility and cost-effectiveness, frequently employed grouting materials include Portland cement, fly ash, lime, and bitumen [17,18]. Notably, the grouting procedure at the Mosul Dam has traditionally relied on conventional cement combined with a bentonite additive [19].
The ability of cement to penetrate fine soils or narrow fissures in rocks is relatively weak [20]. Moreover, questions related to the adhesion between gypsum and cement have been identified [21,22]. The limitations of traditional grouts highlight the critical need to explore alternative materials to enhance the efficacy of grouting in controlling rock dissolution.
In this regard, due to their high penetrability and adhesivity, low viscosity, and controllable gelling times, chemical grouts can be considered a convincing alternative to cement-based grouts [23]. The use of chemical grouts in engineering applications is therefore increasing, in particular in tunnels and dam foundations [24,25].
Among chemical grouts, silica grout is considered the most popular option for engineers. This is attributed to its economical and environmentally friendly properties, arising from its chemical similarities with the natural silicate of the soil and rocks. This grout, with a very fine particle size of 5 to 100 nm, offers a remarkable penetrability to enter and seal cracks that may be challenging for cementitious grouts [26]. Additionally, from a rheological standpoint, colloidal silica exhibits Newtonian liquid behavior. This means that it lacks initial resistance to shearing, allowing it to flow as long as pressure gradients persist. In contrast, cementitious grout behaves as a Bingham fluid, featuring a shear strength threshold linked to penetration depth [27,28].
Fattah et al. and Al-Ridha et al. [29,30] conducted studies to enhance the mechanical properties of gypseous soils using chemical grouts. However, there remains a notable scarcity of published research aimed at reducing solubility and the dissolution rate in gypsum rocks. An early investigation by Nikolaev and Foregina [31] utilizing a laboratory model revealed the effects of oxaloaluminosilicate and sodium silicate liquids on gypsum solubility. The study found that the materials play an important role in reducing the discharge of circulated water through artificially created holes in the gypsum samples.
To fill the gap caused by the scarcity of studies on the prevention of water seepage impact on soluble rock, the primary objective of the present research is to mitigate the impact of water leakage on the solubility of gypsum/anhydrite rocks by employing colloidal silica grout. To achieve this goal, a number of gypsum rock samples were collected from both the Fatha Formation outcrop and problematic layers of brecciated gypsum located at different depths beneath the Mosul Dam. In order to evaluate the impact of colloidal silica on the solubility of the samples, a series of dissolution simulation experiments on untreated and treated samples were conducted. To conduct the simulated experiments, two distinct devices were designed, included high-velocity-based apparatus which simulated the abutment condition and high-pressure-based apparatus which simulated the dam foundation condition.
1.1. Kinetics of Gypsum Dissolution by Water
Equations (1) and (2) describe the chemical reactions involved in the dissolution of gypsum and anhydrite rocks, respectively [32]. The gypsum solubility in pure water at 20 °C is 2.531 g/L [33].
The kinetics of the dissolution of gypsum and anhydrite is represented by Equation (3) [34].
where, m is the mass of the dissolved CaSO4 at time t (s), K (m/s) is the coefficient of dissolution rate, A is the surface of CaSO4 exposed to the water flow, Cs is the solubility of dissolved substance or saturated concentration (kg/m3), C is the concentration of dissolved rock at time t, and n is 1 for gypsum and 2 for anhydrite.
Equation (4) describes the concentration change rate of CaSO4 in water [35].
where, v′ is the volume of the solution.
Upon integration of Equation (4), Equation (5) is derived, illustrating the relationship between gypsum concentration and time.
1.2. Mosul Dam and Geological Setting of Its Foundation
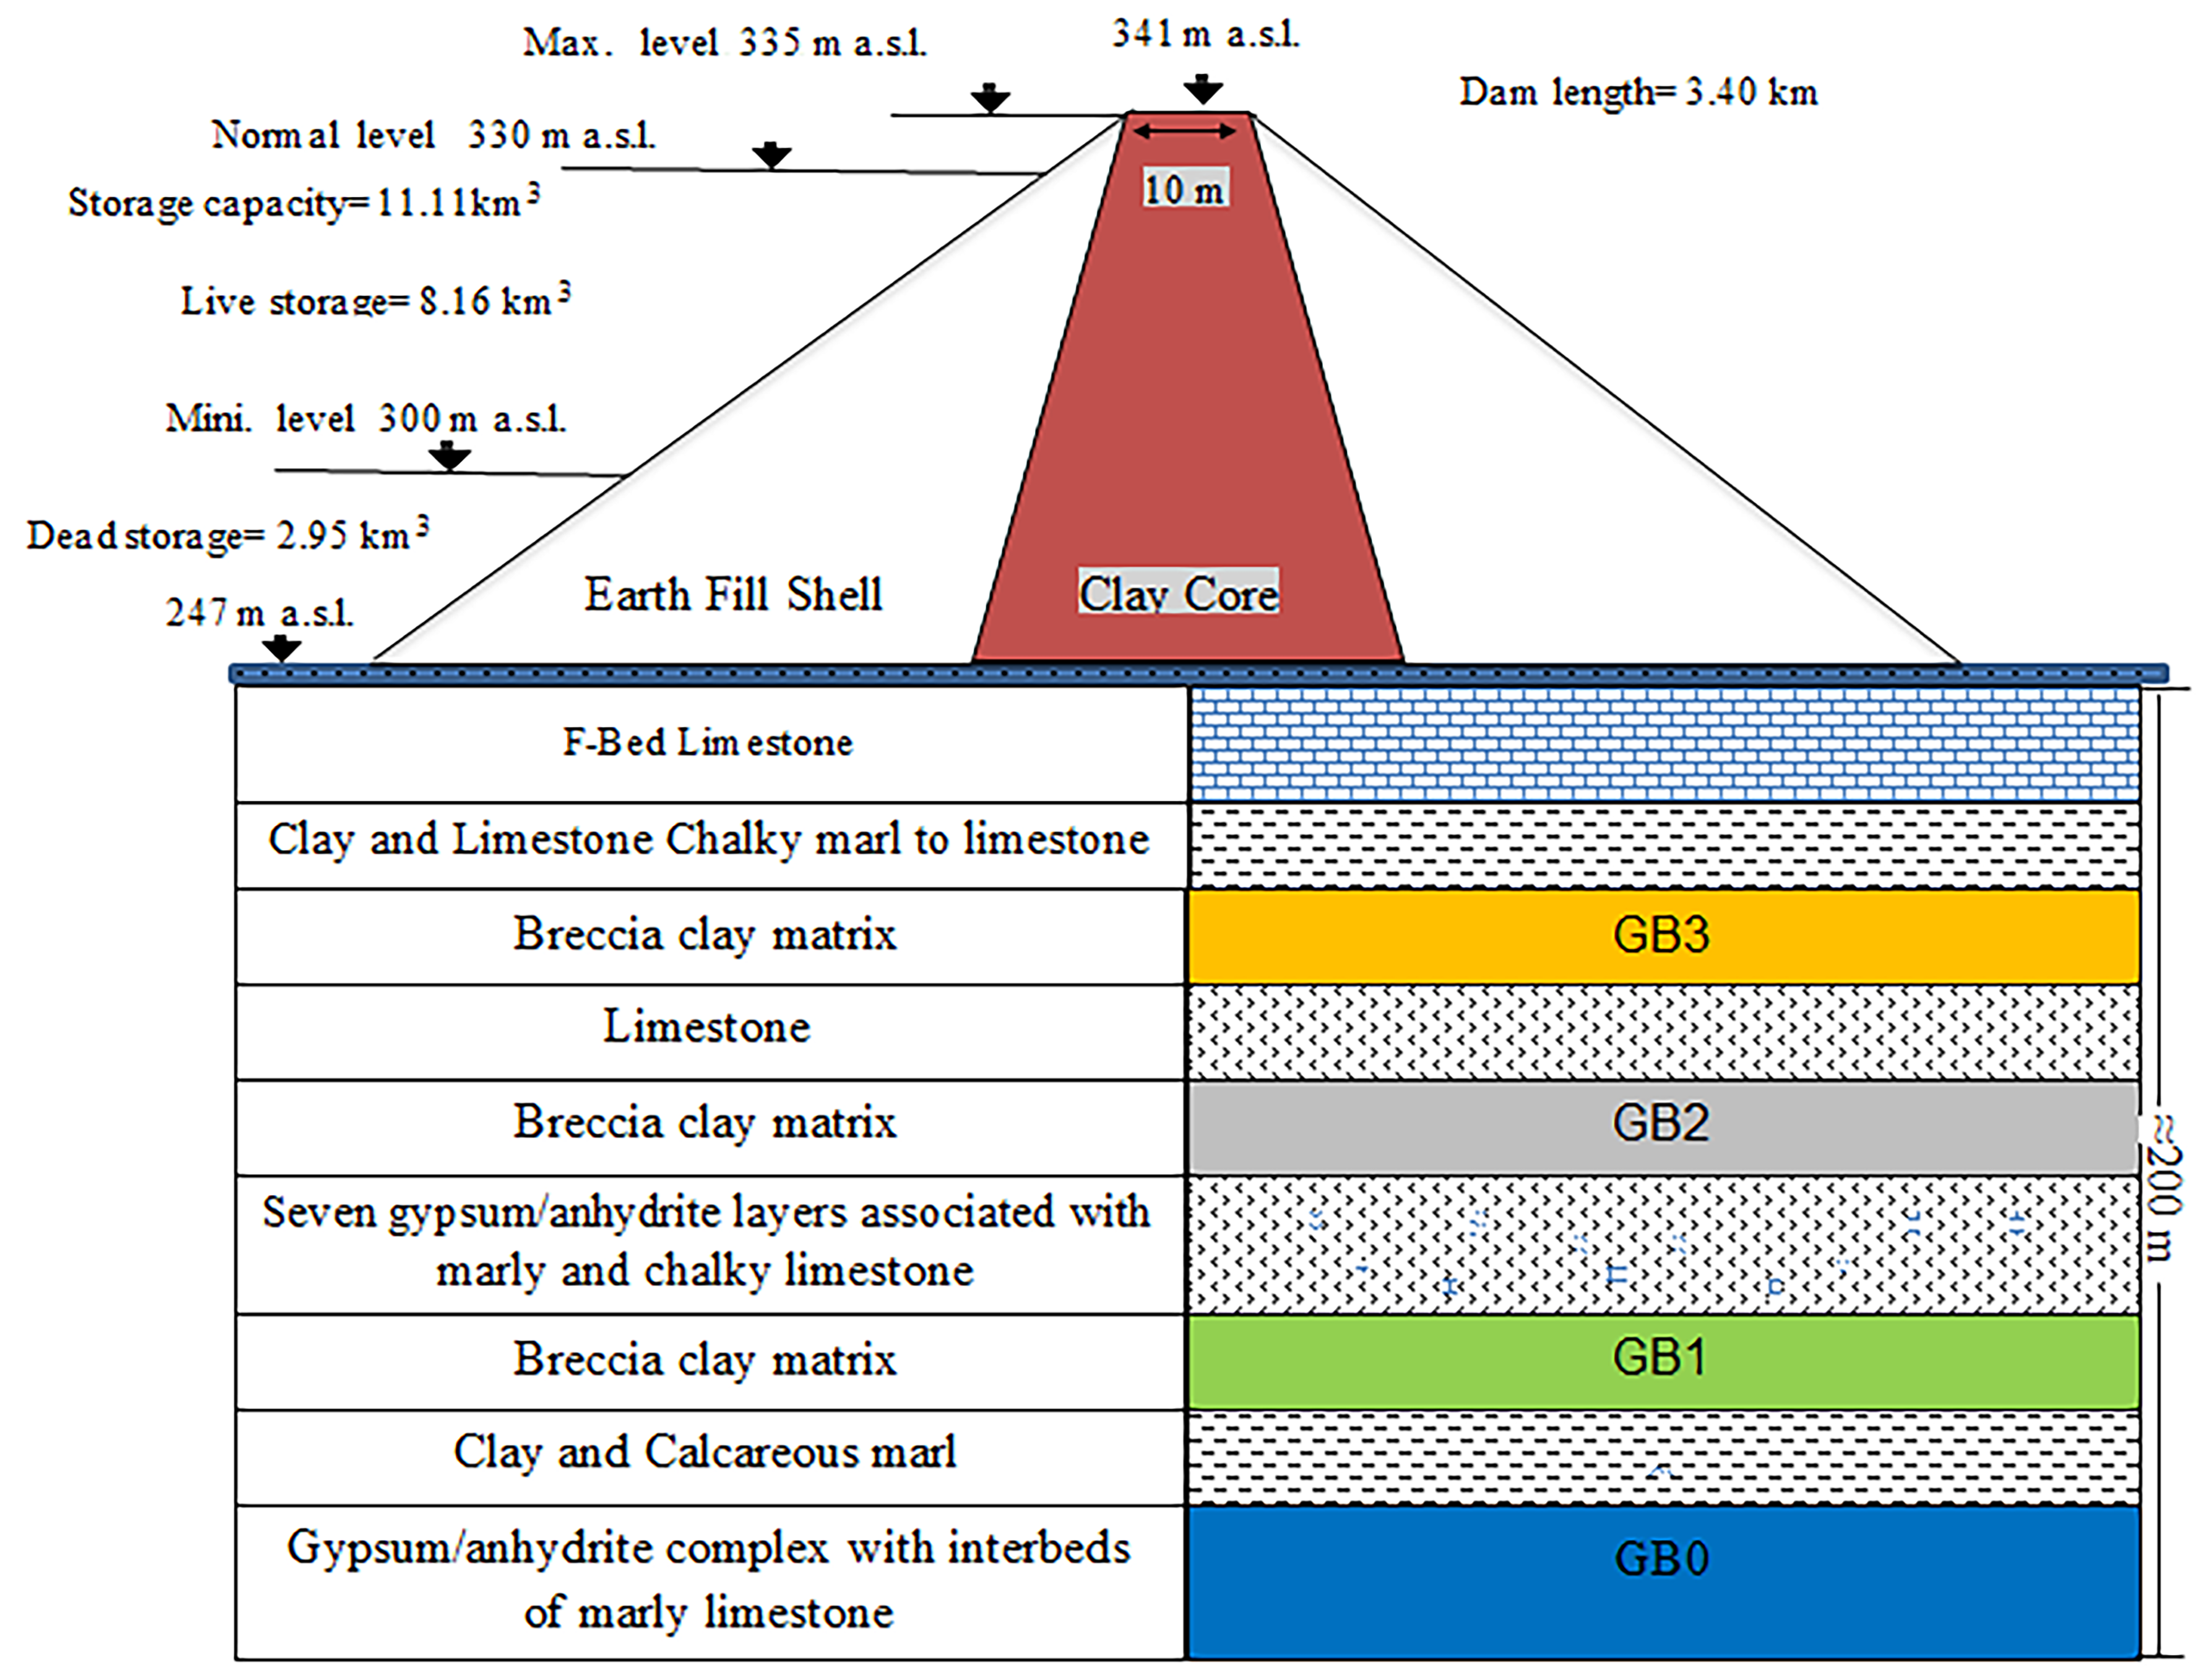
Mosul Dam is an earthfill embankment with a clay core situated on the Tigris River, approximately 60 km northwest of the city of Mosul in northern Iraq. The Schematic diagram of the dam cross section and its foundation is illustrated in Figure 1. This scheme was originally designed to impound 11.11 billion m³ of water for irrigation, hydropower generation, and flood control.
From a geological standpoint, the Mosul dam site is highly intricate. It is situated between two anticlines: Butmah East anticline on the right abutment and the Taira anticline on the left abutment [20,36]. Two geological formations are evident in the vicinity of the dam and reservoir: (1) Fatha Formation (Middle Miocene), comprising lower and upper members, composed of marl, limestone, and gypsum sequences, and (2) Euphrates-Jeribe Formation (lower Miocene era), comprising limestone, dolostone beds, and marl.
Dissolution of the gypsum layers of the Fatah Formation rendered karstification a common phenomenon; in particular, sinkhole feature in the dam site and the reservoir area is common. In 1986, multiple sinkholes appeared on the right bank at a distance of almost 150 m from the dam contact with the right abutment [37]. Between 1992 and 1998, four sinkholes with a linear arrangement parallel to the dam axis and roughly 800 m downstream on the west abutment appeared [36]. Additionally, in February 2002, a sizable sinkhole 15 m in depth and about 15 m in width formed just 150 m downstream of the dam toe on the left bank [20]. The presence of brecciated gypsum (GB) (with thicknesses ranging from 8 to 18m) beneath the dam is another feature, introducing additional complexity to the dam foundation [21].
2. Materials and Methods
2.1. Gypsum Rocks and Sampling
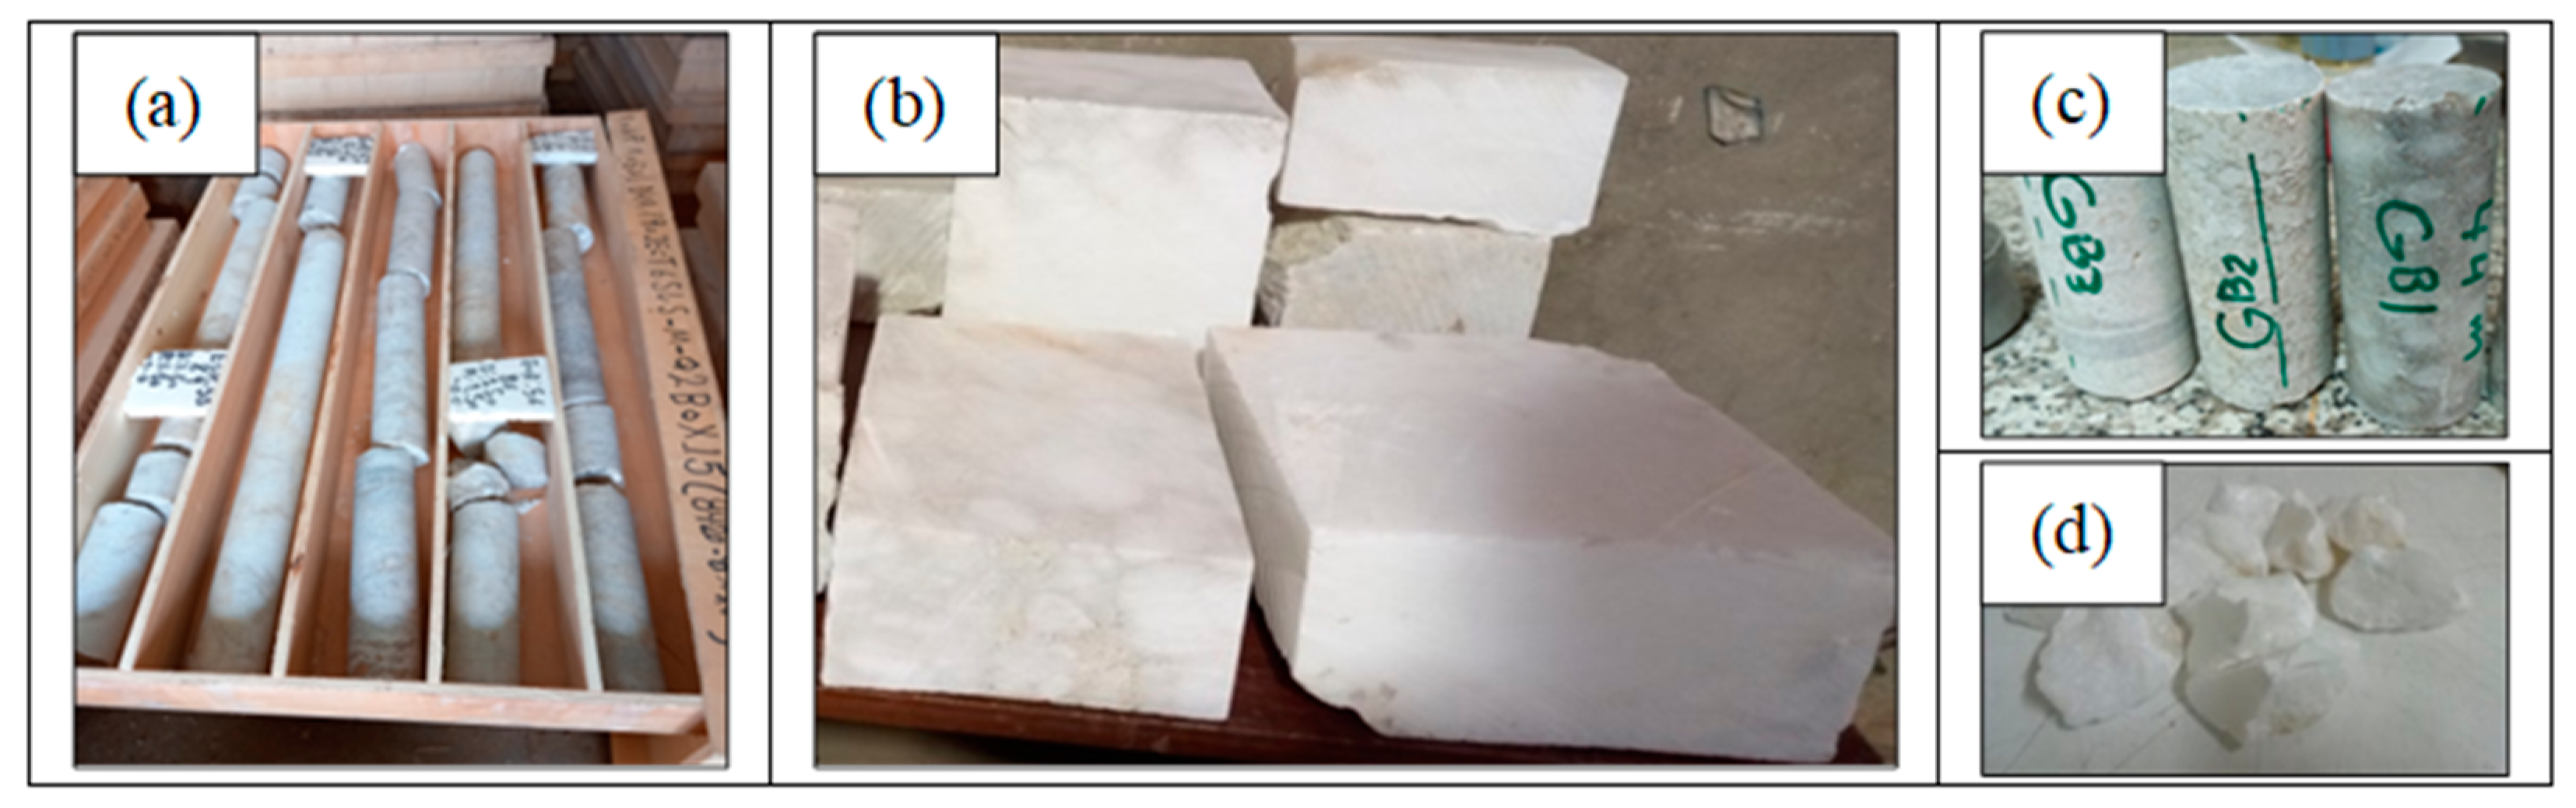
In this study, gypsum samples were taken from the Fatha Formation outcrop and boreholes within problematic layers of the Mosul Dam foundation. Outcrop samples were gathered in large pieces and subsequently sectioned into blocks (with dimensions of length = 25 cm, width = 20 cm, and a variable height ranging between 4 and 6 cm (see Figure 2) to test their solubility under high-velocity water flow simulating surface dissolution in the dam abutments and reservoir. Conversely, the borehole core samples, identified as M1 (from GB1, depth of 44 m), M2 (from GB0, depth of 76 m), M3 (from GB3, depth of 94 m), and M4 (from GB2, depth of 130 m), were obtained from the Mosul Dam Core Samples Conservation Warehouse. The core samples with a diameter of 47 mm exhibited variations in length. The samples were cut to achieve a length-to-diameter ratio of 2.3. These samples were utilized for dissolution test under water pressure, simulating dissolution in the dam foundation. The residual fragments from all samples were then repurposed for chemical composition analyses.
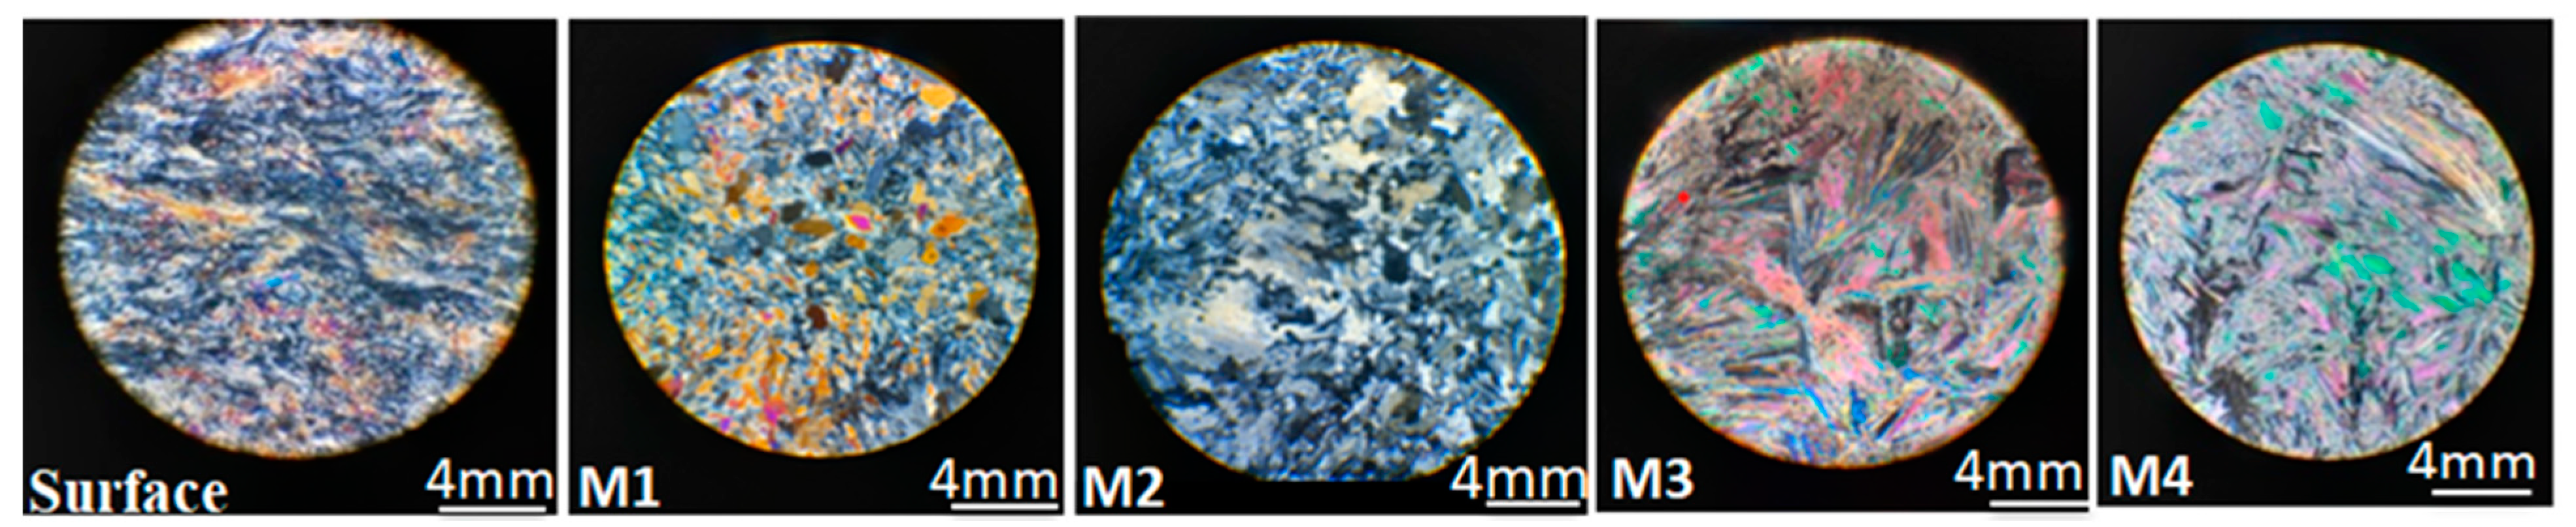
To analyze the petrology of the rock samples, two techniques were employed, involving microscopic study (thin sections) and x-ray diffraction (XRD). Figure 3 depicts the microscopic analysis of the samples using a polarizing microscope. Gypsum and anhydrite were the predominant components of the rock samples, and their distinction was easily discernible by rotating the microscope stage, revealing their differences in birefringence. Anhydrite exhibited a higher birefringence. Additionally, it was observed that the texture of the surface sample was microcrystalline.
Figure 4 illustrates the XRD analysis of the samples. The surface specimens and M2 consist of pure gypsum, whereas the M3 and M4 samples were identified as anhydrite rocks. The M1 sample is composed of a mixture of gypsum and anhydrite.
2.2. Colloidal Silica Grout
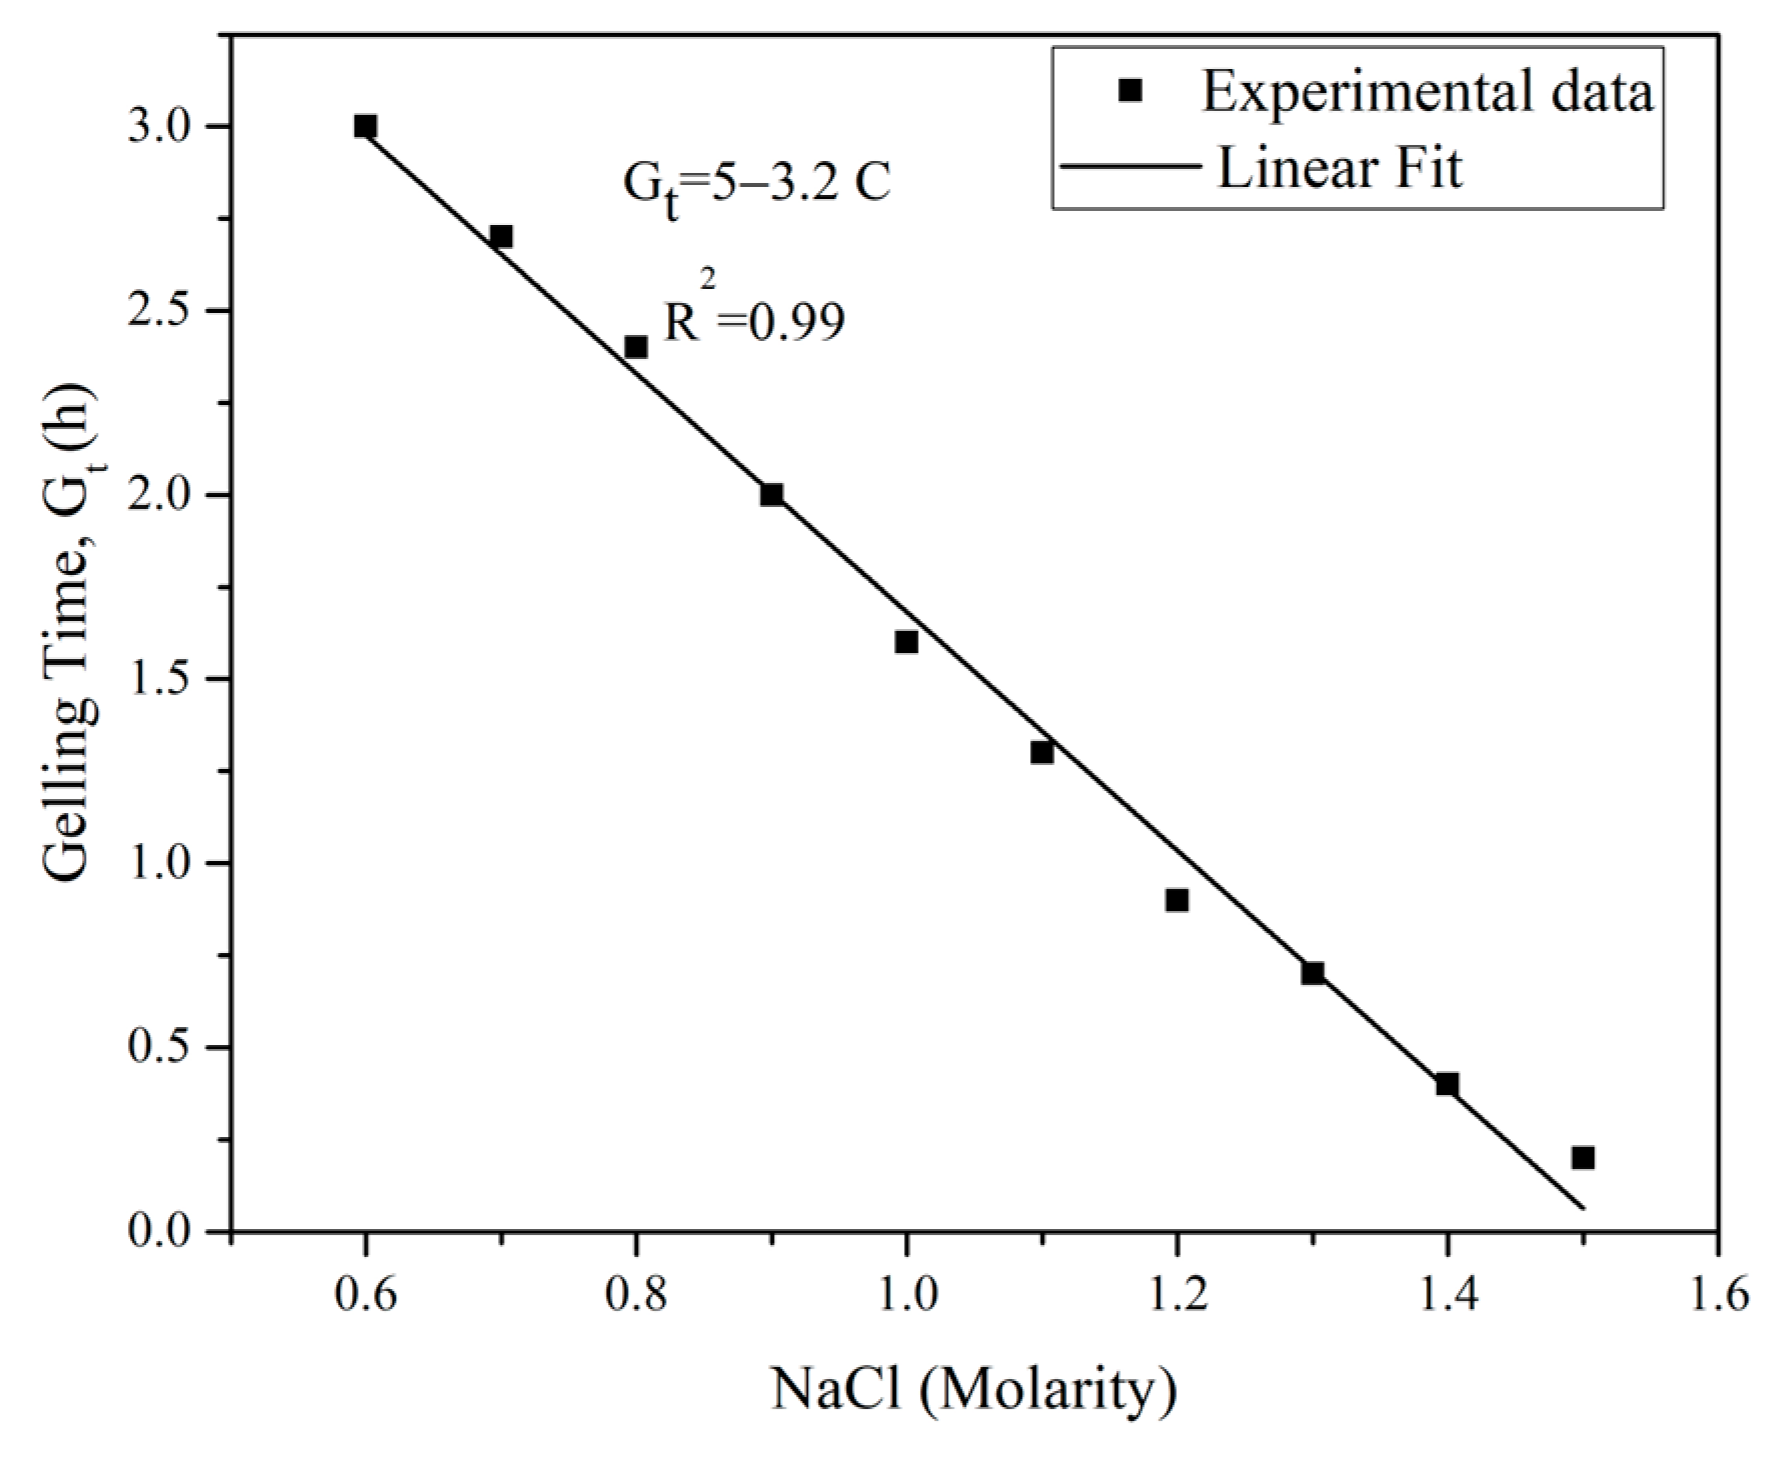
The silica grout utilized in this study consists of two components: (1) colloidal silica suspension with a volume concentration of 38% in distilled water and a pH of 9.5 and (2) NaCl accelerator solution with a molarity of 1.2. This specific molarity was determined through a series of tests aimed at achieving a desired gelling time (Gt) of 50 to 60 min for the colloidal silica grout. These tests involved mixing a constant 5:1 ratio of the silica suspension to the NaCl solution with varying molarities.
Figure 5 illustrates the relationship between the gelling time and the molarity of the NaCl solution. To determine the gelling time of colloidal silica with NaCl, the gel flowability and needle insertion technique proposed by Shen et al. [38] was employed. In this method, the NaCl solution was added to the colloidal silica at 22 °C and the mixture was stirred in an automatic mixer for 3 min. The gelling time was defined as the point at which the grout no longer flowed when tilted and a needle could stand in the gel without any external support.
2.3. Sample Treatment
Figure 6 schematically illustrates the treatment procedure of the samples. In treating the surface samples, only the top surface that was supposed to be in contact with the circulated water during the dissolution test was coated with a 3 mm-thick colloidal silica grout. Subsequently, the treated samples (S-treated) were immersed in distilled water for curing periods of 1, 7, and 21 days.
Each core sample was initially placed at the center of a cylindrical mold with a diameter and height 5 mm larger than those of the rock sample. To obtain a uniform gap between the sample and the mold, a cylindrical mold with an internal diameter of 48 mm and 4 mm thickness (external diameter was 52 mm) was inserted between the sample and the mold and then carefully removed before pouring the silica solution. The silica solution was then poured into the space between the mold wall and the rock sample, covering the sample with a uniform thickness of 2.5 mm. After 50 min, the treated core sample was extracted from the mold and immersed in distilled water for curing periods of 1, 7, and 21 days.
2.4. Velocity-Based Dissolution Test
Figure 7 depicts the main parts of the velocity-based dissolution apparatus, including (1) Plexiglas test cell, 76 cm (length) × 18 cm (width) × 14 cm (height); (2) a pump and its accessories; and (3) a 120-L V-notch overflow tank used for measuring water flow rate.
The Plexiglas container was the test place of the sample. To minimize turbulence in the circulated water, the container inlet and outlet were inclined and perforated plates were placed on both. The container has a Plexiglas cover which is closed through three steel frames. This cover was equipped with two inlet and outlet valves for air bubble removal during the tests. To maintain stable temperatures throughout the test, the pump was separated from the electromotor. There is a perforated plate in the tank that prevents air bubbles during water circulation in the system. In this apparatus, the flow rate was measured using the V-notch method [39].
Regarding the test procedure, firstly, a layer of sand was placed at the base of the vessel to ensure that the sample reached the appropriate level, allowing water to flow over its top surface. The prepared sample was then carefully placed on this sand layer. To guarantee that only the top surface of the sample was exposed to water flow, the sections of the sample in contact with the inner wall of the container were sealed with a 1 cm-thick layer of silica glue. Finally, after covering the container cover, 100 L of water were added to the tank to set up the system for testing.
Using this apparatus, three tests were conducted on the surface samples at 25 °C under three different flow velocities of 0.07, 0.25, and 0.3 m/s. Three other tests were also conducted on the treated samples, with different curing periods of 1, 3, and 7 days, to assess the impact of colloidal silica on controlling the dissolution of gypsum under a flow velocity of 0.3 m/s (the highest flow velocity of the study).
2.5. Pressure-Based Dissolution Test
Figure 8 illustrates the pressure-based dissolution test apparatus, consisting primarily of a Plexiglas cylinder cell with a height of 30 cm and an internal diameter of 11 cm. There are two steel benches at either end of this cylinder cell, interconnected through three steel clamps and screws. Both benches incorporate inlet and outlet ports to enable the circulation of water. Additionally, an air vent was linked to the upper bench to facilitate the removal of air bubbles. Moreover, this cell features a pressure gauge for continuous monitoring of the pressure throughout the test. A pump and a tank with a storage capacity of 250 L were used to circulate water at a pressure of 400 kPa through this cell.
In the tests performed with this device, initially, all outlet and inlet valves were closed, and 100 L of tap water were added to the tank. A 5 cm-thick layer of gravel was then placed at the base of a cylindrical container. Subsequently, a perforated plate was put on the gravel layer. The core sample was then situated upon this plate. To secure the sample and prevent displacement due to water pressure, a grid was installed in the middle of the sample. After that, another perforated plate was placed over the core sample. This was followed by the addition of a final gravel layer of 12 cm thickness. The assembly was completed by securing the cylinder head using clamps and screws. The test started by opening the valves and gradually introducing water under low pressure from the tank into the container through the inlet valve until the container was filled with water. After filling the container and ensuring the absence of any trapped air in it, the pump speed was incrementally increased using an inverter until a pressure of 400 kPa was achieved. This configuration allowed the pump to push water from the tank into the container and subsequently return it to the tank at 25 °C.
Initially, four untreated core samples, labeled as M1, M2, M3, and M4, were tested. Subsequently, the treated samples with the highest solubility (M2) were selected to be treated and then tested.
It is worth mentioning that, during the testing of the samples under both high-velocity water flow and water pressure conditions, water samples were collected at regular intervals to measure the concentration of dissolved gypsum in circulated water. For the untreated sample, titration was used, while ICP was employed for the treated sample.
2.6. Dissolved Gypsum Measurement Methods
In order to measure the concentration of dissolved gypsum in the circulated water, electrical conductivity (EC) was measured using an ATC (automatic temperature compensation) equipped device.
The titration method (specifically, the EDTA titrimetric method proposed by Horvai [40]) was applied to quantify the calcium concentration in the water samples taken during dissolution tests on untreated samples. In this test, 50 mL of sample water was measured using a pipette and transferred into a clean conical flask. Subsequently, 10 mL of a 1 M sodium hydroxide solution was added to the conical flask to achieve a pH of 11–12, followed by the addition of a Eriochrome Black T indicator. The titration was started by introducing the titrant with a 0.01 M solution of ethylenediaminetetraacetic acid (EDTA solution) from the burette into the conical flask containing the sample solution. The reaction between EDTA and calcium ions resulted in a color change of the solution from red to blue, marking the titration endpoint. The volume of EDTA used was then recorded, and the amount of dissolved calcium was calculated using Equation (6). To ensure result accuracy, the procedure was repeated three times, and the average of the findings was considered.
where, E is the EDTA volume (mL) and B is the Molarity of EDTA (0.01).
Inductively coupled plasma (ICP) spectroscopy was also utilized to assess the calcium concentration in the water during dissolution tests on treated samples. This test is the analytical approach employed to measure and identify elements within a sample based on the ionization of elements in the sample.
3. Results and Discussion
3.1. Dissolution Test of the Untreated Samples under Different Water Flow Velocity
Figure 9 shows the variation of gypsum concentration over time for untreated surface samples under different flow velocities (V) and different discharges (Q). It can be seen that the higher flow velocities consistently correlated with increased dissolution rates across all samples. This acceleration in dissolution rate is accompanied by a reduction in the time needed to reach a saturated concentration (Cs), indicating the point at which the water lost its ability to dissolve further CaSO4. Specifically, at a water flow velocity of 0.07 m/s, the equilibrium was achieved after 672 h (h), which decreased to 528 h and 432 h at flow velocities of 0.25 m/s and 0.3 m/s, indicating a 21.5% and 35.7% reduction in saturation time, respectively.
The measured Cs for calcium in all three gypsum samples was approximately 660 mg/L, which is equivalent to nearly 2.8 g of gypsum per liter. This finding aligns with the Cs value of 2.5 g of gypsum per liter in distilled water at 10 °C reported by James and Kirkpatrick [41]. Slight variations in the results may be attributed to experimental temperature fluctuations, water impurities, and titration errors.
Using Equation (5), the dissolution rate coefficient (K) was derived from the relationship and in all three tests of the untreated surface samples, as illustrated in Figure 10a. The correlation of corresponding K values with various flow velocities (V) were then graphically represented in Figure 10b. Notably, the dissolution rate exhibited a significant sensitivity and proportional increase with flow velocity (V) and maintained an average correlation coefficient of approximately 1.00. These findings align consistently with the results reported by James and Lupton [35].
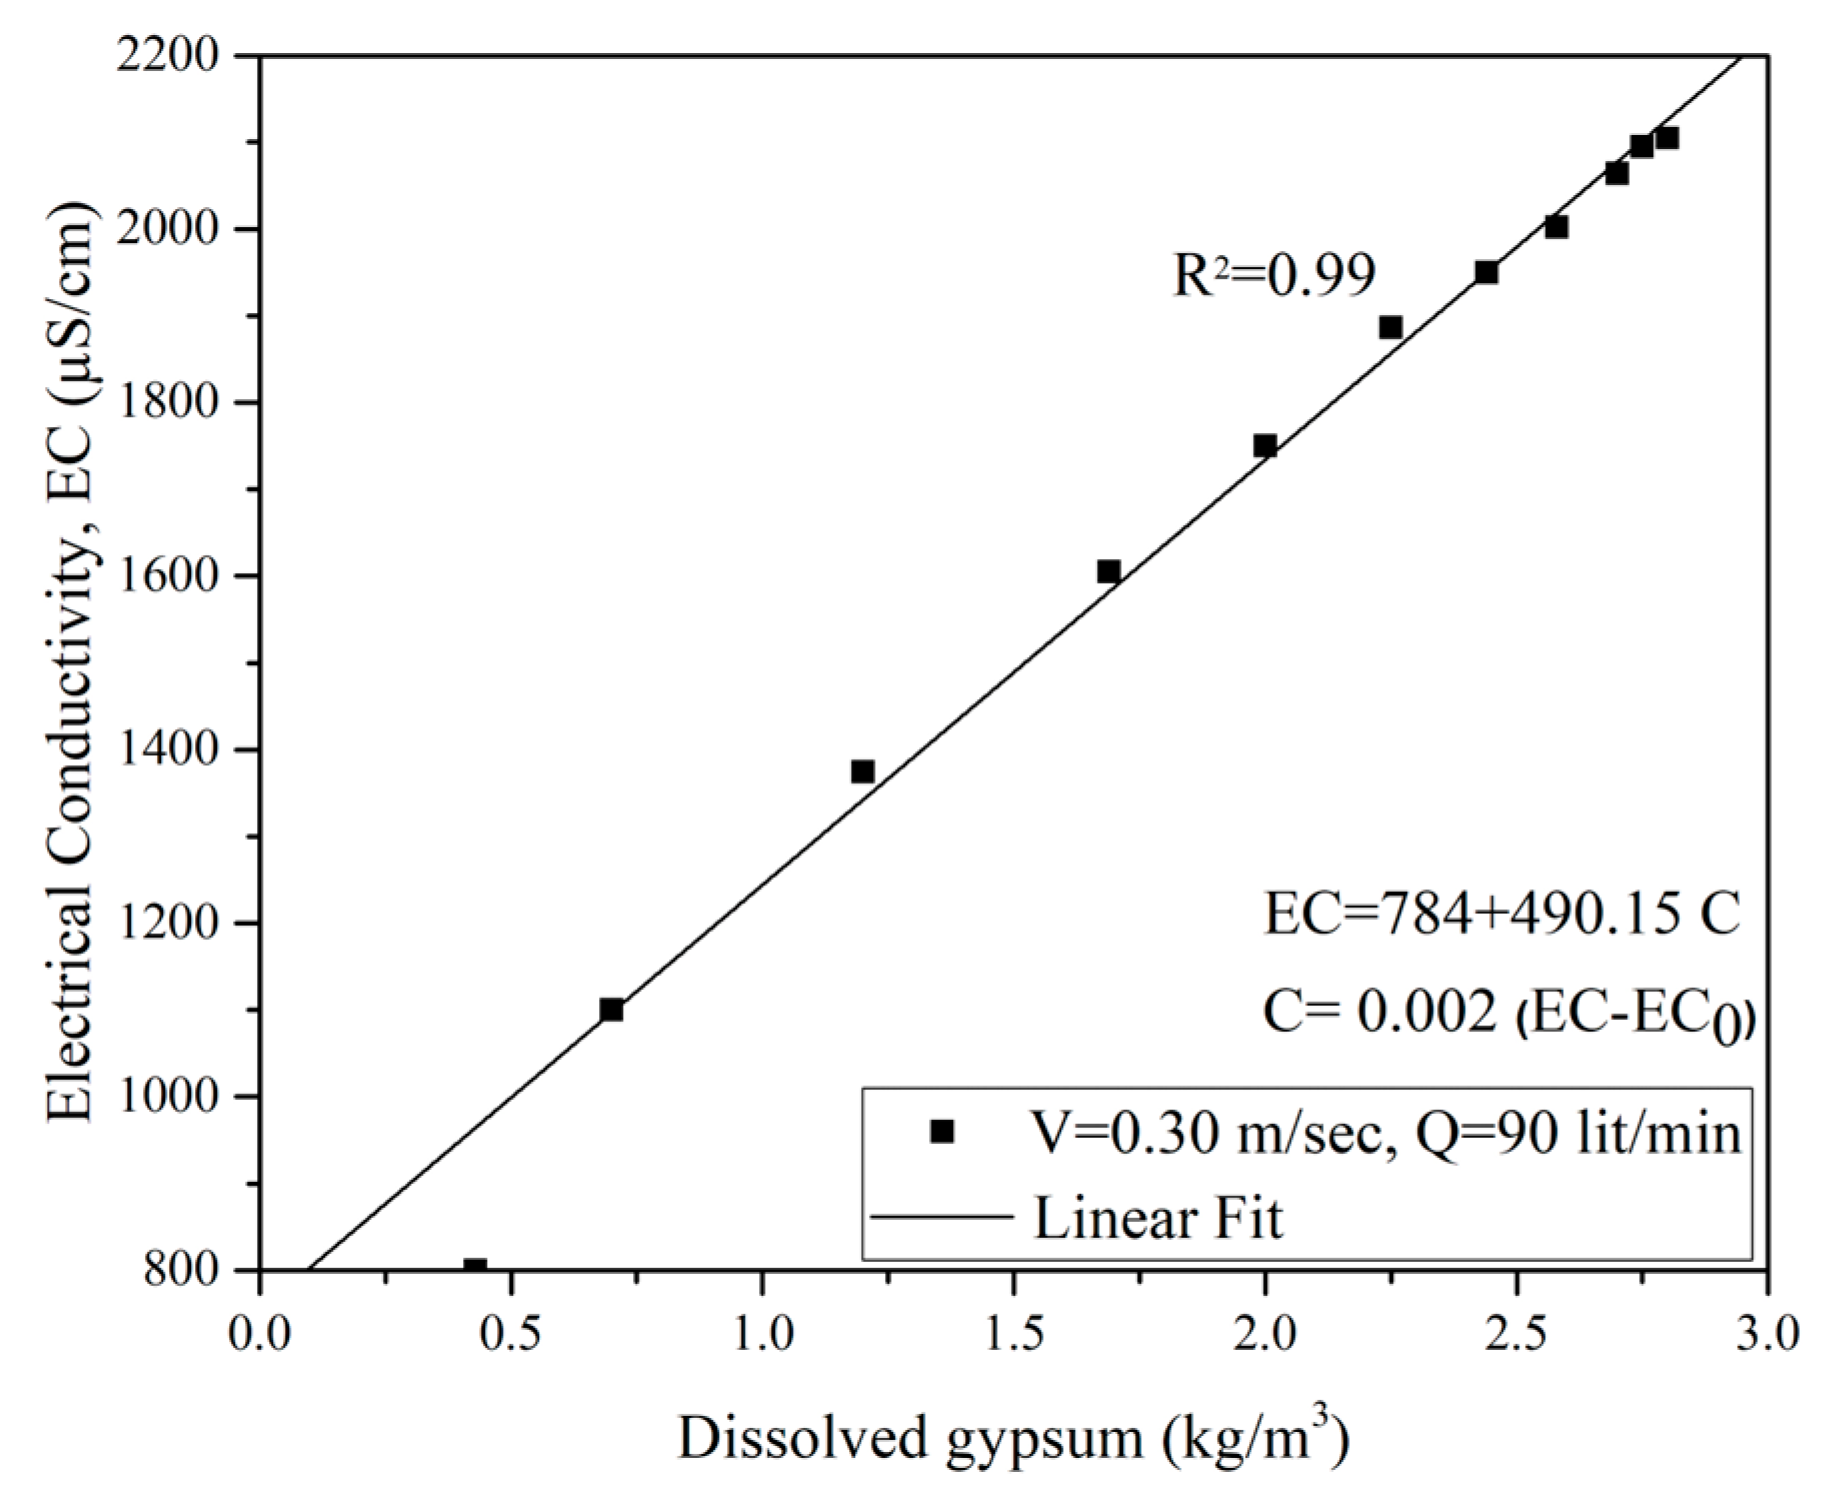
Figure 11 illustrates the relationship between calcium (gypsum) concentration and electrical conductivity for the untreated sample tested under 0.3 m/s water flow. The measured values are in the range of 800 μS/cm to 2150 μS/cm. A slight change in the EC value is attributed to the presence of other ions.
3.2. Dissolution Test of the Untreated Samples under Pressure
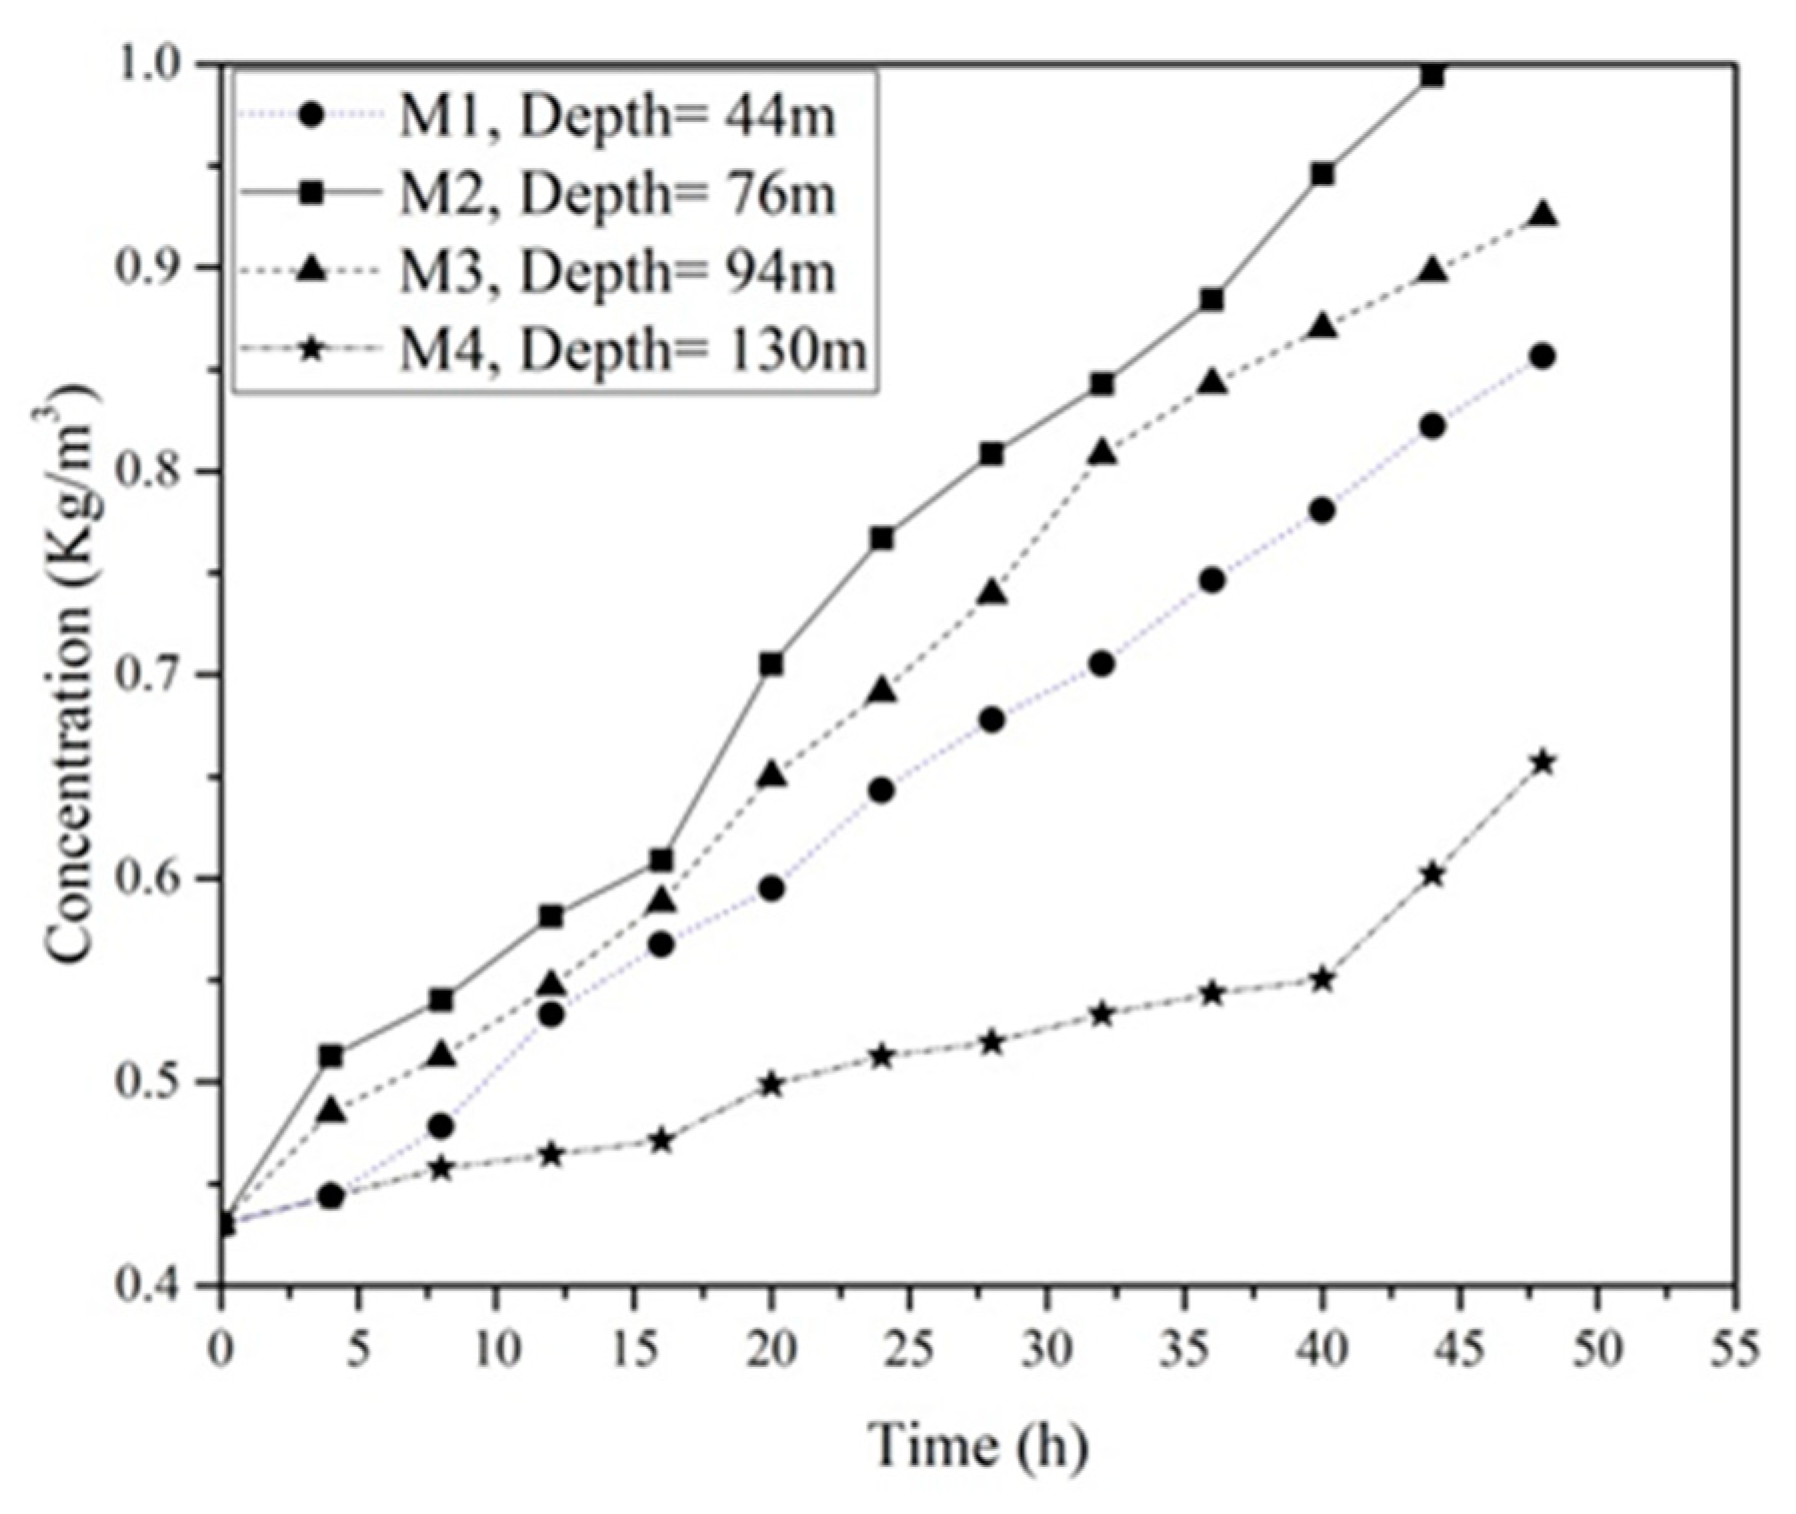
Figure 12 represents the variation of gypsum concentration with time for reference borehole core samples (M1to M4). It can be observed that M2 exhibits the highest dissolution rate, while M4 demonstrates the lowest value of dissolution rate during 48 h of the test. This distinction can be attributed to variations in the chemical composition of the samples.
According to the results of the chemical analysis, M2 is predominantly composed of gypsum, whereas M4 is primarily comprised of anhydride. This finding corresponds with the results of Zanbak and Arthur [42], who reported that, compared to anhydrite, gypsum is more soluble under water pressure.
3.3. Treated Samples Results
Figure 13 shows the effect of colloidal silica gel on the dissolution rate of gypsum rocks with respect to the different curing periods at the highest flow velocity of the study (i.e., V = 0.3 m/s) (Figure 13a) and under 400 kPa water pressure (Figure 13b).
According to Figure 13a, silica-treated samples demonstrate a lower dissolution rate compared to that of untreated samples. Longer curing times correlated with increased silica gel resistance to water flow. Specifically, the untreated sample displayed a dissolution rate of 1.1 g/L after 96 h, whereas silica-treated samples exhibited no dissolution during the same period. Notably, the sample cured for one day (S-1 day) began to dissolve after 96 h, whereas in the 7-day and 21-day cured samples dissolution began after 144 h and 288 h, respectively.
As illustrated in Figure 13b, the silica layer coating the treated samples under water pressure exhibited a role similar to its influence on treated samples exposed to high-velocity water flow. The treated samples with curing times of 1, 7, and 21 days began to dissolve after 48, 96, and 144 h, respectively.
The initial delay in the dissolution rate of the silica-treated samples is attributed to the silica film gradually becoming stronger over time. The initial delay in the dissolution rate of the silica-treated samples can be attributed to the presence of the silica film as a waterproof gradually becoming stronger over time. According to the test results of Burton et al. [43] and Yonekura et al. [44], silica becomes stronger over time, and an increase in silica viscosity due to gel formation is coupled with the strength development.
Additionally, the initial delay in the dissolution rate shows the high adhesion strength between the silica layer and the samples. This impervious film acted as a temporary barrier, delaying direct contact between gypsum and water. However, this protective layer did not entirely prevent gypsum dissolution; rather, it slowed the rate of dissolution and delayed the saturation time.
Table 1 illustrates the time required for the circulating water to reach saturation (TCs) for untreated and treated samples. The TCs values were associated with the concentration of dissolved gypsum reaching 2.8 kg/m3 (saturation) in the circulating water. Under both high-velocity water flow and water pressure, the TCs value increased with the curing time progress of the samples.
When the treated samples were immersed in static water for curing, the thin layer of silica was stable, but when they were subjected to circulating water, the water gradually wore it away due to shear stress. This erosion process continued, disrupting the silica structure and creating intermittent gaps, eventually exposing the samples to water and initiating dissolution. This outcome aligns with the results from the studies by Shen et al. [38] and Axelsson [45].
4. Conclusions
This study undertook a laboratory simulation to assess the efficacy of colloidal silica grout in the water sealing of soluble rocks (gypsum/anhydrite) under high-velocity water flow and water pressure. The rock samples were provided from the Mosul Dam site, which has been suffering progressive dissolution during the last 35 years. In summary, the main findings of this experimental study are as follows:
- The findings highlight the noticeable impact of water pressure and water flow velocity on accelerating the dissolution rate of gypsum samples, concurrently lowering the water-sealing effectiveness of the silica gel to protect the samples from dissolution. This means that this material is useful in preventing the water seepage impact on the soluble rocks and can be applied as a grout in protective measures for shallow foundations.
- The adhesion strength between silica and gypsum rocks and the sealing performance of silica gel showed an upward trend over time, which was related to the simultaneous decrease in the dissolution rate of the treated samples. In essence, this material considerably contributes to the decline in the solubility of soluble rocks as curing time extends.
Author Contributions
Conceptualization, A.A.; methodology, A.A. and M.G.; formal analysis, A.A.; investigation, A.A.; data curation, A.A.; writing—original draft preparation, A.A.; writing—review and editing, A.S., S.M.F. and R.I.; visualization, A.A.; supervision, A.S.; project administration, A.A.; funding acquisition, A.A. All authors have read and agreed to the published version of the manuscript.
Funding
This research received no external funding.
Data Availability Statement
The data generated and used during the current study are available from the corresponding authors by request.
Acknowledgments
The authors gratefully acknowledge Mosul Dam administration for providing the necessary samples for this study.
Conflicts of Interest
The authors declare no competing interests.
References
- Xu, R.; Hu, Y.; Yan, Z.; Zhao, Y.; Li, Z. Experimental investigation on the effect of water saturation on the failure mechanism and acoustic emission characteristics of sandstone. Int. J. Geomech. 2024, 24, 04024102. [Google Scholar] [CrossRef]
- Adamo, N.; Al-Ansari, N.; Laue, J.; Knutsson, S.; Sissakian, V. Risk management concepts in dam safety evaluation: Mosul Dam as a case study. J. Civ. Eng. Archit. 2017, 11, 635–652. [Google Scholar]
- Calaforra, J. Karstologı’a de Yesos; Universidad de Almerı´a,p: Almería, Spain, 1998; Volume 384. [Google Scholar]
- Cooper, A. The GIS approach to evaporite-karst geohazards in Great Britain. Environ. Geol. 2008, 53, 981–992. [Google Scholar] [CrossRef]
- Ford, D.C.; Williams, P.W. Karst Geomorphology and Hydrology; Springer: Berlin/Heidelberg, Germany, 1989. [Google Scholar]
- Jeschke, A.A.; Vosbeck, K.; Dreybrodt, W. Surface controlled dissolution rates of gypsum in aqueous solutions exhibit nonlinear dissolution kinetics. Geochim. Cosmochim. Acta 2001, 65, 27–34. [Google Scholar] [CrossRef]
- Kimchouk, A.B.; Ford, D.C.; Palmer, A.N.; Dreybrodt, W. Speleogenesis Evolution of Karst Aquifers; National Speleological Society: Huntsville, AL, USA, 2000. [Google Scholar]
- White, W.B. Geomorphology and Hydrology of Karst Terrains. 1988. Available online: https://digitalcommons.usf.edu/kip_articles/2160 (accessed on 14 April 2022).
- Warren, J.K. Evaporites: Sediments, Resources and Hydrocarbons; Springer Science & Business Media: Berlin/Heidelberg, Germany, 2006. [Google Scholar] [CrossRef]
- Stawski, T.M.; Van Driessche, A.E.; Ossorio, M.; Diego Rodriguez-Blanco, J.; Besselink, R.; Benning, L.G. Formation of calcium sulfate through the aggregation of sub-3 nanometre primary species. Nat. Commun. 2016, 7, 11177. [Google Scholar] [CrossRef]
- Mancebo Piqueras, J.A.; Sanz Pérez, E.; Menéndez-Pidal, I. Water seepage beneath dams on soluble evaporite deposits: A laboratory and field study (Caspe Dam, Spain). Bull. Eng. Geol. Environ. 2012, 71, 201–213. [Google Scholar] [CrossRef]
- Milanović, P.; Maksimovich, N.; Meshcheriakova, O.; Milanović, P.; Maksimovich, N.; Meshcheriakova, O. Overview of dams and reservoirs in evaporites. In Dams and Reservoirs in Evaporites; Springer: Cham, Switzerland, 2019; pp. 115–157. [Google Scholar]
- Cooper, A.H.; Calow, R. Avoiding gypsum geohazards: Guidance for planning and construction. Br. Geol. Surv. 1998, unpublished. [Google Scholar]
- Milanovic, P. Water Resources Engineering in Karst; CRC Press: Boca Raton, FL, USA, 2004. [Google Scholar]
- Sissakian, V.; Al-Ansari, N.; Knutsson, S. Karstification effect on the stability of Mosul Dam and its assessment, North Iraq. Engineering 2014, 6, 84–92. [Google Scholar] [CrossRef]
- Wheeler, M.; Ackers, J.; Bartlett, J.; Tarrant, F.; Dunlop, C.; Campbell, P. Mosul Dam Assessment, Review of 1984 Dam Break and Flood Wave Study for Mosul Dam, Iraq; Black and Veatch: London, UK, 2004. [Google Scholar]
- Kolay, P.K.; Dhakal, B.; Kumar, S.; Puri, V.K. Effect of liquid acrylic polymer on geotechnical properties of fine-grained soils. Int. J. Geosynth. Ground Eng. 2016, 2, 29. [Google Scholar] [CrossRef]
- Sha, F.; Li, S.; Liu, R.; Li, Z.; Zhang, Q. Experimental study on performance of cement-based grouts admixed with fly ash, bentonite, superplasticizer and water glass. Constr. Build. Mater. 2018, 161, 282–291. [Google Scholar] [CrossRef]
- Adamo, N.; Al-Ansari, N. Mosul dam the full story: Engineering problems. J. Earth Sci. Geotech. Eng. 2016, 6, 213–244. [Google Scholar]
- Sögaard, C.; Funehag, J.; Abbas, Z. Silica sol as grouting material: A physio-chemical analysis. Nano Converg. 2018, 5, 6. [Google Scholar] [CrossRef] [PubMed]
- Al-Ansari, N.; Adamo, N.; Knutsson, S.; Laue, J.; Sissakian, V. Mosul dam: Is it the most dangerous dam in the world? Geotech. Geol. Eng. 2020, 38, 5179–5199. [Google Scholar] [CrossRef]
- Sissakian, V.K.; Adamo, N.; Al-Ansari, N. The role of geological investigations for dam siting: Mosul Dam a Case Study. Geotech. Geol. Eng. 2020, 38, 2085–2096. [Google Scholar] [CrossRef]
- Li, L.; Li, S.; Zhang, Q.; Cui, J.; Xu, Z.; Li, Z. Experimental study of a new polymer grouting material. Chin. J. Rock Mech. Eng 2010, 29, 3150–3156. [Google Scholar]
- Funehag, J.; Gustafson, G. Design of grouting with silica sol in hard rock–New design criteria tested in the field, Part II. Tunn. Undergr. Space Technol. 2008, 23, 9–17. [Google Scholar] [CrossRef]
- Bodi, J.; Bodi, Z.; Scucka, J.; Martinec, P. Polyurethane grouting technologies. Polyurethane 2012, 1, 307–336. [Google Scholar] [CrossRef]
- Whang, J.; Rumer, R.; Mitchell, J. Chemical-based barrier materials. Assess. Barrier Contain. Technol. Environ. Remediat. Appl. 1995, 9, 211–247. [Google Scholar]
- Agapoulaki, G.; Papadimitriou, A. Rheological Properties of Colloidal Silica as a Means for Designing Passive Stabilization of Liquefiable Soils. 2015. Available online: http://hdl.handle.net/11615/70294 (accessed on 2 May 2023).
- Funehag, J.; Gustafson, G. Design of grouting with silica sol in hard rock–New methods for calculation of penetration length, Part I. Tunn. Undergr. Space Technol. 2008, 23, 1–8. [Google Scholar] [CrossRef]
- Fattah, M.Y.; Al-Ani, M.M.; Al-Lamy, M.T. Studying collapse potential of gypseous soil treated by grouting. Soils Found. 2014, 54, 396–404. [Google Scholar] [CrossRef]
- Al-Ridha, S.; Abbood, A.A.; Hussein, H.H. Improvement of gypsum properties using SF additive. Int. J. Sci. Res. 2015, 6, 504–509. [Google Scholar]
- Nikolaev, A.; Foregina, E. Protective Effect of Films on Gypsum; Izd. Akad. Nauk SSSR: Moscow, Russia, 1944. (In Russian) [Google Scholar]
- Li, J.; Duan, Z. A thermodynamic model for the prediction of phase equilibria and speciation in the H2O–CO2–NaCl–CaCO3–CaSO4 system from 0 to 250 C, 1 to 1000 bar with NaCl concentrations up to halite saturation. Geochim. Cosmochim. Acta 2011, 75, 4351–4376. [Google Scholar] [CrossRef]
- Klimchouk, A. The dissolution and conversion of gypsum and anhydrite. Int. J. Speleol. 1996, 25, 2. [Google Scholar] [CrossRef]
- James, A.; Lupton, A. Gypsum and anhydrite in foundations of hydraulic structures. Geotechnique 1978, 28, 249–272. [Google Scholar] [CrossRef]
- James, A.N. Soluble Materials in Civil Engineering; Ellis Horwood: New York, NY, USA, 1992; p. 73. [Google Scholar]
- Wakeley, L.D.; Kelley, J.R.; Pearson, M.L. Geologic Conceptual Model of Mosul Dam. 2007. Available online: https://digitalcommons.usf.edu/kip_articles/2295 (accessed on 5 July 2021).
- Adamo, N.; Al-Ansari, N.; Sissakian, V.; Laue, J.; Knutsson, S. Mosul Dam: Geology and safety concerns. J. Civ. Eng. Archit. 2019, 13, 151–177. [Google Scholar]
- Shen, P.; Hankins, N.; Jefferis, S. Selection of colloidal silica grouts with respect to gelling and erosion behaviour. Geosciences 2017, 7, 6. [Google Scholar] [CrossRef]
- Bos, M.G. Discharge Measurement Structures; Ilri: Addis Ababa, Ethiopia, 1976. [Google Scholar]
- Horvai, G.; Gary, D. Christian, Purnendu (Sandy) Dasgupta and Kevin Schug: Analytical Chemistry; Springer: Berlin/Heidelberg, Germany, 2014. [Google Scholar]
- James, A.; Kirkpatrick, I. Design of foundations of dams containing soluble rocks and soils. Q. J. Eng. Geol. Hydrogeol. 1980, 13, 189–198. [Google Scholar] [CrossRef]
- Zanbak, C.; Arthur, R.C. Geochemical and engineering aspects of anhydrite/gypsum phase transitions. Bull. Assoc. Eng. Geol. 1986, 23, 419–433. [Google Scholar] [CrossRef]
- Yonekura, R.; Kaga, M. Current chemical grout engineering in Japan. In Grouting, Soil Improvement and Geosynthetics; ASCE: Reston, VA, USA, 1992; pp. 725–736. [Google Scholar]
- Butrón, C.; Axelsson, M.; Gustafson, G. Silica sol for rock grouting: Laboratory testing of strength, fracture behaviour and hydraulic conductivity. Tunn. Undergr. Space Technol. 2009, 24, 603–607. [Google Scholar] [CrossRef]
- Axelsson, M. Mechanical tests on a new non-cementitious grout, silica sol: A laboratory study of the material characteristics. Tunn. Undergr. Space Technol. 2006, 21, 554–560. [Google Scholar] [CrossRef]
Figure 1.
Schematic of typical representation of the geometry and geological setting of the Mosul Dam and its foundation.
Figure 1.
Schematic of typical representation of the geometry and geological setting of the Mosul Dam and its foundation.

Figure 2.
Gypsum rocks and samples: (a) core samples taken from boreholes, (b) blocks of surface rocks, (c) core samples for testing, and (d) residual fragments.
Figure 2.
Gypsum rocks and samples: (a) core samples taken from boreholes, (b) blocks of surface rocks, (c) core samples for testing, and (d) residual fragments.

Figure 3.
Thin section images of the samples under polarizing microscope.

Figure 4.
XRD pattern of gypsum samples: (a) surface sample and (b) core samples.

Figure 5.
Relationship between gelling time of colloidal silica grout and NaCl molarity.

Figure 6.
Schematic illustration of the treatment procedure of the samples.

Figure 7.
Schematic illustration of velocity-based dissolution test apparatus.

Figure 8.
Pressure-based dissolution test apparatus: (a) image, and (b) schematic illustration. Note: (1) pressure gauge, (2) air vent, (3) screw, (4) top steal bench, (5) clamp, (6) Plexiglas cylinder, (7) rock sample, (8) grid, (9) lower gravel layer, (10) bottom steal bench, (11) outlet valve, (12) inlet pipe, (13) gravel layer, and (14) perforated plate.

Figure 9.
Concentration variation of gypsum in water over time for different flow velocities in velocity-based dissolution tests on the untreated samples.
Figure 9.
Concentration variation of gypsum in water over time for different flow velocities in velocity-based dissolution tests on the untreated samples.

Figure 10.
(a) Determination of the dissolution rate coefficient (k) of surface gypsum rock samples with different water flow velocity, (b) Relationship between (k) and water flow velocity.
Figure 10.
(a) Determination of the dissolution rate coefficient (k) of surface gypsum rock samples with different water flow velocity, (b) Relationship between (k) and water flow velocity.

Figure 11.
Variation of EC with gypsum concentration for flow velocity of 0.3 m/s.

Figure 12.
Dissolution test for untreated borehole core samples under constant pressure of 400 kPa.

Figure 13.
Effect of colloidal silica on the gypsum solubility (a) under 0.3 m/sec flow water rate, (b) under 400 kPa pressure.
Figure 13.
Effect of colloidal silica on the gypsum solubility (a) under 0.3 m/sec flow water rate, (b) under 400 kPa pressure.


Table 1.
Saturation time (TCs) of untreated and treated samples.
| Samples | TCs (h) Velocity-Base | TCs (h) Pressure-Base |
|---|---|---|
| untreated | 528 | 480 |
| 1 day | 816 | 480 |
| 7 days | 1104 | 960 |
| 21 days | 1632 | 1536 |
Disclaimer/Publisher’s Note: The statements, opinions and data contained in all publications are solely those of the individual author(s) and contributor(s) and not of MDPI and/or the editor(s). MDPI and/or the editor(s) disclaim responsibility for any injury to people or property resulting from any ideas, methods, instructions or products referred to in the content. |
© 2024 by the authors. Licensee MDPI, Basel, Switzerland. This article is an open access article distributed under the terms and conditions of the Creative Commons Attribution (CC BY) license (https://creativecommons.org/licenses/by/4.0/).
Share and Cite
MDPI and ACS Style
Aziz, A.; Soroush, A.; Fattahi, S.M.; Imam, R.; Ghahremani, M. Prevention of Water Seepage Impact on the Soluble Rocks Using Colloidal Silica. Water 2024, 16, 1211. https://0-doi-org.brum.beds.ac.uk/10.3390/w16091211
AMA Style
Aziz A, Soroush A, Fattahi SM, Imam R, Ghahremani M. Prevention of Water Seepage Impact on the Soluble Rocks Using Colloidal Silica. Water. 2024; 16(9):1211. https://0-doi-org.brum.beds.ac.uk/10.3390/w16091211
Chicago/Turabian StyleAziz, Aram, Abbas Soroush, Seyed Mohammad Fattahi, Reza Imam, and Mehrdad Ghahremani. 2024. "Prevention of Water Seepage Impact on the Soluble Rocks Using Colloidal Silica" Water 16, no. 9: 1211. https://0-doi-org.brum.beds.ac.uk/10.3390/w16091211
Note that from the first issue of 2016, this journal uses article numbers instead of page numbers. See further details here.