Article

Relationship of the “Dequada” Phenomenon with Mercury Methylation in Pantanal, Brazil

by
Glaucia A. Nunes
1,
Dayana D. Ramos
2,
Juliane C. Forti
3,
Diovany D. Ramos
4,
Lincoln C. S. Oliveira
1,
David S. S. Junior
3,
Gabriel E. Santo
3 and
Felipe A. Santos
1,3,*
1
Chemistry Institute, Federal University of Mato Grosso Sul, University City, Av. Costa e Silva, Campo Grande 79070-900, MS, Brazil
2
School High Paulista, Campus of Tupã, R. Mandaguaris, Tupã 17600-050, SP, Brazil
3
School of Science and Engineering, Campus of Tupã, São Paulo State University (UNESP), R. Domingos da Costa Lopes 780, Tupã 17602-496, SP, Brazil
4
School of Education, Federal University of Mato Grosso Sul, University City, Av. Costa e Silva, Campo Grande 79070-900, MS, Brazil
*
Author to whom correspondence should be addressed.
Submission received: 9 February 2024 / Revised: 5 April 2024 / Accepted: 8 April 2024 / Published: 24 April 2024

Abstract

:
The illegal activity of gold mining in the Brazilian Pantanal is contaminating the aquatic ecosystem with mercury. This contamination has been potentiated by mercury methylation due to a typical natural phenomenon of the Pantanal ecosystem known as “dequada”. The present study estimated in the laboratory the temporal production of methylmercury at two timepoints: the beginning of a flood, when the “dequada” phenomenon occurs, and the dry season without such phenomenon. After collecting water and sediment, experiments were performed with microcosms to reproduce conditions close to nature. To monitor the concentration of methylmercury, 1.0 mg L−1 of Hg2+ was added to water and sediment experiments in the Castelo and Saracura bays, both during the “dequada” and without it; monitoring lasted for 25 days. The methylmercury concentration was analyzed using atomic fluorescence spectrometry, total organic carbon using TOC 5000A, and physical and chemical parameters such as pH, redox potential, and dissolved oxygen with a multi-parameter probe. The results led to the conclusion that the “dequada” phenomenon significantly affected mercury methylation, because the environmental changes caused by this phenomenon such as the increased concentration of organic matter, decreased dissolved oxygen, and decreased pH, potentiated mercury methylation. During the “dequada” in the Castelo bay, the methylation rate was 3.5 times higher (6297.56 ng L−1) than in the experiment without the “dequada” (1827.44 ng L−1). Therefore, the gold mining activity in Pantanal can cause great damage to the ecosystem because this environment favors mercury methylation, making its most toxic form active in the aquatic ecosystem of Pantanal.

Graphical Abstract

1. Introduction

Pantanal is located in the midwest region of Brazil and is one of the largest swampy areas in the world, with approximately 150,000 km2 of swamp. It is supplied by approximately 90 rivers along its four-thousand-kilometer border and is divided into upper, middle, and lower Pantanal [1,2,3]. One of the main characteristics of these rivers is that, during the flood season, they form natural dams, contributing to flow decrease and system modification from lotic to lentic, with the formation of chemical, physical, and biological longitudinal gradients [1,3]. This change in the system occurs during rain periods that flood the Pantanal soil and submerge large amounts of decomposing organic matter.
Hence, during the flood period, an annual phenomenon occurs, called “dequada”. According to Calheiros and Ferreira (1996), the ‘dequada’ is a natural phenomenon in the flooded plains, characterized by the deterioration of water quality, and it occurs due to the biological decomposition of the large mass of organic matter submerged at the beginning of the flooding process. All the oxygen dissolved in water is consumed and free carbon dioxide is released, thus causing the death of fish. The intensity of this phenomenon depends on the characteristics of flood pulse and the previous drought and the subsequent flood period (volume and speed) [4,5,6].
Besides the deterioration of water quality, this phenomenon may make the characteristics of the aquatic environment favorable for mercury methylation, the presence of which in Pantanal is attributed to the gold mining activity in the Bento Gomes and Cuiabá Rivers [7]. These two rivers are tributaries of the Paraguay River, which is the largest river in the Pantanal watercourse; thus, this activity may be contaminating the entire Pantanal region with mercury.
The mercury methylation process, meaning the conversion of inorganic mercury into organic mercury, occurs preferably in aquatic environments with low oxygen concentration, acidic pH, and availability of labile organic matter. It occurs in backwater areas, marginal lakes, and artificial reservoirs due to the formation of critical microenvironments [7]. This transformation can occur through chemical and biological processes. The chemical process can occur in three main ways: (1) through the transmethylation of other methylated metal compounds; (2) due to ultraviolet radiation in the presence of these or other organic compound donors of the methyl group; and (3) through reacting with humic and fulvic acids [8,9]. The biological process can be mediated by microorganisms such as sulfate-reducing bacteria, which are responsible for a significant portion of the methylmercury produced [8,10,11], methanogenic and iron reducers [11,12], and peripheral bacteria [11].
Methylmercury (MeHg) is one of the main organic compounds formed from mercury. This substance can be biomagnified along the food chain, meaning that the concentration in living organisms increases as it travels through the food chain [8,13]. This is concerning because the organic form of MeHg is the most toxic for organisms.
Considering the above, the presence of this metal in Pantanal requires a more in-depth investigation because, besides the environmental impact, it can also affect humans, especially the riverside population of the region to whom fish are the main protein source. Therefore, this study aimed to estimate in the laboratory the temporal production of methylmercury at two timepoints: the beginning of a flood, when the “dequada” phenomenon occurs, and during the drought, without this phenomenon. Water and sediment samples were collected from two bays, which are strategic areas located in the Brazilian Pantanal.

2. Materials and Methods

2.1. Sampling Sites

The Paraguay River is 2695 km long; its watercourse runs from the state of Mato Grosso (Brazil) and passes through the countries of Paraguay and Bolivia to the state of Mato Grosso do Sul (Brazil). It is a tributary of the Paraná River in Argentina. Besides its tributaries, there are several lakes and bays connected to the Paraguay River, which depending on the flood pulse can significantly change the physical, chemical, and biological characteristics of the river, such as increasing or decreasing the transparency of river water, its hydrogen potential, electrical conductivity, the concentration of dissolved gases, among other elements [1]. Another specific characteristic of the Pantanal bays that negatively affects the Paraguay River is the “dequada” phenomenon, which occurs only in wetlands. Besides increasing the concentration of organic matter, thus decreasing the concentration of oxygen available in the water, this phenomenon can also potentiate mercury methylation in the aquatic system of Pantanal [5,6,8,14].
To study the mercury methylation potential in the aquatic ecosystem of Pantanal, water and sediment samples were collected in the Castelo and Saracura bays, as illustrated in Figure 1.
The Castelo bay is located in middle Pantanal and has an extension of 128 km2. It is one of the largest bays after the Cuiabá and Bento Gomes Rivers drain into the Paraguay River [15]. The Saracura bay is located in Lower Pantanal, 55 km from Corumbá/MS, and it is smaller than the Castelo bay, with an extension of approximately 35 km2. The two bays are characterized by a dry winter and rainy summer, the vegetation around them is a mixture of savanna and forest, and they are colonized by semi-aquatic plants during the flood season.

2.2. Collection and Preparation of Sediment and Water Samples

Water and sediment samples were collected at two different times of the year: during the “dequada” (flood period) and not during the “dequada” (drought period). First, surface water samples were collected at each site, which is described in Table 1. Two liters of water were collected at approximately 30 cm from the surface, directly in PET bottles that were previously decontaminated in the laboratory and acclimated three consecutive times with the water from the sampling sites. After the collection, the samples were cooled to 4 °C and maintained in polystyrene boxes until they arrived at the laboratory and stored in the refrigerator until further analyses and experiments.
The sediment samples were collected at the same water sampling sites, aided by a dredge (Ekman–Birge grab), stored in plastic containers, and maintained below 4 °C until use.

2.3. Physical and Chemical Parameters

At the collection site and in the microcosm experiments, a properly calibrated YSI600QS (YSI Incorporated, Yellow Springs, OH, USA) multi-parameter probe was used to acquire the physical and chemical parameters, pH, conductivity (μS cm−1), redox potential (EH mV), dissolved oxygen (DO mg L−1), and temperature (T °C).

2.4. Microcosm Assemblies for the Study of Mercury Methylation Potential

The experiments performed in the laboratory to reproduce the conditions found in nature are called microcosms. Therefore, to reproduce the aquatic environments of the Castelo and Saracura bays, the samples were mixed in the laboratory, forming only one sample composed of both bays, for better representation of the environment, as described by Gomes et al. (2019) and Rosas et al. (2016) [16,17]. The sample consisting of water and sediment from sites P1, P2, and P3 was called BC1 for the Castelo bay microcosm referred to the collection made during the “dequada”, and BC2 referred to the collection at the same sites during the drought or without the “dequada”. The sample composed of sites P6, P7, and P8 for the Saracura bay microcosms collected during the “dequada” was called BS1, and BS2 at the same sites for the collection during the drought or without the “dequada”.
The tests for the analysis of mercury methylation in the microcosms were performed following studies described by Gomes et al. (2019) and Bisinoti et al. (2006) [16,18]. In previously decomposed glass containers, sediment and water samples from the bays studied were added in a ratio of 1.0 Kg of sediment to 5.4 L of water, resulting in four microcosms: two with water and sediment from the Castelo bay at different times (BC1 and BC2) and two with water and sediment from the Saracura bay at different times (BS1 and BS2). After percolation, the initial values of pH, dissolved oxygen, redox potential, and MeHg of each experiment were measured. Subsequently, 1.0 mg L−1 of Hg2+ (Sigma-Aldrich, Taufkirchen, Germany) was added. These parameters were monitored for 25 days, and the results were evaluated to determine the methylation potential of Hg from the data obtained.

2.5. Determination of Total Hg

The total mercury in water samples was determined with the Brooks Rand Model III (Brooks Rand Instuments, Seattle, WA, USA) equipment, which is cold-vapor atomic fluorescence spectrometry (CVAFS). The samples were prepared with the total mercury standard methodology (EPA 1631) to reduce all mercury to Hg0 [18].
The total mercury in solid samples was determined with an automatic analyzer for the direct determination of mercury using thermal decomposition and amalgamation in a gold column—the SMS 100 Solid Mercury Analysis Systems by Perkin Elmer (PerkinElmer, Waltham, MA, USA) [19].

2.6. Determination of Methylmercury

Methylmercury was determined with the atomic fluorescence spectrometer (AFS)—MERX Total Mercury and Methylmercury Analyzer Systems (Brooks Rand Instruments, Seattle, WA, USA). The system has an extraction column (where amalgamation occurs), timer (programmed cooling (2 min) and heating (45 s)), and an analytical column. The procedure used was adapted from Hintelmann et al. (1997) and Bloom (1990) [20,21].

2.7. Determination of Total Organic Carbon

Total organic carbon (TOC) in the water samples was determined with 30 mL glass vials and polyethylene caps, which were previously washed with deionized water and dried at 100 °C in an oven. The TOC was determined on a TOC-V analyzer from Shimadzu model TOC-V CPN (Shimadzu Corporation, Hong Kong; Kyoto, Japan)based on catalytic oxidation at high temperatures and the determination of CO2 using infrared spectroscopy. For quantification, the samples were injected and loaded in an ultra-pure synthetic airflow into a combustion tube containing platinum and alumina, where CO2 is oxidized. The concentrations were obtained with analytical curves made previously [22,23].

3. Results and Discussion

3.1. Results of Two Physical and Chemical Parameters without Water Samples

As described, the physical and chemical parameters of the water samples were measured at each site and at different times (during the “dequada” and without the “dequada”). The results obtained, presented in Table 2, are discussed based on the resolution of the Brazilian Environmental Council (CONAMA) 357/2005.
The temperature parameter varied approximately between 26.18 °C and 26.38 °C (samples from the first collection) and 23.00 °C and 25.34 °C (samples from the second collection), with no significant differences between the two samples. The pH in both periods varied between 5.0 and 6.2, and it was classified as acidic, highlighting that acidity increases the solubility and transport of metals, thus facilitating the risk of environmental pollution. The pH parameter is affected by temperature, which in turn affects the mobility and precipitation of metals [8,24].
The dissolved oxygen (DO) values in the first collection ranged between 0.72 mg L−1 and 1.49 mg L−1, and, in the second collection, the values ranged between 5.15 mg L−1 and 7.50 mg L−1. According to the literature, the results of the first collection are consistent, as the low DO values are directly related to the “dequada” phenomenon, which increases the concentration of organic matter in the water, and its decomposition consumes high concentrations of DO. For the second collection, the values are relevant to the CONAMA resolution 357/2005 because to maintain the biota, the DO values must be greater than 5.0 mg L−1. The redox potential (EH) varied between 22.00 mV and 79.50 mV. According to Bisinoti and Jardim (2004), the maximum mercury methylation in sediment occurs in the EH range from +100 mV to + 200 mV and conductivity measured between 54 μS cm−1 and 177 μS cm−1, indicating the presence of ionic species soluble in an aqueous medium [8].
These values show that during the “dequada”, the physical and chemical parameters may be more conducive to mercury methylation in the aquatic environment. However, these isolated parameters do not regulate the formation of MeHg.

3.2. Results of Total Hg in Water and Sediment Samples

The concentrations of total mercury (Hg Total) in surface water and sediment samples at each sampling site were made in triplicate. Table 3 shows that in the water samples, only site P1 during the “dequada” obtained a total Hg concentration above the equipment quantification limit (<1.94 ng L−1), with a concentration of 6.78 ng L−1. The other sites, in both the first and the second collections, had concentrations below the equipment quantification limit.
According to a resolution in force in Brazil (CONAMA n° 357/2005), the maximum standard of total Hg in river waters is 2000 ng L−1. Comparing the total Hg results of this study with the United States Environmental Protection Agency (EPA), which estimates permitted values of total Hg concentrations of up to 20 ng L−1 to preserve aquatic life, the quantified values are within the acceptable range.
Regarding sediment samples, Table 3 shows that the concentrations of total Hg varied from 7.81 to 65.08 ng g−1 among the sampling sites. When comparing the first collection (during the “dequada”) with the second collection (drought period) at the two bays studied—Castelo (P1, P2, P3) and Saracura (P6, P7, P8)—here is a significant difference in mercury concentrations, and all sites in the “dequada” period showed higher concentrations than during the drought. According to Miranda et al. (2007), flooding cycles can have major influences on the Hg cycle, one of which is high precipitation, considering that rain drives all atmospheric mercury to the soil, flowing to rivers, lakes, and stalls [11].
The measures in force in Brazil which guide the minimum procedures to be put in place to evaluate the materials allowed in water recommend concentration values of total Hg of 170 ng g−1, (level I: threshold below which adverse effects are less likely on the biota) and 486 ng g−1 (level II: threshold above which adverse effects are more likely on the biota). Considering the dredged material, the limit value mentioned in level I (170 ng g−1) was used as a reference; thus, all sites were within the acceptable range. However, according to Stein et al. (1996), contaminated sediment is a potential dynamic source of mercury for the aquatic ecosystem from 10 to 100 years [25]. This means that the considerable amounts of mercury absorbed in the sediment can be transferred and/or incorporated into the aquatic biota, depending on the physical, chemical, and biological conditions of the water. Therefore, even low levels of this element must be monitored to prevent risks to the aquatic biota of Pantanal.

3.3. Methylation Study in Microcosm Experiments Assembled with Sediment and Water from the Castelo Bay

The methylation potential experiments in the Castelo bay were performed in two microcosms, as described in the methodology: BC1 and BC2.
Figure 2 shows the results of the mercury methylation potential in microcosms BC1 and BC2. These experiments were analyzed for 25 days.
In the microcosms of the Castelo bay (BC1 and BC2), to which 1 mg L−1 of Hg2+ standard was added, the formation of MeHg was observed. In the BC1 experiment, the maximum MeHg production rate was 6297.56 ng L−1 and occurred in the third hour of the experiment. For the BC2 experiment, the maximum production rate of 1827.44 ng L−1 was obtained, and it occurred in the third hour of the experiment. The methylation rate decreased over the days in both experiments. According to a study by Gomes et al. (2019), methylation is accentuated in the first days or weeks of Hg entry in the biological compartment, and then, the concentration tends to come to equilibrium or show a cyclic pattern, as observed in Figure 2 for experiments BC1 and BC2 [16].
According to Yan and Yong (2013), physical and chemical factors and chemical interactions with organic and inorganic complexes affect the availability of mercury for methylation [26]. Therefore, during the course of the experiments, the physical and chemical parameters of water and total organic carbon were analyzed (TOC). Figure 3 shows these results.
Figure 3 shows that both experiments obtained an acidic pH at the beginning of the experiment and gradually increased until the end of the experiment, varying from 5.30 to 8.24 in experiment BC1 and from 5.38 to 7.53 in experiment BC2. Xun et al. (1987) said that lower pH values can provide a higher concentration of Hg2+ and that mercury (II) can effectively cross the bacterium cell membrane, allowing a greater formation of methylmercury [27]. Figure 3 also shows lower values of BC1 (pH = 5.30) and BC2 (pH = 5.38) on the first day of the experiment, the results of which may have favored Hg methylation at the beginning of the experiment, as seen in Figure 2. However, the organisms responsible for Hg methylation preferably come from environments with a high concentration of organic material and are favored by acidic waters rich in dissolved organic carbon [8,26,28].
Regarding TOC values, the BC1 microcosm showed a higher TOC concentration than BC2, ranging from 33.70 mg L−1 to 666.00 mg L−1 in the BC1 experiment and from 7.75 mg L−1 to 33.97 mg L−1 in the BC2 experiment. According to Bisinoti (2006), TOC values vary with seasonality, and the flood period provides a significant supply of organic matter, which is recent and labile [18]. This may be the reason for the greater production of MeHg in the BC1 experiment, as the samples were collected during the “dequada”. However, even with a low concentration of TOC in the BC2 microcosm, it was sufficient to methylate ± 6.4% of the added Hg2+, which suggests that other factors contributed to methylation, such as the action of microorganisms.
The temperature varied between 21.80 °C and 29.99 °C for BC1 and 21.63 °C and 26.76 °C for BC2, and these values do not represent an orderly beginning and end. The temperature affects methylation and microbial activity. Some studies show higher methylation in the summer, with higher temperatures [29,30]. The average conductivity was 175.8 μS cm−1 for BC1 and 179 μS cm−1 for BC2, over 25 days. Ionic compounds are conductors of electricity, whether solubilized in an aqueous, liquid, or pure medium. The ions allow mobility in the solution and can be easily attracted to the electrode.
The redox potential (EH) corresponds to the tendency of a chemical species to reduce and the signs of the quantified values will depend on the direction in which the reaction occurs in the reference electrode. Positive potentials indicate that the electrode received electrons, and negative potentials mean that the electrode donated electrons. The EH values show that the BC1 samples have an EH variation between −236.7 mV and +129.0 mV, while BC2 varies between −54.0 mV and +234.2 mV, and both experiments presented values above +100 mV on the first day. According to Bisioli and Jardim (2004), the maximum methylation in sediment occurs in the EH range from +100 to +200 mV, with MeHg being more stable in neutral to acidic conditions and dimethyl Hg in basic conditions [8].
Regarding the concentration of DO, the presence or absence of oxygen also affects the methylation process. Although the process occurs in both oxic and anoxic conditions, according to Bisinoti and Jardim (2004), mercury methylation is favorable in the absence of oxygen [8]. Observing Figure 3 BC1 and Figure 2 BC1, it is possible to verify that mercury methylation occurs in the first 5 h of the experiment, where the DO was at low concentrations. These results corroborate the literature.
The results of Figure 2 and Figure 3 showed that a potential influence on Hg methylation was the “dequada” phenomenon. This is a natural phenomenon that occurs annually in Pantanal and relates to the decomposition of organic matter, changing its color, odor, pH, conductivity, and nutrients. This decomposition process occurs at the beginning of the flood season and, depending on previous drought, it can be intense, causing bacteria to consume all DO in the water and release it in the form of CO2 [5,6].
This phenomenon promotes a large amount of organic matter in the environment and, according to studies in the literature, this environment provides methylation by microorganisms [8,30]. This behavior was evident in the present study when evaluating the Hg methylation rate during the “dequada” and without the “dequada”. During the “dequada” (BC1), the rate is 3.5 times higher (6297.56 ng L−1) than in the BC2 experiment (1827.44 ng L−1), which was performed without the “dequada”.

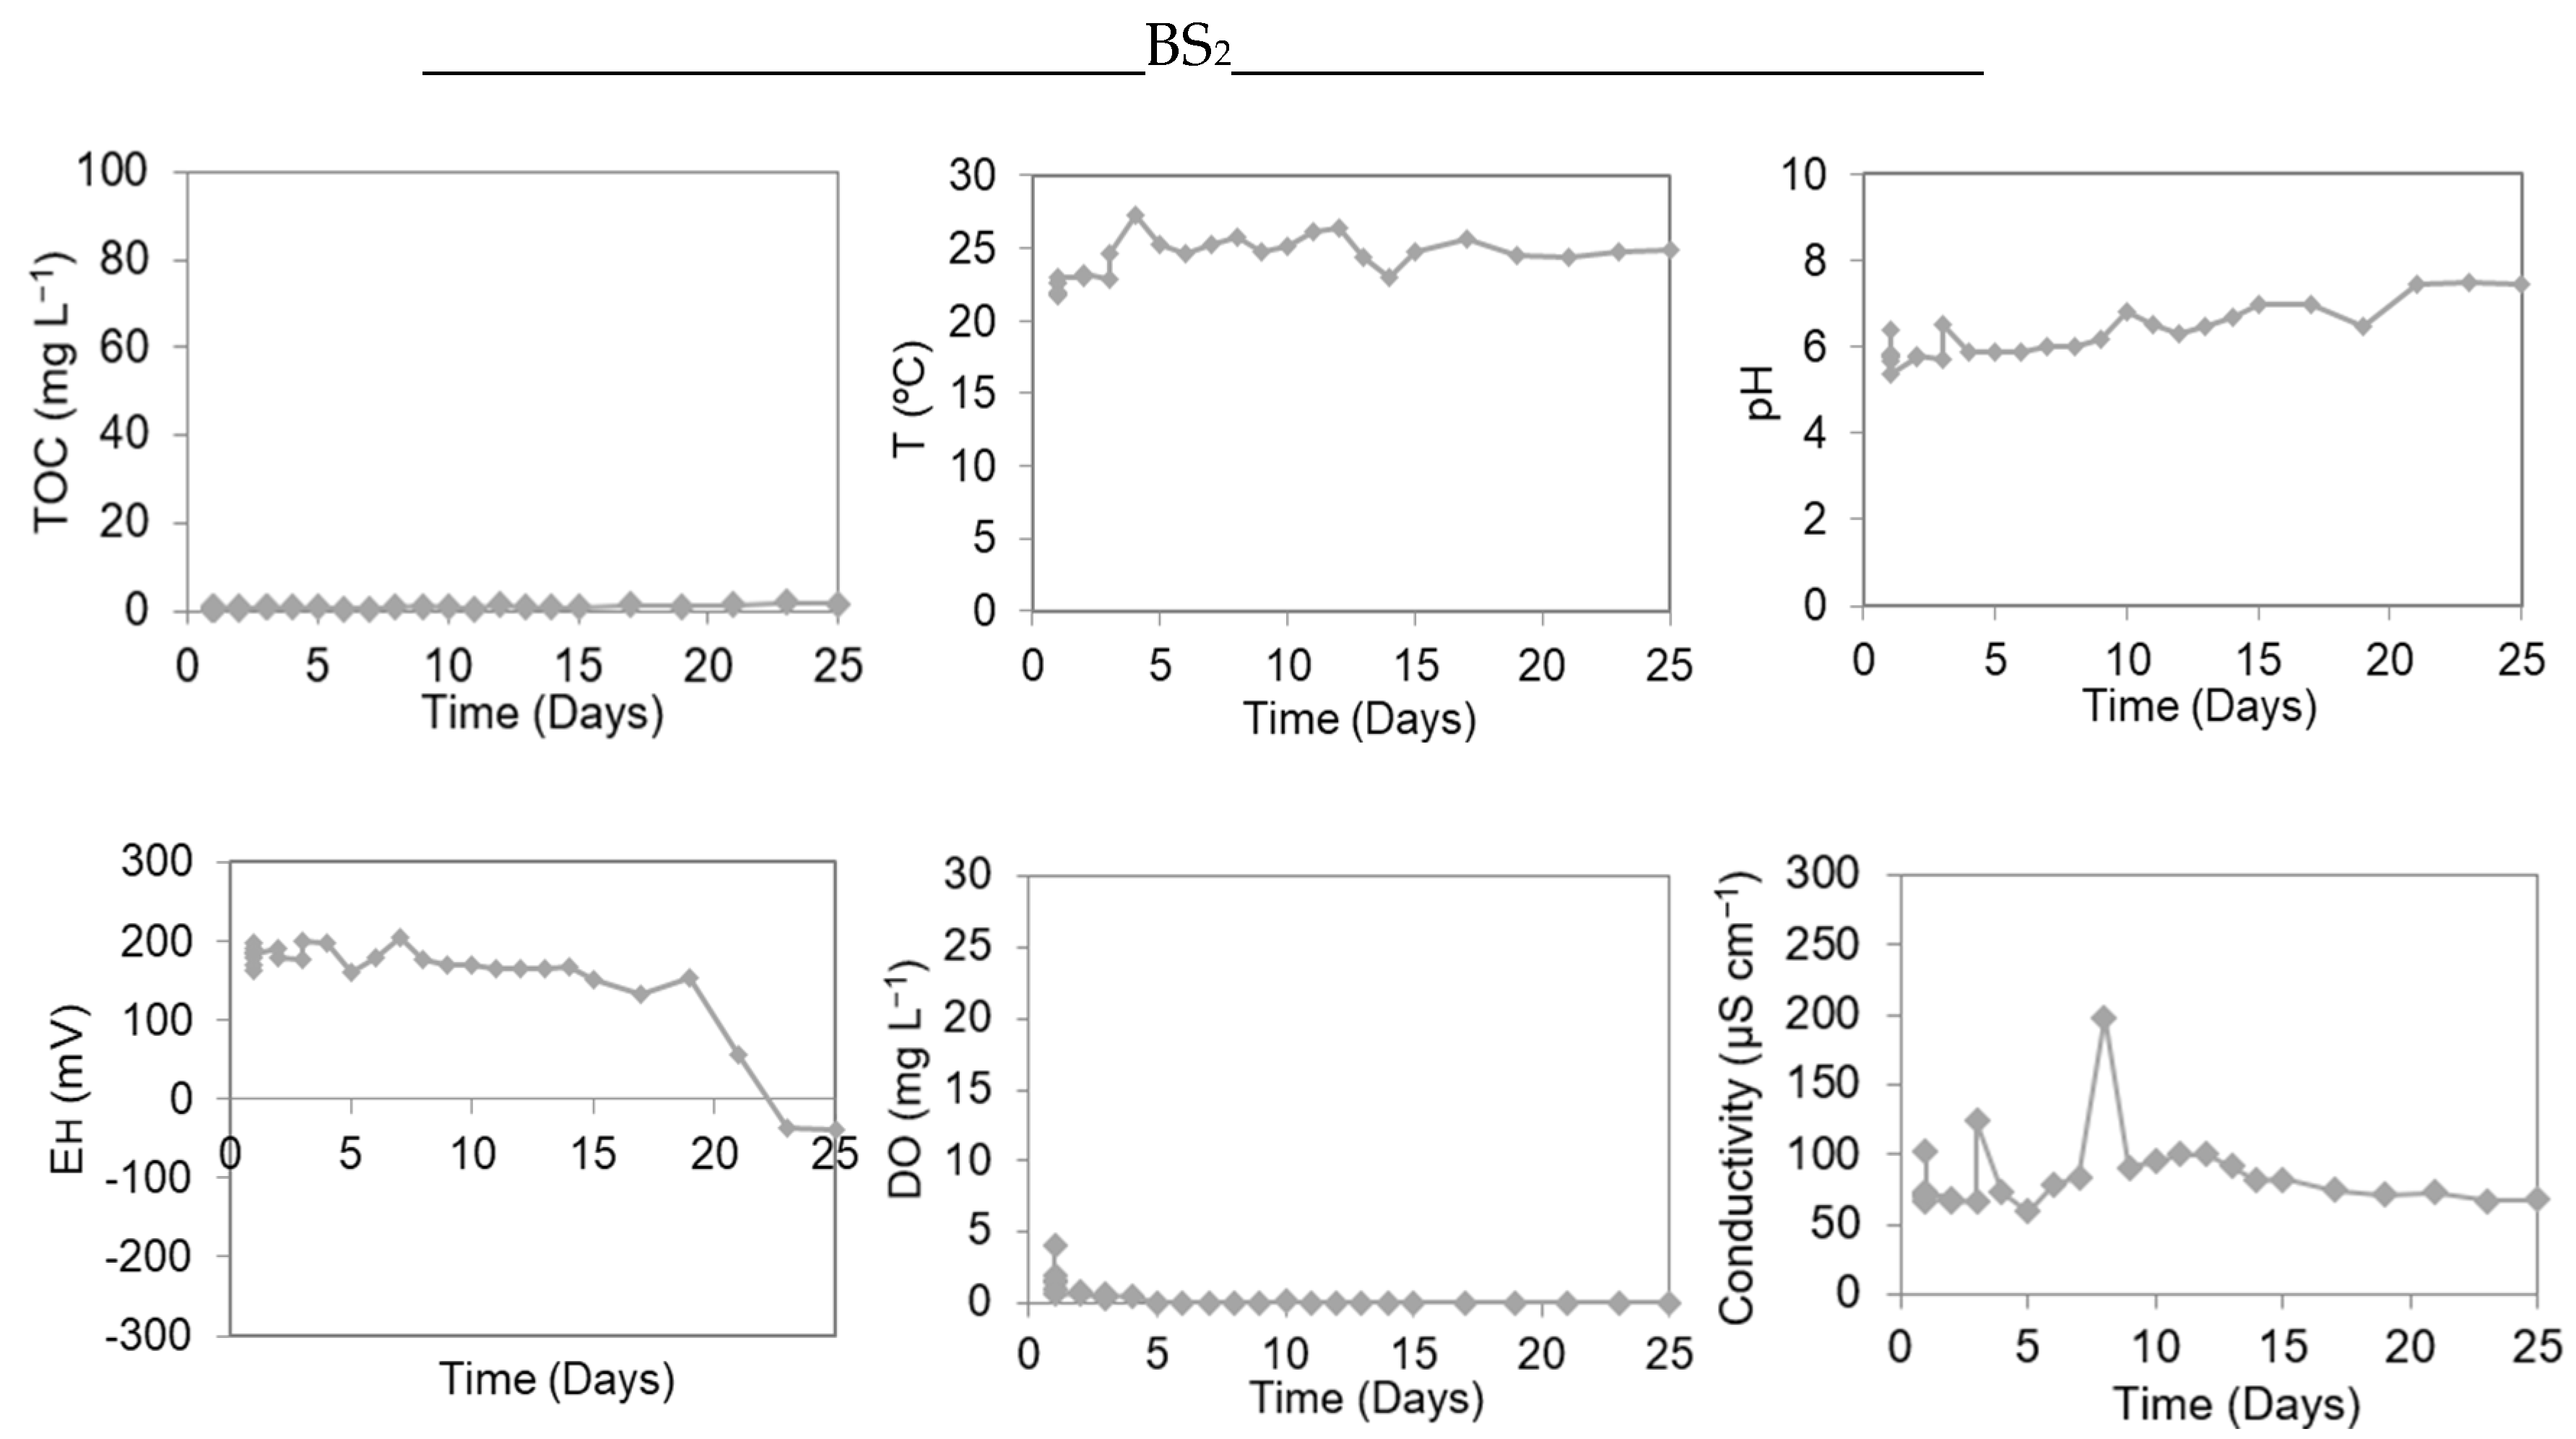
3.4. Methylation Study in Microcosm Experiments Assembled with Sediment and Water from the Saracura Bay

The methylation potential experiments in the Saracura bay were performed in two microcosms, as described in the methodology: BS1 and BS2. Figure 4 shows the results of mercury methylation potential in microcosms BS1 and BS2, and these experiments were analyzed for 25 days.
Similar to the previous experiment, 1 mg L−1 of Hg2+ standard was added to each microcosm, and MeHg formation was observed. In the first experiment (BS1), the maximum MeHg production rate was 12.68 ng L−1 and occurred in the first two hours of the experiment. In the second experiment (BS2), the maximum MeHg was 106.03 ng L−1 and occurred in the first two hours. Around the third hour, both experiments had a pH below 6 at the time of methylation, as shown in Figure 5.
Analyzing the results of Figure 5, it should be noted that, at the time of methylation, both BS1 and BS2 experiments showed pH values ranging from 5.0 to 5.5. As discussed previously, acidic pH in a favorable environment can favor the Hg methylation process. Studies show that only the acidic pH cannot regulate the formation of MeHg and, depending on the environment, Hg2+ bonds with free sulfide may occur, decreasing Hg methylation [8,28,29].
The temperature varied between 21.55 °C and 28.59 °C for the BS1 experiment and between 21.96 °C and 27.24 °C for the BS2 experiment, and these values do not represent an orderly start and end. A study by Wright and Hamilton (1982) shows that the MeHg concentration was 50 to 70% higher in experiments with a temperature at 20° rather than at 4° [31]. At the maximum point of both experiments, conductivity was quantified in 192 μS cm−1 (experiment BS1) and 198 μS cm−1 (experiment BS2). Moreover, the greater the mobility of ions, the greater the presence of metallic Hg (Hg0) in the middle, and the lower the production of MeHg.
The EH values in the BS1 experiment varied between −98.7 mV and 135.9 mV, while for BS2, they varied between −40.1 mV and 203.2 mV. According to studies, demethylation is greater with high EH values [29,32]. This experiment presented values for the point of greater methylation of 110.3 mV (experiment BS1) and 159.4 mV (experiment BS2) and, according to Bisinoti and Jardim (2004), Hg methylation occurs in EH values between +100 and +200 mV [8].
Mercury methylation is favorable in environments with low concentrations and DO. The maximum concentration of DO was determined to be 9.38 mg L−1 (BS1) and 4.12 mg L−1 (BS2).
Although some factors favored mercury methylation, the BS1 and BS2 experiments in the Saracura bay were not significant. The maximum methylation point of the BS1 experiment methylated ± 0.012% of the added Hg2+, and the BS2 experiment methylated ± 0.1% of the added Hg2+. Studies show that mercury methylation in water and sediment is proportional to the concentration of organic carbon, as it can increase methylation by stimulating the activity of heterotrophic microorganisms [8,28,32].
Figure 5 shows TOC values between 7.01 mg L−1 and 42.55 mg L−1 (BS1) and between 0.45 mg L−1 and 1.81 mg L−1 (BS2), which were considered low when compared to the experiments of the Castelo bay. This may be due to the small size of the Saracura bay—approximately 35 km2—which makes the “dequada” phenomenon occur more mildly or not at all. This was shown in the TOC results of the BS1 experiment, confirming that organic carbon is essential to provide methylation by heterotrophic microorganisms [8].

4. Conclusions

The results presented in the study of mercury methylation potential in Pantanal due to the interaction of water, sediment, and excess mercury showed that organic matter plays an important role in making excess methyl groups react with inorganic Hg and form MeHg. The “dequada” phenomenon increases the concentration of organic matter in the water, thus leaving the environment with an acidic pH and a low concentration of available oxygen. It also enhances mercury methylation in Pantanal, with a methylation rate 3.5 times higher than in other periods. Therefore, the gold mining activity in Pantanal can cause great damage to the ecosystem, considering that this environment can favor mercury methylation and produce its most toxic active form.

Author Contributions

Conceptualization, G.A.N., J.C.F., D.D.R. (Diovany Doffinger Ramos) and L.C.S.O.; Methodology, G.A.N., D.D.R. (Dayana D. Ramos) and D.S.S.J.; Software, D.D.R. (Dayana D. Ramos), D.D.R. (Diovany Doffinger Ramos) and D.S.S.J.; Data curation, D.D.R. (Dayana D. Ramos), J.C.F. and G.E.S.; Writing—original draft, J.C.F. and G.E.S.; Writing—review & editing, L.C.S.O. and F.A.S.; Visualization, L.C.S.O.; Supervision, F.A.S.; Project administration, F.A.S.; Funding acquisition, F.A.S. All authors have read and agreed to the published version of the manuscript.

Funding

This work was supported by the São Paulo Research Foundation—FAPESP [grant numbers: 2018/18693-6] and Support Foundation for the Development of Education, Science and Technology of the State of Mato Grosso do Sul—FUNDECT.

Data Availability Statement

The raw data supporting the conclusions of this article will be made available by the authors on request.

Conflicts of Interest

The authors declare that they have no conflicts of interest.

References

  1. Hamilton, S.K.; Sippel, S.J.; Melack, J.M. Comparison of inundation patterns among major South American floodplains. J. Geophys. Res. Atmos. 2002, 107, LBA 5-1–LBA 5-14. [Google Scholar] [CrossRef]
  2. Lázaro, W.L.; Guimarães, J.R.D.; Ignácio, A.R.; Da Silva, C.J.; Díez, S. Cyanobacteria enhance methylmercury production: A hypothesis tested in the periphyton of two lakes in the Pantanal floodplain, Brazil. Sci. Total. Environ. 2013, 457, 231–238. [Google Scholar] [CrossRef] [PubMed]
  3. Schleder, A.; Froehner, S.; Sanez, J.; Parron, L.; Hansel, F.; Guerreiro, R.L.; Bahniuk, A. Insights into the organic matter composition of soda lakes in the Pantanal, Brazil, through fatty acids analysis in sediments. Environ. Sci. Pollut. Res. 2023, 30, 103932–103946. [Google Scholar] [CrossRef] [PubMed]
  4. Calheiros, D.; Seidl, A.; Ferreira, C. Participatory research methods in environmental science: Local and scientific knowledge of a limnological phenomenon in the Pantanal wetland of Brazil. J. Appl. Ecol. 2000, 37, 684–696. [Google Scholar] [CrossRef]
  5. Stevaux, J.C.; Macedo, H.d.A.; Assine, M.L.; Silva, A. Changing fluvial styles and backwater flooding along the Upper Paraguay River plains in the Brazilian Pantanal wetland. Geomorphology 2019, 350, 106906. [Google Scholar] [CrossRef]
  6. Calheiros, D.F.; Ferreira, C.J.A. Alterações Limnológicas no rio Paraguai (“Dequada”) e o Fenômeno Natural de Mortandade de Peixes no Pantanal Mato-Grossense–Corumbá/MS. EMBRAPA-CPAP. 1996, pp. 48–51. Available online: https://www.embrapa.br/en/busca-de-publicacoes/-/publicacao/792189/alteracoes-limnologicas-no-rio-paraguai-dequada-e-o-fenomeno-natural-de-mortandade-de-peixes-no-pantanal-mato-grossense---ms (accessed on 8 February 2024).
  7. Coringa, J.D.E.S.; Pezza, L.; Coringa, E.d.A.O.; Weber, O.L.d.S. Distribuição geoquímica e biodisponibilidade de metais traço em sedimentos no Rio Bento Gomes, Poconé—MT, Brasil. Acta Amaz. 2016, 46, 161–174. [Google Scholar] [CrossRef]
  8. Bisinoti, M.C.; Jardim, W.F. O comportamento do metilmercúrio (metilHg) no ambiente. Quimica Nova 2004, 27, 593–600. [Google Scholar] [CrossRef]
  9. Schwieger, A.-C.; Gebauer, K.; Ohle, A.; Beckmann, M. Determination of mercury binding forms in humic substances of lignite. Fuel 2020, 274, 117800. [Google Scholar] [CrossRef]
  10. Jiang, P.; Liu, G.; Cui, W.; Cai, Y. Geochemical modeling of mercury speciation in surface water and implications on mercury cycling in the everglades wetland. Sci. Total. Environ. 2018, 640, 454–465. [Google Scholar] [CrossRef]
  11. Miranda, M.R.; Coelho-Souza, S.A.; Guimarães, J.R.D.; Correia, R.R.S.; Oliveira, D. Mercúrioemsistemas aquáticos: Fatores ambientais que afetam a metilação. Oecologia Bras. 2007, 11, 240–251. [Google Scholar] [CrossRef]
  12. Hamelin, S.; Amyot, M.; Barkay, T.; Wang, Y.; Planas, D. Methanogens: Principal methylators of mercury in lake periphyton. Environ. Sci. Technol. 2011, 45, 7693–7700. [Google Scholar] [CrossRef] [PubMed]
  13. Wu, P.; Zakem, E.J.; Dutkiewicz, S.; Zhang, Y. Biomagnification of methylmercury in a marine plankton ecosystem. Environ. Sci. Technol. 2020, 54, 5446–5455. [Google Scholar] [CrossRef] [PubMed]
  14. Nogueira, F.; Silva, E.C.E.; Junk, W. Mercury from gold minings in the Pantanal of Pocone (Mato Grosso, Brazil). Int. J. Environ. Health Res. 1997, 7, 181–192. [Google Scholar] [CrossRef]
  15. Calheiros, D.F. Influência do Pulso de Inundação na Composição Isotópica (d13c e d15n) das Fontes Primárias de Energia na Planície de Inundação do rio Paraguai (Pantanal/MS); University Paulista: São Paulo, Brazil, 2004; pp. 30–35. [Google Scholar] [CrossRef]
  16. Gomes, V.M.; dos Santos, A.; Zara, L.F.; Ramos, D.D.; Forti, J.C.; Ramos, D.D.; Santos, F.A. Study on Mercury Methylation in the Amazonian Rivers in Flooded Areas for Hydroelectric Use. Water Air Soil Pollut. 2019, 230, 211. [Google Scholar] [CrossRef]
  17. Rozas, O.; Vidal, C.; Baeza, C.; Jardim, W.F.; Rossner, A.; Mansilla, H.D. Organic micropollutants (OMPs) in natural waters: Oxidation by UV/H2O2 treatment and toxicity assessment. Water Res. 2016, 98, 109–118. [Google Scholar] [CrossRef] [PubMed]
  18. Bisinoti, M.C.; Jardim, W.F.; Júnior, J.L.B.; Malm, O.; Guimarães, J.R. Um novo método para quantificar mercúrio orgânico (Hg orgânico) empregando a espectrometria de fluorescência atômica do vapor frio. Quimica Nova 2006, 29, 1169–1174. [Google Scholar] [CrossRef]
  19. Santos, F.A.; Cavecci, B.; Vieira, J.C.S.; Franzini, V.P.; Santos, A.; Leite, A.d.L.; Buzalaf, M.A.R.; Zara, L.F.; Padilha, P.d.M. A Metalloproteomics study on the association of Mercury with breast milk in samples from lactating women in the Amazon region of Brazil. Arch. Environ. Contam. Toxicol. 2015, 69, 223–229. [Google Scholar] [CrossRef] [PubMed]
  20. Hintelmann, H.; Falter, R.; Ilgen, G.; Evans, R.D. Determination of artifactual formation of monomethylmercury (CH 3 Hg + ) in environmental samples using stable Hg2+ isotopes with ICP-MS detection: Calculation of contents applying species specific isotope addition. Fresenius J. Anal. Chem. 1997, 358, 363–370. [Google Scholar] [CrossRef]
  21. Effler, S.W.; Bloom, N.S. Seasonal variability in the mercury speciation of Onondaga Lake (New York). Water Air Soil Pollut. 1990, 53, 251–260. [Google Scholar] [CrossRef]
  22. Wang, J.; Zhu, L.; Wang, Y.; Gao, S.; Daut, G. A comparison of different methods for determining the organic and inorganic carbon content of lake sediment from two lakes on the Tibetan Plateau. Quat. Int. 2012, 250, 49–54. [Google Scholar] [CrossRef]
  23. Vanhala, P.; Karhu, K.; Tuomi, M.; Sonninen, E.; Jungner, H.; Fritze, H.; Liski, J. Old soil carbon is more temperature sensitive than the young in an agricultural field. Soil Biol. Biochem. 2007, 39, 2967–2970. [Google Scholar] [CrossRef]
  24. Yousef, E.A.; El-Mallah, A.M.; Abdel-Baki, A.-A.S.; Al-Quraishy, S.; Reyad, A.; Abdel-Tawab, H. Efeito das Variáveis Ambientais no Zooplâncton em Vários Habitats do Rio Nilo. Água 2024, 16, 915. [Google Scholar] [CrossRef]
  25. Stein, E.D.; Cohen, Y.; Winer, A.M. Environmental distribution and transformation of mercury compounds. Crit. Rev. Environ. Sci. Technol. 1996, 26, 1–43. [Google Scholar] [CrossRef]
  26. Li, Y.; Cai, Y. Progress in the study of mercury methylation and demethylation in aquatic environments. Chin. Sci. Bull. 2012, 58, 177–185. [Google Scholar] [CrossRef]
  27. Xun, L.; Campbell, N.E.R.; Rudd, J.W.M. Measurements of Specific Rates of Net Methyl Mercury Production in the Water Column and Surface Sediments of Acidified and Circumneutral Lakes. Can. J. Fish. Aquat. Sci. 1987, 44. [Google Scholar] [CrossRef]
  28. Zhang, D.; Xiang, Y.; Liu, G.; Liang, L.; Chen, L.; Shi, J.; Yin, Y.; Cai, Y.; Jiang, G. Mechanism and controlling factors on rapid methylmercury degradation by ligand-enhanced Fenton-like reaction at circumneutral pH. Chemosphere 2023, 324, 138291. [Google Scholar] [CrossRef]
  29. Zhao, L.; Guo, Y.; Meng, B.; Yao, H.; Feng, X. Effects of damming on the distribution and methylation of mercury in Wujiang River, Southwest China. Chemosphere 2017, 185, 780–788. [Google Scholar] [CrossRef] [PubMed]
  30. Hudelson, K.E.; Drevnick, P.E.; Wang, F.; Armstrong, D.; Fisk, A.T. Mercury methylation and demethylation potentials in Arctic lake sediments. Chemosphere 2020, 248, 126001. [Google Scholar] [CrossRef]
  31. Wright, D.R.; Hamilton, R.D. Release of Methyl Mercury from Sediments: Effects of Mercury Concentration, Low Temperature, and Nutrient Addition. Can. J. Fish. Aquat. Sci. 1982, 39, 1459–1466. [Google Scholar] [CrossRef]
  32. Lázaro, W.L.; Oliveira-Júnior, E.S.; da Silva, C.J.; Castrillon, S.K.I.; Muniz, C.C. Climate change reflected in one of the largest wetlands in the world: An overview of the Northern Pantanal water regime. Acta Limnol. Bras. 2020, 32, e104. [Google Scholar] [CrossRef]
Figure 1. Map of the location of Castelo and Saracura bays, with sampling points.
Water 16 01204 g001
Figure 2. Variation of MeHg concentration in microcosms with water/sediment during the “dequada” BC1 and the drought or without the “dequada” BC2 in the Castelo bay.
Water 16 01204 g002
Figure 3. Variation of TOC, To, pH, EH, DO, and conductivity in MeHg experiments in microcosms with water/sediment during the “dequada” (BC1) and the drought or without the “dequada” (BC2) in the Castelo bay.
Water 16 01204 g003
Figure 4. Variation of MeHg concentration in microcosms with water/sediment during the “dequada” (BS1) and the drought or without the “dequada” (BS2) in the Saracura bay.
Water 16 01204 g004
Figure 5. Variation of TOC, To, pH, EH, DO, and conductivity in MeHg experiments in microcosms with water/sediment during the “dequada” (BS1) and the drought or without the “dequada” (BS2), in the Saracura bay.
Water 16 01204 g005aWater 16 01204 g005b
Table 1. Sampling sites for collection during the flood period (with the dequada) and the drought period (without the dequada).
PointPeriodWater Column (m)Reference
Coordinate
P1
Castelo bay
1 ª (flood period)
2 ª (drought period)
8.0
5.5
18°35.580′ S
57°14.233′ W
P2
Castelo bay
1 ª (flood period)
2 ª (drought period)
8.5
6.0
18°35.597′ S
57°32.929′ W
P3
Castelo bay
1 ª (flood period)
2 ª (drought period)
9.5
7.5
18°35.334′ S
57°32.728′ W
P6
Saracura bay
1 ª (flood period)
2 ª (drought period)
3.0
1.5
18°42.252′ S
57°35.803′ W
P7
Saracura bay
1 ª (flood period)
2 ª (drought period)
3.5
2.0
18°43.337′ S
57°36.683′ W
P8
Saracura bay
1 ª (flood period)
2 ª (drought period)
2.8
1.5
18°43.410′ S
57°35.154′ W
Table 2. Physical and chemical parameters of surface water samples measured at the time of collection. The 1st collection during the “dequada” and the 2nd collection during the drought or without the “dequada”.
PointSamplingT
(°C)
pHDO
(mg L−1)
EH
(mV)
Condut.
(μS cm−1)
P11 ª
2 ª
26.18
23.00
5.04
5.78
1.49
7.50
79.50
65.15
66
177
P21 ª
2 ª
26.18
23.15
5.25
5.64
1.49
6.27
79.50
65.15
66
151
P31 ª
2 ª
26.18
25.05
5.30
5.85
1.49
6.45
79.50
65.15
66
89
P61 ª
2 ª
26.38
25.34
5.90
5.95
0.72
5.87
38.90
22.00
60
92
P71 ª
2 ª
26.38
25.10
6.02
6.01
0.72
4.79
38.90
22.00
60
94
P81 ª
2 ª
26.38
25.00
6.02
6.11
0.72
5.15
38.90
22.00
60
90
Table 3. Concentration of total mercury in water and sediment from the sampling sites during the first collection (during “dequada”) and second collection (during the drought or without the “dequada”).
PointSampling[Hgtotal] (ng L−1)
Water
[Hgtotal] (ng g−1)
Sediment
P11 ª
2 ª
6.78 ± 0.04
<LQ
56.24 ± 0.19
19.51 ±0.15
P21 ª
2 ª
<LQ
<LQ
65.08 ± 0.16
12.45 ± 0.08
P31 ª
2 ª
<LQ
<LQ
64.57 ± 0.21
7.81 ± 0.04
P61 ª
2 ª
<LQ
<LQ
43.33 ± 0.15
30.98 ± 0.11
P71 ª
2 ª
<LQ
<LQ
45.77 ± 0.18
17.58 ± 0.16
P81 ª
2 ª
<LQ
<LQ
46.46 ± 0.15
28.33 ± 0.13
Disclaimer/Publisher’s Note: The statements, opinions and data contained in all publications are solely those of the individual author(s) and contributor(s) and not of MDPI and/or the editor(s). MDPI and/or the editor(s) disclaim responsibility for any injury to people or property resulting from any ideas, methods, instructions or products referred to in the content.

