Article

Evaluation and Wind Field Detection of Airborne Doppler Wind Lidar with Automatic Intelligent Processing in North China

1
School of Optics and Photonics, Beijing Institute of Technology, Beijing 100081, China
2
Key Laboratory of Information Photonics Technology, Ministry of Industry and Information Technology, Beijing 100081, China
3
AVIC Taiyuan Aero-Instrument Co., Ltd., Taiyuan 030006, China
*
Author to whom correspondence should be addressed.
Submission received: 22 February 2024 / Revised: 28 March 2024 / Accepted: 25 April 2024 / Published: 27 April 2024
(This article belongs to the Section Atmospheric Techniques, Instruments, and Modeling)

Abstract

:
Airborne wind measurement is of great significance for understanding atmospheric motion and meteorological monitoring. In this paper, we present the development and verification of an airborne Doppler wind lidar (ADWL), featuring an approach proposed to integrate a real-time wind retrieval method with an intelligent processing method for automatic adaptive wind detection. Several verification experiments were conducted to evaluate the measurement effectiveness, including comparisons with a calibrated ground-based Doppler wind lidar (GDWL) and a sounding balloon. Compared with the sounding balloon, the ADWL demonstrated mean errors of 0.53 m/s for horizontal wind velocity and 4.60° for wind direction. The correlation coefficients consistently exceeded 0.98 in all linear analyses. Employed in multiple airborne wind detection events in North China at altitudes up to 6600 m, the ADWL provided effective wind field results with a vertical resolution of 50 m and a data rate of 2 Hz. The wind field results obtained during the detection events validate the ADWL’s capabilities in diverse environments and underscore its potential for the comprehensive detection of meteorological information.

1. Introduction

The Doppler wind lidar (DWL) has proven highly efficient in wind field measurement, demonstrating significant utility in various applications, including atmospheric research [1,2], disaster weather warning [3,4], and aircraft safety [5,6]. By employing the coherent detection method to extract Doppler frequency shifts, the DWL provides wind measurements with exceptional accuracy and resolution, demonstrating robust adaptability to diverse meteorological environments. In recent years, substantial progress has been achieved in both DWL system research and its applications [7,8,9,10]. Furthermore, DWLs exhibit promising potential in investigating various phenomena associated with the wind field, such as air pollution [11,12], the planetary boundary layer [13,14], and gravity waves [15,16], among others. As researchers aim to enhance flight safety and deepen our understanding of climate change, DWL is progressively evolving into a focal research point.
Among the myriad of DWL research, the majority focuses on ground-based applications for vertical detection. While ground-based technologies have historically provided valuable insights into atmospheric dynamics, the detection area of the ground-based DWL is constrained by fixed locations, facing inherent limitations. To overcome these constraints and enhance DWL capabilities, researchers have explored various platform-mounted DWLs, including vehicle-mounted DWLs [17], floating DWLs [18], shipborne DWLs [19], and airborne Doppler wind lidars (ADWLs) [20]. ADWLs offer a remarkable advantage in their high mobility and flexibility, capturing detailed wind profiles across different atmospheric layers from the ground surface to higher altitudes. However, research on ADWLs remains relatively scarce. The main challenges in developing ADWLs lie in the wind field inversion processing approach adapted to airborne platforms.
The high-speed motion of airborne platforms presents several challenges for wind retrieval methods, including accuracy, computational time, and relative speed differences. Common wind retrieval methods often necessitate a trade-off between computational speed and accuracy. The accuracy of conventional methods such as the least squares method [21] and the sine wave fitting method [22] typically relies on the precision of Line-of-Sight (LOS) wind speed measurements. Novel methods, such as the maximum of the function of accumulated spectra (MFAS) method [23], the genetic algorithm-based spectrum estimation method [24], and the variational mode decomposition (VMD) method [25], offer robust noise resistance but demand substantial computational time, rarely achieving real-time processing. However, this limitation can lead to significant areas of invalid or unmeasured wind detection in high-speed airborne applications. Moreover, as aircraft altitude increases, the volume of data amplifies, exacerbating this issue. Relative speed differences between the platform and wind field further complicate accurate wind field inversion. Several algorithms aided by inertial sensors have been proposed to mitigate the effects of platform motion [26,27]. However, the computational efficiency of these algorithms remains suboptimal. Consequently, the development of ADWL hinges on proposing a wind retrieval method with rapid calculation and high accuracy, incorporating platform motion compensation and three-dimensional (3D) wind field inversion.
Due to relatively complex wind retrieval methods and instrument control processes, the processing subsystem in DWLs tends to be burdensome. The majority of DWL systems place control and calculation functions on a PC-based post-processor [28,29,30,31]. It is common practice to utilize pre-processors, such as the field-programmable gate array (FPGA) processor, to convert the photocurrent from coherent detection into a time-domain digital signal [32,33,34]. Subsequently, the typical approach involves a pre-processor performing the fast Fourier transform (FFT) function and transmitting the spectrum data to a PC for further processing. This approach has been well developed for ground-based applications. However, it requires sufficient cabin space on the aircraft for DWL system installation and professional operators aboard for system control. For future airborne applications, the ADWL should exhibit sufficient compactness, adaptability to complex environments, and capabilities for intelligent unmanned operation. In this work, we present an automatic real-time processing approach loaded on a core board equipped with the FPGA module and the Advanced RISC Machine (ARM) module.
This study presents the development and verification of a 1550 nm all-fiber ADWL. We propose an approach integrating a real-time wind retrieval method and an intelligent processing method for automatic real-time measurements. Based on the optimized Levenberg–Marquardt (LM) algorithm, the wind retrieval method encompasses LOS wind speed calculation with motion compensation and 3D wind field reconstruction, providing real-time calculation and high accuracy. The intelligent processing method consists of the adaptive self-control function and the intelligent accumulation function, enabling adaptive working status adjustment and ensuring automatic wind retrieval with enhanced data availability in various environments. This approach greatly enhances system efficiency and compactness by merging pre-processing and post-processing stages.
We initially conducted ground-based comparisons with a calibrated ground-based Doppler wind lidar (GDWL) to assess the effectiveness of the ADWL. Subsequent comparisons were performed with the GDWL and a sounding balloon in the airborne detection conditions to evaluate the ADWL’s performance. Additionally, we conducted several airborne wind detection events to reveal the wind field in various environments. Identifying the wind field, cloud distribution, and atmospheric layers demonstrates the reliability of the ADWL in comprehensive meteorological information detection.

2. Materials and Methods

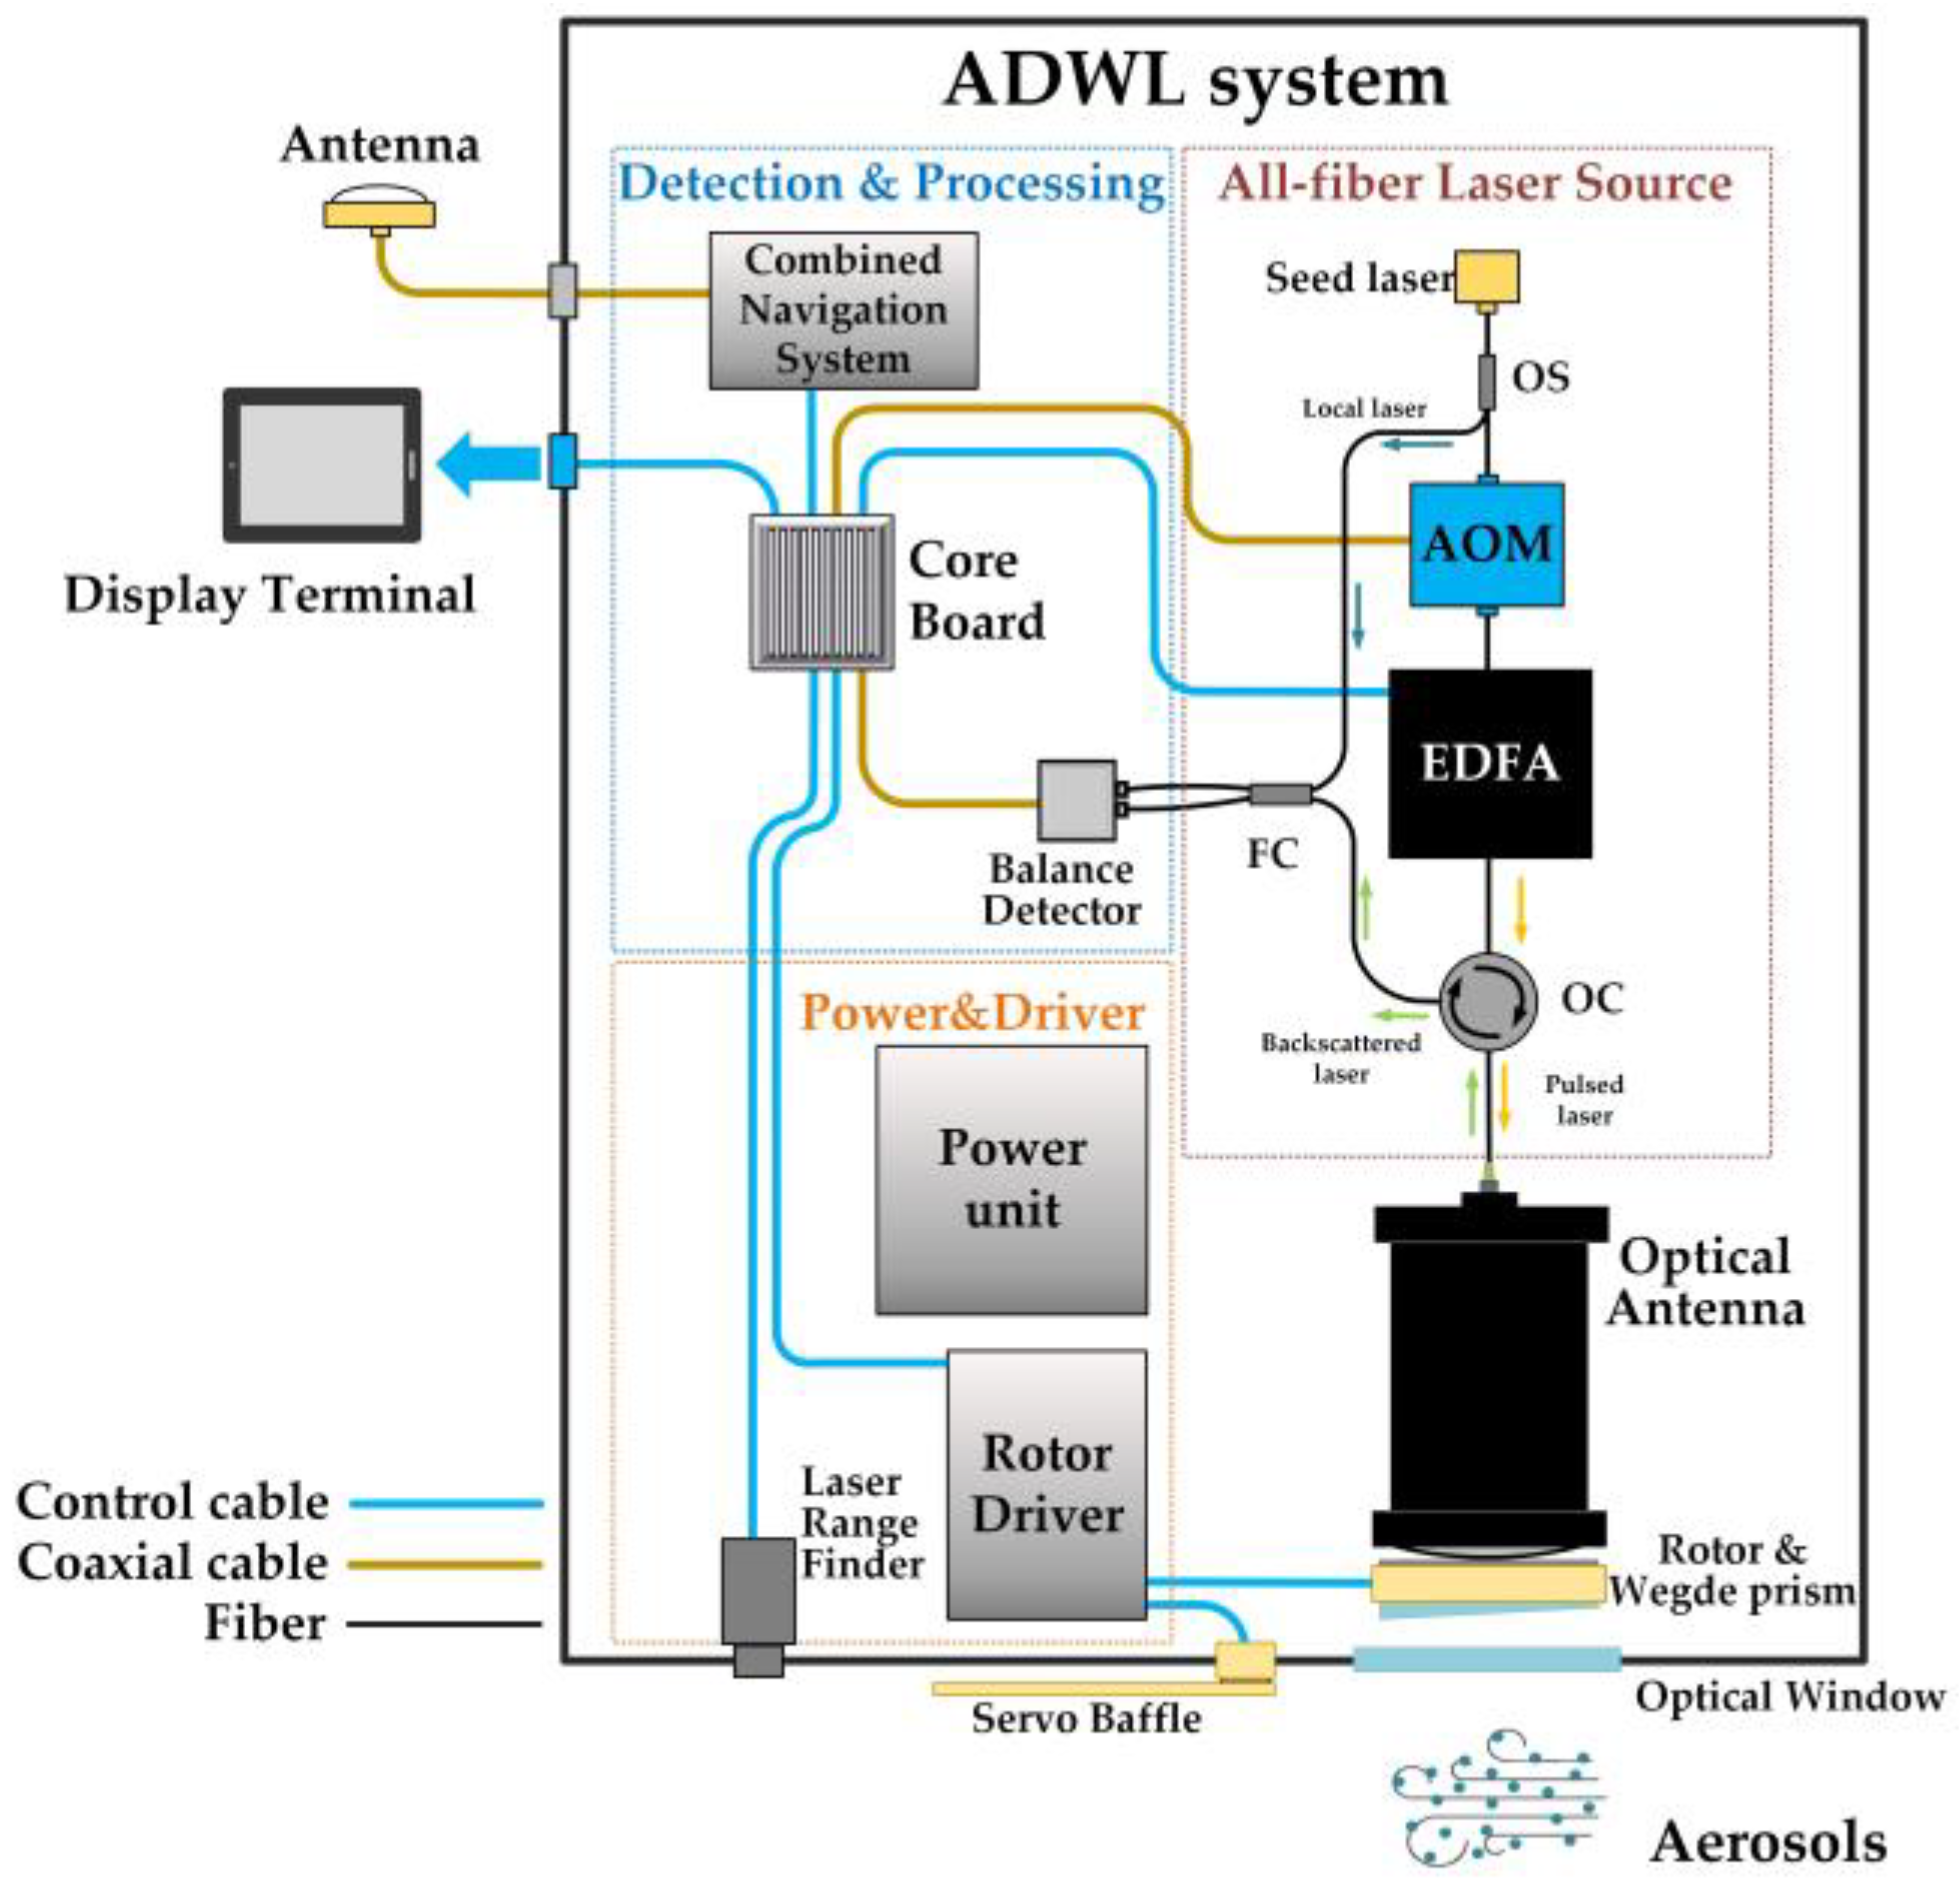
2.1. Airborne Doppler Wind Lidar System

The ADWL system comprises four subsystems: the 1550 nm laser source, the optical antenna, the detection and processing subsystem, and the power and driver subsystem. The system’s schematic diagram is illustrated in Figure 1. The detailed ADWL parameters are summarized in Table 1.
In the 1550 nm laser source, the seed laser emits a continuous-wave (CW) 1550 nm single-frequency beam. The seed laser’s linewidth is 20 kHz to enhance accuracy and minimize spectrum noise. An acousto-optic modulator (AOM) performs pulsed modulation and frequency shift on the seed laser. The modulation is triggered and synchronized by the TTL signal from the core board. Considering the high relative speed between the airborne platform and aerosols, the AOM’s frequency shift is set at 40 MHz for high-speed tolerance in the spectrum. Subsequently, the pulsed laser is generated by amplifying the erbium-doped fiber amplifier (EDFA). The maximum pulse energy reaches 300 μJ at a PRF of 10 kHz, corresponding to pulse widths of 600 ns. The pulse widths are selectable from 100 ns to 600 ns, matching with different detection parameter configurations.
The pulsed laser is transmitted to the optical antenna through the optical circulator. The optical antenna performs beam expansion and beam collimation of the pulsed laser. Accompanied by the wedge prism, the rotor can execute a 360° laser beam scan while maintaining a consistent nadir angle of 20°. The nadir angle represents the angle between the laser transmission path and the vertical line from the aircraft to the ground. To reduce the detection spatial volume and accommodate the influence of aircraft platform speed on LOS wind speed, we apply a 180-degree scan scheme. In this scheme, we set the azimuth angle to 0°, referring to the forward direction of aircraft flight. The wind retrieval is conducted with the sliding fitting scheme, which means that the 3D wind field information is retrieved with the LOS wind speed data upgrading at each azimuth. The dwell time takes nearly 0.3 s at each LOS stare, and the rotation time is about 0.2 s. The collection of the backscattered laser is conducted by the same optical antenna. Through the optical circulator, the backscattered laser is coupled into the fiber coupler and mixed with the local laser.
The detection and processing subsystem, serving as the core of the ADWL system, is responsible for conducting coherent detection, wind field retrieval, and intelligent control. The balance detector carries out the coherent detection of the mixed laser and optic–electric conversion. The photocurrent detected is inputted into the core board and converted into a time-domain digital signal. The core board integrates several modules, including the FPGA module (X7Z020-2CLG400i, Xilinx Inc., San Jose, CA, USA), the ARM module (Cortex-a9), 14-bit analog-to-digital converters (ADC), multiple digital-to-analog converters (DACs), and several serial port resources, among others. The abundance of modules and resources on the core board enables signal acquisition and complex information processing functions based on the programmed algorithm. The wind retrieval method integrates the pre-processing and post-processing stages, typically conducted separately in traditional DWLs, into one compact device. Combining this wind retrieval method with the specialized system configuration, the ADWL can perform intelligent real-time wind field detection in a compact system suitable for airborne platforms.
The combined navigation system (CNS, KY-INS300, manufactured by Beijing BDStar Navigation Co., Ltd., Beijing, China) comprises the global navigation satellite system (GNSS) module, the high-performance fiber optic gyroscope (FOG), and the accelerometer, providing accurate motion status data for motion compensation. With the intelligent processing method loaded on the ARM module, the ADWL operates and generates the wind field results automatically. Controlled by the core board, the rotor driver propels the wedge mirror for scanning and switches the baffle to protect the optical antenna. The LRF (LSP-LRS-0610A, manufactured by Lumispot Tech, Suzhou, China) measures the distance between the ADWL and hard targets in the detection path, providing criteria for assessing the ADWL system’s working mode. Further details on the data processing in the core board will be provided in Section 2.2. Through this integration, the size, weight, and power (SWaP) of the whole ADWL system are greatly optimized, as shown in Table 1, which offers advantages compared to other DWLs. To display the detected wind field, terminals such as laptops and Android smart devices could be optionally utilized.

2.2. Automatic Real-Time Processing Approach

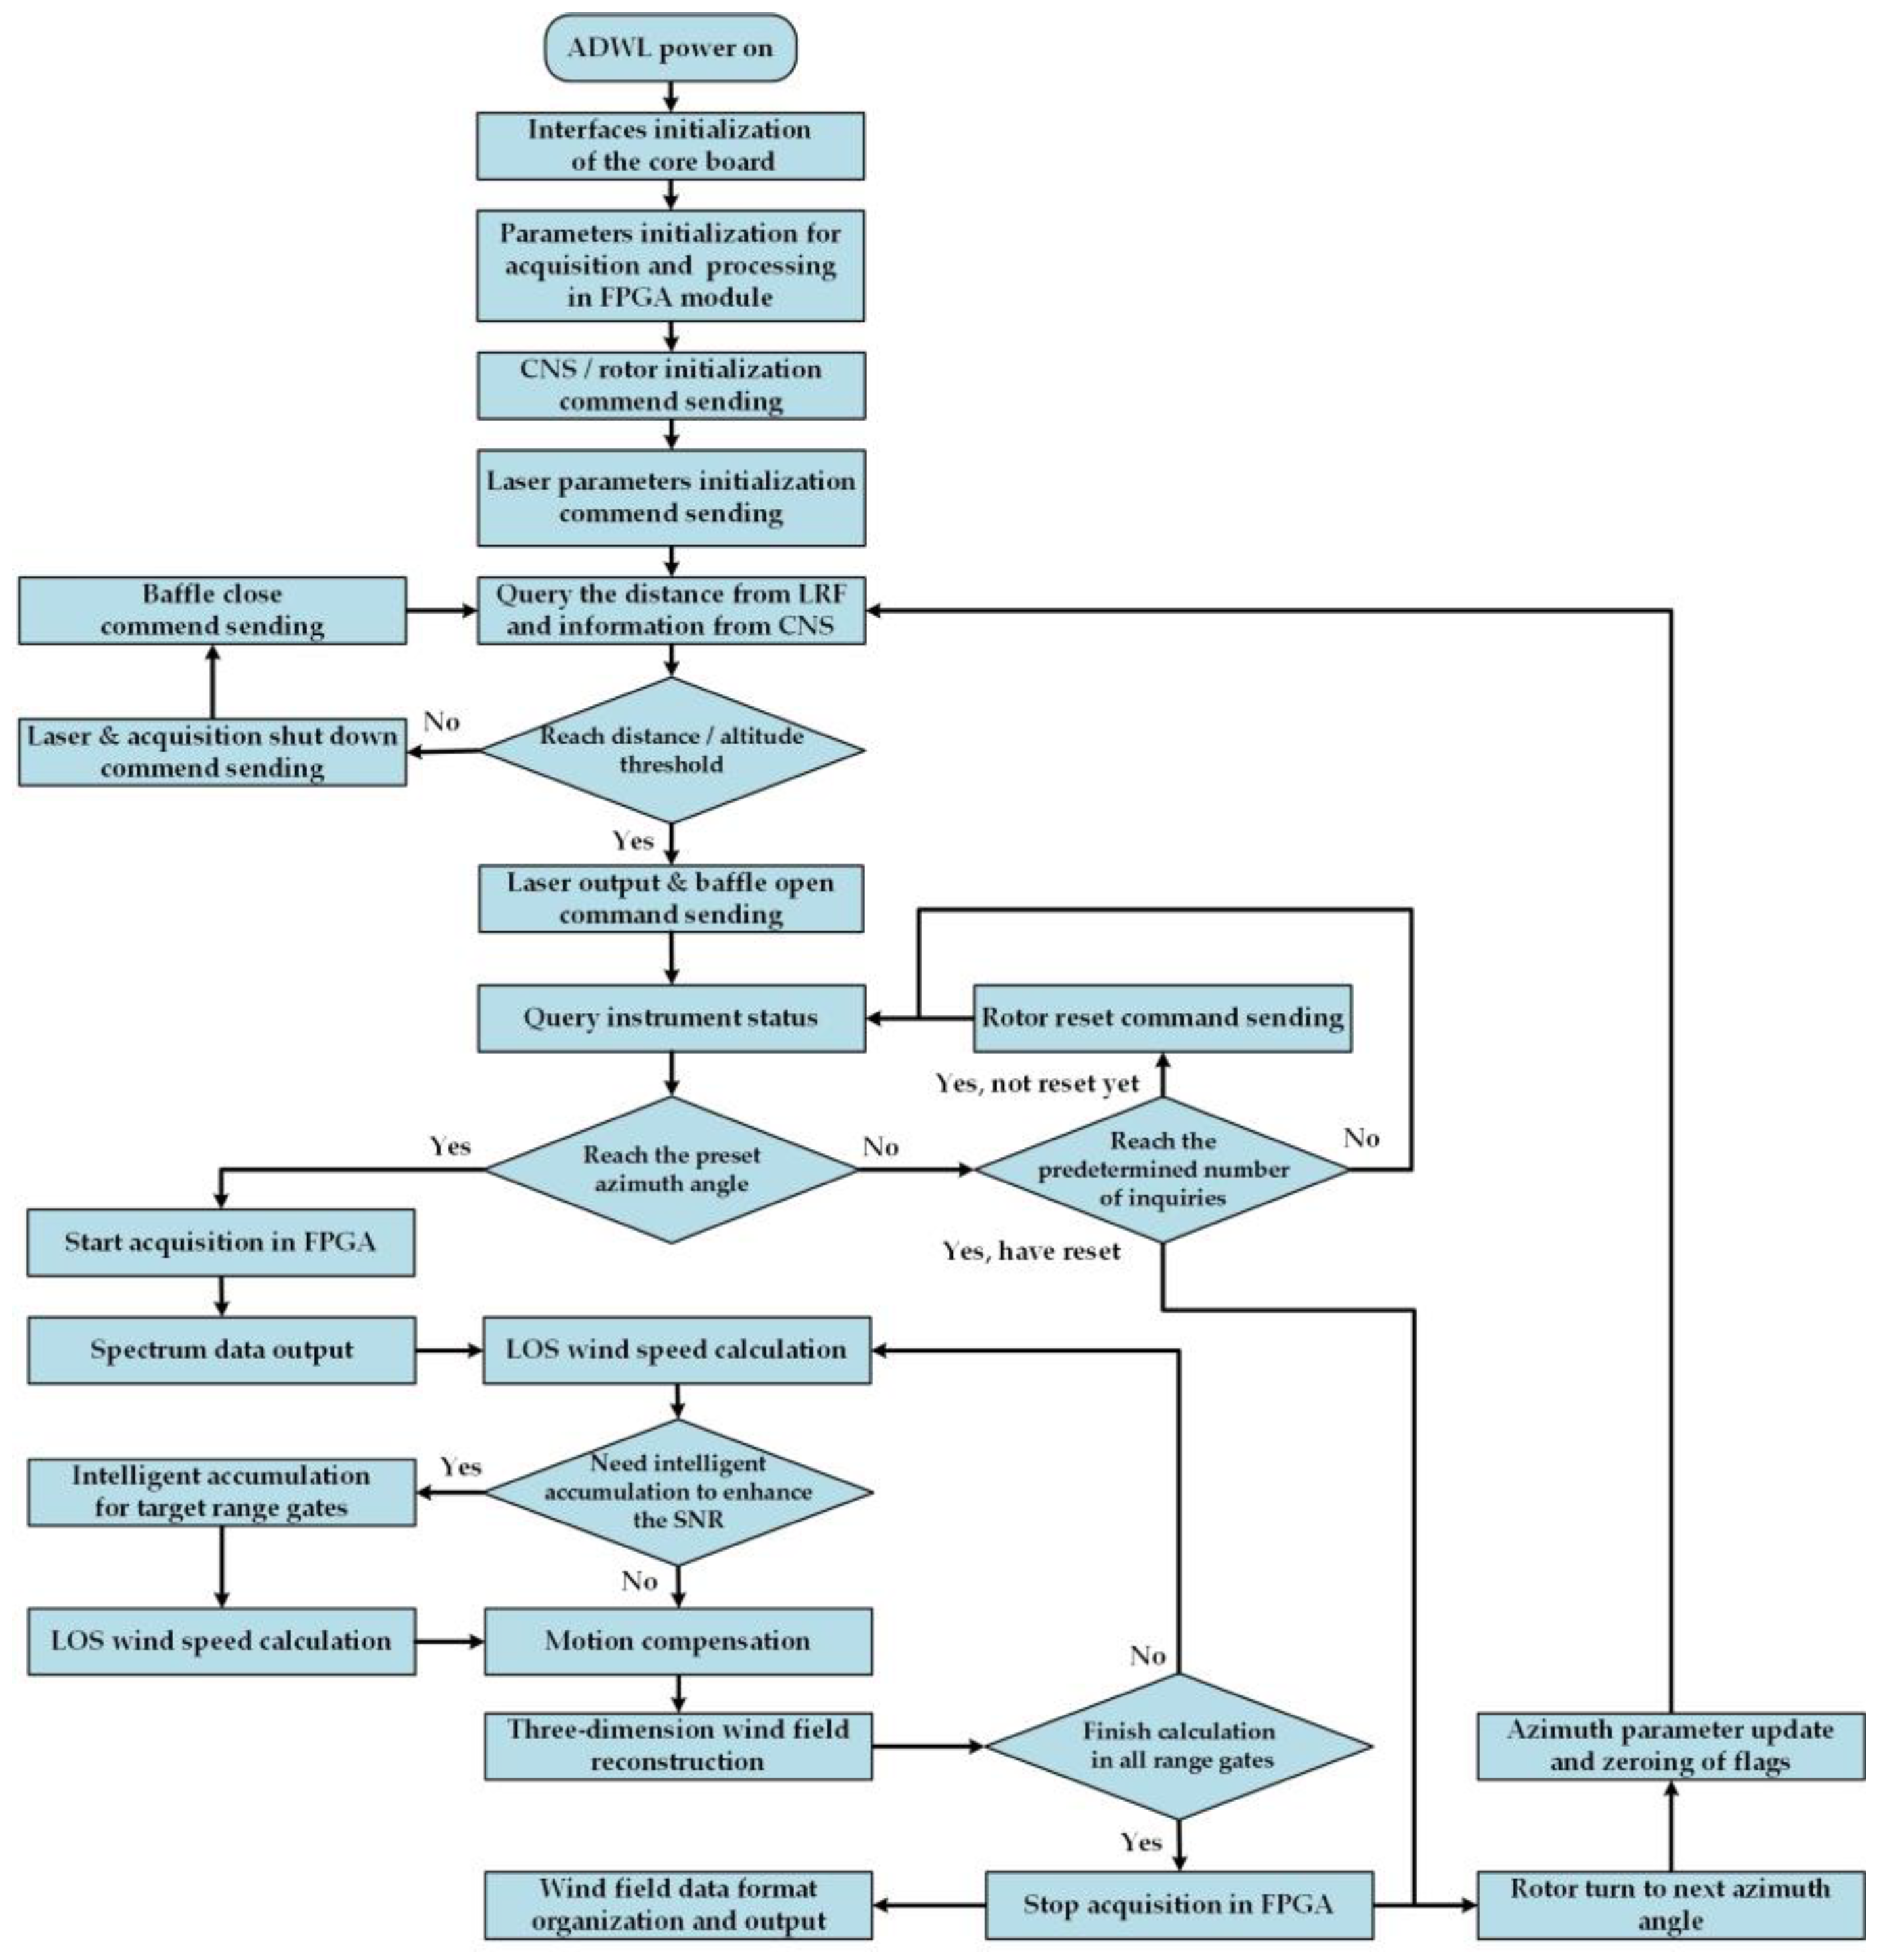
2.2.1. Processing Flow of the Integrated Approach on the Core Board

Modern data-processing devices already possess strong data-processing and functional programming capabilities. Based on the FPGA and ARM modules, we integrate the traditional pre-processing and post-processing into one processing device, significantly improving processing synchronization. As the processing core of the system, the core board is responsible for wind field retrieval and system control. Figure 2 illustrates the schematic diagram of the functional zoning and processing flow on the core board for visual representation.
The entire wind field inversion process is divided into spectrum data calculation in FPGA and wind field reconstruction calculation in ARM. The core board of the ADWL system acquires and digitizes the time-domain signal at a sampling rate of 400 MHz. Subsequently, the FPGA performs range gate division on the time-domain signal, setting the vertical range gate to 50 m by applying a 53.25 m range gate along the LOS detection path with a 20° nadir angle. Consequently, each range gate contains 142 data points, corresponding to a sampling rate of 400 MHz. Zero padding and the window function are employed within each range gate. The 512-point FFT is executed in 10 parallel processing channels to generate spectrum data. The spectrum data are input into ten parallel channels in groups of every ten gates to synchronize the range gate timing. After completing the calculation, the spectrum data are temporarily stored, and the next set of operations begins until all calculations are completed. Subsequently, the spectrum data are arranged in the order of range gates. An accumulation average is then performed to enhance the signal-to-noise ratio (SNR) of the spectrum data with a fixed number. The accumulation average number is set to 2000 in this work, corresponding to 0.2 s with a PRF of 10 kHz.
The spectrum data are transported from the FPGA to the ARM module through the Direct Memory Access (DMA) channel. Programs loaded on the ARM module extract LOS wind speed, the full-width-half-maximum (FHWM) of the spectrum peak, and SNR from the spectrum data. LOS wind speed and angle values are transformed into the geographic coordinate system, and the effects of platform motion are mitigated based on motion status information from the CNS. Utilizing the corrected LOS results and angle values, the horizontal wind speed, horizontal wind direction, and vertical wind speed are calculated to characterize the 3D wind field comprehensively.
The interfaces of the core board play a crucial role in facilitating information exchange and control functions within the ADWL system. As the clock source of the system, the core board generates TTL signals through the DAC interface as the external trigger of AOM, synchronizing the generation of a pulsed laser with the acquisition and processing. The internal serial port enables the control of internal devices based on the intelligent processing method. The external serial port and Ethernet interface allow for the output of data products at different levels for visual display. The MicroSD card module on the core board simplifies results storage, eliminating the need for external control devices.
The intelligent processing method in the ARM module conducts adaptive work state control and data-processing management. Through the command analysis, the intelligent processing method obtains system statuses and issues corresponding to commands from the interfaces. The two data packing processes aim to manage spectrum data and comprehensive results, respectively, reducing short-term resource consumption in the ARM. The output of data results is classified according to the data type. The entire process occurs within the core board, contributing to the enhanced processing efficiency and compactness of the ADWL system.

2.2.2. Real-Time Wind Retrieval Method

We first derive the wind velocity, spectrum peak width, and SNR along the LOS detection path to assess data quality and analyze aerosol properties. For correct wind field reconstruction, it is crucial to eliminate the interference to LOS wind speed resulting from the airborne platform motion and platform attitude. The horizontal wind speed and direction are calculated using the corrected LOS results and scanning angle values.
To address the limitation of finite spectrum resolution, we employ the LM algorithm in LOS speed calculation to enhance accuracy and accelerate the computation. The LM algorithm resolves the fitting along the iterative optimization rule, expressed as follows:
Ni+1 = Ni − [JTJ + μI]−1 g
where N is the solution of the fitting function solved in each iteration, i represents the number of iterations, J is the Jacobian matrix derived from the fitting equation, μ is the damping coefficient, and g is the gradient item. For the LOS wind speed calculation, the fitting equation refers to the form of Gaussian distribution. In each iteration, J and the deviation value matrix f are derived and updated from the measured values and modeled values. μ is empirically set as the 10−6 times maximum diagonal element in JTJ and then adaptively updated to promote fitting convergence. g is updated from JT and f. If the difference between two iterations is below the threshold, or g approaches 0, the iteration stops. With the iteration number reaching the predetermined value, the iteration also stops. Figure 3a illustrates the flowchart of the LOS wind speed calculation based on the LM algorithm.
In practical conditions, the spectrum peak is often obscured by noise, particularly in range gates located at greater distances. This interference adversely affects wind speed accuracy and the detection range. To address this, we introduce a two-step signal enhancement algorithm. Firstly, the intrinsic noise spectrum, pre-detected by running the ADWL system with the optical antenna blocked, is subtracted. Secondly, a characteristic noise spectrum is constructed and subtracted by analyzing the current spectrum data [35]. Following this two-step process, the spectrum in each range gate is denoised and smoothed.
After noise deduction, the spectrum peak frequency and peak value are identified and set as the initial fitting parameters. The spectrum data are then input into the iterative LM algorithm to refine the precise spectrum peak frequency, the FHWM of the spectrum peak, and the peak value. The fitting parameters include spectrum peak frequency, spectrum peak value, and corresponding Gaussian distribution standard deviation. The LOS wind velocity can be calculated by VLOS = λ × vD/2, where λ is the laser wavelength and vD is the Doppler frequency shift from the difference between spectrum peak frequency and AOM frequency. The SNR is defined as the ratio of the fitting peak value to the noise floor in each range gate. The FHWM can be calculated from the standard deviation along the gaussian function. For data quality management, the SNR and FHWM are checked to determine if they meet the empirical threshold. The result is considered of good quality if the SNR is higher than 0.5 dB and the FHWM is between 2.5 MHz and 15 MHz.
The schematic diagram of the platform motion and the ADWL scanning mode is depicted in Figure 3b. During forward flight, there exists relative motion between the aircraft and aerosol particles. Consequently, the relative velocity on the LOS path is positive and detectable in the scan from −90° to 90°, meeting the requirements for subsequent motion compensation. The ARM module of the core board communicates with CNS, capturing precise data of platform speed and attitude information. The data rate of the CNS is 50 Hz, exceeding that of the LOS wind speed calculation, enabling the accurate real-time acquisition of platform motion status for compensation. We define the x-y-z Cartesian coordinate system of the moving platform and the north–east–down Cartesian coordinate system (NED) of the geographic coordinate system. The x refers to the moving direction of the platform. The y refers to the right direction of the platform. The z refers to the downward direction of the platform. With the compact installation scheme, the CNS and the antenna share the same coordinate system with the platform and the ADWL, simplifying the calculation process of coordinate transformation. The calculated LOS wind speed is referenced to the platform coordinate system with the azimuth angle, φp, and the nadir angle, θp. The vector of the LOS speed converted from the platform coordinate system to geographic coordinate system can be expressed as follows [36]:
V x , g V y , g V z , g = H · V x , p V y , p V z , p = H y · H p · H r · a sin θ p cos φ p a sin θ p sin φ p a cos θ p
where Vx,p, Vy,p, and Vz,p are the axial vectors in the platform coordinate system; Vx,g, Vy,g, and Vz,g are the axial vectors in the geographic coordinate system; a is the modulus of the vector. Utilizing the attitude angle obtained from the CNS, the conversion matrix can be expressed as follows:
H y   = cos γ sin γ 0 sin γ cos γ 0 0 0 1
H p   = cos β 0 sin β 0 1 0 sin β 0 cos β
H r   = 1 0 0 0 cos α sin α 0 sin α cos α
where α, β, and γ represent the attitude angles corresponding to the roll angle, the pitch angle, and the yaw angle, respectively. The accurate attitude information is acquired from CNS. Applying the conversion matrix, the azimuth angle and elevation angle of the LOS wind speed in the geographic coordinate system can be expressed as follows:
φg = arctan(Vy,g/Vx,g)
θp = arccos(Vz,g/a)
After coordinate system conversion, the LOS wind vector VLOS,g in the geographic coordinate system is derived out. The CNS captures the platform’s moving speed along the axis of the geographic coordinate system. Using the coordinate system conversion results, the platform speed can be projected in the LOS direction as Vp. The influence of the platform’s motion is eliminated by subtracting Vp from VLOS,g. Subsequently, the azimuth angle φg is updated in the geographic coordinate system, and the corrected LOS wind speed VLOS,c is obtained.
After motion compensation, the corrected LOS wind speed is aligned into the corresponding range gate along the altitude. The fitting data array is initialized at the beginning of the detection to store the 8 sets of LOS speed data and azimuth angles according to the scan mode. Following the range gate alignment, the newly generated LOS data update the corresponding azimuth position data in the fitting data array. Then, the 3D wind field retrieval is conducted with the updated fitting data array. Utilizing the azimuth angles and nadir angle, the LOS wind speed can be expressed as follows:
VLOS,c = Vf·cosθgVh·cos(φφg)·sinθg
where Vf is the vertical speed, Vh is the horizontal wind speed, and the φ denotes the horizontal wind direction. Assuming a relatively uniform wind field in the detection zone, multiple sets of LOS wind velocities share the same distribution as the actual wind field with high moving speed and high calculation speed. We utilize the similar LM algorithm to retrieve the Vf, Vh, and φ, and the fitting function can be expressed as follows:
VLOS,c = V0 + A·cos(φφg)
With the LOS wind speed data and the azimuth angles, the fitting parameters, including V0, A, and φ, provide the 3D wind field information. The vertical speed can be calculated as Vf = V0/cosθg, and the horizontal speed can be calculated as Vh = A/sinθg. If the difference between two iterations of LM algorithm is below the threshold, or g approaches 0, the iteration terminates. With the iteration number reaching the predetermined value, the fitting process also stops, and an invalid data flag will be produced, corresponding to a harsh meteorological environment and weak backscattering.
Based on the sliding fitting scheme, the wind field retrieval is generated with the LOS data updating, which maximizes the data rate. During the actual detection, the process of the wind retrieval occurs across all range gates for the current LOS path and repeats for subsequent LOS paths. By reasonably setting the number of iterations, the calculation is accelerated while maintaining the accuracy.

2.2.3. Intelligent Processing Method

To optimize the airborne applications’ adaptability, unmanned and intelligent operation is achieved through the intelligent processing method programmed on the ARM module. By utilizing motion status information from the LRF and CNS, the control logic for ADWL is optimized to adapt to complex environments. A brief flowchart of the intelligent processing method is depicted in Figure 4.
Upon turning on the ADWL, initializations are applied to every device using configuration files stored on the core board. Subsequently, the baffle is controlled by acquiring and assessing the system altitude from the CNS, considering the range from the ADWL to hard targets. The baffle automatically opens when the aircraft flies above the ground at appropriate heights. If the status information indicates prolonged near-field hard target obstruction in the detection path, the baffle closes, followed by laser and acquisition shutdown. This protective operation reduces the impact of near-field strong reflections on detection devices, avoiding calculations under invalid detection conditions.
With the baffle opening, the pulsed laser initiates output, and rotors begin rotating based on azimuth angles set in the scanning mode. The core board performs FFT and incoherent accumulation, generating the spectrum data within a processing time of about 0.2 s. Subsequently, the processing time for the wind retrieval method is lower than 0.1 s to update wind field results. After wind retrieval, the rotor turns to the next azimuth angle with a rotation time of 0.2 s, and the next wind retrieval begins. Acquisition and wind field retrieval are suspended during scanning to prevent alignment deviation between detection results and the realistic wind field. The processing time for outputting a set of the wind retrieval results is about 0.5 s, resulting in a data rate of 2 Hz.
In various meteorological environments, the wind field retrieval exhibits fluctuations in the detection range due to the influence of aerosol distribution. To ensure the necessary detection range, the intelligent accumulation function is implemented to enhance the data availability, as depicted in Figure 5. Based on numerous wind retrieval experiments, a reasonable SNR threshold for the target detection range is established. When the detected SNR in the target detection range falls below the threshold, additional accumulation averaging is applied to the spectrum. To reduce computing resources, the accumulation registers are set in the core board program to store a finite set of spectrum data, with these registers updating when new spectrum data are generated. If additional accumulation is required, the accumulation register will perform sliding averaging based on the latest updated spectrum data.
The accumulation initially takes a relatively long time in the corresponding LOS direction to fulfill the register, transitioning to fast sliding accumulation in the subsequent process. Considering the data rate, the accumulation number gradually increases from low to high, with SNR serving as the evaluation criterion. The additional accumulation in the ARM is limited to a maximum number of 5 to balance processing speed and SNR enhancement. To maintain the accuracy, the intelligent accumulation is independently performed in 5 registers corresponding to the five-point scanning mode.

3. Results

3.1. Ground-Based Verification Experiments

To validate the effectiveness of the ADWL and the wind retrieval method, we initially compared the wind retrieval results from the ADWL with those obtained from a GDWL on the ground. Ground-based verification experiments were conducted in Taiyuan, Shanxi Province, China (approximately 115.57° E, 37.82° N). The experiment site was located in an open square in an urban area. The GDWL, previously verified with the sonic anemometer and the wind tower at the Institute of Atmospheric Physics, Chinese Academy of Sciences, was utilized as a reference. The detailed parameters of the GDWL are shown in Table 2, demonstrating LOS wind speed accuracy better than 0.1 m/s and wind direction accuracy better than 3°.
Since ADWL has a specialized installation structure for airborne applications and is unsuitable for general ground-based detection, as shown in Figure 6, we used a temporary frame to fix the ADWL and conducted vertical detection. To minimize differences in the detection areas, we positioned the ADWL near the GDWL. Deviations in position and laser path were corrected by aligning the LOS direction to known hard targets located in the north direction.
The comparison experiments between the ADWL and the GDWL were conducted from 9 March 2023 to 21 March 2023. The wind retrieval results from the ADWL and GDWL in the verification experiments are presented in Figure 7, illustrating horizontal wind speed and direction. Due to the variation in turbulence and meteorological conditions, the detected wind profile exhibited significant fluctuations in different conditions. The detection range of the ADWL extended beyond that of the GDWL, showcasing better performance based on the system development and the intelligent accumulation function. The displayed detection heights in Figure 7 are limited to 3000 m for better visualization of the comparison between the ADWL and the GDWL. The vertical detection heights of the ADWL typically reached 3000 m to 3500 m during the ground-based verifications, which were influenced by the meteorological conditions. The GDWL had a range gate length of 22.5 m, providing a more detailed description of the wind field. To mitigate fluctuations in the detection results and synchronize the timestamps of wind data, a short-term averaging of 10 s was applied to the wind results obtained from the two lidars. The wind speed and direction results exhibited good consistency along the detection path.
Figure 8 presents the linear fitting analysis between the ADWL and GDWL for all results collected in ground-based verification experiments. The timestamps and range gates are aligned with the measurement data to ensure precise comparisons with every range gate. The analysis was conducted at different heights separately, revealing high correlation coefficients exceeding 0.98. The mean values of the deviations between the ADWL and GDWL were better than 0.32 m/s and 3.46° for horizontal wind speed and direction, corresponding to a root mean square error (RMSE) better than 0.41 m/s and 4.20°, respectively. The wind speed and direction accuracy of the ADWL have been preliminarily validated through results obtained from ground-based verification experiments.
The evaluation of the intelligent accumulation function in LOS wind detection was also conducted. Figure 9 illustrates the enhancement in detection performance achieved with the intelligent accumulation function. Initially, we disabled the intelligent accumulation in the program and obtained LOS wind results in vertical detection. As meteorological conditions remained stable, there were no significant changes in the wind field and aerosols over time during the experiments. Subsequently, we measured the LOS wind speed with the intelligent accumulation function, setting the target detection height at 3500 m.
An example of the LOS wind speed distribution is presented in Figure 9a. The probability of effective wind speed results significantly increases within the detection range from 3000 m to 3500 m. Data availability, defined as the ratio of the quantity of data with good quality to the quantity of all detected data, was used to evaluate the effectiveness of the intelligent accumulation function. The improvement in the data availability during the evaluation is summarized in Figure 9b. The data used for summarizing were greater than 5000 sets at each range gate. At the detection height from 2000 m to 2500 m, the data availability without intelligent accumulation showed a significant decline, while the data availability with intelligent accumulation remained above 99%. The data availability without intelligent accumulation decreased from 91.30% to 74.51% at the detection height of 2500 to 3500 m, while the corresponding data availability with intelligent accumulation remained above 91.58%. These results demonstrate that the intelligent accumulation function effectively enhances the data availability in various environmental conditions.

3.2. Airborne Verification Experiments

The ADWL was subsequently installed on an aircraft (Y-12E, Hafei Aviation Industry Co., Ltd., Haerbin, China) for airborne verification. The typical cruise speed of the plane is 100 m/s and the maximum flight height is about 7000 m. The primary objective was to evaluate the accuracy of wind retrieval in practical airborne scenarios with the high-speed motion of the platform. On 30 March 2023, we utilized both the sounding balloon and the GDWL strategically positioned within the flight path for the purpose of comparison and validation in Shanxi Province, China.
A sounding balloon is a widely used instrument for collecting meteorological information and wind field data, serving as a reference for wind speed and direction in airborne verification experiments. To align with the sounding balloon data, the altitude from mean sea level instead of the detection height is utilized in the subsequent figures. Due to the placement of the sounding balloon and GDWL in a mountainous area (approximately 112.73° E, 37.80° N), the ground altitude reached approximately 1000 m. The distance between this placement site and the flight trajectory was within 1 km. The flight trajectory was nearly straight and passed the placement site back and forth. Considering the rise time of the sounding balloon, the plane approximately passed over the test point when the sounding balloon reached the plane’s flight altitude. To accommodate detection area disparities as well as the time difference of the ADWL and the sounding balloon, the wind detection results from ADWL were averaged over 5 min around the time the plane passed over the placement site. This ensured a better alignment with the wind field information detected by various instruments. Figure 10 presents samples depicting the detected wind speed and direction along the altitude in the airborne verification experiments.
In Figure 10, the distribution of wind speed and direction demonstrated good consistency, particularly at higher altitudes. The detection range of the GDWL reached an altitude of about 4000 m, while the ADWL covered all detection ranges from the aircraft to the ground. The linear fitting analysis between different instruments is depicted in Figure 11a–d. To address the uneven spatial distribution of data from the sounding balloon, we apply proper interpolation to fill in altitude gaps between continuously changing data points. This ensures a more uniform dataset for better comparison and analysis. Compared with the sounding balloon, the mean deviations of horizontal wind speed and direction are 0.53 m/s and 4.60°, respectively, corresponding to the RMSE of 0.62 m/s and 5.78°. The fitting results exhibit a strong correlation between the ADWL and the sounding balloon, with R2 of 0.9861 and 0.9927 for horizontal wind speed and direction, respectively. In comparison with the GDWL, the mean deviation of horizontal wind speed and direction is 0.42 m/s and 3.86°, with the RMSE of 0.54 m/s and 4.70°, respectively. The fitting results between the ADWL and the GDWL indicate R2 of 0.9908 and 0.9949 for horizontal wind speed and direction. From the airborne verification, the wind retrieval method was proven effective and adaptable to airborne detection applications. The detectability and accuracy of the ADWL were confirmed.

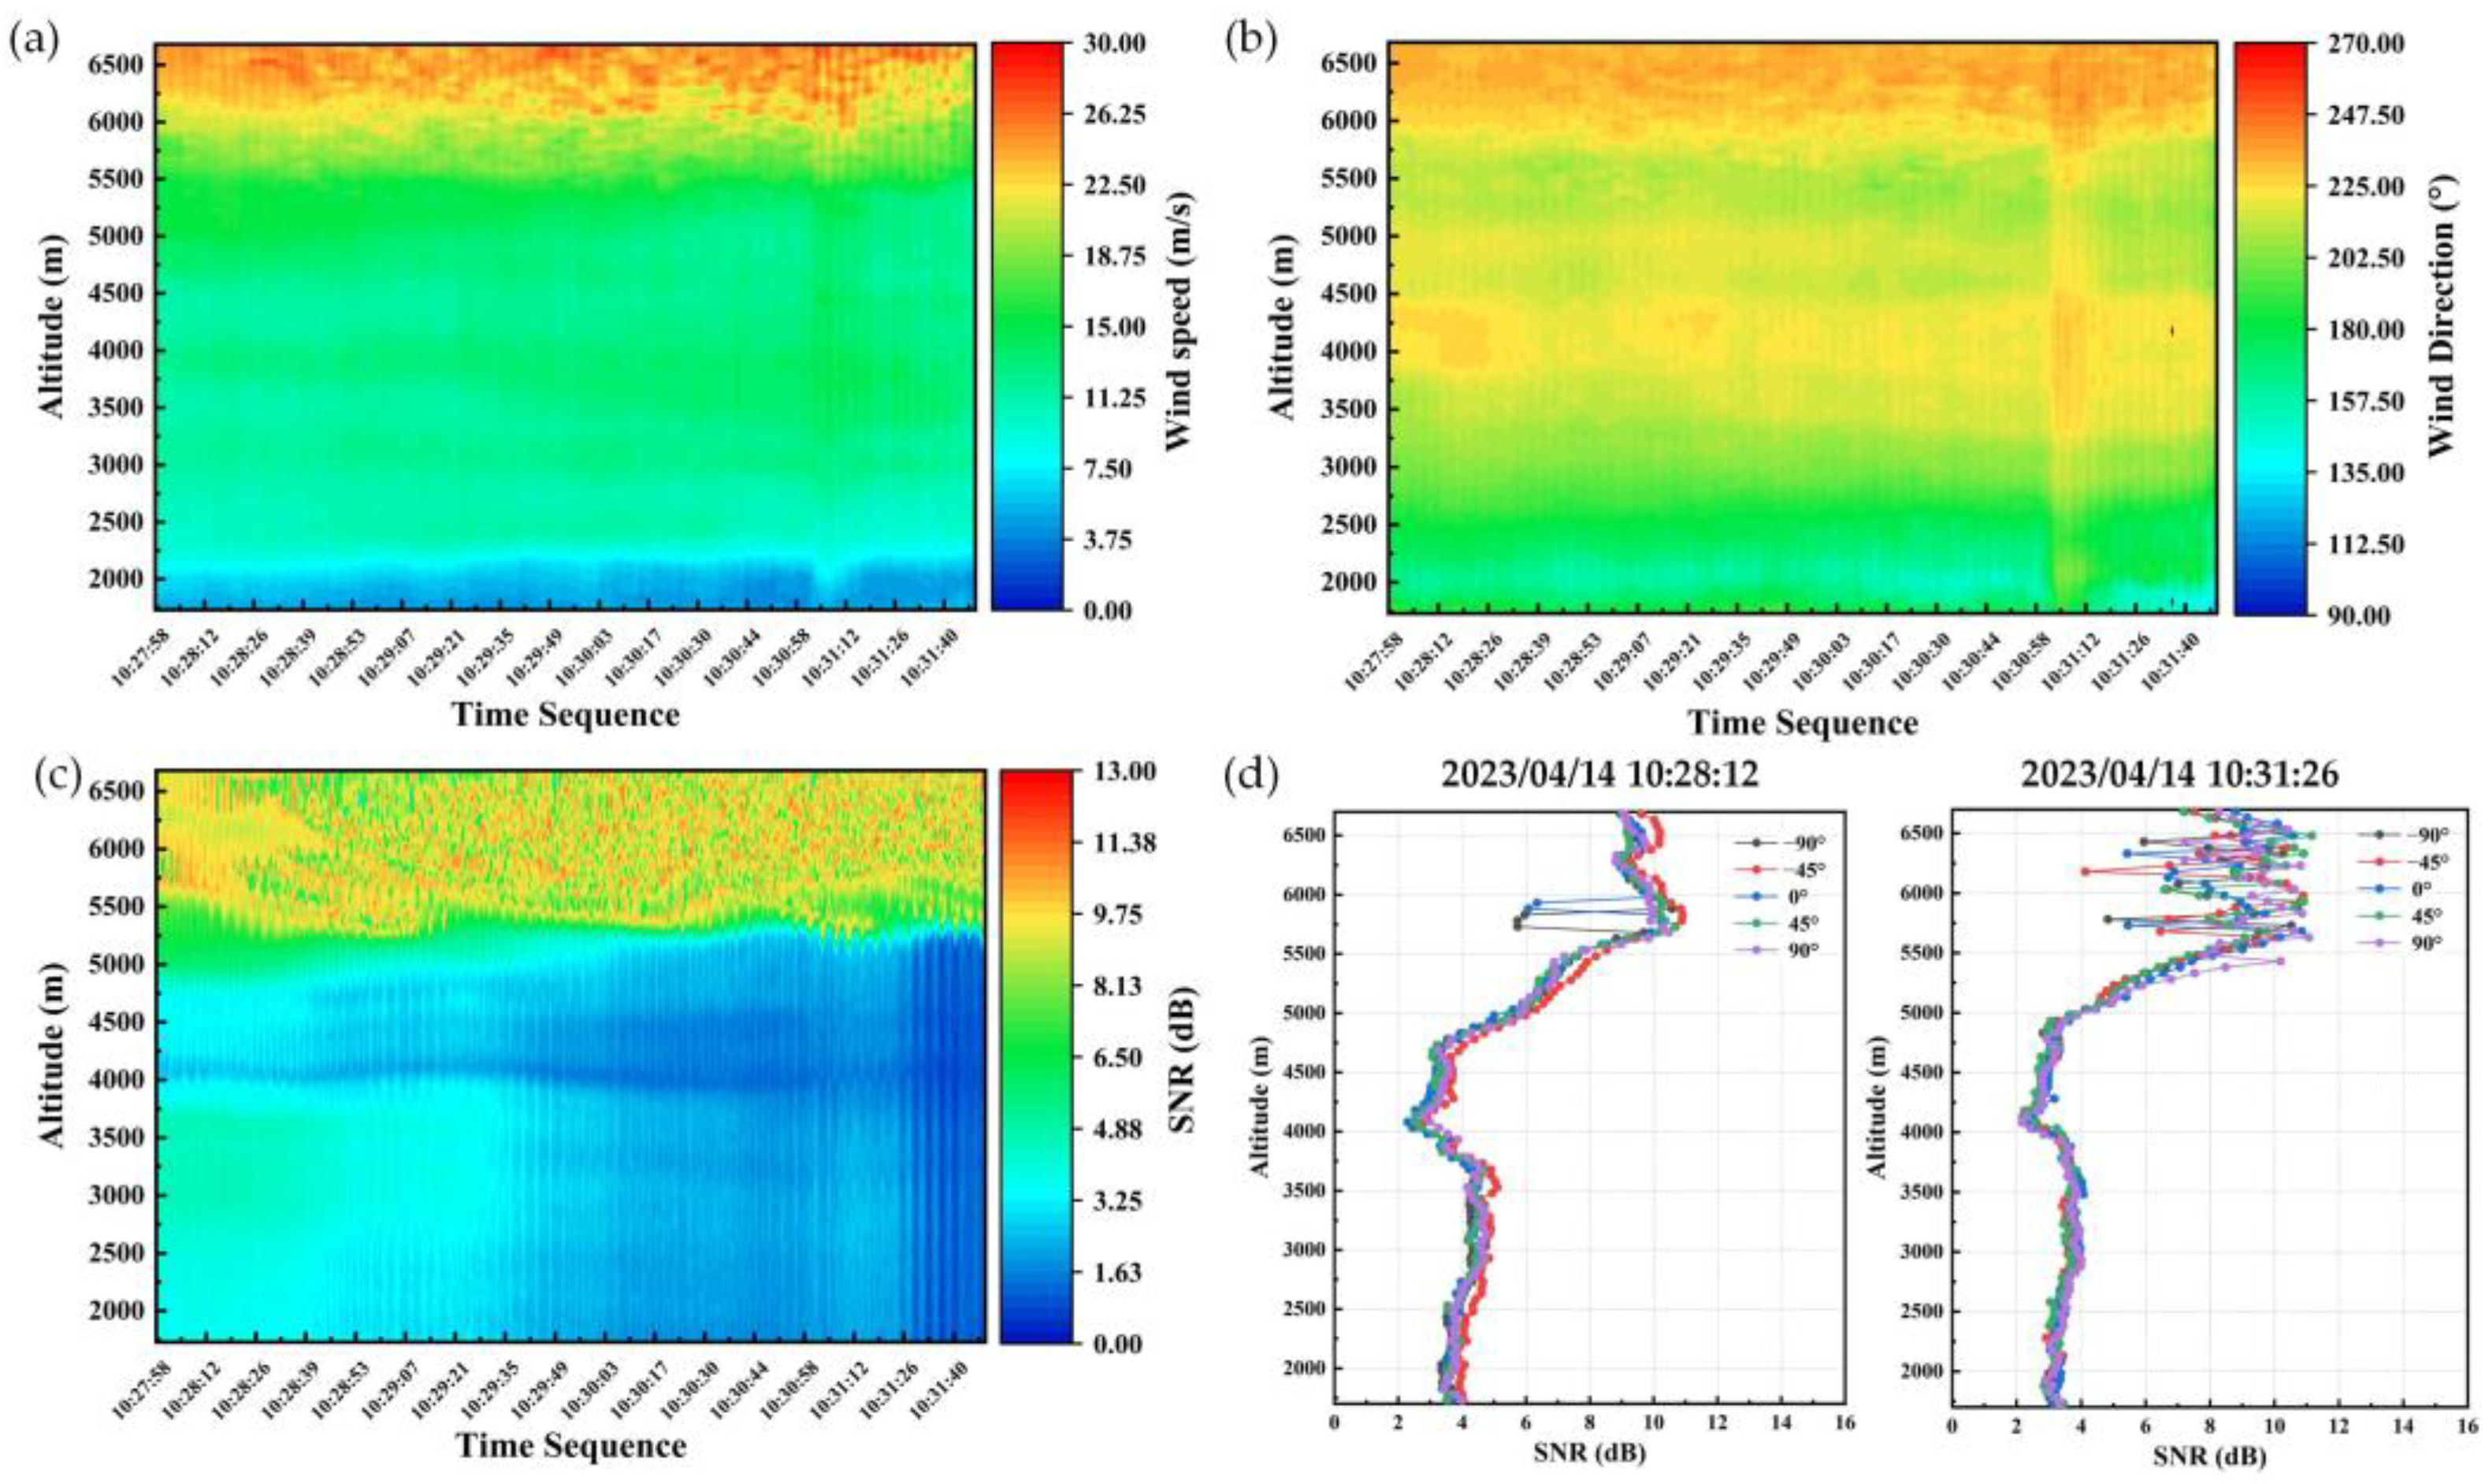
3.3. Airborne Wind Detection Events

With the verified ADWL, we conducted several airborne wind detection events to investigate the environmental information. The experiments were conducted at altitudes ranging from 5300 m to 6600 m in different sites in North China, with a specific focus on measuring horizontal wind speed and direction along the altitude. We also analyzed the SNR distributions for each LOS direction to verify meteorological factors in different atmospheric conditions. Additionally, we acquired satellite images from the open-source information provided by NASA worldview (https://worldview.earthdata.nasa.gov/, accessed on 28 January 2024), which were presented for reference alongside ADWL detection results. Importantly, satellite results provided only a macroscopic description of meteorological information and primarily served as qualitative references for wind measurements.
The airborne wind detection event on 14 April 2023 was conducted over the Bohai Sea area and Shandong Province, China. Figure 12 presents a satellite image depicting the detection area and cloud distribution, with the dotted line indicating the flight path based on longitude and latitude information from CNS. A segment of wind retrieval results at a flight altitude of approximately 6600 m is displayed in Figure 13.
The results in Figure 13 include the horizontal wind speed, the wind direction, and the SNR distribution. During the detection process, the trajectory of the airborne platform traversed regions with dense clouds. The wind field and SNR distribution were successfully identified along the altitude, offering valuable insights into cloud- and aerosol-related information. The results revealed a concentrated distribution of clouds above 5500 m. In Figure 13c, it is observed that the presence of upper clouds significantly increased the SNR compared to other range gates without causing the SNR under the clouds to fall below the detectable threshold. This phenomenon may be associated with clouds’ thickness or aerosols’ distribution along the vertical detection path. The discontinuity and dispersion of high SNR range gates characterized the sparse distribution of clouds.
The stable SNR under the clouds indicates that the laser was not entirely obstructed. Despite parameter configurations constraining the processed wind data within the altitude range of 6600 m to 1600 m, the results demonstrated effective meteorological detection. The first airborne wind retrieval experiment underscored the capability of real-time and valuable environmental information measurement. Detecting atmospheric layers is essential for weather prediction and aerosol modeling, providing valuable information about vertical stratification. The wind speed and direction results exhibited an apparent layering phenomenon, closely corresponding to the distribution of SNR in Figure 13d. A minimum value of SNR appeared at an altitude of about 4000 m, linked to the stratification along the altitude.
The airborne wind detection event on 12 May 2023 was conducted at a flight altitude of approximately 5100 m in Henan Province, China. The satellite image depicting the detection area and cloud distribution is shown in Figure 14. A segment of wind retrieval results at a flight altitude of about 5060 m is displayed in Figure 15. A clear stratification was observed near an altitude of about 4000 m, corresponding to a minimum value in SNR. Below 4000 m, the SNR exhibited a sudden increase and then gradually decreased with slight fluctuations.
Unexpected increases in SNR were observed in low-altitude areas, as shown in Figure 15. Changes in the altitude of high SNR areas were also noted along the trajectory, particularly in the altitude range of 100 m to 150 m during the time sequence from 14:32:18 to 14:33:42. The wind speed results corresponding to these areas exhibited significant consistency and were not flagged as invalid data. The trajectory passed over rural and industrial areas with a typical altitude of about 80 m, potentially leading to a complex distribution of aerosols and hard targets near the ground. These observations exhibited a certain degree of correlation with the detection results. At altitudes from 500 m to 1000 m, there were intermittent high SNR regions, as depicted in Figure 15c,d, which may be related to the boundary layer.
The detection event on 30 May 2023 was conducted at a flight altitude of approximately 6200 m in Shanxi Province, China. A satellite image depicting the detection area and cloud distribution is shown in Figure 16. The wind retrieval results are presented in Figure 17. Similar to the abovementioned results, stratification was also observed between 3500 m and 4000 m. The aircraft’s trajectory passed over Shanxi plateau areas with an average altitude higher than 1000 m. An area with high SNR was observed at altitudes lower than 1700 m, specifically in the time sequence from 19:18:41 to 19:23:35. Below the high SNR area, the SNR was lower than the threshold, and the data were recognized as invalid, which are marked in white in Figure 17a,b. By querying geographic information, this phenomenon may be influenced by mountainous terrain aligning with the relatively elevated ground-surface altitude (Lvliang Mountains).
The aerosols near the mountain were relatively concentrated, and hard targets such as mountains and trees enhanced the detected SNR. At altitudes below the mountain’s surface, due to the obstruction of the laser, the detection results were correctly measured as invalid. At altitudes above 2000 m, the wind direction results were relatively uniform and overall greater than 300°. The wind speed results showed sudden changes at 2000 m, 4000 m, and 5500 m, related to aerosol motion at different heights. These sudden changes corresponded with the SNR results, possibly providing dynamic detection references for atmospheric motion research. As illustrated in Figure 17c,d, the high SNR regions at 1500 m to 2000 m may also be related to the boundary layer.

4. Discussion

The ADWL has demonstrated its effectiveness in various verification experiments and continuous detection events conducted at flight altitudes up to 6600 m with a vertical range gate length of 50 m and achieving a data rate of 2 Hz for wind retrieval. The integration of the FPGA module and the ARM module within the core board enables automatic real-time wind retrieval processing to be conducted within the ADWL system. The intelligent processing method facilitates adaptive control, showcasing robustness during aircraft takeoff and landing stages. Additionally, the intelligent accumulation function enhances and sustains the detection range across diverse atmospheric conditions. With a weight of 20 kg and dimensions of 250 mm × 250 mm × 400 mm, the ADWL is well suited for airborne detection applications with various types of aircraft, demonstrating potential for adaptation to unmanned aerial vehicles.
The verification experiments, considering various reference instruments, provide ample evidence for assessing measurement accuracy. The accuracy and real-time performance of the wind retrieval method based on the optimized LM algorithm have been verified. Ground-based experiments, particularly during daylight hours, reveal significant changes in the wind field, highlighting the ADWL’s sensitivity to variations. When comparing the ADWL with the sounding balloon and GDWL, distinctions, particularly pronounced with the sounding balloon, may arise from differences in measurement approaches. The ADWL and GDWL, relying on Doppler frequency analysis, show disparities stemming from aerosol distribution variations at different altitudes and their impact on backscattered lasers. Both ADWL and GDWL measure wind fields with uniform spatial distribution, whereas the sounding balloon, utilizing flight time and trajectory detection, yields wind data with a certain degree of non-uniform spatial distribution. The high-speed motion of the airborne platform further amplifies these differences. Despite variations, the sounding balloon serves as a valuable reference based on different principles, enhancing the credibility of the verification experiments.
The airborne wind detection events convincingly demonstrate the reliability of ADWL in diverse environments. Relying on the backscattered laser, the performance of ADWL is greatly influenced by meteorological factors such as rain, clouds, and turbulence. As illustrated in Figure 13, the SNR sharply decreases after passing through clouds. The high SNR observed in the cloud region results from the strong backscatter signal of the clouds, which obscures the relatively weak wind field signal. If the cloud layer thickens further, the wind field beneath the cloud may become undetectable due to laser transmission loss caused by the cloud. The airborne wind detection events offer valuable data for subsequent meteorological analysis. Spanning nearly 600 km regionally and occurring over a month apart, the SNR results from three airborne wind detection events reveal a relatively stable stratification at an altitude of 4000 m, possibly representing a characteristic atmospheric distribution in the spring of the North China region. Considering the ground surface altitudes in different sites, there will be a high SNR region at about 1000 m above the ground in the three detection events, which may be related to the boundary layers. During the aircraft’s landing, we observed abnormally high SNR in the range gates below a height of about 150 m with a range gate length of 50 m. After several attempts, we determined that hard targets on the ground may cause this. Consequently, effective wind field detection with the ADWL is achieved above a flight height of about 150 m. This requires further data processing and theoretical analysis to determine its correctness. The detection of wind fields on high-speed motion platform also reveals significant spatial differences in atmospheric motion, which is rarely detected in ground-based detection.
This study marks our initial progress in airborne wind retrieval and environmental detection, focusing on a continental region. Wind measurement at low altitude in continental regions poses greater challenges due to potential disturbances from aerosols or cloud distribution, especially in areas with high human activity. Ongoing work includes refining algorithms for low-altitude wind field retrieval through characteristic signal analysis [37], updating wind retrieval methods, and establishing wind field data models to enhance the overall performance of the ADWL.

5. Conclusions

This paper presents the development and verifications of the 1550 nm all-fiber ADWL with an automatic real-time processing approach for accurate wind retrieval. Utilizing the optimized LM algorithm, the proposed wind retrieval method involves LOS wind speed calculation with platform motion compensation and 3D wind field inversion, attaining precise wind results at a data rate of 2 Hz. The intelligent processing method facilitates adaptive self-control and intelligent accumulation function, ensuring adaptability to various environmental conditions. These methods are integrated into the core board to achieve automatic real-time processing, merging the pre-processing and post-processing stages into the ADWL system. This proposed approach significantly improves system efficiency and eliminates the need for external control devices. Ground-based and airborne verification experiments validate the effectiveness of the ADWL by conducting comparison experiments with a calibrated GDWL and a sounding balloon. The results consistently exhibit wind speed and direction accuracies surpassing 0.53 m/s and 4.60°, respectively, with correlation coefficients exceeding 0.98 in all verification experiments.
With the validated ADWL installed on the aircraft, multiple airborne wind detection events were conducted in North China, revealing wind and meteorological information in diverse sites and environments. Operating at a flight altitude of up to 6600 m, the ADWL successfully investigated wind profiles and atmospheric information with a 50 m vertical resolution. The comparative analysis with reference satellite data confirmed the ADWL’s ability to identify and summarize cloud distribution and atmospheric layers, affirming its detectability. This research underscores the significant potential of ADWL in high-mobility meteorological detection.

Author Contributions

Conceptualization, C.G. and C.H.; methodology, X.Z. (Xu Zhang) and Z.L.; software, X.Z. (Xu Zhang) and L.F.; validation, X.Z. (Xinxi Zhao) and C.H.; formal analysis, X.Z. (Xu Zhang) and Z.L.; investigation, X.Z. (Xu Zhang) and Z.L.; resources, Z.L.; data curation, X.Z. (Xu Zhang) and C.H.; writing—original draft preparation, X.Z. (Xu Zhang); writing—review and editing, C.H. and C.G.; visualization, X.Z. (Xu Zhang); supervision, C.H. and Z.L.; project administration, C.G.; funding acquisition, C.G. All authors have read and agreed to the published version of the manuscript.

Funding

This research was funded by the National Natural Science Foundation of China (61627821).

Institutional Review Board Statement

Not applicable.

Informed Consent Statement

Not applicable.

Data Availability Statement

The data presented in this study are available on request from the corre-sponding author. The data are not publicly available due to unfinished experimental research. The data involved in this paper was detected by a newly developed instrument, which is only the preliminary stage of the research. The data analysis work has not been fully completed, and subsequent research still needs to be based on this data. As further progress is made in data analysis and research, we will gradually upload the data to public databases.

Acknowledgments

We acknowledge the use of imagery from the NASA Worldview application (https://worldview.earthdata.nasa.gov), part of the NASA Earth Observing System Data and Information System (EOSDIS).

Conflicts of Interest

The authors declare no conflicts of interest. Chao Han, Lin Fan, and Xinxi Zhao are employees of AVIC Taiyuan Aero-Instrument Co., Ltd. The paper reflects the views of the scientists and not the company.

References

  1. Paskin, L.; Conan, B.; Perignon, Y.; Aubrun, S. Evidence of Ocean Waves Signature in the Space–Time Turbulent Spectra of the Lower Marine Atmosphere Measured by a Scanning LiDAR. Remote Sens. 2022, 14, 3007. [Google Scholar] [CrossRef]
  2. Yuan, J.L.; Xia, H.Y.; Wei, T.W.; Wang, L.; Yue, B.; Wu, Y.B. Identifying cloud, precipitation, windshear, and turbulence by deep analysis of the power spectrum of coherent Doppler wind lidar. Opt. Express 2020, 12, 37406–37418. [Google Scholar] [CrossRef] [PubMed]
  3. Bucci, L.R.; O’Handley, C.; Emmitt, G.D.; Zhang, J.A.; Ryan, K.; Atlas, R. Validation of an Airborne Doppler Wind Lidar in Tropical Cyclones. Sensors 2018, 18, 4288. [Google Scholar] [CrossRef] [PubMed]
  4. Atlas, R.; Zhang, J.A.; Emmitt, G.D.; Bucci, L.R.; Ryan, K. Application of Doppler wind lidar observations to hurricane analysis and prediction. In Proceedings of the Lidar Remote Sensing for Environmental Monitoring 2017, San Diego, CA, USA, 6–10 August 2017. [Google Scholar] [CrossRef]
  5. Yuan, J.; Su, L.; Xia, H.; Li, Y.; Zhang, M.; Zhen, G.; Li, J. Microburst, Windshear, Gust Front, and Vortex Detection in Mega Airport Using a Single Coherent Doppler Wind Lidar. Remote Sens. 2022, 14, 1626. [Google Scholar] [CrossRef]
  6. Pîrloagă, R.; Adam, M.; Antonescu, B.; Andrei, S.; Ştefan, S. Ground-Based Measurements of Wind and Turbulence at Bucharest–Măgurele: First Results. Remote Sens. 2023, 15, 1514. [Google Scholar] [CrossRef]
  7. Han, Y.; Liu, J.; Sun, D.; Han, F.; Zhou, A.; Zhao, R.; Xue, X.; Chen, T.; Zhen, F.; Lu, Y. Fine gust front structure observed by coherent Doppler lidar at Lanzhou Airport (103°49′ E, 36°03′ N). Appl. Opt. 2020, 59, 2686–2694. [Google Scholar] [CrossRef] [PubMed]
  8. Dolfi-Bouteyre, A.; Canat, G.; Lombard, L.; Valla, M.; Durécu, A.; Besson, C. Long-range wind monitoring in real time with optimized coherent lidar. Opt. Eng. 2016, 56, 031217. [Google Scholar] [CrossRef]
  9. Sakimura, T.; Hirosawa, K.; Watanabe, Y.; Ando, T.; Kameyama, S.; Asaka, K.; Tanaka, H.; Furuta, M.; Hagio, M.; Hirano, Y.; et al. 1.55-μm high-peak, high-average-power laser amplifier using an Er,Yb:glass planar waveguide for wind sensing coherent Doppler lidar. Opt. Express 2019, 27, 24175–24187. [Google Scholar] [CrossRef] [PubMed]
  10. Wang, K.X.; Gao, C.Q.; Lin, Z.F.; Wang, Q.; Gao, M.W.; Huang, S.; Chen, C.Y. 1645 nm coherent Doppler wind lidar with a single-frequency Er:YAG laser. Opt. Express 2020, 28, 14694–14704. [Google Scholar] [CrossRef]
  11. YIM, S.H.L. Development of a 3D Real-Time Atmospheric Monitoring System (3DREAMS) Using Doppler LiDARs and Applications for Long-Term Analysis and Hot-and-Polluted Episodes. Remote Sens. 2020, 12, 1036. [Google Scholar] [CrossRef]
  12. Yuan, J.L.; Wu, Y.B.; Shu, Z.F.; Su, L.; Tang, D.W.; Yang, Y.J.; Dong, J.J.; Yu, S.F.; Zhang, Z.; Xia, H.Y. Real-Time Synchronous 3-D Detection of Air Pollution and Wind Using a Solo Coherent Doppler Wind Lidar. Remote Sens. 2022, 14, 2809. [Google Scholar] [CrossRef]
  13. Mei, L.; Wang, X.; Gong, Z.; Liu, K.; Hua, D.; Wang, X. Retrieval of the planetary boundary layer height from lidar measurements by a deep-learning method based on the wavelet covariance transform. Opt. Express 2022, 30, 16297–16312. [Google Scholar] [CrossRef] [PubMed]
  14. Chen, Y.; Jin, X.; Weng, N.; Zhu, W.; Liu, Q.; Chen, J. Simultaneous Extraction of Planetary Boundary-Layer Height and Aerosol Optical Properties from Coherent Doppler Wind Lidar. Sensors 2022, 22, 3412. [Google Scholar] [CrossRef] [PubMed]
  15. Witschas, B.; Rahm, S.; Dörnbrack, A.; Wagner, J.; Rapp, M. Airborne Wind Lidar Measurements of Vertical and Horizontal Winds for the Investigation of Orographically Induced Gravity Waves. Atmos. Ocean. Technol. 2017, 34, 1371–1386. [Google Scholar] [CrossRef]
  16. Banakh, V.A.; Smalikho, I.N. The Impact of Internal Gravity Waves on the Spectra of Turbulent Fluctuations of Vertical Wind Velocity in the Stable Atmospheric Boundary Layer. Remote Sens. 2023, 15, 2894. [Google Scholar] [CrossRef]
  17. Zhang, X.; Li, Q.; Wang, Y.; Fang, J.; Zhao, Y. Field Verification of Vehicle-Mounted All-Fiber Coherent Wind Measurement Lidar Based on Four-Beam Vertical Azimuth Display Scanning. Remote Sens. 2023, 15, 3377. [Google Scholar] [CrossRef]
  18. Salcedo-Bosch, A.; Farré-Guarné, J.; Araújo da Silva, M.P.; Rocadenbosch, F.A. Unified Formulation for the Computation of the Six-Degrees-of-Freedom-Motion-Induced Errors in Floating Doppler Wind LiDARs. Remote Sens. 2023, 15, 1478. [Google Scholar] [CrossRef]
  19. Wang, L.; Yuan, J.; Xia, H.; Zhao, L.; Wu, Y. Marine Mixed Layer Height Detection Using Ship-Borne Coherent Doppler Wind Lidar Based on Constant Turbulence Threshold. Remote Sens. 2022, 14, 745. [Google Scholar] [CrossRef]
  20. Gasch, P.; Kasic, J.; Maas, O.; Wang, Z. Advancing airborne Doppler lidar wind profiling in turbulent boundary layer flow—An LES-based optimization of traditional scanning-beam versus novel fixed-beam measurement systems. Atmos. Meas. Tech. 2023, 16, 5495–5523. [Google Scholar] [CrossRef]
  21. Banakh, V.A.; Smalikho, I.N. Lidar observations of atmospheric internal waves in the boundary layer of the atmosphere on the coast of Lake Baikal. Atmos. Meas. Tech. 2016, 9, 5239–5248. [Google Scholar] [CrossRef]
  22. Lin, R.; Guo, P.; Chen, H.; Chen, S.; Zhang, Y. Smoothed accumulated spectra based wDSWF method for real-time wind vector estimation of pulsed coherent Doppler lidar. Opt. Express 2022, 30, 180–194. [Google Scholar] [CrossRef] [PubMed]
  23. Stephan, A.; Wildmann, N.; Smalikho, I.N. Effectiveness of the MFAS Method for Determining the Wind Velocity Vector from Windcube 200s Lidar Measurements. Atmos. Ocean Opt. 2019, 32, 555–563. [Google Scholar] [CrossRef]
  24. Zhao, Y.; Yuan, L.C.; Fan, C.H.; Zhu, X.P.; Liu, J.Q.; Dai, B.; Xiao, W.G.; Zhu, X.L.; Chen, W.B. Wind retrieval for genetic algorithm-based coherent Doppler wind lidar employing airborne platform. Appl. Phys. B 2023, 129, 36. [Google Scholar] [CrossRef]
  25. Zhou, Y.L.; Li, L.; Wang, K.X.; Zhang, X.; Gao, C.Q. Coherent Doppler wind lidar signal denoising adopting variational mode decomposition based on honey badger algorithm. Opt. Express 2022, 30, 25774–25787. [Google Scholar] [CrossRef] [PubMed]
  26. Kelberlau, F.; Neshaug, V.; Lønseth, L.; Bracchi, T.; Mann, J. Taking the Motion out of Floating Lidar: Turbulence Intensity Estimates with a Continuous-Wave Wind Lidar. Remote Sens. 2020, 12, 898. [Google Scholar] [CrossRef]
  27. Kotake, N.; Sakamaki, H.; Imaki, M.; Miwa, Y.; Ando, T.; Yabugaki, Y.; Enjo, M.; Kameyama, S. Intelligent and compact coherent Doppler lidar with fiber-based configuration for robust wind sensing in various atmospheric and environmental conditions. Opt. Express 2022, 30, 20038–20062. [Google Scholar] [CrossRef]
  28. Kavaya, M.; Beyon, J.; Koch, G.; Petros, M.; Petzar, P.; Singh, U.; Trieu, B.; Yu, J. The Doppler Aerosol Wind (DAWN) Airborne, Wind-Profiling Coherent-Detection Lidar System: Overview and Preliminary Flight Results. J. Atmos. Ocean. Technol. 2014, 31, 826–842. [Google Scholar] [CrossRef]
  29. Greco, S.; Emmitt, G.D.; Garstang, M.; Kavaya, M. Doppler Aerosol WiNd (DAWN) Lidar during CPEX 2017: Instrument Performance and Data Utility. Remote Sens. 2020, 12, 2951. [Google Scholar] [CrossRef]
  30. Zhang, H.; Wu, S.; Wang, Q.; Liu, B.; Yin, B.; Zhai, X. Airport low-level wind shear lidar observation at Beijing Capital International Airport. Infrared Phys. Technol. 2019, 96, 113–122. [Google Scholar] [CrossRef]
  31. Liang, C.; Wang, C.; Xue, X.H.; Dou, X.K.; Chen, T.D. Meter-scale and sub-second-resolution coherent Doppler wind LIDAR and hyperfine wind observation. Opt. Lett. 2022, 47, 3179–3182. [Google Scholar] [CrossRef]
  32. Liu, Z.; Barlow, J.F.; Chan, P.-W.; Fung, J.C.H.; Li, Y.; Ren, C.; Mak, H.W.L.; Ng, E. A Review of Progress and Applications of Pulsed Doppler Wind LiDARs. Remote Sens. 2019, 11, 2522. [Google Scholar] [CrossRef]
  33. Saklakova, V.; Han, Y.L.; Zhang, S.H.; Qin, Z.; Xue, X.H.; Chen, T.D.; Sun, D.S.; Zhao, Y.M.; Zheng, J. Field programmable gate array-based coherent lidar employing the ordinal statistics method for fast Doppler frequency determination. Opt. Eng. 2022, 61, 124102. [Google Scholar] [CrossRef]
  34. Augere, B.; Valla, M.; Durécu, A.; Dolfi-Bouteyre, A.; Goular, D.; Gustave, F.; Planchat, C.; Fleury, D.; Huet, T.; Besson, C. Three-Dimensional Wind Measurements with the Fibered Airborne Coherent Doppler Wind Lidar LIVE. Atmosphere 2019, 10, 549. [Google Scholar] [CrossRef]
  35. Wei, T.W.; Xia, H.Y.; Wu, Y.B.; Yuan, J.L.; Wang, C.; Dou, X. Inversion probability enhancement of all-fiber CDWL by noise modeling and robust fitting. Opt. Express 2020, 28, 29662–29675. [Google Scholar] [CrossRef] [PubMed]
  36. Peña, A.; Mann, J.; Angelou, N.; Jacobsen, A. A Motion-Correction Method for Turbulence Estimates from Floating Lidars. Remote Sens. 2022, 14, 6065. [Google Scholar] [CrossRef]
  37. Godwin, K.S.; De Wekker, S.F.J.; Emmitt, G.D. Retrieving Winds in the Surface Layer over Land Using an Airborne Doppler Lidar. J. Atmos. Ocean. Technol. 2012, 29, 487–499. [Google Scholar] [CrossRef]
Figure 1. The schematic diagram of the ADWL system. AOM: acousto-optic modulator; EDFA: erbium-doped fiber amplifier; OS: optical splitter; OC: optical circulator; FC: fiber coupler.
Atmosphere 15 00536 g001
Figure 2. The schematic diagram of the functional zoning and processing flow in the core board.
Atmosphere 15 00536 g002
Figure 3. (a) The flowchart of the LOS wind speed calculation; (b) the schematic diagram of the platform motion and the ADWL scanning mode.
Atmosphere 15 00536 g003
Figure 4. A brief flowchart of the intelligent processing method.
Atmosphere 15 00536 g004
Figure 5. (a) The schematic and (b) the brief flowchart of the intelligent accumulation.
Atmosphere 15 00536 g005
Figure 6. The ground-based experiment site and the ADWL.
Atmosphere 15 00536 g006
Figure 7. The ground-based verification results between ADWL and GDWL: (a) the horizontal wind speed; (b) the horizontal wind direction.
Atmosphere 15 00536 g007
Figure 8. Linear analysis between the ADWL and GDWL: (ac) are the analysis of the horizontal wind speed; (df) are the analysis of the horizontal wind direction.
Atmosphere 15 00536 g008
Figure 9. The evaluation of the intelligent accumulation function: (a) an example of the detected LOS wind speed distribution; (b) the data availability during the vertical detection.
Atmosphere 15 00536 g009
Figure 10. (a) Horizontal wind speed detected by ADWL, sounding balloon, and GDWL; (b) horizontal wind direction detected by ADWL, sounding balloon, and GDWL.
Atmosphere 15 00536 g010
Figure 11. (a) Linear analysis of wind speed between the ADWL and the sounding balloon; (b) linear analysis of wind direction between the ADWL and the sounding balloon; (c) linear analysis of wind speed between the ADWL and the GDWL; (d) linear analysis of wind direction between the ADWL and the GDWL.
Atmosphere 15 00536 g011
Figure 12. The satellite image in the airborne wind detection event on 14 April 2023 from NASA worldview.
Atmosphere 15 00536 g012
Figure 13. The wind retrieval results in the airborne wind detection event on 14 April 2023: (a) horizontal wind speed; (b) horizontal wind direction; (c) SNR distribution; (d) SNR profiles along the altitude.
Atmosphere 15 00536 g013
Figure 14. The satellite image in the airborne wind detection event on 12 May 2023 from NASA worldview.
Atmosphere 15 00536 g014
Figure 15. The wind retrieval results in the airborne wind detection event on 12 May 2023: (a) horizontal wind speed; (b) horizontal wind direction; (c) SNR distribution; (d) SNR profiles along the altitude.
Atmosphere 15 00536 g015
Figure 16. The satellite image in the airborne wind detection event on 30 May 2023 from NASA worldview.
Atmosphere 15 00536 g016
Figure 17. The wind retrieval results in the airborne wind detection event on 30 May 2023: (a) horizontal wind speed; (b) horizontal wind direction; (c) SNR distribution; (d) SNR profiles along the altitude.
Atmosphere 15 00536 g017
Table 1. The ADWL system parameters.
ParameterValue
Laser wavelength1550 nm
Maximum pulse energy300 μJ
Pulse width100~600 ns selectable
Pulse repetition frequency10 kHz
Optical antenna aperture100 mm
Vertical range resolution50 m
Nadir angle20°
Sampling frequency400 MHz
Data rate2 Hz
Weight~20 kg
Size250 mm × 250 mm × 400 mm
Consumption≤200 W
Table 2. The GDWL system parameters.
ParameterValue
Laser wavelength1550 nm
Pulse repetition frequency10 kHz
Measurement range80~5000 m (maximum)
Wind speed detection range−55~55 m/s
Optical antenna aperture100 mm
Range resolution22.5 m
LOS wind measurement accuracy≤0.1 m/s
Wind direction accuracy≤3°
Nadir angle20°
Data rate1 Hz
Scanning modeVAD
Disclaimer/Publisher’s Note: The statements, opinions and data contained in all publications are solely those of the individual author(s) and contributor(s) and not of MDPI and/or the editor(s). MDPI and/or the editor(s) disclaim responsibility for any injury to people or property resulting from any ideas, methods, instructions or products referred to in the content.

