
Optimizing Nitrogen Fertilizer Management Enhances Rice Yield, Dry Matter, and Nitrogen Use Efficiency

1
College of Agriculture, Hunan Agricultural University, Changsha 410125, China
2
College of Agriculture Forestry Science and Technology, Hunan Applied Technology University, Changde 415000, China
3
Shaoyang Seed Management Office, Shaoyang 422000, China
*
Author to whom correspondence should be addressed.
Agronomy 2024, 14(5), 919; https://0-doi-org.brum.beds.ac.uk/10.3390/agronomy14050919
Submission received: 4 April 2024
/
Revised: 23 April 2024
/
Accepted: 23 April 2024
/
Published: 27 April 2024
(This article belongs to the Special Issue Fertigation Effects on Water and Nutrient Use Efficiency for Agro-Crop Plants)
Abstract
:Optimizing nitrogen fertilizer management can effectively improve soil ecology, promote agricultural production, and increase the income of farmers and workers. Nitrogen fertilizer is an important factor in the growth and development of rice, and it is important to find out the optimal amount and frequency of fertilizer application for the super-hybrid early rice ‘Zhu LiangYou 819’ in Hunan Province, to give full play to its high quality and high yield characteristics. Various N fertilizer application frequencies (P1, basal–tiller fertilizer = 5:5; P2, basal–tiller–spike fertilizer = 4:3:3; P3, basal–tiller–spike–grain fertilizer = 4:3:2:1) and N application amounts (N1, 90 kg ha−1; N2, 150 kg ha−1; N3, 210 kg ha−1) were applied to the hybrid rice ZLY819. The results show that, under the same frequency of N application, ZLY819 had the highest yield, agronomic efficiency, and physiological utilization rate of N fertilizer with the N2 treatment, averaging 7.53 t ha−1, 18.10 kg kg−1, and 34.34%, respectively, with the yield under N2 being 19.38% higher than that under N1. For the same amount of N application, the yield, agronomic efficiency, partial factor productivity of N (PFPN), N contribution to seed, and N use efficiency (NUE) increased with an increase in the frequency of N application, mainly in the order of P3 > P2 > P1, whereby the yield of P3 was 10.11% higher than that of P1. According to the regression equation, the yield is higher when the amount of nitrogen application is 202.15 kg ha−1 and the fertilization frequency is four times. Appropriate N fertilizer management (P3N2) improved the rice growth characteristics, dry matter accumulation, crop growth rate, dry matter transport rate, dry matter contribution rate, and NUE, thus promoting an increase in the rice yield and efficient use of nitrogen.
1. Introduction
Rice is an important staple food crop for most of the world’s population [1]. With the limited arable land resources, there is a need to increase the rice yield per unit area if the demands of a growing population are to be met. Nitrogen (N) is a major factor in maintaining stable and high rice yields. However, the overapplication of N fertilizer in rice fields in China has resulted in N loss and environmental pollution, leading to low fertilizer utilization and unstable yields [2]. The average rate of N fertilizer application to rice in China increased from 145 kg ha−1 in the 1970s to its current value of 360 kg ha−1, which is much higher than the global average. Inappropriate fertilization patterns and the overuse of N fertilizers have led to ammonia (NH3) volatilization and soil acidification [3,4], thus contributing to environmental pollution.
In recent years, many scholars have proposed strategies to optimize N fertilizer management and conducted experiments on field production, such as N fertilizer management at specific locations, integrated soil–crop system management, and chasing spike fertilizer. Good and effective measures can reduce N loss and increase NUE, such as by applying additional N fertilizer at later growth stages [3], adjusting N use according to the chlorophyll content [5], applying controlled-release N fertilizers [6], using urease inhibitors [7], planting high-efficiency rice varieties [8], and applying a combination of organic and inorganic fertilizers [9]. However, higher prices (e.g., controlled-release fertilizers and organic fertilizers) and the need for training in relevant agricultural production knowledge or additional labor inputs (e.g., late follow-up application of N fertilizers) constrain the diffusion of these technologies. At the same time, the population of farmers growing food is declining and aging, and the price of labor is rising. This has led farmers and the government to prefer simple and easy fertilization patterns, such as one-time basal application or basal and tiller fertilization together, as ways to ensure that yields do not decrease.
The frequency and amount of N applied play key roles in influencing plant growth and nutrient uptake [9]. NUE is an important index of N uptake in rice, and it can be used as a reference value in N applications to rice during field production. N application has a significant impact on rice growth and development, NUE, and yield. An increase in the application of N to within a certain range can improve N uptake and utilization in rice and, at the same time, have an effect on the N in the soil [10]. The excessive application of N for plant growth tends to lead to a decline in the N absorption and utilization efficiency, and this is the main factor for excess N in soil, simultaneously causing serious soil and ecological environmental pollution [11]. In addition, it is not conducive to the sustainable development of farmland. Some studies have shown that increasing the number of N applications can improve the total yield and NUE of rice [12]. Wu et al. [13] found that the application of nitrogen fertilizer as a basal–tiller and ear fertilizer is beneficial for improving rice panicle formation rate, dry matter accumulation, and leaf area index in the middle and late stages. Bai et al. [14] found that applications of nitrogen fertilizer as a basal–tiller and ear fertilizer are beneficial for improving leaf area index, dry matter accumulation, and population quality, and coordinating various yield components. Pan et al. [15] found that under the same amount of nitrogen, when the ratio of basal–tiller fertilizer and ear fertilizer was 30%:20%:50%, the nitrogen absorption and utilization rate, and soil residual rate, increased, and the nitrogen loss rate decreased.
The optimal nitrogen application model for rice varies in different regions, and the same optimal nitrogen application model cannot meet the needs of all regions. Developing the optimal fertilization mode based on the nitrogen requirements of different regions is of great significance for efficient crop production and agricultural pollution control. There have been more studies on the effects of nitrogen application on rice yield, quality, and nitrogen utilization. However, the simultaneous effect of the amount and frequency of N applications on growth characteristics, yield, and N use efficiency of super-hybrid early rice ‘ZLY819’ has not been studied thoroughly enough. Hunan is a large province of double-season rice production in China. ZLY819 has the characteristics of ripening early, high spike rate, high biological yield, high seed setting rate, and high yield, which can be better applied to the practice of double-season rice production in Hunan Province. Accordingly, this study investigated the effect of N application frequencies and rates on the yield, growth characteristics, and NUE of rice, aiming to determine the optimal frequency and amount of N applications, explore the mechanism of N application’s impact on the high yield of rice in Southern China, and provide a theoretical basis for obtaining both high yield and high efficiency in rice.
2. Materials and Methods
2.1. Field Management
The entire field experiment was conducted in 2020–2021 in Zhongtang village, Bijia mountain, Heshan district, Yiyang city (28°30′15″ N, 112°20′18″ E), using a randomized block design. The experimental field is a periodical waterlogged paddy soil, acidic, with a long history of double-cropping rice and idle fields in winter. The ‘ZLY819’ was used as the experimental material. It has a moderate plant shape, medium thick stalks, vigorous growth, strong tillering ability, high spike rate, neat spiking, and good maturity and color setting. Two factors were applied as follows: the amount of N and the number of N applications. The following three amounts of N were applied: 90 kg ha−1 (N1), 150 kg ha−1 (N2), and 210 kg ha−1 (N3). The following numbers of N applications were used: basal fertilizer–tiller fertilizer = 5:5 (P1); basal fertilizer–tiller fertilizer–spike fertilizer = 4:3:3 (P2); and basal fertilizer–tiller fertilizer–spike fertilizer–grain fertilizer = 4:3:2:1 (P3). Together with one treatment without N fertilizer (N0), there were ten treatment combinations. Each treatment had three replications, for a total of 30 plots, with a plot area of 20 m2, length of 5 m, width of 4 m, and row spacing of 16.7 cm × 20 cm. The amounts of phosphorus and potassium fertilizers applied to each treatment were equal, using P2O5 75 kg ha−1 for the phosphorus fertilizer and K2O 180 kg ha−1 for the potassium fertilizer. The base fertilizer was applied one day before transplanting, the tiller fertilizer was applied seven days after transplanting, the spike fertilizer was applied at the appearance of inverted 3.5 leaves, and the grain fertilizer was applied at the beginning of the spike. The N fertilizer was applied with urea (containing 46% N), the phosphorus fertilizer was applied with calcium superphosphate (containing 12% P2O5) as the base fertilizer, and the potash fertilizer was applied with potassium chloride (containing 60% K2O) as the base fertilizer and tiller fertilizer in equal amounts. The other management measures were the same as those of the field production. Each plot is irrigated independently. Inter-treatment ridging is separated by plastic film to prevent leakage of fertilizer. The field was carefully managed to control and prevent the occurrence of pests and diseases over time. Specific fertilizer applications are shown in Table 1 below.
2.2. Measurement Content and Methodology
2.2.1. Soil Samples Were Taken before the Test to Determine the Basic Fertility Test
A five-point sampling method was used to sample the tillage soil before plowing the rice field. The soil samples were naturally dried, pulverized, sieved, and then used for the analysis of the soil’s physical and chemical indexes.
Soil total nitrogen was determined by the Kjeldahl method; organic substance was determined by the potassium dichromate external heating method; pH value was determined by the acidimeter method; soil available nitrogen was determined by the alkaline diffusion method; soil available phosphorus was determined by the molybdenum–antimony colorimetric method; and available potassium was determined by the 1 mol L−1 NH4OAc extraction-flame photometric method. The experimental field was a clay soil with a pH value of 5.20, organic matter content of 43.64 g kg−1, total nitrogen of 2.63 g kg−1, total potassium of 19.12 g kg−1, total phosphorus of 0.60 g kg−1, available N of 145.98 mg kg−1, available phosphorus of 37.44 mg kg−1, and available potassium of 138.11 mg kg−1.
2.2.2. Population Growth Dynamics
After turning green, each plot was prepared with 10 holes, and the number of tillers was measured every 5–6 days until tillering ceased. At the maturity stage, 80 rice plants were determined to be the effective tillering number and the number of productive ears. The invalid tillering number is the difference between the maximum number of tillers and the effective number of tillers, and the spike rate is the percentage of effective spikes to the maximum number of tillers.
2.2.3. Leaf Area Index (LAI)
In the tillering, boot, heading, filling, and maturity stages, two plants were removed from each plot according to the average number of stems and brought back to the laboratory, and all leaves that were green were cut off. The leaf area was determined using the aspect coefficient method, and the leaf area index was calculated.
2.2.4. Dry Matter Determination
In the rice tillering, boot, heading, filling, and maturity stages, two representative samples from each plot were taken according to the average number of stems. The roots were removed, and the stems, leaves, and spikes were washed, separated, and then placed in an oven at 105 °C for 30 min, after which they were dried at 80 °C until reaching a constant weight. Then, they were weighed using an electronic balance after cooling down to room temperature. Aboveground dry matter is that portion of dry matter other than roots.
2.2.5. Determination of Nitrogen Content and Calculation of Related Indicators
In different reproductive periods, plants in each treatment were cut off at the roots and divided into leaves, stem sheaths, and spikes (after spiking) according to the different organs. The plants were dried, weighed, crushed, and digested at approximately 270 °C using the H2SO4-H2O2 method. The N content was determined using a Kjeldahl nitrogen meter, and indicators related to nitrogen use were calculated according to the methodologies of Peng S.B. et al. [16].
N uptake (kg ha−1) = Dry weight of leaf (kg ha−1) × N concentration of leaf (kg N ha−1) + Dry weight in stem and sheath × N content in stem and sheath + Dry weight of panicle × N content of panicle
N use efficiency (NUE, %) = (N uptake in N applied area (kg N ha−1) − N uptake in no N applied area)(kg N ha−1)/N applied(kg N ha−1) × 100
Physiological utilization rate of N(%) = (Yield in N applied area − Yield in no N applied area)/(N uptake in N applied area − N uptake in no N applied area) × 100
Agronomic efficiency of N(AEN, kg kg−1) = (Yield in N applied area − Yield in no N applied area)/Amount of N applied
Partial factor productivity of N (PFPN, kg kg−1) = Grain yield in N application area/N applied
Harvest index of N (HIN) = N accumulation per unit area of plant spike at maturity/total plant N accumulation
N phase uptake (kg ha−1) = N uptake in the later period − N uptake in the earlier period
N transportation of stem sheath (leaf) (kg ha−1) = N accumulation of stem sheath (leaf) at flush stage − N accumulation of stem sheath (leaf) at maturity stage
N translocation rate of stem sheath (leaf) (%) = [N transportation of stem sheath (leaf)/N accumulation of stem sheath (leaf) at the heading stage] × 100
Contribution of stem sheaths (leaves) (%) = [N transportation of stem sheath (leaf)/N accumulation of spike at maturity stage] × 100
2.2.6. Determination of Yield
The subdivisions were harvested and sunned to calculate the actual yields. The yields were converted at a moisture content of 13.5%.
2.2.7. Data Processing
WPS Office was used to collate the data, Statistix 8.0 statistical software was used to analyze the data by ANOVA, and the LSD method was used for multiple comparisons, with the F-test or the parallel test set at a level of 0.05. The graphs were prepared using GraphPad Prism 10.1.2 or WPS Office, with the standard deviation (SD) of each mean shown as an error bar.
3. Results
3.1. Effect of N Fertilizer Management on the Yield of ZLY819
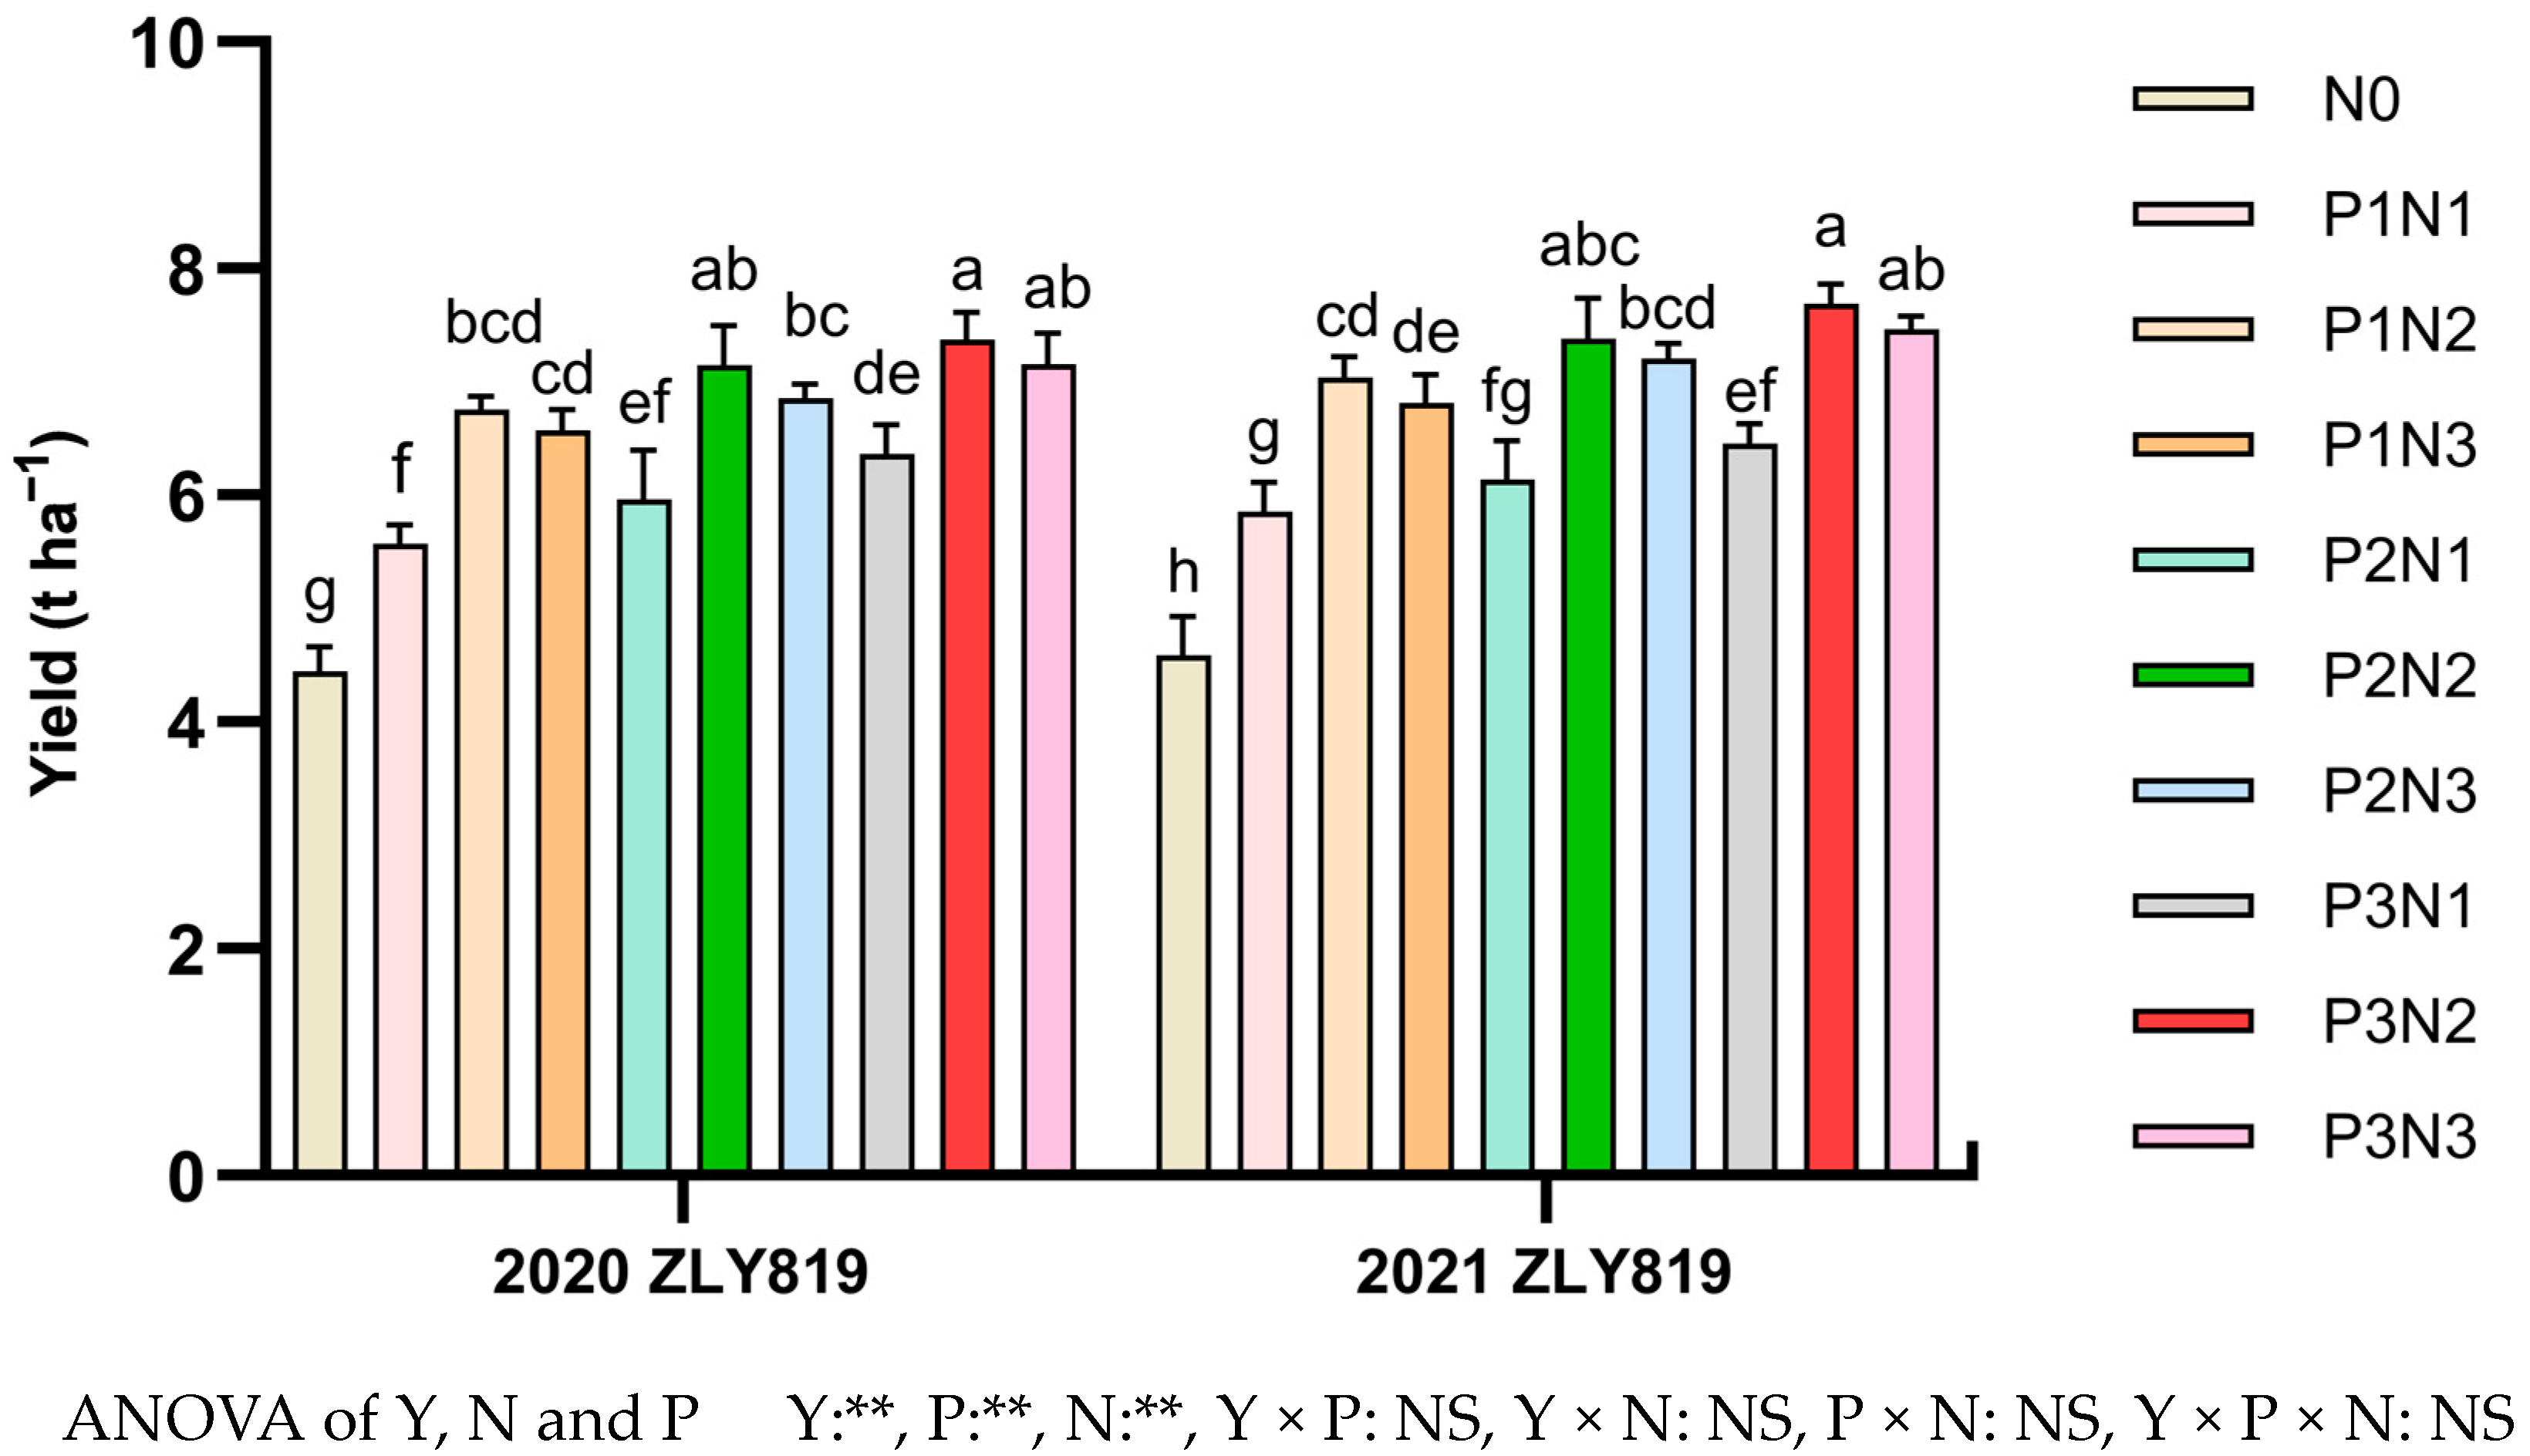
Under the same N application frequency, the rice yield showed a trend of increasing and then decreasing with an increase in the amount of N application; i.e., the highest yield was obtained with the P3 treatment. Under the same amount of N application, the rice yield increased with an increase in the frequency of N applications, indicating that the yield was highest with the P3 treatment. The maximum yield of 7.37–7.69 t ha−1 was obtained with the P3N2 treatment. N2 increased the yield of ZLY819 by 59.67% in 2020 and 60.58% in 2021 compared with the yield under the N0 treatment, and the difference between the two treatments was significant (Figure 1). With the increase in the amount of N, the yield decreased for N3, and although the difference with N2 was nonsignificant, the yield was not as high. It can be seen that the excessive application of fertilizer did not increase the yield but rather caused a decrease. Under the same amount of N, the yield increased with the increase in the number of N applications, mainly in the order P3 > P2 > P1. Under the P3 treatment, the annual average yield of ZLY819 was 10.11% higher than that of the P1 treatment.
3.2. Effects of N Fertilizer Management on the Dynamics of the Tiller Number and Spike Formation Rate of ZLY819
As the reproductive period progressed, the rice tiller values showed an increasing and then decreasing trend, and the treatments performed consistently over the two years. Under the same frequency of N applications, the number of overall rice tillers in each treatment showed an increasing trend with an increase in the amount of N application, i.e., N1 < N2 < N3 (Figure 2). The highest tiller number of 16.68 was recorded in the N3 treatment on 1 June, which was 11.93 and 19.32% higher than N2 and N1, respectively. The tiller number per plant of ZLY819 was the highest with the P3 treatment for the same amount of N application. Among them, the highest tiller number was 4.39 in the P3 treatment on 1 June, which was 6.02% higher than that of P2. In conclusion, a higher number of tillers were obtained with the P3N3 treatment.
Both the frequency and amount of the N application affected the spike formation rate in ZLY819. As can be seen in Figure 3, the ZLY819 plants with the same frequency of N application under different amounts of N application showed a decrease in the spike rate with an increase in the amount of N application; i.e., N3 had the lowest spike rate of 75.81%, and the difference among the treatments was nonsignificant. Under the same amounts and different frequencies of N applications, the spike rate gradually increased with an increase in the frequency of N application, and the highest number of spikes was 82.12% in the P3 treatment. The spike rate P3 was 7.07% higher than that of P1, and the spike rate of P2 was 4.34% higher than that of P1. The increased amount of N application in the later stage reduced the number of tillers and ensured the spike rate of the stem tillers. The P3 treatment balanced the N level throughout the whole reproductive period in ZLY819 such that the rice had an optimal population of seedlings and spike rate. Although the P1 treatment had a sufficient supply of N in the early stage, less N fertilizer in the later stage caused a reduction in the peak seedling number, effective tillers, and the spike rate. Over the two years, according to the change trends of the ZLY819, it can be seen that the appropriate frequency and amount of N application can improve the spike rate of rice, which, in turn, ensures an increase in the yield.
3.3. Effect of N Fertilizer Management on Plant Height in ZLY819
As can be observed in Table S1, the trends in the two-year data for ZLY819 are basically the same, and the frequency and amount of the N application had an effect on plant height. With the same frequency but different amounts of N application, plant height increased with an increase in the amount of N application; i.e., plant height was the tallest with the N3 treatment. The plant height of N3 was 5.46%, 6.57%, 5.32%, 5.28%, and 5.95% higher than that of N1, and the plant height of N2 was 3.52%, 4.84%, 4.04%, 3.97%, and 4.50% higher than that of N1 at the tillering, booting, heading, filling, and maturity stages, respectively. The difference between the N3 treatment (210 kg ha−1) and the N2 treatment was nonsignificant. With the same amount of N application, the plant height increased gradually with an increase in the number of N applications for all treatments, indicating P1 < P2 < P3; i.e., the maximum plant height was found with the basal–tiller–spike–grain fertilizer = 4:3:2:1 (P3) treatment. The plant height of P3 was 17.86%, 14.96%, 14.91%, and 15.49% higher than that of P1, and 9.04%, 6.74%, 7.20%, and 9.52% higher than that of P2 at the tillering, booting, heading, and filling stages, respectively. The interaction between the frequency and the amount of N application had a significant influence on the plant height.
3.4. Effect of N Fertilizer Management on the LAI in ZLY819
From the tillering to filling stages, the LAI of the rice showed an increasing and then decreasing trend. The highest LAI was observed in the heading stage, followed by a decreasing trend, which was consistent across the treatments for both years. LAI of N3 was 37.44%, 21.53%, 28.30%, and 30.58% higher than that of N1, and LAI of N2 was 21.39%, 14.16%, 25.14%, and 17.97% higher than that of N1 at the tillering, booting, heading, and filling stages, respectively. Under the same frequency of N application, the LAI of the rice for all treatments showed an increase with an increase in the amount of the N application, i.e., N1 < N2 < N3 (Figure 4). For same amount of N application, the LAI of ZLY819 was highest with the P3 treatment. It was 17.86%, 14.96%, 14.91%, and 15.49% higher than that of P1, and 9.04%, 6.74%, 7.20%, and 9.52% higher than that of P2 at the tillering, booting, heading, and filling stages, respectively. In short, ZLY819 achieved a greater LAI with the P3N3 treatment.
3.5. Effect of N Fertilizer Management on Aboveground Biomass of ZLY819
According to Table S2, the interactions between the same frequency and amount of N application to ZLY819 were nonsignificant for the aboveground biomass of the rice in all periods. The frequency of the N applications had a more significant effect on the aboveground biomass in the tillering stage, with a remarkable effect on the biomass in the heading, filling, and maturity stages; however, it had a nonsignificant effect on the rice in the reproductive stage. The N application had a nonsignificant effect on the aboveground biomass in the tillering and spike stages of the ZLY819 and a highly significant effect in the later stage of fertility. The effect on biomass accumulation of the amount of the N application was greater than the frequency in these three periods. With the same frequency but different amounts of N application, the differences in the biomass among the treatments were nonsignificant in the tillering and boot stages, but the highest values were obtained under the N3 or N2 treatment, with N3 in the tillering stage averaging 1.93% and 14.51% higher than N2 and N1, respectively. The mean biomass of P2 was the lowest in 2020 in the boot stage, whereas it was the highest in 2021. In the heading, filling, and maturity stages, with increasing amounts of N application the biomass was highest under the N2 or N3 treatment, and the differences between the N2 and N3 treatments were nonsignificant. It can be seen that the excessive application of N increased the aboveground biomass to a lesser extent, and it even tended to decrease.
With the same amount but different frequencies of N application, the biomass tended to increase with the frequency of N application in the heading, filling, and maturity stages, which was mainly manifested as P1 < P2 < P3, with P3’s average higher than that of P2 and P1 by 4.52% and 4.73% in the heading stage, 1.29% and 7.24% in the filling stage, and 2.40% and 6.59% in the maturity stage, respectively.
3.6. Effect of N Fertilizer Management on Dry Matter Accumulation of ZLY819
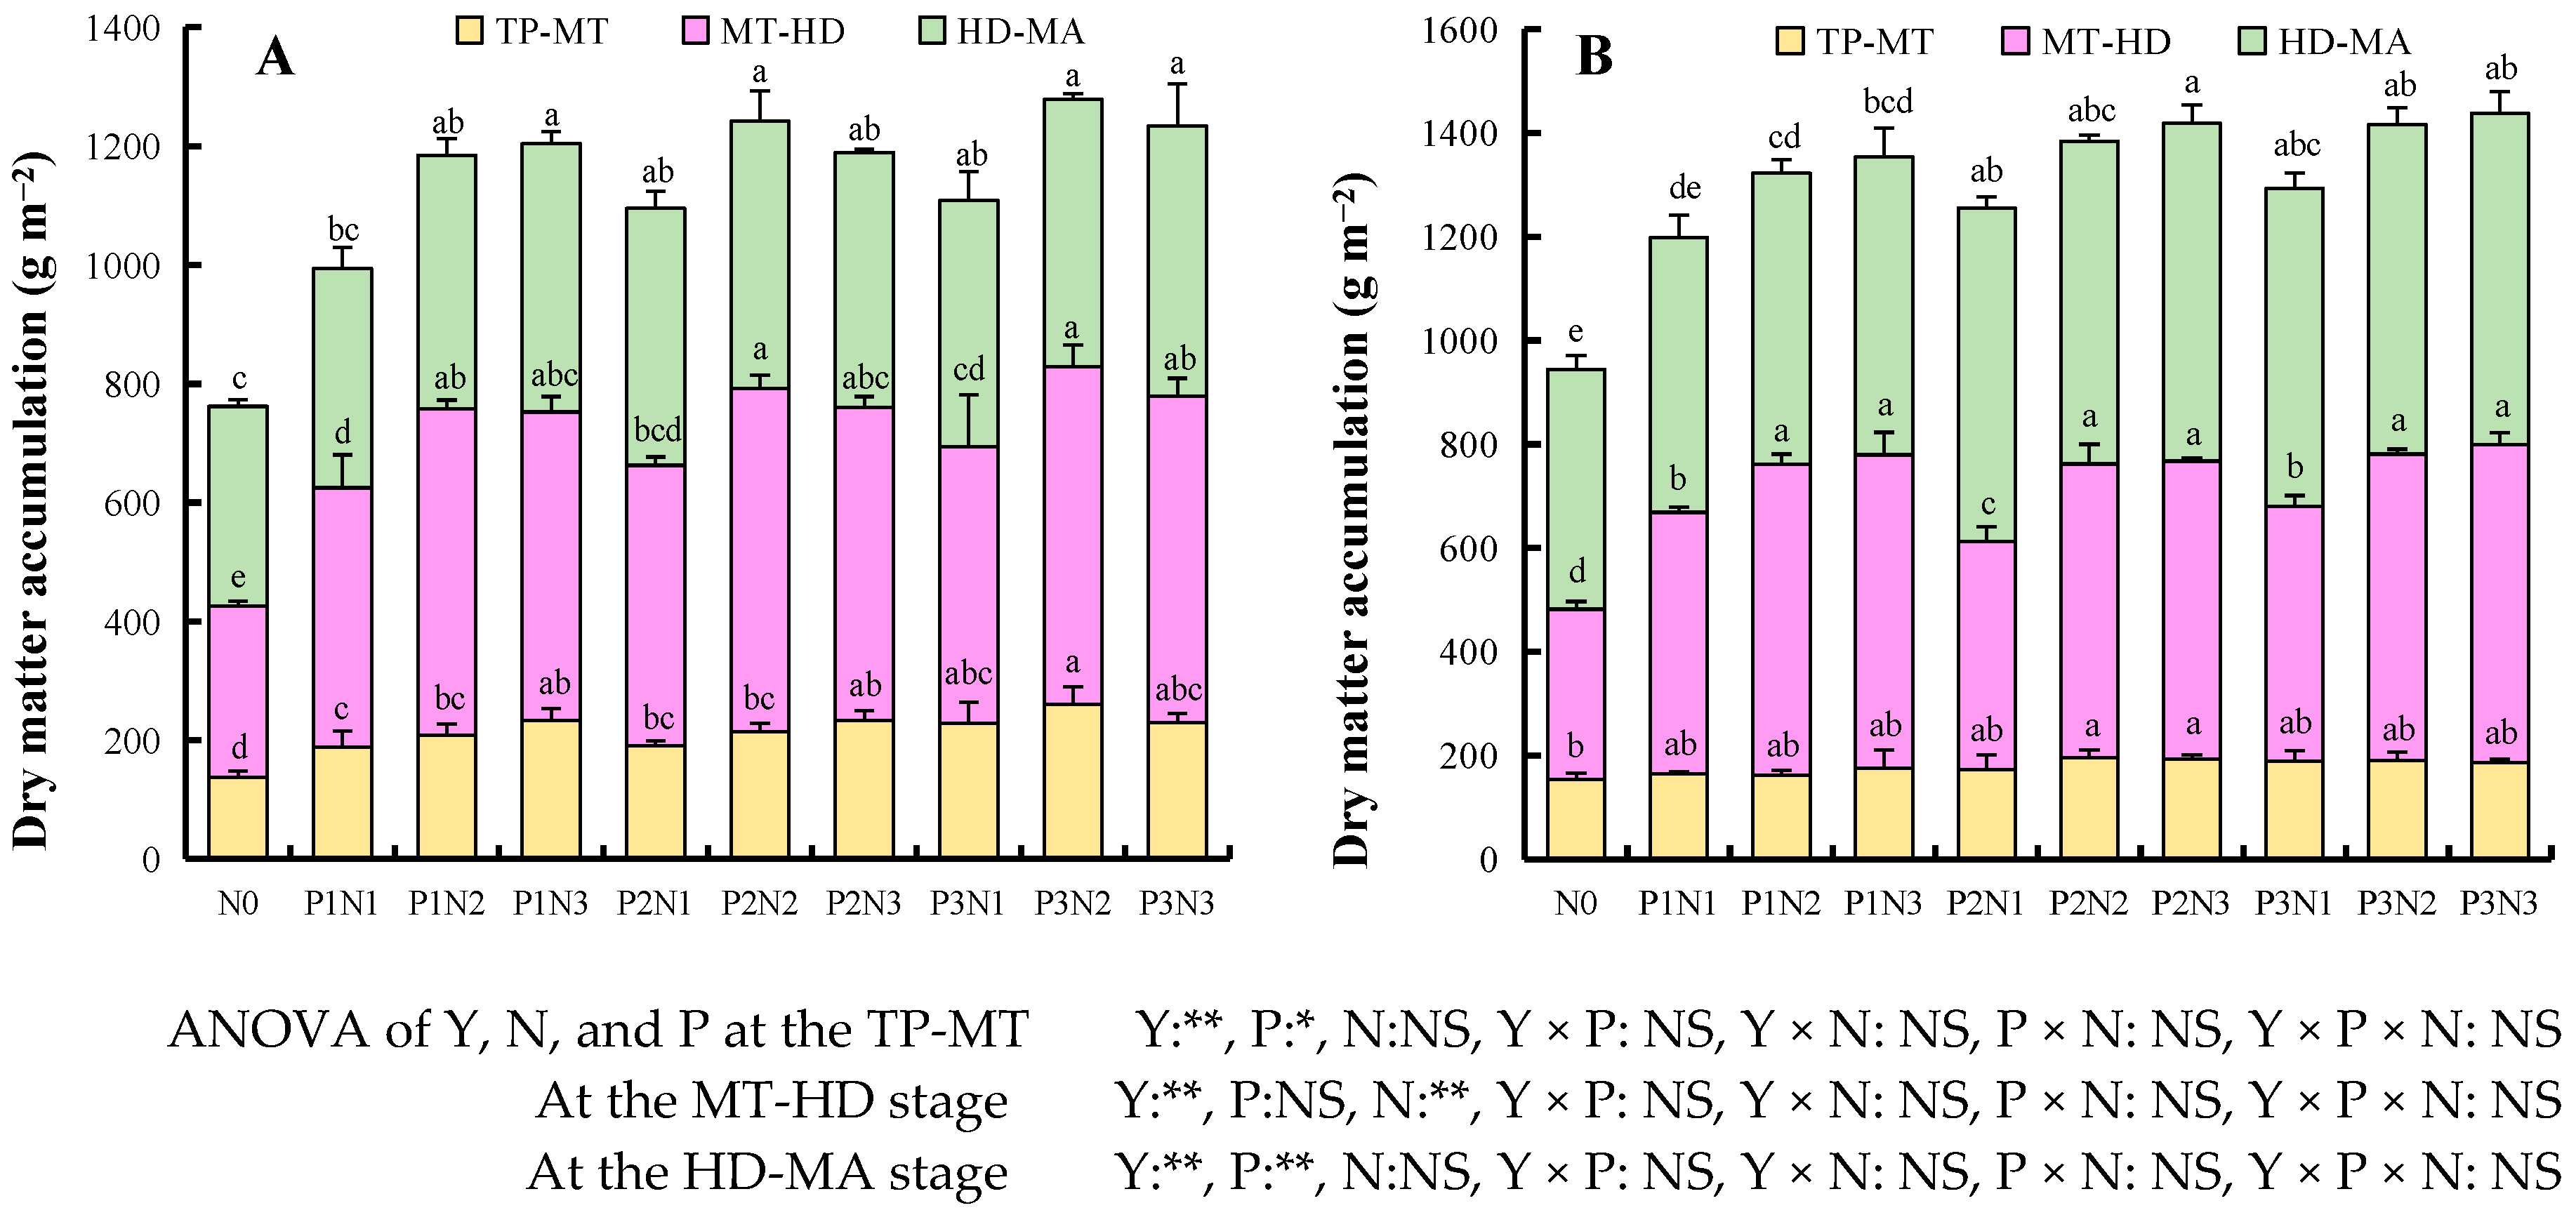
As can be seen in Figure 5, the dry matter accumulation from the transplanting to the mid-tillering stages and the mid-tillering to the heading stages under the same frequency of N application was larger for the N2 and N3 treatments with an increased amount of N application. The N0 treatment exhibited the lowest, and the differences between the N2 and N3 treatments were nonsignificant. The dry matter accumulation in the heading to maturity stages increased with an increased amount of N application, and it was the highest for the N3 treatment, with an average of 533.10 g m−2, which mainly manifested as N1 < N2 < N3, whereby N3 was 6.13% and 1.70% higher than N1 and N2, respectively. With the same N application rate, the differences in the dry matter accumulation among the treatments were nonsignificant with the increase in the frequency of N application from the transplanting to the mid-tillering stages, and the overall trends for the dry matter accumulation from the mid-tillering to heading stages and from the heading to maturity stages were increasing ones, which were the highest under the P3 treatment. The average dry matter accumulation levels in the tillering to the heading stages were 2.11% and 3.61% higher for the P3 treatment than for P1 and P2, respectively, and in the heading to maturity stages were 11.66% and 5.94% higher with the P3 treatment than P1 and P2, respectively.
3.7. Effect of N Fertilizer Management on Crop Growth Rate, Dry Matter Translocation Rate, and Its Contribution to Yield
According to the two years of data in Table S3, the crop growth rate of ZLY819 in the transplanting to the mid-tillering stages was the lowest for the N0 treatment, and the differences with the other treatments were significant. With the increase in the N application, the crop growth rate showed an overall increasing trend, but the difference between the N1, N2, and N3 treatments was nonsignificant. The crop growth rate was the highest with the N3 treatment, which was, on average, 28.86%, 10.10%, and 1.68% higher than for N0, N1, and N2, respectively. As the frequency of N application increased, the crop growth rate increased and was the highest under the P3 treatment at 6.63–8.55 g m−2 d−1, which was, on average, 13.20% and 6.63% higher than for P1 and P2, respectively.
In the mid-tillering to heading stages, the crop growth rate increased with the increase in the amount of N application and was highest under the N2 and N3 treatments in 2020 and 2021, respectively, but the difference between the N2 and N3 treatments over the two years was nonsignificant. With the increase in the frequency of N application, the crop growth rate increased, and the overall performance of P3 was the highest. From the heading to the maturity stages, the increased frequency of N applications under the same amount of N application was favorable to the increase in crop growth rate, i.e., it was highest for P3 at 18.33–18.82 g m−2 d−1. The crop growth rate increased with the increase in the amount of N application under the same frequency, i.e., it was the highest for N3 at 18.55–25.87 g m−2 d−1, which was higher than that for N1 and N2 by an average of 2.61% and 3.94%, respectively, and the difference with the N2 treatment was nonsignificant. The two-year data show that the transfer rate of the dry matter and the contribution rate in the heading stage were the highest with the N2 treatment under the same frequency of N application, followed by N3, and the difference between N2 and N3 was nonsignificant. With the same amount but different frequencies of N applications, the maximum value was obtained with the P3 treatment, followed by P2, and the difference among the treatments was nonsignificant. It can be concluded that a higher value was obtained in the P3N2 treatment.
3.8. Effect of N Fertilizer Management on Indicators Related to Nitrogen Use in ZLY819
As can be seen in Table 2, the trends in the two-year data for ZLY819 were basically the same. Under the same frequency but different amounts of N application, the overall agronomic efficiency and physiological utilization rate of N were the highest for the N2 treatment, with averages of 18.10 kg kg−1 and 34.34%, respectively (mainly N3 < N1 < N2). The partial factor productivity and NUE of both showed a decreasing trend with an increasing amount of N application; i.e., they had the highest values with the N1 treatment, (N3 < N2 < N1). The contribution rate of N to grain showed an increasing and then decreasing trend with an increase in the amount of N application (i.e., N1 < N3 < N2), with an average of 60.52% under the N2 treatment.
Increasing the frequency with the same amount of N application increased the agronomic efficiency, partial factor productivity, contribution rate of N to grain, and NUE (mainly P1 < P2 < P3). In other words, the maximum values could be obtained under the P3 treatment, among which the agronomic efficiency, partial productivity, contribution rate of N to grain, and NUE averaged 18.15 kg kg−1, 52.08 kg kg−1, 57.31%, and 55.61%, respectively, whereas the effect of the frequency of N application on the physiological utilization rate was nonsignificant.
In conclusion, the contribution rate of N to grain and the N absorption and utilization rate were the highest for the P3N2 treatment under the combined effect of frequency and amount of the N applications.
3.9. Regression Equation between Yield and Nitrogen Application and Yield
There was a parabolic open downward relationship between the amount of N applications and yield. The regression equation was established based on the two-year yield data and the amount of nitrogen application: y = −0.065x2 + 26.279x + 4460.6, R2 = 0.954 curve fit is better (Figure 6A); according to the equation, it is deduced that the amount of nitrogen applied to obtain the highest yield is 202.15 kg ha−1. A regression equation was established based on the frequency of nitrogen application and yield: y = −146.19x2 + 1216.8x + 4525.9, based on which the frequency of nitrogen applications to obtain the highest yield was deduced to be 4.16 (Figure 6B). In summary, the yield is higher when the amount of nitrogen application is 202.15 kg ha−1 and the fertilization frequency is 4 times.
4. Discussions
4.1. Effect of N Fertilizer Management on the Yield of ZLY819
N fertilizer management is an important cultivation measure to promote crop growth and obtain high yields. In this study, through the study of N fertilizer management, it was found that the average annual yields of ZLY819 were the highest under both the frequency and amount of N application in the P3N2 treatment, and the average annual yields were 7.53 t ha−1 and 7.71 t ha−1, respectively. The yields without N fertilizer were 4.52 t ha−1 and 5.41 t ha−1, respectively. The yield of rice showed an increase and then a decrease with an increase in the amount of N application. The moderate application of N promoted an increase in the rice yield, whereas the excessive application of N caused a decrease, and the results of this study are consistent with those of Zhu and Zhao et al. [17,18]. Under the same frequency of N application, the yield showed a trend of increasing and then decreasing with an increase in the amount of the N application. In high-yield rice cultivation, a one-time application of N is not conducive to nutrient uptake and accumulation by the plant. At the same amount of N application, the yield of ZLY819 gradually increased with the increase in the frequency of the N applications; i.e., the highest yield was obtained with the P3 treatment. An appropriate increase in the frequency of N application can significantly increase the rice yield [19].
4.2. Effects of N Fertilizer Management on the Growth Characteristics of ZLY819
An increase in the amount of N application to within a certain range can promote an increase in the LAI, plant height [20], number of tillers, spike formation rate, and yield; however, the excessive application of N fertilizer is detrimental to the growth and yield of rice [21]. Similar to the results of a previous study, this study found that the number of tillers and the LAI of rice showed an increasing and then decreasing trend with the increase in the amount of N application, and the spike formation rate showed a decreasing trend, whereas the plant height increased. Although excessive application of N fertilizer increased the LAI, the higher leaf area tended to cause the plant leaves to shade each other, thereby increasing the rate of leaf senescence and leading to a decline in the LAI and photosynthetic characteristics of the leaves at a later stage. The plant height increased with an increase in the amount of N application, which may be related to N promoting the division of rice stalk cells.
Large amounts of basal–tiller fertilizer will result in excessive leaf area development. Ineffective leaf area increases in the lower and middle parts of the plant. The lower and middle leaves shade each other leading to a poor light environment, thus leading to a decline in the photosynthetic characteristics of the population [22]. The N3 treatment applies too much nitrogen, appearing to have too much dry matter production in the early stage, poor field ventilation and light transmission conditions, and excessive nutrient growth of the population, which is not conducive to the later grain filling, thus failing to achieve high yields. Reasonable nitrogen fertilizer transport can regulate the development of rice population quality.
Maintaining a highly effective leaf area in the middle and late stages of rice, harmonizing the relationship between sources and reservoirs, and increasing the accumulation of dry matter play very important roles in improving yield [23]. Ling et al. [24] concluded that the amount of dry matter that accumulates during the heading stage in rice is linearly correlated with the yield, and the key to improving rice yield is mainly the photosynthetic production capacity after flowering, i.e., to improve the amount of matter that accumulates from the heading to maturity stages. Similar to their study, this research found that the dry matter mass of ZLY819 in the heading stage decreased with the increase in the amount of N application, and the highest biomass was obtained under the N2 treatment. The dry matter mass in the maturity stage showed an overall increasing trend with an increase in the amount of N application, and the highest value was mainly obtained under the N2 or N3 treatment, but the difference between the N2 and N3 treatments was nonsignificant. Further analyses concluded that the appropriate N fertilizer management increased the dry matter accumulation in the heading stage, dry matter accumulation from the heading to the maturity stages, crop growth rate, transport rate, contribution rate, and yield.
Farmers often apply only basal–tiller fertilizer and less spike fertilizer to their fields. Although the application of basal–tiller fertilizer improves biomass accumulation in the early stages of rice, it is not conducive to biomass accumulation in the later stages of rice growth and development. Increasing the frequency of N application in this study promoted an increase in the amount of dry matter accumulation during and after the heading stage, and the crop growth rate, transport rate, contribution rate, and yield of the rice showed an increase with the increase in the frequency of N application.
4.3. Effect of N Fertilizer Management on N Uptake and Utilization in ZLY819
N use efficiency is an important indicator of N uptake by rice, and it is of reference significance for the application of N to rice fields. Chen et al. [19] found that sufficient N application during the period from the tillering to heading and milky stages, especially during the stage in which young spikes differentiate, can increase the N use efficiency of rice to a certain extent. The combination of a reasonable increase in the frequency and amount of N applications can improve NUE and yield while reducing N loss in the field. The application of ear granule fertilizer has a higher NUE than basal–tiller fertilizer only, and the chasing application of ear granule fertilizer has been increasingly being accepted in China [25,26,27]. An increased frequency of N application has resulted in improved dry matter weight and N accumulation, as well as N translocation from the stem [28]; it has contributed to improvements in rice yields and NUE [27,28,29]; and it can also reduce N loss from soil when increasing the yield. Hou et al. [30] found that rice yield and N uptake and utilization were significantly improved when rice was applied at 60–180 kg ha−1; however, the yield and N uptake tended to decrease when the N fertilizer exceeded 240 kg ha−1. The present study shows that the overall N agronomic efficiency, partial productivity, and physiological utilization of ZLY819 exhibited a decreasing trend with an increasing amount of N application. The contribution of N to grain and N absorption and utilization rate both showed an increasing and then decreasing trend with an increasing amount of N application. The agronomic efficiency, partial productivity, contribution rate of N to grain, and N absorption and utilization rate showed an increasing trend with an increasing frequency of N application, while the N fertilizer’s physiological utilization decreased. The physiological utilization of N decreased under the N2 treatment, but the difference with the N1 treatment was nonsignificant. The difference between P1 and P2 was nonsignificant with an increase in the frequency of N application. Therefore, the optimum cultivation pattern can coordinate the contradiction between rice yield and NUE. Increasing N use efficiency while improving yield can promote the reproductive growth of rice and reduce luxury N in the later stages, and this study’s findings are in agreement with a previous study’s findings [31].
5. Conclusions
Based on the regression equation, the highest yield was obtained with 202.15 kg ha−1 of N and four applications of fertilizer. In this experiment, under an N application rate of 150 kg ha−1, increasing the number of N applications (base fertilizer–tiller fertilizer–spike fertilizer–grain fertilizer ratio of 4:3:2:1) can better improve the growth and development, dry matter accumulation, crop growth rate, dry matter translocation rate, dry matter contribution rate, and N uptake of ZLY819, as well as increase NUE. Through reasonable N fertilizer management, the yield and NUE of ZLY819 can be improved, resulting in a high yield. Because of the differences in each genetic trait among rice varieties, the treatment of fertilizer amount and period of N application had different effects on yield and nitrogen use efficiency. Therefore, this method of fertilizer application may only apply to a small number of varieties. In the future, the genetic characteristics of rice should be taken into consideration when studying the effects of fertilizer application period and fertilizer rate on yield and N utilization.
Supplementary Materials
The following supporting information can be downloaded at: https://0-www-mdpi-com.brum.beds.ac.uk/article/10.3390/agronomy14050919/s1, Table S1. Effect of N fertilizer management on the height of ZLY819; Table S2. Effect of N fertilizer management on aboveground biomass of ZLY819; Table S3. Effects of N fertilizer management on dry matter growth rate, transport rate, and contribution rate of ZLY819; Table S4. Effect of N fertilizer management on N content of ZLY819.
Author Contributions
Conceptualization, X.H.; validation, X.H., A.S.; investigation, H.Z., A.S.; data curation, X.H.; writing—original draft preparation, X.H.; writing—review and editing, X.W., H.Z.; supervision, X.W.; project administration, X.W.; funding acquisition, X.W. All authors have read and agreed to the published version of the manuscript.
Funding
This study was supported by the National Key Research and Development Program of China (2017YFD0301501) and the National Key R&D Program of China (2018YFD0301005).
Data Availability Statement
Data are contained within the article.
Conflicts of Interest
The authors declare no conflict of interest.
References
- Xiong, J.; Ding, C.Q.; Wei, G.B.; Ding, Y.F.; Wang, S.H. Characteristic of Dry-Matter Accumulation and Nitrogen-Uptake of Super-High-Yielding Early Rice in China. Agron. J. 2013, 105, 1142–1150. [Google Scholar] [CrossRef]
- Zhang, Q.; Yang, Z.; Zhang, H.; Yi, J. Recovery efficiency and loss of 15N-labelled urea in a rice–soil system in the upper reaches of the Yellow River basin. Agric. Ecosyst. Environ. 2012, 158, 118–126. [Google Scholar] [CrossRef]
- Peng, S.; Buresh, R.J.; Huang, J.; Zhong, X.; Zou, Y.; Yang, J.; Wang, G.; Liu, Y.; Hu, R.; Tang, Q.; et al. Improving nitrogen fertilization in rice by sitespecific N management. A review. Agron. Sustain. Dev. 2010, 30, 649–656. [Google Scholar] [CrossRef]
- Cao, Y.; Tian, Y.; Yin, B.; Zhu, Z. Assessment of ammonia volatilization from paddy fields under crop management practices aimed to increase grain yield and N efficiency. Field Crop. Res. 2013, 147, 23–31. [Google Scholar] [CrossRef]
- Hu, R.; Cao, J.; Huang, J.; Peng, S.; Huang, J.; Zhong, X.; Zou, Y.; Yang, J.; Buresh, R.J. Farmer participatory testing of standard and modified site-specific nitrogen management for irrigated rice in China. Agric. Syst. 2007, 94, 331–340. [Google Scholar] [CrossRef]
- Yang, Y.; Zhang, M.; Li, Y.; Fan, X.; Geng, Y. Controlled Release Urea Improved Nitrogen Use Efficiency, Activities of Leaf Enzymes, and Rice Yield. Soil Sci. Soc. Am. J. 2012, 76, 2307–2317. [Google Scholar] [CrossRef]
- Zerulla, W.; Barth, T.; Dressel, J.; Erhardt, K.; Horchler von Locquenghien, K.; Pasda, G.; Rädle, M.; Wissemeier, A. 3,4-Dimethylpyrazole phosphate (DMPP)–a new nitrification inhibitor for agriculture and horticulture: An introduction. Biol. Fertil. Soils 2001, 34, 79–84. [Google Scholar] [CrossRef]
- Zhu, G.; Peng, S.; Huang, J.; Cui, K.; Nie, L.; Wang, F. Genetic Improvements in Rice Yield and Concomitant Increases in Radiation- and Nitrogen-Use Efficiency in Middle Reaches of Yangtze River. Sci. Rep. 2016, 6, 21049. [Google Scholar] [CrossRef] [PubMed]
- Wen, Z.; Shen, J.; Blackwell, M.; Li, H.; Zhao, B.; Yuan, H. Combined Applications of Nitrogen and Phosphorus Fertilizers with Manure Increase Maize Yield and Nutrient Uptake via Stimulating Root Growth in a Long-Term Experiment. Pedosphere 2016, 26, 62–73. [Google Scholar] [CrossRef]
- Xu, C.M.; Zhou, C.N.; Zheng, G.S.; Wang, D.Y.; Hu, P.S.; Zhang, X.F. Effects of different nitrogen application rates and densities of super early rice on ni-trogen accumulation, translocation and absorption in different organs. Soil Fertil. Sci. China 2011, 1, 15–20. [Google Scholar]
- Ma, W.; Qi, C.Y.; Liu, L.; Liu, X.L.; Guo, X.M.; Sui, P.J.; Fu, S.; Hou, L.G. Effects of postponing and decreasing nitrogen application on nitrogen use efficiency and yield of super rice’ Jijing 88′. J. Northeast. Agric. Sci. 2016, 41, 23–27. [Google Scholar] [CrossRef]
- Feng, Y.C.; Wen, C.Y.; Zhu, Z.H.; Chen, J.; Chen, X.M.; Liu, W.A.; Qiu, C.F. Effect of postponing nitrogen application on yield and quality of high quality rice Jinggang soft clay. Acta Agric. Univ. Jiangxiensis 2023, 45, 830–840. [Google Scholar] [CrossRef]
- Wu, W.G.; Zhang, Y.H.; Zhang, J.M.; Xu, Y.Z.; He, C.B.; Li, X.H.; Xu, C.B.; Li, F.J.; Chen, X.Y. Effects of nitrogen management on mass quality and yield formation of machine transplanted middle-season lndica hybrid rice. J. Anhui Agric. Univ. 2011, 38, 1–5. [Google Scholar] [CrossRef]
- Bai, Z.G. Effects of N Management Strategy on N Metabolism in Rice Plant and N Use Efficiency in Paddy Soil; Chinese Academy of Agricultural Sciences: Beijing, China, 2019. [Google Scholar]
- Pan, S.G.; Huang, S.Q.; Zhai, J.; Cai, M.L.; Cao, C.G.; Zhan, M.; Tang, X.R. Effects of nitrogen rate and its basal to dressing ratio on uptake, translocation of nitrogen and yield in rice. Soil 2012, 44, 23–29. [Google Scholar] [CrossRef]
- Peng, S.B.; Huang, J.L.; Zhong, X.H.; Yang, J.C.; Wang, G.H.; Zhou, Y.B.; Zhang, F.S.; Zhu, Q.S.; Buresh, R.; Witt, C. Research strategy in improving fertilizer-nitrogen use efficiency of irrigated rice in China. Sci. Agric. Sin. 2002, 35, 1095–1103. [Google Scholar]
- Zhu, D.-W.; Zhang, H.-C.; Guo, B.-W.; Xu, K.; Dai, Q.-G.; Wei, H.-Y.; Gao, H.; Hu, Y.-J.; Cui, P.-Y.; Huo, Z.-Y. Effects of nitrogen level on yield and quality of japonica soft super rice. J. Integr. Agric. 2017, 16, 1018–1027. [Google Scholar] [CrossRef]
- Zhao, C.; Liu, G.; Chen, Y.; Jiang, Y.; Shi, Y.; Zhao, L.; Liao, P.; Wang, W.; Xu, K.; Dai, Q.; et al. Excessive Nitrogen Application Leads to Lower Rice Yield and Grain Quality by Inhibiting the Grain Filling of Inferior Grains. Agriculture 2022, 12, 962. [Google Scholar] [CrossRef]
- Chen, Y.; Peng, J.; Wang, J.; Fu, P.; Hou, Y.; Zhang, C.; Fahad, S.; Peng, S.; Cui, K.; Nie, L.; et al. Crop management based on multi-split topdressing enhances grain yield and nitrogen use efficiency in irrigated rice in China. Field Crop. Res. 2015, 184, 50–57. [Google Scholar] [CrossRef]
- Zhang, J.; Tong, T.; Potcho, P.M.; Huang, S.; Ma, L.; Tang, X. Nitrogen Effects on Yield, Quality and Physiological Characteristics of Giant Rice. Agronomy 2020, 10, 1816. [Google Scholar] [CrossRef]
- Jahan, A.; Islam, A.; Sarkar, M.I.U.; Iqbal, M.; Ahmed, M.N.; Islam, R. Nitrogen response of two high yielding rice varieties as influenced by nitrogen levels and growing seasons. Geol. Ecol. Landsc. 2022, 6, 24–31. [Google Scholar] [CrossRef]
- Cheng, C.; Zeng, Y.J.; Wang, Q.; Tan, X.M.; Shang, Q.Y.; Zeng, Y.H.; Shi, Q.H.; Jin, X. Effects of nitrogen application regime on japonica rice yield and quality of the late rice in the double rice system in southern China. J. Plant Nutr. Fertil. 2018, 24, 1386–1395. [Google Scholar]
- Yang, A.Z.; Wu, W.G.; Li, Z.F.; Duan, S.M.; Chen, G.; Xu, Y.Z. Effects of nitrogen application on source-sink relationship, dry matter accumulation and yield of super hybrid rice. Soils 2016, 48, 254–258. [Google Scholar] [CrossRef]
- Ling, Q.H.; Zhang, H.C. Technology and Theory of High Yielding and Efficient Rice; China Agriculture Press: Beijing, China, 2005. [Google Scholar]
- Wang, D.; Xu, C.; Ye, C.; Chen, S.; Chu, G.; Zhang, X. Low recovery efficiency of basal fertilizer-N in plants does not indicate high basal fertilizer-N loss from split-applied N in transplanted rice. Field Crop. Res. 2018, 229, 8–16. [Google Scholar] [CrossRef]
- Ye, C.; Ma, H.; Huang, X.; Xu, C.; Chen, S.; Chu, G.; Zhang, X.; Wang, D. Effects of increasing panicle-stage N on yield and N use efficiency of indica rice and its relationship with soil fertility. Crop. J. 2022, 10, 1784–1797. [Google Scholar] [CrossRef]
- Yi, J.; Gao, J.; Zhang, W.; Zhao, Y.; Zhao, C.; Zhao, Y.; Li, Z.; Xin, W. Delayed timing of tillering fertilizer improved grain yield and nitrogen use efficiency in japonica rice. Crop. Sci. 2020, 60, 1021–1033. [Google Scholar] [CrossRef]
- Xu, M.; Wang, H.P.; Yin, G.D.; Zhou, P.N.; Zhang, Y.J.; Su, G.F.; Xu, N.X. Effect of application stage of panicle fertilizer on rice grain yield and its population quality. Agric. Res. Jiangsu 2000, 2, 36–40. [Google Scholar] [CrossRef]
- Wang, D.; Xu, C.; Yan, J.; Zhang, X.; Chen, S.; Chauhan, B.S.; Wang, L.; Zhang, X. 15 N tracer-based analysis of genotypic differences in the uptake and partitioning of N applied at different growth stages in transplanted rice. Field Crop. Res. 2017, 211, 27–36. [Google Scholar] [CrossRef]
- Hou, Y.P.; Kong, L.L.; Li, Q.; Qin, Y.B.; Yu, L.; Xie, J.G.; Yin, C.X. Effects of different fertilization patterns on nutrient absorption, utilization and soil nutrient balance of rice. J. Northeast. Agric. Sci. 2018, 43, 1–8. [Google Scholar] [CrossRef]
- Zhu, K.; Zhan, M.; Chen, J.; Wang, Z.; Yang, J.; Zhao, B. Effects of irrigation regimes during grain filling under different nitrogen rates on inferior spikelets grain-filling and grain yield of rice. Chin. J. Rice Sci. 2018, 32, 155–168. [Google Scholar] [CrossRef]
Figure 1.
The effect of N fertilizer management on the yield of ZLY819. The same letter in the figure indicates a nosignificant difference between different groups, level bars represent the standard error. (p > 0.05). The ANOVA at the bottom of the figure is a two-way analysis of variance. NS, not significant (p > 0.05); * and **, significant at p < 0.05 and p < 0.01, respectively.

Figure 2.
Effect of N fertilizer management on the number of tillers per plant in ZLY819.

Figure 3.
Effect of N fertilizer management on the spike rate percentage of ZLY819. (A,B) represent the values of ZLY819 in 2020 and 2021, respectively. The same letter in the figure indicates a nosignificant difference between different groups, level bars represent the standard error. (p > 0.05). The ANOVA at the bottom of the figure is a two-way analysis of variance. NS, not significant (p > 0.05); * and **, significant at p < 0.05 and p < 0.01, respectively.

Figure 4.
Effect of N fertilizer management on LAI of ZLY819. Note: (A,B) represent the values of ZLY819 in 2020 and 2021, respectively. The same letter in the figure indicates a nosignificant difference between different groups, level bars represent the standard error. (p > 0.05). The ANOVA at the bottom of the figure is a two-way analysis of variance. NS, not significant (p > 0.05); * and **, significant at p < 0.05 and p < 0.01, respectively.

Figure 5.
Effects of N fertilizer management on dry matter accumulation in ZLY819 from the transplanting stage (TP) to the mid-tillering stage (MT), MT to heading stages (HD), and HD to maturity stages (MA). (A,B) represent the values of ZLY819 in 2020 and 2021, respectively. Different lowercase letters for the same stage indicate significant differences. NS, not significant (p > 0.05); * and **, significant at p = 0.05 and p = 0.01, respectively.

Figure 6.
(A,B) Regression equation between yield and nitrogen application and yield.


Table 1.
Specific use of frequency and amount of N applications.
| Developmental Stage | 1 Day before Transplanting | 7 Days after Transplanting | First Bract Differentiation Period | Beginning of the Spike | |
|---|---|---|---|---|---|
| Date | 2020 | 18 April | 26 April | 19 May | 9 June |
| 2021 | 20 April | 28 April | 21 May | 11 June | |
| Treat | N0 | 0 | 0 | 0 | 0 |
| P1N1 | 45 | 45 | 0 | 0 | |
| P1N2 | 75 | 75 | 0 | 0 | |
| P1N3 | 105 | 105 | 0 | 0 | |
| P2N1 | 36 | 27 | 27 | 0 | |
| P2N2 | 60 | 45 | 45 | 0 | |
| P2N3 | 84 | 63 | 63 | 0 | |
| P3N1 | 36 | 27 | 18 | 9 | |
| P3N2 | 60 | 45 | 30 | 15 | |
| P3N3 | 84 | 63 | 42 | 21 | |
P: frequency of N application, N: amount of N application. The fertilizer application rate for N1, N2, and N3 was 90, 150, and 210 kg N ha−1, respectively. P1 was tiller and base (50%:50%), P2 was base–tiller–panicle fertilizer (40%:30%:30%), and P3 was base–tiller–panicle–granular fertilizer (40%:30%:20%:10%). The same is below.
Table 2.
Effect of N fertilizer management on indicators related to nitrogen use in ZLY819.
| Year | Treatment | Agronomic Efficiency (kg kg−1) | Partial Factor Productivity (kg kg−1) | Physiological Utilization Rate (%) | Contribution Rate of N to Grain (%) | NUE (%) | |
|---|---|---|---|---|---|---|---|
| 2020 | P1 | N1 | 12.52 ± 2.21 de | 61.88 ± 1.85 c | 27.51 ± 3.47 ab | 25.5 ± 5.30 e | 45.3 ± 2.86 e |
| N2 | 15.43 ± 1.14 bcd | 45.05 ± 0.76 e | 34.03 ± 1.54 ab | 52.31 ± 6.18 abc | 45.28 ± 4.40 cd | ||
| N3 | 10.13 ± 1.91 e | 31.28 ± 0.9 f | 26.44 ± 5.37 c | 48.26 ± 11.4 bcd | 38.4 ± 0.74 de | ||
| P2 | N1 | 16.92 ± 2.41 bc | 66.28 ± 4.78 b | 31.93 ± 4.94 ab | 34.19 ± 3.31 de | 53.05 ± 0.69 bcd | |
| N2 | 18.05 ± 1.46 ab | 47.66 ± 2.3 de | 35.36 ± 4.38 abc | 61.01 ± 5.06 ab | 51.36 ± 4.91 b | ||
| N3 | 11.47 ± 1.35 de | 32.63 ± 0.59 f | 27.57 ± 5.93 c | 54.52 ± 9.15 abc | 42.27 ± 5.23 bcd | ||
| P3 | N1 | 21.34 ± 5.04 a | 70.7 ± 2.84 a | 36.05 ± 10.17 a | 43.64 ± 12.57 cd | 59.56 ± 2.28 bc | |
| N2 | 19.53 ± 2.71 ab | 49.14 ± 1.58 d | 33.48 ± 5.00 bc | 66.33 ± 12.49 a | 58.42 ± 2.06 a | ||
| N3 | 12.93 ± 1.38 cde | 34.08 ± 1.30 f | 29.08 ± 5.25 c | 61.33 ± 8.58 ab | 44.91 ± 3.81 b | ||
| average | P1 | 12.69 | 46.07 | 29.33 | 42.02 | 43.00 | |
| P2 | 15.48 | 48.86 | 31.62 | 49.90 | 48.90 | ||
| P3 | 17.93 | 51.31 | 32.87 | 57.10 | 54.30 | ||
| N1 | 16.93 | 66.28 | 31.83 | 34.44 | 52.64 | ||
| N2 | 17.67 | 47.29 | 34.29 | 59.88 | 51.69 | ||
| N3 | 11.51 | 32.66 | 27.70 | 54.70 | 41.86 | ||
| 2021 | P1 | N1 | 14.03 ± 1.2 bcd | 65.03 ± 2.92 b | 29.58 ± 5.31 a | 27.71 ± 4.25 d | 48.37 ± 8.36 cd |
| N2 | 16.34 ± 3.17 abc | 46.94 ± 1.18 d | 34.43 ± 5.23 a | 54.09 ± 14.3 abc | 47.27 ± 1.95 cd | ||
| N3 | 10.60 ± 2.38 d | 32.46 ± 1.19 e | 30.84 ± 10.25 a | 49.14 ± 13.72 abc | 35.32 ± 5.48 e | ||
| P2 | N1 | 17.23 ± 6.98 abc | 68.23 ± 3.78 ab | 30.98 ± 14.10 a | 34.52 ± 15.51 cd | 57.16 ± 9.99 abc | |
| N2 | 18.59 ± 2.88 ab | 49.19 ± 2.40 cd | 33.54 ± 5.04 a | 61.24 ± 12.10 ab | 55.41 ± 0.44 abc | ||
| N3 | 12.45 ± 0.98 cd | 34.3 ± 0.64 e | 27.84 ± 2.65 a | 57.38 ± 8.66 ab | 44.76 ± 1.07 de | ||
| P3 | N1 | 20.70 ± 5.63 a | 71.70 ± 1.91 a | 34.15 ± 11.94 a | 41.29 ± 14 bcd | 61.70 ± 7.35 a | |
| N2 | 20.68 ± 2.32 a | 51.28 ± 1.15 c | 35.20 ± 6.98 a | 68.14 ± 11.85 a | 59.51 ± 5.85 ab | ||
| N3 | 13.70 ± 1.09 bcd | 35.55 ± 0.54 e | 27.88 ± 4.17 a | 63.14 ± 9.52 a | 49.57 ± 5.03 bcd | ||
| average | P1 | 13.66 | 48.14 | 31.62 | 43.65 | 43.66 | |
| P2 | 16.09 | 50.57 | 30.78 | 51.04 | 52.44 | ||
| P3 | 18.36 | 52.84 | 32.41 | 57.52 | 56.92 | ||
| N1 | 17.32 | 68.32 | 31.57 | 34.51 | 55.74 | ||
| N2 | 18.54 | 49.14 | 34.39 | 61.16 | 54.06 | ||
| N3 | 12.25 | 34.10 | 28.85 | 56.55 | 43.22 | ||
| F value | Y | NS | 9.29 ** | NS | NS | 5.87 * | |
| P | 11.95 ** | 24.26 ** | NS | 8.48 ** | 29.31 ** | ||
| N | 21.66 ** | 1133.88 ** | 3.41 * | 30.98 ** | 31.24 ** | ||
| Y × P | NS | NS | NS | NS | NS | ||
| Y × N | NS | NS | NS | NS | NS | ||
| P × N | NS | NS | NS | NS | NS | ||
| Y × P × N | NS | NS | NS | NS | NS | ||
Y: year, P: frequency of N application, N: amount of N application. Values followed by different lowercase letters indicate significant difference among treatments at 5% level. NS, not significant (p > 0.05); * and **, significant at p = 0.05 and p = 0.01, respectively.
Disclaimer/Publisher’s Note: The statements, opinions and data contained in all publications are solely those of the individual author(s) and contributor(s) and not of MDPI and/or the editor(s). MDPI and/or the editor(s) disclaim responsibility for any injury to people or property resulting from any ideas, methods, instructions or products referred to in the content. |
© 2024 by the authors. Licensee MDPI, Basel, Switzerland. This article is an open access article distributed under the terms and conditions of the Creative Commons Attribution (CC BY) license (https://creativecommons.org/licenses/by/4.0/).
Share and Cite
MDPI and ACS Style
He, X.; Zhu, H.; Shi, A.; Wang, X. Optimizing Nitrogen Fertilizer Management Enhances Rice Yield, Dry Matter, and Nitrogen Use Efficiency. Agronomy 2024, 14, 919. https://0-doi-org.brum.beds.ac.uk/10.3390/agronomy14050919
AMA Style
He X, Zhu H, Shi A, Wang X. Optimizing Nitrogen Fertilizer Management Enhances Rice Yield, Dry Matter, and Nitrogen Use Efficiency. Agronomy. 2024; 14(5):919. https://0-doi-org.brum.beds.ac.uk/10.3390/agronomy14050919
Chicago/Turabian StyleHe, Xiaoe, Haijun Zhu, Ailong Shi, and Xuehua Wang. 2024. "Optimizing Nitrogen Fertilizer Management Enhances Rice Yield, Dry Matter, and Nitrogen Use Efficiency" Agronomy 14, no. 5: 919. https://0-doi-org.brum.beds.ac.uk/10.3390/agronomy14050919
Note that from the first issue of 2016, this journal uses article numbers instead of page numbers. See further details here.