Article

Comparison of Morphological, Physiological, and Related Gene Expression Responses to Drought Stress in Five Camellia vietnamensis Cultivars

1
School of Breeding and Multiplication (Sanya Institute of Breeding and Multiplication), Hainan University, Sanya 572025, China
2
School of Agricultural Sciences, Jiangxi Agricultural University, Nanchang 330045, China
*
Author to whom correspondence should be addressed.
These authors contributed equally to this work.
Submission received: 25 February 2024 / Revised: 7 April 2024 / Accepted: 20 April 2024 / Published: 26 April 2024
(This article belongs to the Section Crop Breeding and Genetics)

Abstract

:
The main production area of Camellia vietnamensis (C. vietnamensis) is in the low mountain and hilly areas of southern China. The low survival rate of seedlings caused by drought is one of the main obstacles restricting the development of the C. vietnamensis industry. An exploration of the key adaptation mechanism of C. vietnamensis to drought stress is important in order to improve its drought resistance. We conducted a study on the morphological, physiological, biochemical, and drought resistance-related genes of five C. vietnamensis cultivars grown in Hainan province under varying degrees of drought stress. The results indicate that drought stress can lead to a decrease in the relative water content and photosynthetic capacity of C. vietnamensis leaves. Compared with the control, the drought damage index, malondialdehyde, relative electrical conductivity, soluble protein, soluble sugar and proline contents of the five C. vietnamensis cultivars increased with drought-stress duration and degree. With increasing drought-stress intensity, the activity of antioxidant enzymes and the content of related metabolites (total polyphenols, total flavonoids, tea saponins) gradually increased, and the expression levels of phenylpropanoid pathway-related genes (Cv4CL1, CvCAD1, CvCAD2, CvPOX1, CvPOX2, CvPOX3) were upregulated. Based on the results of the drought tolerance coefficients, principal component analysis, and hierarchical cluster analysis, we classified five C. vietnamensis cultivars into drought-tolerant cultivars (‘Haida 1’); moderately drought-tolerant cultivars (‘Haida 4’ and ‘Wanhai 4’); and drought-sensitive cultivars (‘Wanhai 3’ and ‘Wanhai 1’). The results of this study provide a theoretical basis for the promotion and cultivation of C. vietnamensis and the selection of drought-resistant cultivars.

1. Introduction

Drought is a global problem that threatens crop productivity and sustainable agricultural development [1,2]. According to previous reports, with the intensification of global climate change, the duration and severity of droughts are increasing, leading to an increase in arid areas, accounting for 40% of the global land area and posing a threat to global water resources [3,4,5]. In addition, with the rapid increase in global agricultural water demand, water scarcity is having a negative impact on the growth and development of crops in dry regions [6,7,8]. China is one of the countries with frequent droughts, accounting for more than half of the total area of the country [9,10]. Drought poses a serious threat to the production and sustainable development of agriculture and forestry [11,12]. Therefore, improving the tolerance of plants to drought stress is crucial for global agricultural and forestry security.
Many complex signal transduction and adaptation mechanisms have been formed in the long-term evolution of plants to help them survive under stress [13,14]. Under drought stress, the water balance in the plant body is broken, resulting in the destruction of its normal physiological and biochemical processes [15]. As leaves lose water and relative water content decreases, plants limit water loss and carbon dioxide input by closing stomata, slowing photosynthesis, and degrading photosynthetic pigments [16,17]. As the duration of exposure to drought increases, the cell membrane structure is severely damaged, leading to an increase in relative electrical conductivity (REC) [18,19]. During this process, malondialdehyde (MDA) is considered an important indicator reflecting the strength of cell membrane lipid peroxidation [9,20]. Moreover, plants can maintain normal metabolic activity by increasing the accumulation of osmoregulatory substances and protective proteins, mainly proline (Pro), betaine, soluble sugar (SS), and soluble protein (SP) [21,22,23]. Under drought stress, reactive oxygen species (ROS) accumulate in large quantities, leading to the disruption of the dynamic balance of free radicals in plants. In response to oxidative stress caused by ROS, plants actively increase the activity of antioxidant enzymes and nonenzymatic compounds [24,25,26]. In addition, plants can also resist drought stress by sensing and transducing stress signals, inducing gene expression, and synthesizing various specific biological molecules [27,28]. In previous research, it was found that the phenylpropanoid metabolic pathway plays an important role in plant drought-resistance defense [29]. Drought tolerance in plants is a complex trait regulated by multiple factors [30]. Therefore, various evaluation methods for drought-resistant germplasm screening have been proposed for different plants, such as principal component analysis (PCA), the membership function method, and hierarchical clustering analysis (HCA), to facilitate the analysis and interpretation of a large amount of morphological, physiological, and biochemical data obtained from plants under different biological and abiotic stress conditions [31,32,33]. Combining multiple evaluation methods to establish a comprehensive evaluation method suitable for drought resistance may solve the limitations of the current methods for identifying plant drought resistance.
C. vietnamensis is an important oil tree species in southern China that has functions such as preventing cardiovascular and cerebrovascular diseases, inhibiting tumors, lowering cholesterol, and exerting anti-inflammatory and detoxifying effects and is known as ‘eastern olive oil’ [9,34]. Because C. vietnamensis is mainly grown in low mountain and hilly areas, irrigation conditions are limited. Although this tree species has certain drought resistance, the growth and development of seedlings transplanted to mountainous areas during the dry season are often severely affected [35]. Without a sufficient water supply, the survival rate of seedlings will be greatly reduced [36,37]. At the same time, drought can also lead to a decrease in photosynthesis, oil content, flower buds and fruit setting of C. vietnamensis, and even lead to the death of drought-sensitive cultivars [37,38]. Therefore, understanding the differences in drought resistance among the main cultivated cultivars will contribute to the scientific cultivation and promotion of C. vietnamensis. In this study, we analyzed the morphological, physiological, biochemical, and related gene expression responses of the leaves of five main C. vietnamensis cultivars under different drought stresses. The differences in physiological, biochemical, and related gene expression responses among different C. vietnamensis cultivars under drought-stress conditions and their possible drought-resistance mechanisms were elaborated.

2. Materials and Methods

2.1. Plant Materials and Treatment

Five one-year old cultivars were selected, namely ‘Wanhai 1’, ‘Wanhai 3’, ‘Wanhai 4’, ‘Haida 1’, and ‘Haida 4’ [29]. To prevent mixing of seed sources, all seedlings were provided by the Danzhou C. vietnamensis production and planting demonstration station (109°29′45.4″ E, 19°29′59.7″ N). Seedlings that were free from pests and diseases were selected, grown well and transplanted into flower pots. The volumetric ratio of the cultivation substrate was 3:1 (peat soil/vermiculite), and the weight of each basin of substrate was relatively consistent. The materials were planted in the germplasm resource nursery of C. vietnamensis at the agronomy station of Hainan University.
After three months of acclimatization, 300 uniform seedlings without any pests or diseases were selected from the nursery, with 60 seedlings for each cultivar. The growth of each C. vietnamensis cultivar seedlings is shown in Table S1. After removing the soil and washing the roots with tap water, the seedlings were randomly divided into four groups and cultured in a square plastic basin with 1/2-strength Hoagland nutrient solution for two days. Then, they were transferred to 1/2-strength Hoagland nutrient solution supplemented with 0 (control: 0 MPa), 100 (mild stress: −0.3 MPa), 200 (moderate stress: −0.6 MPa), and 300 (severe stress: −0.9 MPa) g L−1 PEG-6000 (PEG) [38]. All the experiments were carried out in a plant growth and culture room, which provided a 16 h light/8 h dark photoperiod per day. The light intensity was 200–300 µmol m−2 s−1, the temperature was 27 ± 2 °C, and the relative humidity was 75–85%. Ventilation was conducted in the morning and evening, and nutrient solutions with different concentration gradients of PEG were replaced every three days. Samples were taken on day 9 after PEG stress treatment, and three seedlings were randomly selected for replications of each treatment. Mature third to seventh leaves under the terminal bud were selected for sampling. Some of the fresh leaves were used for the measurement of indicators while the remaining leaves were stored at −80 °C.

2.2. Morphological Parameters

On the 9th day of drought-stress treatment, the degree of damage to five C. vietnamensis under different stress intensities was recorded. Leaf blade damage was divided into 5 levels, and the specific description is shown in Table S2. Then, the drought damage index (DI) was calculated as follows:
DI = ( 0 × S 0 + 1 × S 1 + 2 × S 2 + 3 × S 3 + 4 × S 4 ) × 100 / ( 4 × N )
In the formula, S0, S1, S2, S3 and S4 are the number of plants with scores of 0, 1, 2, 3 and 4, respectively, and N is the total number of plants tested for each variety and treatment.

2.3. Physiological Index

2.3.1. Determination of Membrane Permeability-Relevant Indexes, Osmoregulatory Substance Contents, and Antioxidant Enzyme Activity

The RWC was determined by the saturated water content method [39]. First, fresh leaves were quickly cut, and the fresh weight (FW) was measured. Then, the weighed fresh leaves were put in water for 18 h, dried with paper, and weighed, after which the saturated FW (SFW) was recorded. The leaves were placed into an oven at 80 °C until they reached a constant weight, which was recorded as the dry weight (DW). RWC was computed as follows:
RWC   ( % )   =   ( FW DW )   /   ( SFW DW ) × 100 %
The relative electrical conductivity (REC) was determined by the conductance meter method [40]. The surface of the fresh leaves was rinsed with water, cut into small pieces and placed in a test tube. An addition of 10 mL of distilled water was made to the tube, which was incubated for 3 h with shaking several times, and then the conductivity (R1) was measured. The samples were put into a thermostatic water bath and incubated at 100 °C for 30 min. The conductivity (R2) was measured after cooling. The REC was calculated as follows:
REC (%) = R1/R2 × 100%
MDA was determined by the thiobarbituric acid (TBA) method, with some modifications [41]. A total of 0.5 g of leaves was put into a mortar, and 5 mL of phosphoric acid buffer solution (pH = 7.8) was added, after which the sample was ground on ice, poured into a centrifuge tube, and centrifuged. One milliliter of the supernatant and 2 mL of TBA containing 0.6% were sealed and boiled in 100 °C water for 20 min and then cooled naturally. The supernatant was collected after centrifugation, and the absorbance was measured at 600 nm (D600), 532 nm (D532), and 450 nm (D450). The MDA was calculated using the method of Aghaie et al. [42].
With reference to Shen et al.’s [29] test methods, the SS, SP and Pro contents and the activities of SOD, POD, and CAT in five C. vietnamensis cultivar leaf samples were determined with trace test kits from Suzhou Comin Biotechnology (Keming, Suzhou, China; www.cominbio.com, accessed on 1 December 2022).

2.3.2. Photosynthetic Pigment Content

Photosynthetic pigments (chlorophyll A (Chl A), chlorophyll B (Chl B), carotenoids (Car), and total chlorophyll (total Chl)) were extracted by the ethanol extraction method. Fresh leaves were ground until they turned white and filtered to a constant volume. Afterward, the absorbance was measured at 665 nm (D665), 649 nm (D649), and 470 nm (D470). The photosynthetic pigment contents of the leaves were calculated according to the methods of Wellburn [43].

2.3.3. Total Polyphenol (Pol), Total Flavonoid (Fla) and Tea Saponin (TS) Contents

(1)
Preparation of C. vietnamensis leaf extracts
According to a solid/liquid ratio of 1:15, 50% methanol was added, followed by ultrasonic treatment (water bath at 65 °C, power of 100 W, frequency of 40 kHz) for 40 min and centrifugation. The supernatant was absorbed and stored at room temperature.
(2)
Pol content determination
The Pol content was determined by the Folin phenol method, with some modifications [44]. One milliliter of the extract was added to a volumetric flask, and then 5 mL of 10% Folin phenol was added. The sample was mixed thoroughly with a vortex oscillator. Then, 4 mL of 20% Na2CO3 solvent was added. Afterward, the sample was set aside for 40 min after mixing, after which the absorbance at 765 nm (D765) was measured. The Pol content of C. vietnamensis leaves was calculated according to a standard curve.
(3)
Fla content determination
The Fla content was determined by the aluminum trichloride method [45]. One milliliter of the extract was added to a volumetric flask, the volume of which was brought to 5 mL with 60% ethanol solution. The contents were mixed thoroughly with a vortex oscillator, and 0.3 mL of 5% NaNO2 solution was added. The sample was set aside for 7 min after mixing, after which 0.3 mL of 10% AI(NO3)3 solution, 4 mL of 1 mol/L NaOH solution and 0.4 mL of 30% ethanol solution were added. After mixing, the samples were incubated for 15 min, and the absorbance value was measured at a wavelength of 510 nm (D510). The Fla content of C. vietnamensis leaves was calculated according to a standard curve.
(4)
TS content determination
The TS content was determined by the vanillin–sulfuric acid color reaction method [46]. Then, 0.5 mL of the extract was added to a volumetric flask, 0.5 mL of 8% vanillin anhydrous ethanol solution was added, and 4 mL of 77% sulfuric acid solution was added to an ice water bath. It was shaken well and heated in a 60 °C water bath for 15 min. The mixture was removed from the water bath and cooled with ice water for 10 min. The absorbance value was measured at a wavelength of 550 nm (D550). The TS content of C. vietnamensis leaves was calculated according to a standard curve.

2.4. RT-qPCR Analysis

Total RNA was isolated from leaves using an RNA Preparation Pure Plant Kit (Tiangen, Beijing, China; https://www.tiangen.com, accessed on 1 December 2022). MonScript™ RTIII All-in-One Mix with dsDNase was used to convert total RNAs into cDNAs (Mona, Suzhou, China; www.monadbiotech.com, accessed on 1 December 2022). By analyzing the previously obtained transcriptome data (PRJNA856766), it was found that a large number of differential genes were enriched in the phenylpropanoid metabolism pathway. On this pathway, genes with significant differences in expression levels between varieties were screened [29]. The relative expression of the genes involved in phenylpropane metabolism (Cv4CL1, CvCAD1, CvCAD2, CvPOX1, CvPOX2, and CvPOX3) in plant leaf samples was analyzed by RT-qPCR with SYBR green [47]. The PCR amplification system, procedure and gene-related expression calculation were performed according to the method of Ye et al. [48]. Using the actin gene (glyceraldehyde-3-phosphate dehydrogenase, GAPDH) as the internal reference, three technical and biological replicates were performed [48,49]. The primer design was synthesized using Premier 5.0 software [50], and the primer information is shown in Table S3.

2.5. Comprehensive Evaluation of Drought Resistance

2.5.1. Drought-Tolerance Coefficients

The drought-tolerance coefficients (DTCs) of 23 drought-related indicators were calculated based on data from different drought-stress groups and control groups using the following formula:
DTC = ( drought   data   /   control   data ) × 100 %

2.5.2. Principal Component Analysis

Using PCA to analyze the DTCs of different drought-stress groups, 23 single physiological indicators were transformed into three comprehensive indicators. The F value is calculated by the weight of each comprehensive indicator.
The membership function values of each DTC are obtained by the following equation:
Z ( ab ) = ( ab abmin ) / ( abmax abmin )
The calculation formula for each comprehensive indicator is as follows:
Y ak = b = 1 n Z ab × f bk
The formula for calculating the weight of each comprehensive indicator is:
G k = O k k = 1 n O k k = 1 , 2 ,     n
The drought resistance of the cultivars is represented by F, and the formula used was as follows:
F = k = 1 n X ( Y ak ) × G k   k   =   1 , 2 ,     n
In these formulas, abmax and abmin are the maximum and minimum values of the b-th index of the a-th cultivar; fbk is the score coefficient of the b-th index of the k-th composite index; and Ok is the contribution of the k-th comprehensive indicator of each cultivar.

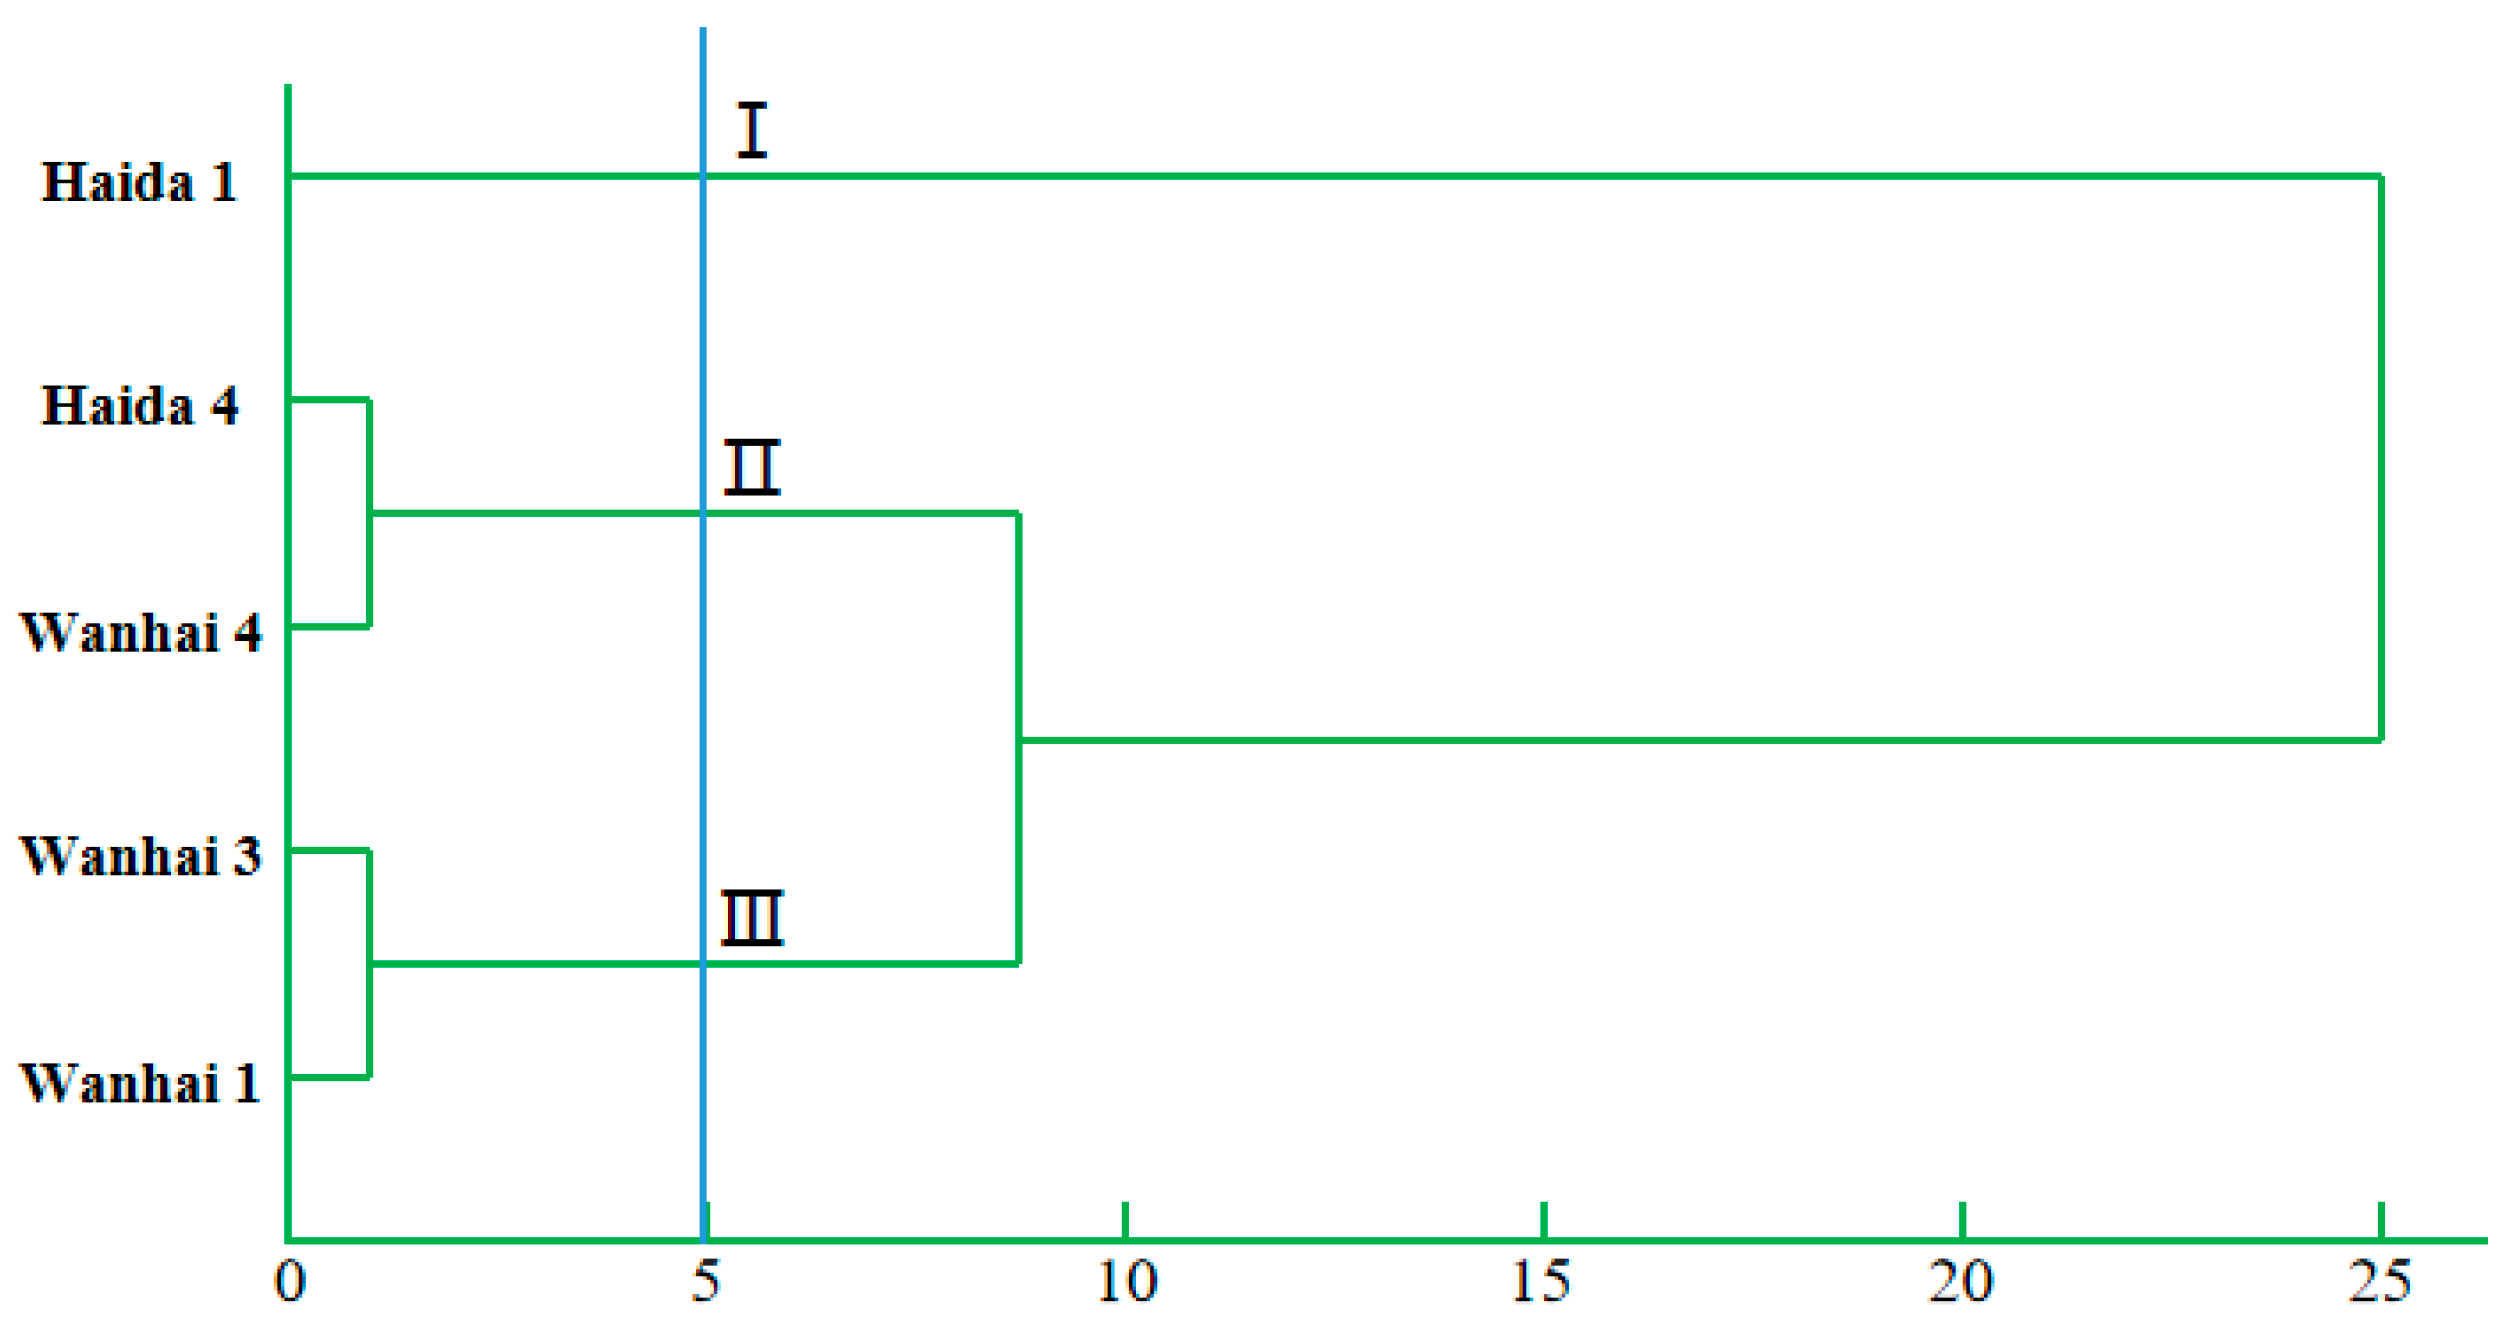
2.6. Cluster Analysis

The furthest neighbor was used to objectively classify the F values of five C. vietnamensis cultivars [51]. According to the membership function values obtained from Formula (5), HCA was conducted on 23 drought-tolerance indexes of different C. vietnamensis cultivars using TBtools 1.120 software [52].

2.7. Data statistics and Analysis

Excel 2020 and SPSS 20.0 software were used for data sorting, significant difference analysis and PCA. Duncan’s multiple mean comparison was used to test the differences among treatments (p < 0.05). GraphPad Prism 5 and Adobe Photoshop 2022 software were used to plot the figures.

3. Results

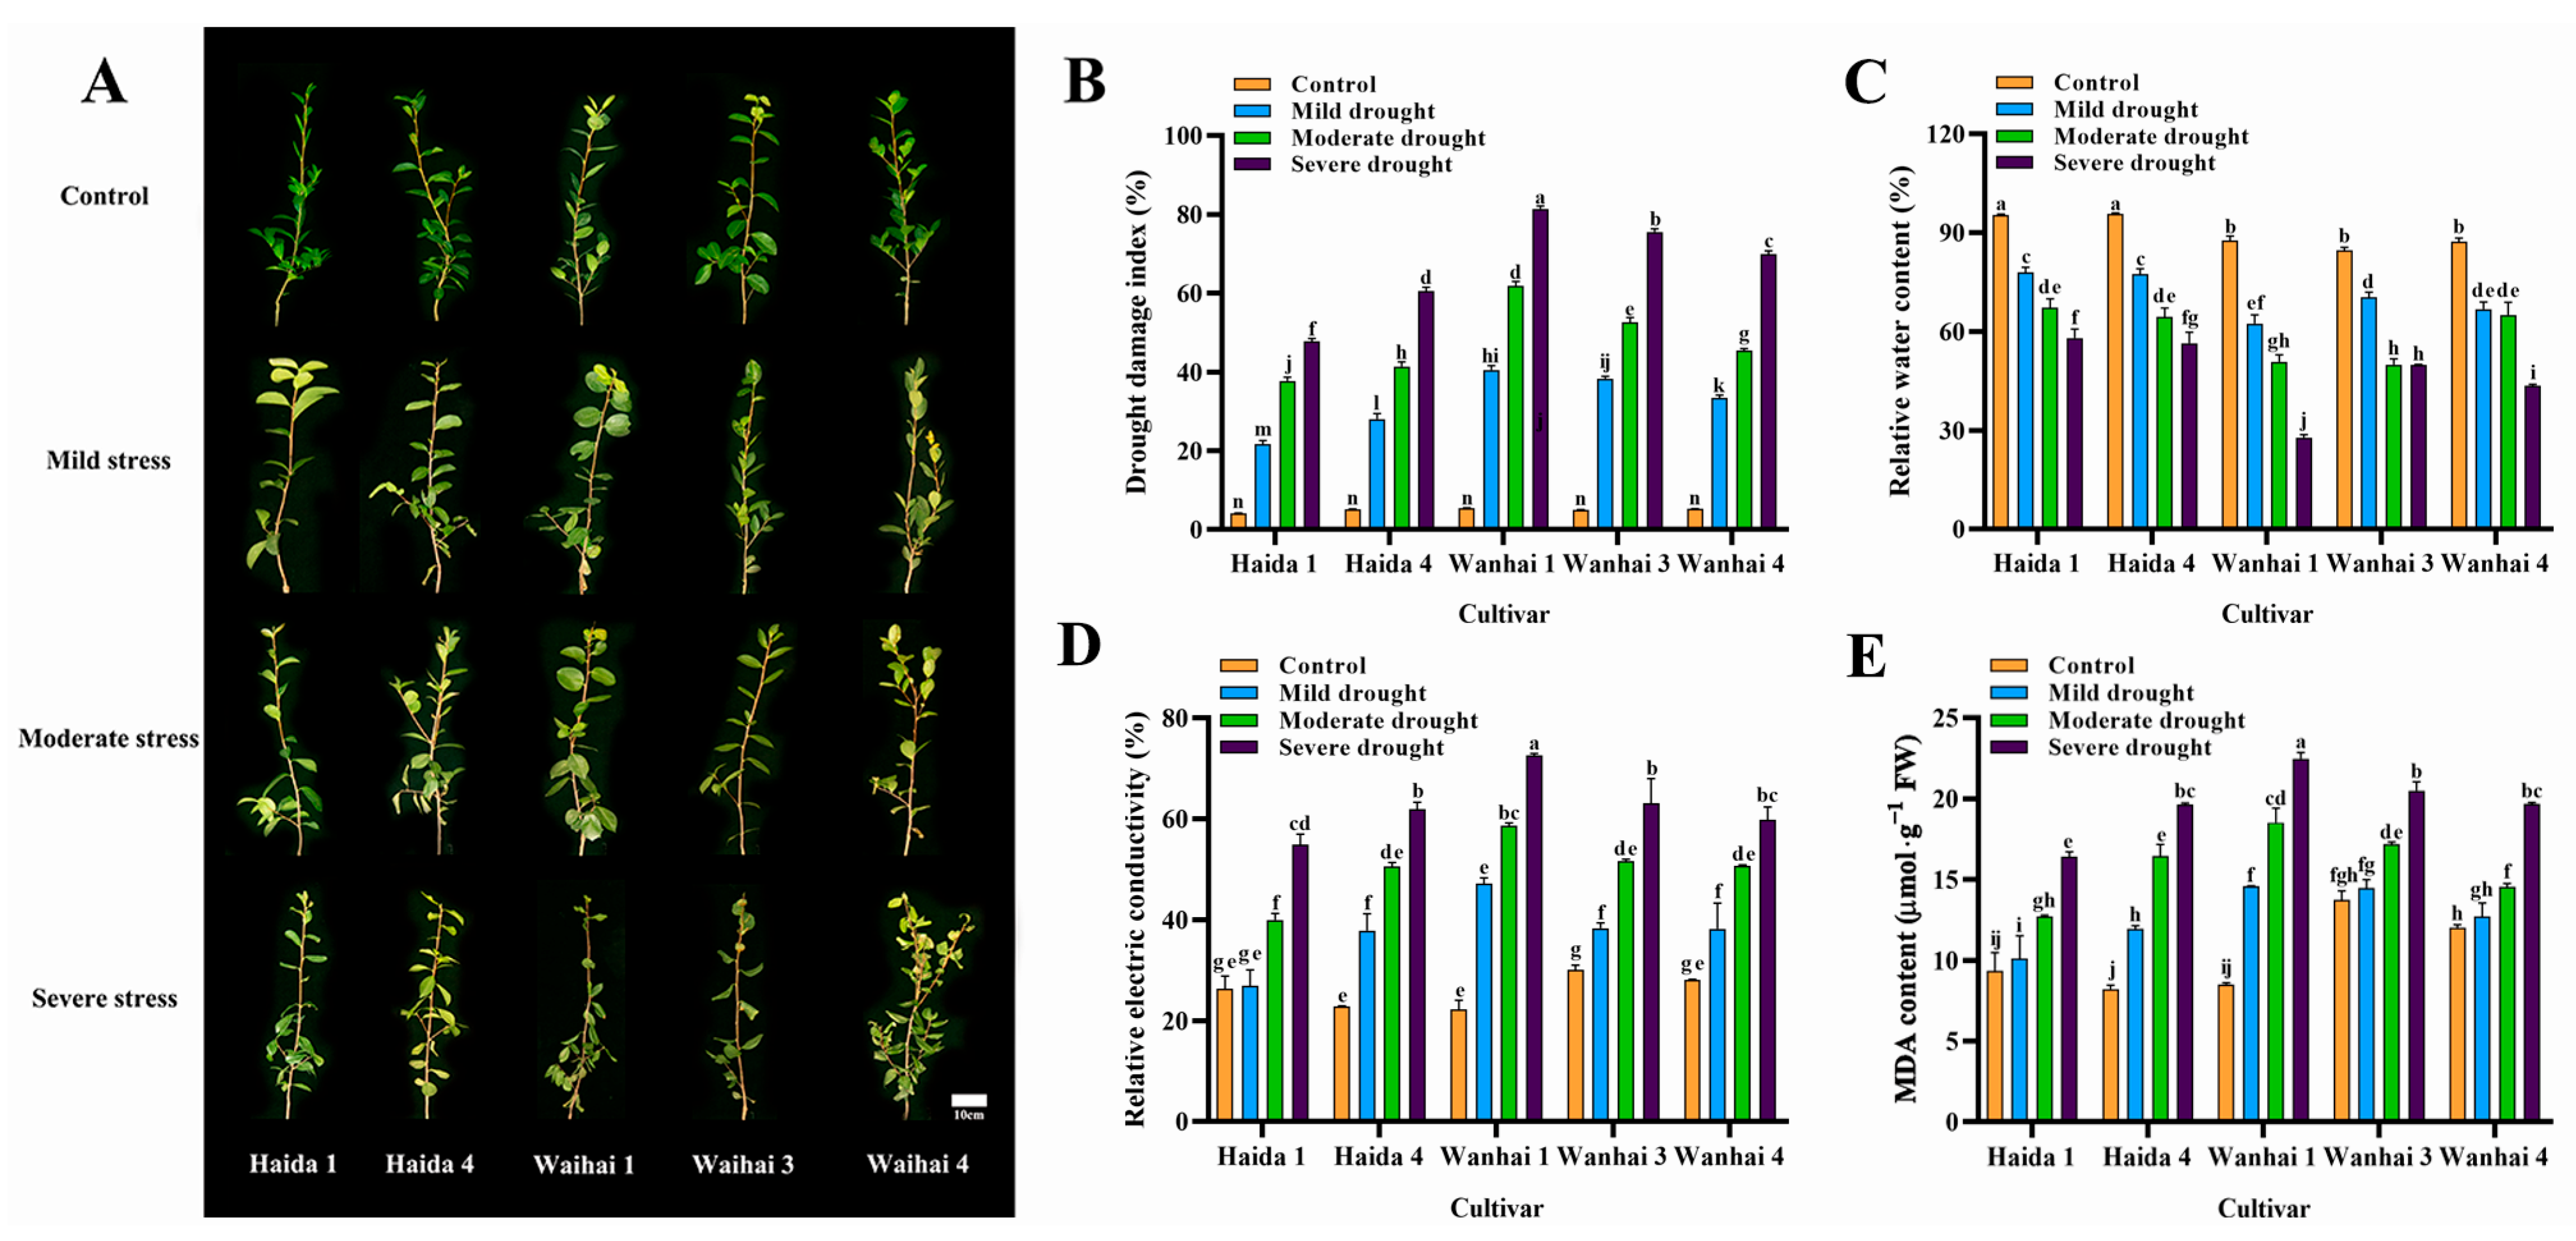
3.1. Effects of Drought Stress on the Morphological Characteristics and Membrane Permeability of Five C. vietnamensis Cultivars

The leaf morphological changes in five C. vietnamensis cultivars under drought stress are shown in Figure 1. With the increase in concentration and duration of PEG stress, the damage to the leaves of five C. vietnamensis cultivars gradually increased, from the top new leaves to the middle and lower old leaves. The different C. vietnamensis cultivars were damaged differently under PEG stress. Among the five C. vietnamensis cultivars, ‘Haida 1’ and ‘Haida 4’, showed high drought tolerance, since their leaves were less damaged under drought stress than those of the other cultivars. However, ‘Wanhai 1’ and ‘Wanhai 3’ were sensitive to drought stress, and the damage was observed first under drought stress. Moreover, the DIs of ‘Wanhai 1’ and ‘Wanhai 3’ were significantly higher than those of the other cultivars. ‘Haida 1’ had the lowest DI, followed by ‘Haida 4’ and ‘Wanhai 4’ (Figure 1B). Therefore, according to the leaf morphological characteristics and DIs, the five C. vietnamensis cultivars were initially divided into three groups: ‘Haida 1’ was a drought-tolerant cultivar, ‘Haida 4’ and ‘Wanhai 4’ were moderately drought-resistant cultivars, and ‘Wanhai 1’ and ‘Wanhai 3’ were drought-sensitive cultivars.
The REC and MDA content are the basic indexes to reflect damage to the plant membrane system under drought stress. The higher the REC content is, the more serious the damage degree, and vice versa. In our study, the REC of five C. vietnamensis cultivars showed varying degrees of increase under different drought stresses (Figure 1D). Under severe drought stress, the REC of ‘Wanhai 1’ and ‘Haida 4’ increased by 2.27- and 1.71-fold compared with the control, respectively. Under the same conditions, the REC of ‘Haida 1’, ‘Wanhai 3’, and ‘Wanhai 4’ showed relatively small changes, increasing by 1.09-, 1.10-, and 1.13-fold, respectively. MDA content is an important indicator reflecting the degree of plant membrane lipid peroxidation. Under three types of drought stress, the MDA content of five C. vietnamensis cultivars was significantly higher than that of the control plant, indicating an increase in membrane lipid peroxidation in five C. vietnamensis cultivars (Figure 1E).

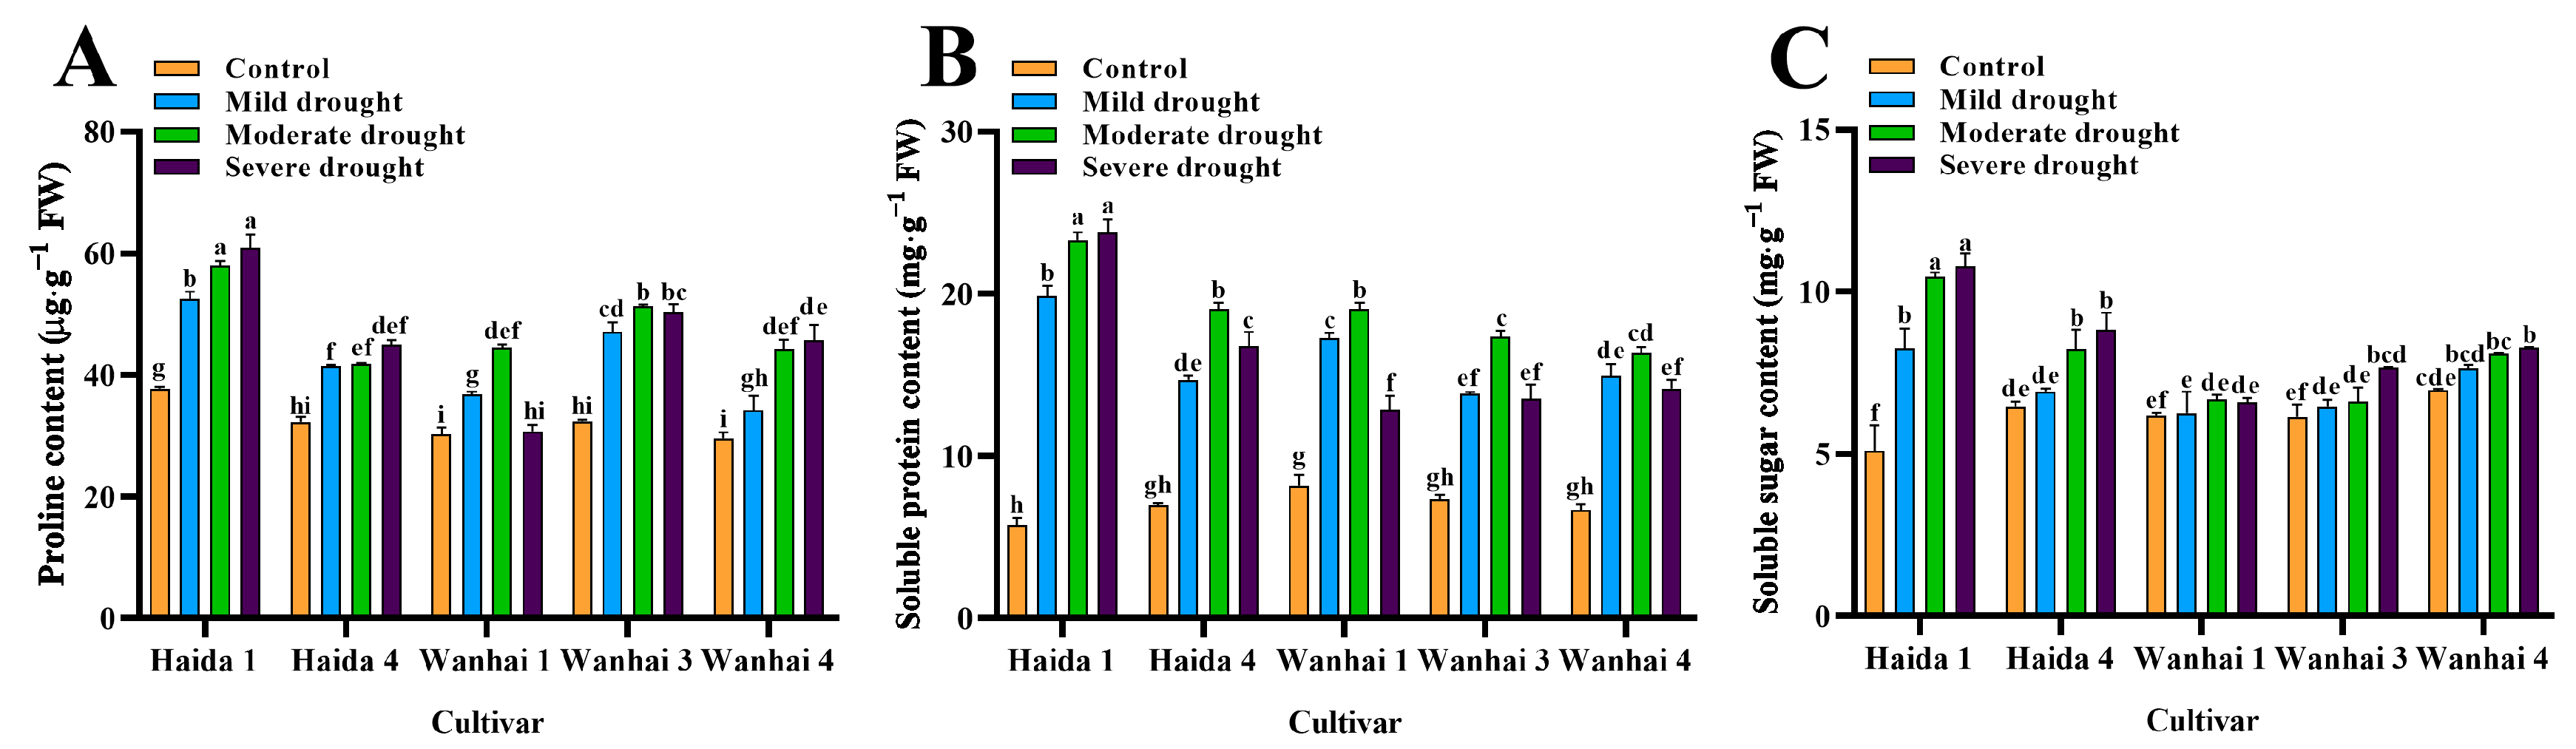
3.2. Effects of Drought Stress on the Osmotic Regulation-Substance Content of Five C. vietnamensis Cultivars

Drought stress can significantly increase the contents of Pro, SP and SS in C. vietnamensis cultivar leaves. Compared with other cultivars, the Pro, SP and SS contents of ‘Haida 1’ remained the highest under different drought stresses (Figure 2). Among the three C. vietnamensis cultivars ‘Haida 1’, ‘Haida 4’, and ‘Wanhai 4’, the Pro content increased with increasing stress intensity, and the increase in ‘Haida 1’ was significantly stronger than that in the other cultivars (Figure 2A). Except for ‘Haida 1’, the SP content of ‘Haida 4’, ‘Wanhai 1’, ‘Wanhai 3’, and ‘Wanhai 4’ first increased and then decreased with increasing drought intensity (Figure 2B), reaching its maximum value under moderate drought stress, at 19.06, 19.05, 17.37, and 16.36 mg/g, respectively. Compared with ‘Haida 1’ and ‘Haida 4’, the SS contents of ‘Wanhai 1’, ‘Wanhai 3’, and ‘Wanhai 4’ showed little change (Figure 2C).

3.3. Effects of Drought Stress on the Photosynthetic Pigment Contents of Five C. vietnamensis Cultivars

Under different drought stresses, the contents of Chl A, Chl B, Car and total Chl of all C. vietnamensis cultivars were significantly higher than those of the control. Meanwhile, the variation tendencies in the photosynthetic pigment contents of the five C. vietnamensis cultivars were similar. With the increase in drought-stress intensity, the contents of Chl A, Chl B, Car and total Chl showed a trend of first increasing and then decreasing, but their photosynthetic pigment content showed significant differences (Figure 3). The photosynthetic pigment content of ‘Haida 1’, ‘Haida 4’ and ‘Wanhai 3’ reached a maximum under moderate drought stress and then decreased under severe drought stress. The photosynthetic pigment content of ‘Wanhai 1’ and ‘Wanhai 4’ reached a maximum under mild drought stress and decreased under moderate and severe drought stress.

3.4. Effects of Drought Stress on Antioxidant Enzyme Activities and Secondary Metabolites of Five C. vietnamensis Cultivars

The enzyme activities of SOD, POD and CAT were affected by the interaction between cultivar and drought-stress treatment. The antioxidant enzyme activities of ‘Haida 1’ and ‘Haida 4’ showed similar responses to drought stress, with significantly increased SOD, POD, and CAT enzyme activities compared to the control. The POD and CAT enzyme activities of ‘Wanhai 3’ and ‘Wanhai 4’ increased with increasing drought-stress intensity. However, the antioxidant enzyme activity of ‘Wanhai 1’ did not change significantly under drought stress and increased first and then decreased with increasing drought-stress intensity (Figure 4A–C).
Under different drought stresses, the contents of TS, Pol, and Fla in the five C. vietnamensis cultivars were higher than those in the control (Figure 4D–F). The contents of TS, Pol, and Fla in ‘Haida 1’ and ‘Haida 4’ increased with increasing drought-stress intensity. Compared with other cultivars, the TS contents of ‘Wanhai 1’ and ‘Wanhai 3’ showed little change under drought stress, while the TS content of ‘Wanhai 4’ significantly increased under severe- drought stress (Figure 4D). The Pol and Fla contents of ‘Wanhai 1’ and ‘Wanhai 3’ increased under mild and moderate drought stress but decreased under severe drought stress (Figure 4E,F), while the Fla content of ‘Wanhai 4’ continued to increase under drought stress (Figure 4F).

3.5. Effects of Drought Stress on the Expression of Key Genes in Phenylpropane Metabolism

By analyzing the previous transcriptome data, six key genes related to drought stress were selected. The relative expression levels of six key genes involved in the phenylpropanoid metabolism pathway were compared under different drought-stress treatments (Figure 5). Except for CvPOX3, the relative expression levels of the other five genes under drought stress showed similar responses in ‘Haida 1’, ‘Haida 4’, and ‘Wanhai 4’. The relative expression levels of CvCAD1 and CvPOX1 in ‘Wanhai 1’ and ‘Wanhai 3’ first increased and then decreased with increasing drought-stress intensity. Compared with the control plant, all six genes of the five C. vietnamensis cultivars were significantly upregulated (except for CvCAD2 and CvPOX3 of ‘Wanhai 1’).

3.6. Comprehensive Evaluation of Drought Resistance of C. vietnamensis

Through HCA, we divided 23 growth, physiological, biochemical, and related gene parameters under drought stress into three clusters (Figure 6, J1–J3). Under mild and moderate drought stress (Figure 6A,B), J1 was mainly composed of DI, REC, and MDA, and similar results were also clustered under severe drought stress (Figure 6C, J3). Under moderate and severe drought stress (Figure 6B,C), J2 was mainly composed of Chl A, Chl B, Car, total Chl, CAT, SOD, SS, SP, Cv4CL1, CvCAD1, CvPOX1, CvPOX2, and CvPOX3. Similar results were also clustered under mild drought stress J3 (Figure 6A). Based on the data of moderate drought stress, the heatmap divided the five C. vietnamensis cultivars into three different clusters (Figure 6B, H1–H3). Cluster H1 represents the drought-tolerant cultivar ‘Haida 1’. Moderately drought-tolerant cultivars, including ‘Haida 4’ and ‘Wanhai 4’, belong to cluster H2. Cluster H3 represents drought-sensitive cultivars, consisting of ‘Wanhai 1’ and ‘Wanhai 3’ (Figure 6). Similarly, HCA analysis was conducted based on mild (Figure 6A) and severe (Figure 6C) drought-stress data. ‘Haida 1’ still represents the drought-tolerant cultivar, while ‘Haida 4’, ‘Wanhai 4’, ‘Wanhai 3’, and ‘Wanhai 1’ represent drought-sensitive cultivars. Based on the above results, we classified five C. vietnamensis cultivars into drought-tolerant cultivars (‘Haida 1’); moderate drought-tolerant cultivars (‘Haida 4’ and ‘Wanhai 4’); and drought-sensitive cultivars (‘Wanhai 3’ and ‘Wanhai 1’).
Drought stress led to significant changes in 23 drought-related indicators (Table S4). There were significant differences in the DTC values in the different physiological indicators in the same cultivars (p < 0.05), such as an increase in the DTCs (DTC > 1) of DI, SS, SOD, MDA, Fla, total Chl, and CvPOX2 under drought stress and a decrease in RWC (DTC < 1). SP, Chl B, Pol, CAT, Cv4CL1, and CvCAD1 had significant differences in DTC between the different cultivars (p < 0.05). Therefore, relying solely on DTC with a single indicator for drought-resistance evaluation may result in misleading results.
Correlation analysis was conducted on 23 drought-related indicators in five C. vietnamensis cultivars (Table S5), and the results showed that there was a significant correlation between the measured indicators. For example, SS showed a highly significantly positive correlation with SP and CvCAD1 (p < 0.01), SOD showed a highly significantly positive correlation with SS, SP, Cv4CL1, and CvCAD1 (p < 0.05), and DI showed a negative correlation with SS, SP, SOD, Fla, Car, CvCAD2, and CvPOX1 (p < 0.05). The correlation between each physiological index is different, which leads to information overlap. Therefore, conducting PCA on data under different drought stresses can reduce information overlap between the various physiological indicators. Based on the criteria of cumulative contribution rate (>85%) and eigenvalues (>1) [51], we selected three principal components. Their cumulative contribution rates were 92.34%, 91.24%, and 95.50%, respectively (Table S5), indicating that these three principal components already reflected most of the information from the original data and can be used to comprehensively evaluate the drought resistance of five C. vietnamensis cultivars.
As shown in Table 1, 23 indicators were converted into 3 comprehensive indicators. Under mild drought stress, the contributions of the three comprehensive indicators were 49.827%, 28.035%, and 14.475%, respectively. The eigenvalues were 11.460, 6.448, and 3.329, respectively. Under moderate stress, the contributions of the three comprehensive indicators were 59.295%, 17.963%, and 13.983%, respectively. The eigenvalues were 13.638, 4.131, and 3.216, respectively. Under severe stress, the contributions of the three comprehensive indicators were 70.313%, 16.322%, and 8.868%, respectively. The eigenvalues were 16.172, 3.754, and 2.040, respectively. PC1 had the greatest contribution to the total genetic rate, and the greater the loading of the variables, the stronger their contribution to the variation. Under different drought stresses, PC1 included SS, SOD, Cv4CL1, CvCAD1, CvPOX1, and CvPOX2 with high positive loading and DI and REC with negative loading. PC2 included ChlA, ChlB, total Chl, and MDA with high positive loading and Pro and Pol with negative loading. PC3 included TS, Fla, POD with high positive loading and RWC, Pol, MDA with negative loading (Table 1).
The weights were calculated based on the contributions of the comprehensive indicators obtained under different drought stresses. The weights of the three comprehensive indicators under mild, moderate, and severe drought stress were 0.54, 0.30, and 0.16; 0.65, 0.20, and 0.15; and 0.74, 0.17, and 0.09, respectively (Table 2). According to the weight values of each comprehensive indicator, the importance of each indicator under drought stress can be determined. The larger the weight value, the greater the importance, and vice versa. From Table 3, it can be seen that SS, SP, SOD, CAT and TS are the most significant physiological indicators that affect the drought resistance of C. vietnamensis. The higher the F value, the stronger the relative drought tolerance of C. vietnamensis under drought stress. The cultivar with the highest F value was ‘Haida 1’, followed by ‘Haida 4’ and ‘Wanhai 4’, while ‘Wanhai 3’ and ‘Wanhai 1’ had the lowest F value and were therefore considered the least drought tolerant (Table 2).
Cluster analysis was used to classify the F values of five C. vietnamensis cultivars. Five C. vietnamensis cultivars were grouped into three groups at a Euclidean distance of five (Figure 7). Only ‘Haida 1’ clustered in the drought-resistant group (Figure 7Ⅰ). The moderate drought tolerance group included ‘Haida 4’ and ‘Wanhai 4’ (Figure 7Ⅱ). ‘Wanhai 3’ and ‘Wanhai 1’ clustered into the drought-sensitive cultivar group (Figure 7III).

4. Discussion

4.1. Plant Growth and Membrane Lipid Peroxidation

Under drought stress, the growth rate and metabolic activity of plants are severely restricted, leading to delayed growth, premature leaf senescence, and even death in severe cases [53,54]. In this study, plants that underwent the drought treatment showed symptoms such as plant growth restriction, leaf dehydration, and curling death, and the DI of leaves increased with increasing stress intensity (Figure 1A,B), consistent with previous research on rice, maize, and Camellia oleifera [18,29,55]. Water is the material basis for plant cell survival and a prerequisite for plant growth and development [56]. Many studies have shown that the smaller the decrease in RWC in the plant leaves, the stronger their water holding capacity, the lower their degree of membrane lipid peroxidation, and the stronger their tolerance to drought stress [57]. This study showed that with increasing stress intensity, the RWC of five C. vietnamensis cultivars showed a downward trend, while the REC and MDA contents significantly increased (Figure 1C–E). Some cultivars perform better under stress conditions than others and can maintain a relatively stable growth state even under severe stress conditions [42]. For example, under severe drought stress, ‘Haida 1’ could maintain low DI and MDA contents, and plant growth was only slightly inhibited. However, in the sensitive varieties ‘Wanhai 1’ and ‘Wanhai 3’ with high DI and MDA contents, they showed severe inhibition (Figure 1B,E). The above results indicate that different cultivars have different physiological responses to drought stress, which is consistent with the results of Thu et al. [58] and Mahmood et al. [59].

4.2. Physiological Responses and Drought Tolerance

Plants utilize various regulatory mechanisms to adapt to adverse environments, and osmotic regulation is an important physiological response for plants to adapt to arid environments [60,61]. Drought stress can increase the SP, SS and Pro contents of Phedimus aizoon L. and soybeans to improve their drought tolerance [62,63]. In this study, with the increase in drought-stress intensity, the SP, SS, and Pro contents of highly drought-tolerant cultivar ‘Haida 1’ significantly increased, while in sensitive cultivar ‘Wanhai 1’, they first increased and then rapidly decreased (Figure 2). This indicates that there are significant differences in drought resistance among different cultivars. Among them, the drought-resistant cultivar ‘Haida 1’ had better osmotic regulation ability than other cultivars.
Drought stress can cause ROS to increase, subjecting plant cells to oxidative stress [64]. The antioxidant enzyme system is the main defense system for plants to clear ROS in response to stress, and SOD, POD, and CAT enzymes are the main antioxidant enzymes in plants [65,66]. In this study, with increasing stress intensity, the SOD, POD, and CAT activities of ‘Haida 1’ and ‘Wanhai 4’ significantly increased, while the activities of ‘Wanhai 1’ first increased and then decreased (Figure 4A–C). The above results show that C. vietnamensis cultivars with strong drought resistance can actively increase the activity of antioxidant enzymes to resist oxidative stress and maintain normal plant growth and development, while sensitive cultivars are unable to respond to severe oxidative stress.
Under drought stress, the large accumulation of ROS leads to the disruption of the chlorophyll synthesis pathways, accelerating chlorophyll degradation and thus significantly inhibiting plant photosynthesis [67,68]. Due to water loss in plants, leaf stomata close, and chlorophyll content decreases [69]. In the Camellia genus, studies have shown that there may be a phenomenon of chlorophyll ‘concentration’ in the early stage of stress [54]. This study also found a similar result; that is, under drought stress, the chlorophyll content of five C. vietnamensis cultivars showed a trend of first increasing and then decreasing. The chlorophyll content of ‘Wanhai 1’, ‘Wanhai 3’ and ‘Wanhai 4’ showed significant losses, while the chlorophyll content of ‘Haida 1’ showed relatively stable changes (Figure 3). The results showed that cultivars with strong drought resistance can maintain stable changes in chlorophyll content, thereby achieving higher photosynthetic efficiency and improving plant drought resistance [56,70].

4.3. Response of Key Genes and Metabolites in the Phenylpropane Pathway to Drought Tolerance

The phenylpropane metabolism is widely involved in the response of plants to stress by inducing the expression of structural genes, synthesizing specific secondary metabolites, and directly or indirectly enhancing plant stress resistance [27,47]. Research has shown that drought stress can induce the expression of phenylpropane pathway-related genes and the generation of metabolites. For example, under drought stress, 4CLs, CADs, and POXs are upregulated, inducing the synthesis of terpenoids, polyphenols, and flavonoids [29,71]. This study shows that, under different drought stresses, the expression levels of Cv4CL1, CvCAD1, CvCAD2, CvPOX1, CvPOX2, and CvPOX3 were significantly higher in drought-tolerant varieties (‘Haida 1’) than in drought-sensitive varieties (‘Wanhai 3’ and ‘Wanhai 1’) (Figure 5), consistent with the measured changes in TS, Fla and Pol content (Figure 4D–F). The above results show that the expression activation levels and metabolites generated by these genes are closely related to the drought tolerance of the five C. vietnamensis cultivars. Compared with sensitive cultivars, drought-tolerant cultivars can better output and transmit stress signals, accelerate the generation of metabolic products related to drought resistance, and further regulate complex physiological processes.

4.4. PCA, HCA and Multivariate Statistical Analysis of Drought Tolerance

The drought resistance of plants is a complex comprehensive trait influenced by multiple factors and cannot be evaluated using a single indicator. Therefore, for the evaluation of plant drought resistance, multiple indicators should be used to comprehensively evaluate the one-sidedness caused by a single indicator in evaluating a plant variety’s drought resistance [51,72]. Han et al. [56] and Xiong et al. [33] used PCA to evaluate the differences in drought resistance between eight Melia azedarach and four oak species and believed that these differences were mainly due to differences in growth traits and physiological responses. However, considering that only using the PCA evaluation method would create a certain degree of overlap for the obtained statistical data and affect the final evaluation results, we further analyzed and evaluated the drought resistance of five C. vietnamensis cultivars using the membership function method and HCA method [42,73]. This study calculated the DTC of five C. vietnamensis cultivars under different drought stresses (Table S4) and used principal component analysis to convert 23 drought-related indicators into 3 comprehensive indicators (Table 1). Among them, the SS and SOD in the first comprehensive indicator make the greatest contribution to the total heritability, while the total Chl, MDA, and TS in the second and third comprehensive indicators also make a greater contribution to the total heritability (Table 1). Then, the weight method was used to construct the principal component synthesis model (Table 3), and the F value was calculated to evaluate the drought resistance of five C. vietnamensis cultivars. Cluster analysis was conducted based on the F value to classify the five C. vietnamensis cultivars into three categories. Among them, ‘Haida 1’ (0.95) had the highest F value and was clustered into a drought-tolerant group. ‘Haida 4’ (0.40) and ‘Wanhai 4’ (0.26) clustered into a moderate drought-tolerant group, while ‘Wanhai 3’ (0.11) and ‘Wanhai 1’ (0.05) clustered into a sensitive cultivar group (Table 2). The above results were basically consistent with the phenotypic changes in C. vietnamensis and HCA results, indicating that the method could accurately evaluate the drought resistance of different cultivars of C. vietnamensis. In addition, this study also provides a method for evaluating the drought resistance of crops such as C. vietnamensis under abiotic stress, providing an indispensable reference basis for the selection of drought-resistant cultivars of C. vietnamensis and the evaluation of plant drought resistance.

5. Conclusions

Under different drought stresses, significant changes were found in the morphological characteristics, physiological and biochemical characteristics, and related gene expression of five C. vietnamensis cultivars. Mild and moderate drought stress has little effect on the growth of C. vietnamensis cultivars, while under severe stress, plant growth is significantly inhibited. Moreover, different cultivars have different response mechanisms to drought stress. The main differences among the five C. vietnamensis cultivars were the retention ability, osmotic regulation ability, reactive oxygen species clearance ability, secondary metabolite accumulation ability, and related gene expression responses of RWC in the leaves. In addition, five C. vietnamensis cultivars were classified into three categories, comprehensively using DTC, HCA, and PCA, based on 23 indicators of growth, physiological, biochemical, and related gene expression under different drought stresses. The results are as follows: (1) drought-resistant cultivar: ‘Haida 1’; (2) moderate drought-resistant cultivars: ‘Haida 4’ and ‘Wanhai 4’; (3) sensitive cultivars: ‘Wanhai 3’ and ‘Wanhai 1’. These results will be beneficial for the scientific cultivation and promotion of C. vietnamensis in arid areas.

Supplementary Materials

The following supporting information can be downloaded at: https://0-www-mdpi-com.brum.beds.ac.uk/article/10.3390/agronomy14050915/s1, Table S1: Basic situation of seedlings of five C. vietnamensis cultivars (mean + standard deviation); Table S2: Classification of damage levels of C. vietnamensis under drought stress; Table S3: Sequence of primers used for expression analysis in this study. F for the forward primer, R for the reverse primer and length of primers; Table S4: Drought tolerance coefficient of leaf physiological indexes of five C. vietnamensis cultivars under drought stress; Table S5: Correlation coefficient of leaf physiological indexes of five C. vietnamensis cultivars under drought stress.

Author Contributions

Conceptualization, Y.W. and H.Y.; methodology, S.S. and W.Y.; software, S.X. and J.Y.; validation, S.S. and W.Y.; formal analysis, S.S. and G.Y.; investigation, S.S. and S.X.; resources, Y.W. and H.Y.; data curation, S.S. and W.Y.; writing—original draft preparation, S.S. and W.Y.; writing—review and editing, Y.W. and H.Y.; visualization, Y.L. and D.Y.; supervision, Y.W. and H.Y.; project administration, Y.W. and J.Y.; funding acquisition, Y.W. and H.Y. All authors have read and agreed to the published version of the manuscript.

Funding

This work was financially supported by the Funding for Science and Technology Talent Innovation Project of Hainan Province, China (KJRC2023C23), Key R&D Program of Hainan Province, China (ZDYF2022SHFZ020).

Data Availability Statement

Data is contained within the article or Supplementary Material.

Acknowledgments

We fully appreciate the editors and all anonymous reviewers for their constructive comments on this manuscript.

Conflicts of Interest

The authors declare no conflicts of interest.

References

  1. Razi, K.; Muneer, S. Drought stress-induced physiological mechanisms, signaling pathways and molecular response of chloroplasts in common vegetable crops. Crit. Rev. Biotechnol. 2021, 41, 669–691. [Google Scholar] [CrossRef] [PubMed]
  2. Adams, H.D.; Zeppel, M.; Anderegg, W.; Hartmann, H.; Mcdowell, N.G. A multi-species synthesis of physiological mechanisms in drought-induced tree mortality. Nat. Ecol. Evol. 2017, 1, 1285–1291. [Google Scholar] [CrossRef] [PubMed]
  3. Prăvălie, R. Drylands extent and environmental issues. A global approach. Earth-Sci. Rev. 2016, 161, 259–278. [Google Scholar] [CrossRef]
  4. Ault, T.R. On the essentials of drought in a changing climate. Science 2020, 368, 256–260. Available online: https://www.science.org/doi/10.1126/science.aaz5492 (accessed on 20 December 2022). [CrossRef] [PubMed]
  5. Mondal, S.K.; Mishra, A.; Leung, R.; Cook, B. Global droughts connected by linkages between drought hubs. Nat. Commun. 2023, 14, 144. [Google Scholar] [CrossRef] [PubMed]
  6. Rane, J.; Singh, A.K.; Tiwari, M.; Prasad, P.V.; Jagadish, S.V. Effective use of water in crop plants in dryland agriculture: Implications of reactive oxygen species and antioxidative system. Front. Plant Sci. 2022, 12, 778270. [Google Scholar] [CrossRef] [PubMed]
  7. Dietz, K.J.; Zörb, C.; Geilfus, C.M. Drought and crop yield. Plant Biol. 2021, 23, 881–893. [Google Scholar] [CrossRef] [PubMed]
  8. Hendrawan, V.S.A.; Komori, D.; Kim, W. Possible factors determining global-scale patterns of crop yield sensitivity to drought. PLoS ONE 2023, 18, e0281287. [Google Scholar] [CrossRef]
  9. Zhang, F.; Zhu, F.; Chen, B.; Su, E.; Chen, Y.; Cao, F. Composition, bioactive substances, extraction technologies and the influences on characteristics of Camellia oleifera oil: A review. Food Res. Int. 2022, 156, 111159. [Google Scholar] [CrossRef]
  10. Li, M.; Wang, G.; Zong, S.; Chai, X. Copula-Based Assessment and Regionalization of Drought Risk in China. Int. J. Environ. Res. Public Health 2023, 20, 4074. [Google Scholar] [CrossRef]
  11. Mao, D.; Wang, Z.; Wu, B.; Zeng, Y.; Luo, L.; Zhang, B. Land degradation and restoration in the arid and semiarid zones of China: Quantified evidence and implications from satellites. Land Degrad. Dev. 2018, 29, 3841–3851. [Google Scholar] [CrossRef]
  12. Gao, S.; Wang, Y.; Yu, S.; Huang, Y.; Liu, H.; Chen, W.; He, X. Effects of drought stress on growth, physiology and secondary metabolites of Two Adonis species in Northeast China. Sci. Hortic. 2020, 259, 108795. [Google Scholar] [CrossRef]
  13. Lim, C.W.; Baek, W.; Jung, J.; Kim, J.H.; Lee, S.C. Function of ABA in stomatal defense against biotic and drought stresses. Int. J. Mol. Sci. 2015, 16, 15251–15270. [Google Scholar] [CrossRef] [PubMed]
  14. Zandalinas, S.I.; Fichman, Y.; Devireddy, A.R.; Sengupta, S.; Azad, R.K.; Mittler, R. Systemic signaling during abiotic stress combination in plants. Proc. Nati. Acad. Sci. USA 2020, 117, 13810–13820. [Google Scholar] [CrossRef] [PubMed]
  15. Zhu, J.K. Salt and drought stress signal transduction in plants. Annu. Rev. Plant Biol. 2002, 53, 247–273. [Google Scholar] [CrossRef] [PubMed]
  16. Farooq, M.; Wahid, A.; Kobayashi, N.S.M.A.; Fujita, D.B.S.M.A.; Basra, S.M.A. Plant drought stress: Effects, mechanisms and management. In Sustainable Agriculture; Springer: Dordrecht, The Netherlands, 2009; pp. 153–188. [Google Scholar] [CrossRef]
  17. Zivcak, M.; Brestic, M.; Balatova, Z.; Drevenakova, P.; Olsovska, K.; Kalaji, H.M.; Yang, X.; Allakhverdiev, S.I. Photosynthetic electron transport and specific photoprotective responses in wheat leaves under drought stress. Photosynth. Res. 2013, 117, 529–546. [Google Scholar] [CrossRef]
  18. Waititu, J.K.; Zhang, X.; Chen, T.; Zhang, C.; Zhao, Y.; Wang, H. Transcriptome analysis of tolerant and susceptible maize genotypes reveals novel insights about the molecular mechanisms underlying drought responses in leaves. Int. J. Mol. Sci. 2021, 22, 6980. [Google Scholar] [CrossRef] [PubMed]
  19. Zhang, A.; Ji, Y.; Sun, M.; Lin, C.; Zhou, P.; Ren, J.; Luo, D.; Wang, X.; Ma, C.; Zhang, X.; et al. Research on the drought tolerance mechanism of Pennisetum glaucum (L.) in the root during the seedling stage. BMC Genom. 2021, 22, 568. [Google Scholar] [CrossRef] [PubMed]
  20. Cheng, L.; Han, M.; Yang, L.M.; Li, Y.; Sun, Z.; Zhang, T. Changes in the physiological characteristics and baicalin biosynthesis metabolism of Scutellaria baicalensis Georgi under drought stress. Ind. Crops Prod. 2018, 122, 473–482. [Google Scholar] [CrossRef]
  21. Hu, Y.; Wang, B.; Hu, T.; Chen, H.; Li, H.; Zhang, W.; Zhong, Y.; Hu, H. Combined action of an antioxidant defence system and osmolytes on drought tolerance and post-drought recovery of Phoebe zhennan S. Lee saplings. Acta Physiol. Plant. 2015, 37, 84. [Google Scholar] [CrossRef]
  22. Ozturk, M.; Turkyilmaz Unal, B.; García-Caparrós, P.; Khursheed, A.; Gul, A.; Hasanuzzaman, M. Osmoregulation and its actions during the drought stress in plants. Physiol. Plant. 2021, 172, 1321–1335. [Google Scholar] [CrossRef]
  23. Shemi, R.; Wang, R.; Gheith, E.S.M.; Hussain, H.A.; Hussain, S.; Irfan, M.; Cholidah, L.; Zhang, K.; Zhang, S.; Wang, L. Effects of salicylic acid, zinc and glycine betaine on morpho-physiological growth and yield of maize under drought stress. Sci. Rep. 2021, 11, 3195. [Google Scholar] [CrossRef] [PubMed]
  24. Shawon, R.A.; Kang, B.S.; Lee, S.G.; Kim, S.K.; Lee, H.J.; Katrich, E.; Gorinstein, S.; Ku, Y.G. Influence of drought stress on bioactive compounds, antioxidant enzymes and glucosinolate contents of Chinese cabbage (Brassica rapa). Food Chem. 2020, 308, 125657. [Google Scholar] [CrossRef]
  25. Luo, C.; Min, W.; Akhtar, M.; Lu, X.; Bai, X.; Zhang, Y.; Tian, L.; Li, P. Melatonin enhances drought tolerance in rice seedlings by modulating antioxidant systems, osmoregulation, and corresponding gene expression. Int. J. Mol. Sci. 2022, 23, 12075. [Google Scholar] [CrossRef] [PubMed]
  26. Shehata, S.A.; Omar, H.S.; Elfaidy, A.G.; El-Sayed, S.S.; Abuarab, M.E.; Abdeldaym, E.A. Grafting enhances drought tolerance by regulating stress-responsive gene expression and antioxidant enzyme activities in cucumbers. BMC Plant Biol. 2022, 22, 408. [Google Scholar] [CrossRef] [PubMed]
  27. Zhang, G.; Zhang, M.; Zhao, Z.; Ren, Y.; Li, Q.; Wang, W. Wheat TaPUB1 modulates plant drought stress resistance by improving antioxidant capability. Sci. Rep. 2017, 7, 7549. [Google Scholar] [CrossRef] [PubMed]
  28. Gupta, A.; Rico-Medina, A.; Caño-Delgado, A.I. The physiology of plant responses to drought. Science 2020, 368, 266–269. [Google Scholar] [CrossRef]
  29. Shen, S.; Yan, W.; Xie, S.; Yu, J.; Yao, G.; Xia, P.; Wu, Y.; Yang, H. Physiological and transcriptional analysis reveals the response mechanism of Camellia vietnamensis Huang to drought stress. Int. J. Mol. Sci. 2022, 23, 11801. [Google Scholar] [CrossRef]
  30. Hu, H.; Xiong, L. Genetic engineering and breeding of drought-resistant crops. Annu. Rev. Plant Biol. 2014, 65, 715–741. [Google Scholar] [CrossRef]
  31. Du, Z.; Hu, Y.; Buttar, N.A. Analysis of mechanical properties for tea stem using grey relational analysis coupled with multiple linear regression. Sci. Hortic. 2020, 260, 108886. [Google Scholar] [CrossRef]
  32. Gedam, P.A.; Thangasamy, A.; Shirsat, D.V.; Ghosh, S.; Bhagat, K.P.; Sogam, O.A.; Gupta, A.J.; Mahajan, V.; Soumia, P.S.; Salunkhe, V.N.; et al. Screening of onion (Allium cepa L.) genotypes for drought tolerance using physiological and yield based indices through multivariate analysis. Front. Plant Sci. 2021, 12, 600371. [Google Scholar] [CrossRef]
  33. Xiong, S.; Wang, Y.; Chen, Y.; Gao, M.; Zhao, Y.; Wu, L. Effects of drought stress and rehydration on physiological and biochemical properties of four oak species in China. Plants 2022, 11, 679. [Google Scholar] [CrossRef]
  34. Zhang, T.; Qiu, F.; Chen, L.; Liu, R.; Chang, M.; Wang, X. Identification and in vitro anti-inflammatory activity of different forms of phenolic compounds in Camellia oleifera oil. Food Chem. 2021, 344, 128660. [Google Scholar] [CrossRef]
  35. Yang, H.; Zhou, H.Y.; Yang, X.N.; Zhan, J.J.; Zhou, H.; Wang, C.; Yu, Y.; Lu, X.Y.; Chen, Y.Z.; Tian, Y. Transcriptomic analysis of Camellia oleifera in response to drought stress using high throughput RNA-seq. Russ. J. Plant Physiol. 2017, 64, 728–737. [Google Scholar] [CrossRef]
  36. He, Z.; Liu, C.; Zhang, Z.; Wang, R.; Chen, Y. Integration of mRNA and miRNA analysis reveals the differentially regulatory network in two different Camellia oleifera cultivars under drought stress. Front. Plant Sci. 2022, 13, 1001357. [Google Scholar] [CrossRef]
  37. He, Z.; Cui, K.; Wang, R.; Xu, T.; Zhang, Z.; Wang, X.; Chen, Y.; Zhu, Y. Multi-omics joint analysis reveals how Streptomyces albidoflavus OsiLf-2 assists Camellia oleifera to resist drought stress and improve fruit quality. Front. Microbiol. 2023, 14, 1152632. [Google Scholar] [CrossRef]
  38. Dong, B. Comprehensive Evaluation of Drought Resistance and Transcriptome Analysis under Drought Stress in Camellia oleifera; South China Agricultural University: Guangzhou, China, 2018. [Google Scholar]
  39. Sapes, G.; Sala, A. Relative water content consistently predicts drought mortality risk in seedling populations with different morphology, physiology and times to death. Plant Cell Environ. 2021, 44, 3322–3335. [Google Scholar] [CrossRef]
  40. Blum, A.; Ebercon, A. Cell membrane stability as a measure of drought and heat tolerance in wheat. Crop Sci. 1981, 21, 43–47. [Google Scholar] [CrossRef]
  41. Dhindsa, R.S.; Plumb-Dhindsa, P.A.M.E.L.A.; Thorpe, T.A. Leaf senescence: Correlated with increased levels of membrane permeability and lipid peroxidation, and decreased levels of superoxide dismutase and catalase. J. Exp. Bot. 1981, 32, 93–101. [Google Scholar] [CrossRef]
  42. Aghaie, P.; Tafreshi, S.A.H.; Ebrahimi, M.A.; Haerinasab, M. Tolerance evaluation and clustering of fourteen tomato cultivars grown under mild and severe drought conditions. Sci. Hortic. 2018, 232, 1–12. [Google Scholar] [CrossRef]
  43. Wellburn, A.R. The spectral determination of chlorophylls a and b, as well as total carotenoids, using various solvents with spectrophotometers of different resolution. J. Plant Physiol. 1994, 144, 307–313. [Google Scholar] [CrossRef]
  44. Bouslamti, M.; El Barnossi, A.; Kara, M.; Alotaibi, B.S.; Al Kamaly, O.; Assouguem, A.; Lyoussi, B.; Benjelloun, A.S. Total polyphenols content, antioxidant and antimicrobial activities of leaves of Solanum elaeagnifolium Cav. from Morocco. Molecules 2022, 27, 4322. [Google Scholar] [CrossRef]
  45. Gorinstein, S.; Vargas, O.J.M.; Jaramillo, N.O.; Salas, I.A.; Ayala, A.L.M.; Arancibia-Avila, P.; Toledo, F.; Katrich, E.; Trakhtenberg, S. The total polyphenols and the antioxidant potentials of some selected cereals and pseudocereals. Eur. Food Res. Technol. 2007, 225, 321–328. [Google Scholar] [CrossRef]
  46. Wu, X.; Jia, L.; Wu, J.; Liu, Y.; Kang, H.; Liu, X.; Li, P.; He, P.; Tu, Y.; Li, B. Simultaneous determination and quantification of triterpene saponins from Camellia sinensis seeds using UPLC-PDA-QTOF-MS/MS. Molecules 2019, 24, 3794. [Google Scholar] [CrossRef]
  47. Dong, N.Q.; Lin, H.X. Contribution of phenylpropanoid metabolism to plant development and plant–environment interactions. J. Integr. Plant Biol. 2021, 63, 180–209. [Google Scholar] [CrossRef]
  48. Ye, Z.; Yu, J.; Yan, W.; Zhang, J.; Yang, D.; Yao, G.; Liu, Z.; Wu, Y.; Hou, X. Integrative iTRAQ-based proteomic and transcriptomic analysis reveals the accumulation patterns of key metabolites associated with oil quality during seed ripening of Camellia oleifera. Hortic. Res. 2021, 8, 1–12. [Google Scholar] [CrossRef]
  49. Livak, K.J.; Schmittgen, T.D. Analysis of relative gene expression data using real-time quantitative PCR and the 2−ΔΔCT method. Methods 2001, 25, 402–408. [Google Scholar] [CrossRef]
  50. Jiang, X.; Liu, Y.; Li, W.; Zhao, L.; Meng, F.; Wang, Y.; Tan, H.; Yang, H.; Wei, C.; Wan, X.; et al. Tissue-specific, development-dependent phenolic compounds accumulation profile and gene expression pattern in tea plant [Camellia sinensis]. PLoS ONE 2013, 8, e62315. [Google Scholar] [CrossRef]
  51. Zhao, T.; Pan, X.; Ou, Z.; Li, Q. Comprehensive evaluation of waterlogging tolerance of eleven Canna cultivars at flowering stage. Sci. Hortic. 2022, 296, 110890. [Google Scholar] [CrossRef]
  52. Chen, C.; Chen, H.; Zhang, Y.; Thomas, H.R.; Frank, M.H.; He, Y.; Xia, R. TBtools: An integrative toolkit developed for interactive analyses of big biological data. Mol. Plant 2020, 13, 1194–1202. [Google Scholar] [CrossRef]
  53. Sánchez-Rodríguez, E.; Rubio-Wilhelmi, M.; Cervilla, L.M.; Blasco, B.; Rios, J.J.; Rosales, M.A.; Romero, l.; Ruiz, J.M. Genotypic differences in some physiological parameters symptomatic for oxidative stress under moderate drought in tomato plants. Plant Sci. 2010, 178, 30–40. [Google Scholar] [CrossRef]
  54. Dong, B.; Wu, B.; Hong, W.; Li, X.; Li, Z.; Xue, L.; Huang, Y. Transcriptome analysis of the tea oil camellia (Camellia oleifera) reveals candidate drought stress genes. PLoS ONE 2017, 12, e0181835. [Google Scholar] [CrossRef] [PubMed]
  55. Bunnag, S.; Pongthai, P. Selection of rice (Oryza sativa L.) cultivars tolerant to drought stress at the vegetative stage under field conditions. Am. J. Plant Sci. 2013, 4, 1701. [Google Scholar] [CrossRef]
  56. Han, C.; Chen, J.; Liu, Z.; Chen, H.; Yu, F.; Yu, W. Morphological and Physiological Responses of Melia azedarach Seedlings of Different Provenances to Drought Stress. Agronomy 2022, 12, 1461. [Google Scholar] [CrossRef]
  57. Li, P.; Yang, H.; Wang, L.; Liu, H.; Huo, H.; Zhang, C.; Liu, A.; Zhu, A.; Hu, J.; Lin, Y.; et al. Physiological and transcriptome analyses reveal short-term responses and formation of memory under drought stress in rice. Front. Genet. 2019, 10, 55. [Google Scholar] [CrossRef] [PubMed]
  58. Thu, N.B.A.; Nguyen, Q.T.; Hoang, X.L.T.; Thao, N.P.; Tran, L.S.P. Evaluation of drought tolerance of the Vietnamese soybean cultivars provides potential resources for soybean production and genetic engineering. BioMed Res. Int. 2014, 2014, 809736. [Google Scholar] [CrossRef] [PubMed]
  59. Mahmood, T.; Iqbal, M.S.; Li, H.; Nazir, M.F.; Khalid, S.; Sarfraz, Z.; Hu, D.; Baojun, C.; Geng, X.; Tajo, S.M.; et al. Differential seedling growth and tolerance indices reflect drought tolerance in cotton. BMC Plant Biol. 2022, 22, 331. [Google Scholar] [CrossRef]
  60. Xiong, L.; Zhu, J.K. Molecular and genetic aspects of plant responses to osmotic stress. Plant Cell Environ. 2002, 25, 131–139. [Google Scholar] [CrossRef]
  61. Nxele, X.; Klein, A.; Ndimba, B.K. Drought and salinity stress alters ROS accumulation, water retention, and osmolyte content in sorghum plants. S. Afr. J. Bot. 2017, 108, 261–266. [Google Scholar] [CrossRef]
  62. Liu, Y.; He, Z.; Xie, Y.; Su, L.; Zhang, R.; Wang, H.; Li, C.; Long, S. Drought resistance mechanisms of Phedimus aizoon L. Sci. Rep. 2021, 11, 13600. [Google Scholar] [CrossRef]
  63. Wang, X.; Li, Y.; Wang, X.; Li, X.; Dong, S. Physiology and metabonomics reveal differences in drought resistance among soybean varieties. Bot. Stud. 2022, 63, 8. [Google Scholar] [CrossRef] [PubMed]
  64. Sharma, P.; Dubey, R.S. Drought induces oxidative stress and enhances the activities of antioxidant enzymes in growing rice seedlings. Plant Growth Regul. 2005, 46, 209–221. [Google Scholar] [CrossRef]
  65. Zhang, X.; Lei, L.; Lai, J.; Zhao, H.; Song, W. Effects of drought stress and water recovery on physiological responses and gene expression in maize seedlings. BMC Plant Biol. 2018, 18, 68. [Google Scholar] [CrossRef] [PubMed]
  66. Chaeikar, S.S.; Marzvan, S.; Khiavi, S.J.; Rahimi, M. Changes in growth, biochemical, and chemical characteristics and alteration of the antioxidant defense system in the leaves of tea clones (Camellia sinensis L.) under drought stress. Sci. Hortic. 2020, 265, 109257. [Google Scholar] [CrossRef]
  67. Mathobo, R.; Marais, D.; Steyn, J.M. The effect of drought stress on yield, leaf gaseous exchange and chlorophyll fluorescence of dry beans (Phaseolus vulgaris L.). Agric. Water Manag. 2017, 180, 118–125. [Google Scholar] [CrossRef]
  68. Gurumurthy, S.; Sarkar, B.; Vanaja, M.; Lakshmi, J.; Yadav, S.K.; Maheswari, M. Morpho-physiological and biochemical changes in black gram (Vigna mungo L. Hepper) genotypes under drought stress at flowering stage. Acta Physiol. Plant. 2019, 41, 42. [Google Scholar] [CrossRef]
  69. Stefanov, M.; Rashkov, G.; Borisova, P.; Apostolova, E. Sensitivity of the Photosynthetic Apparatus in Maize and Sorghum under Different Drought Levels. Plants 2023, 12, 1863. [Google Scholar] [CrossRef] [PubMed]
  70. Zhang, Y.B.; Yang, S.L.; Dao, J.M.; Deng, J.; Shahzad, A.N.; Fan, X.; Li, R.D.; Quan, Y.J.; Bukhari, S.A.H.; Zeng, Z.H. Drought-induced alterations in photosynthetic, ultrastructural and biochemical traits of contrasting sugarcane genotypes. PLoS ONE 2020, 15, e0235845. [Google Scholar] [CrossRef]
  71. Hu, H.; Fei, X.; He, B.; Luo, Y.; Qi, Y.; Wei, A. Integrated analysis of metabolome and transcriptome data for uncovering flavonoid components of Zanthoxylum bungeanum maxim. leaves under drought stress. Front. Nutr. 2022, 8, 801244. [Google Scholar] [CrossRef]
  72. Pacheco, J.; Plazas, M.; Pettinari, I.; Landa-Faz, A.; González-Orenga, S.; Boscaiu, M.; Soler, S.; Prohens, J.; Vicente, O.; Gramazio, P. Moderate and severe water stress effects on morphological and biochemical traits in a set of pepino (Solanum muricatum) cultivars. Sci. Hortic. 2021, 284, 110143. [Google Scholar] [CrossRef]
  73. Zhang, P.; Bai, J.; Liu, Y.; Meng, Y.; Yang, Z.; Liu, T. Drought resistance of ten ground cover seedling species during roof greening. PLoS ONE 2020, 15, e0220598. [Google Scholar] [CrossRef] [PubMed]
Figure 1. Effects of drought stress on leaf morphological characteristics and membrane system of five C. vietnamensis cultivars after 9 days. (A) Differences in leaf morphological among five C. vietnamensis cultivars after 9 days of drought stress, (B) drought damage index (DI), (C) leaf relative water content (RWC), (D) relative electrical conductivity (REC), (E) malondialdehyde (MDA) content. The data are presented as mean ± standard error, and different lowercase letters indicate significant differences at the 0.05 level. Scale bar: 10 cm.
Agronomy 14 00915 g001
Figure 2. Effects of drought stress on leaf osmotic regulatory-substance content of five C. vietnamensis cultivars after 9 days. (A) Proline (Pro) content, (B) soluble protein (SP) content, (C) soluble sugar (SS) content. The data are presented as mean ± standard error, and different lowercase letters indicate significant differences at the 0.05 level.
Agronomy 14 00915 g002
Figure 3. Effects of drought stress on leaf photosynthetic pigment content of five C. vietnamensis cultivars after 9 days. (A) Chlorophyll A (Chl A) content, (B) chlorophyll B (Chl B) content, (C) total chlorophyll (total Chl) content, (D) carotenoids (Car) content. The data are presented as mean ± standard error, and different lowercase letters indicate significant differences at the 0.05 level.
Agronomy 14 00915 g003
Figure 4. Effects of drought stress on leaf antioxidant enzyme activity and secondary metabolite content of five C. vietnamensis cultivars after 9 days. (A) Superoxide dismutase (SOD) activity, (B) peroxidase (POD) activity, (C) catalase (CAT) activity, (D) tea saponin (TS) content, (E) total polyphenol (Pol) content, (F) total flavonoid (Fla) content. The data are presented as mean ± standard error, and different lowercase letters indicate significant differences at the 0.05 level.
Agronomy 14 00915 g004
Figure 5. Relative expression of key genes for phenylpropane metabolism in the leaves of five C. vietnamensis cultivars after 9 days of drought stress. The data are presented as mean ± standard error, and different lowercase letters indicate significant differences at the 0.05 level.
Agronomy 14 00915 g005
Figure 6. Hierarchical cluster analysis (HCA) of five C. vietnamensis cultivars after 9 days of drought stress. (A) HCA heat map of mild drought stress, (B) HCA heat map of moderate drought stress, (C) HCA heat map of severe drought stress. The 23 drought-resistance indexes were analyzed by HCA using TBtools software, and the drought-resistance indexes in each row of the heat map were normalized. RWC: relative water content; DI: drought damage index; SS: soluble sugar content; SP: soluble protein content; Pro: proline content; REC, relative electrical conductivity; MDA: malondialdehyde content; SOD: superoxide dismutase activity; POD: peroxidase activity. CAT: catalase activity; Pol: total polyphenol content; Fla: total flavanol content; TS: tea saponin content; Chl A: chlorophyll A content; Chl B: chlorophyll B content; Car: carotenoid content; total Chl: total chlorophyll content.
Agronomy 14 00915 g006
Figure 7. Dendrogram of the five C. vietnamensis cultivars based on their F value.
Agronomy 14 00915 g007
Table 1. The contribution ratio and eigenvectors of comprehensive indexes of five C. vietnamensis cultivars under mild, moderate and severe drought stress.
Mild Drought StressModerate Drought StressSevere Drought Stress
Index PC1PC2PC3PC1PC2PC3PC1PC2PC3
Eigenvalues 11.4606.4483.32913.6384.1313.21616.1723.7542.040
Contribution ratio/% 49.82728.03514.47559.29517.96313.98370.31316.3228.868
Cumulative contribution ratio/% 49.82777.86292.33659.29577.25891.24170.31386.63495.503
EigenvectorRWC0.626−0.444−0.6380.709−0.414−0.5310.677−0.662−0.319
DI−0.707−0.4110.008−0.6250.2530.689−0.867−0.2100.228
SS0.952 *0.2150.1390.943 *0.1590.2890.943 *0.085−0.010
SP0.8810.3650.2710.945 *0.1720.2790.977 *0.1200.038
Pro0.561−0.758−0.169−0.032−0.4610.7810.667−0.7270.165
REC−0.740−0.0870.603−0.6090.710−0.325−0.5460.774−0.317
MDA−0.404−0.1410.801−0.2980.908 *−0.282−0.3060.821−0.454
SOD0.974 *0.0770.1710.908 *0.3260.2220.926 *0.359−0.103
POD0.7560.640−0.0210.585−0.395−0.1830.306−0.1580.881
CAT0.8510.0000.4250.8270.1400.5430.8940.0780.039
Pol0.0640.797−0.5990.727−0.573−0.3210.957 *−0.163−0.229
Fla0.791−0.537−0.2210.545−0.3540.7120.948 *−0.0300.054
TS0.332−0.1500.924 *0.2250.8790.2360.2420.7200.650
ChlA−0.2660.953 *0.0820.8670.344−0.3140.8200.5130.190
ChlB−0.3990.8990.1240.918 *0.363−0.1330.952 *0.2360.130
Car−0.1910.958 *−0.0070.8130.009−0.3860.967 *−0.010−0.026
Total Chl−0.2700.914 *0.1610.8410.3260.0020.913 *0.3210.222
Cv4CL10.963 *0.0840.2530.932 *0.3100.0560.926 *0.285−0.231
CvCAD10.972 *0.1150.1450.957 *0.0280.2870.981 *0.1560.057
CvCAD20.3740.643−0.3990.654−0.487−0.3030.850−0.438−0.202
CvPOX10.983 *0.155−0.0220.943 *0.0070.0100.906 *−0.032−0.275
CvPOX20.961 *0.1050.1700.985 *−0.118−0.0930.985 *0.070−0.071
CvPOX30.798−0.0190.0370.8600.299−0.0910.990 *−0.129−0.043
Note: RWC: relative water content; DI: drought damage index; SS: soluble sugar content; SP: soluble protein content; Pro: proline content; REC, relative electrical conductivity; MDA: malondialdehyde content; SOD: superoxide dismutase activity; POD: peroxidase activity; CAT: catalase activity; Pol: total polyphenol content; Fla: total flavonoid content; TS: tea saponin content; Chl A: chlorophyll A content; Chl B: chlorophyll B content; Car: carotenoid content; total Chl: total chlorophyll content. * indicates the absolute value of the eigenvectors that are greater than 0.900 in each PCs.
Table 2. Mean ranking values of five C. vietnamensis cultivars under mild, moderate, and severe drought stress conditions. Values are the mean of at least three independent replicates.
CultivarsX (Yak)Ranking ValueNumerical Rank
X (Ya1)X (Ya2)X (Ya3)F ValueMean F Value
Mild DroughtModerate DroughtSevere DroughtMild DroughtModerate DroughtSevere DroughtMild DroughtModerate DroughtSevere DroughtMild DroughtModerate
Drought
Severe
Drought
Haida 11.001.001.001.001.001.001.000.001.001.000.851.000.951
Haida 40.380.400.390.440.440.480.370.370.260.390.400.400.402
Wanhai 10.000.000.000.000.000.000.081.000.000.010.150.000.055
Wanhai 30.060.030.120.030.110.150.060.790.020.050.160.110.114
Wanhai 40.100.360.320.280.440.260.000.270.100.140.360.290.263
Weights0.540.650.740.300.200.170.160.150.09
Table 3. Principal component comprehensive model under mild, moderate, and severe drought stress.
Stress IntensityPrincipal Component Synthesis Model
Mild droughtF = −0.008V1 − 0.161V2 + 0.189V3 + 0.207V4 − 0.016V5 − 0.077V6 − 0.012V7 + 0.179V8 + 0.195V9 + 0.172V10 + 0.054V11 + 0.043V12 + 0.114V13 + 0.078V14 + 0.054V15 + 0.084V16 + 0.080V17 + 0.185V18 + 0.181V19 + 0.102V20 + 0.173V21 + 0.180V22 + 0.128V23
Moderate droughtF = −0.005V1 + 0.007V2 + 0.187V3 + 0.188V4 − 0.005V5 − 0.011V6 + 0.067V7 + 0.201V8 + 0.010V9 + 0.189V10 − 0.007V11 + 0.089V12 + 0.185V13 + 0.151V14 + 0.177V15 + 0.086V16 + 0.172V17 + 0.187V18 + 0.169V19 − 0.004V20 + 0.139V21 + 0.118V22 + 0.162V23
Severe droughtF = −0.005V1 + 0.007V2 + 0.187V3 + 0.188V4 − 0.005V5 − 0.011V6 + 0.067V7 + 0.201V8 + 0.010V9 + 0.189V10 − 0.007V11 + 0.089V12 + 0.185V13 + 0.151V14 + 0.177V15 + 0.086V16 + 0.172V17 + 0.187V18 + 0.169V19 − 0.004V20 + 0.139V21 + 0.118V22 + 0.162V23
Note: V1: relative water content; V2: relative water content; V3: soluble sugar content; V4: soluble protein content; V5: proline content; V6: relative electrical conductivity; V7: malondialdehyde content; V8: superoxide dismutase activity; V9: peroxidase activity; V10: catalase activity; V11: total polyphenol content; V12: total flavanol content; V13: tea saponin content; V14: chlorophyll A content; V15: chlorophyll B content; V16: carotenoid content; V17: total chlorophyll content; V18: Cv4CL1; V19: CvCAD1; V20: CvCAD2; V21: CvPOX1; V22: CvPOX2; V23: CvPOX3.
Disclaimer/Publisher’s Note: The statements, opinions and data contained in all publications are solely those of the individual author(s) and contributor(s) and not of MDPI and/or the editor(s). MDPI and/or the editor(s) disclaim responsibility for any injury to people or property resulting from any ideas, methods, instructions or products referred to in the content.

