
Transcriptome Analysis and Validation of Anthracnose Resistance Genes in Walnut Varieties
by
 ,
,
Xiuzhen Li
1, 
Yuman Wang
1,
Long Zhao
1,*,
Wenxuan Ding
2,*,
Sudan Chen
1,
Xueqiang Li
1,* and
Peijie Li
1 1
College of Horticulture and Plant Protection, Henan University of Science and Technology, Luoyang 471000, China
2
School of Mathematical Sciences, Luoyang Normal University, Luoyang 471934, China
*
Authors to whom correspondence should be addressed.
Agronomy 2024, 14(5), 911; https://0-doi-org.brum.beds.ac.uk/10.3390/agronomy14050911
Submission received: 30 March 2024
/
Revised: 20 April 2024
/
Accepted: 22 April 2024
/
Published: 26 April 2024
(This article belongs to the Section Crop Breeding and Genetics)
Abstract
:Anthracnose is extremely detrimental to walnut production, because it seriously affects its yield. Therefore, this study aimed to identify anthracnose resistance genes in walnuts, to lay the foundation for cultivating novel anthracnose-resistant walnut varieties. In this study, the fruits of walnut varieties “Qinyou 1” and “Qinyou 2”, exhibiting relatively weak resistance to anthracnose, were used for transcriptome sequencing and identifying differentially expressed genes (DEGs). Thereafter, we used a quantitative real-time polymerase chain reaction to verify the reliability of the transcriptome data using the walnut varieties Qinyou 1, Qinyou 2, Qinyou 3, Liaohe 1, and Diamond 1. We identified 6326 DEGs post-infection in Qinyou 1, of which 3065 were upregulated and 3261 were downregulated. We also found 2055 DEGs (969 upregulated and 1086 downregulated genes) in the two varieties, after 6 days of anthracnose infection. Based on GO and KEGG enrichment analyses of the transcriptome data, we noted that the DEGs were primarily involved in metabolic processes, cell composition, cell structure, catalytic activity, and binding activity. Furthermore, KEGG functional enrichment analysis showed that the amino acid biosynthesis pathway and plant–pathogen interaction may be activated under anthracnose infection. We also noted that the expression levels of anthracnose resistance genes in different walnut varieties were significantly different. Thus, the findings of this study provide important genetic resources and molecular markers for the cultivation of novel anthracnose-resistant walnut varieties.
1. Introduction
Anthracnose is primarily a group of diseases caused by fungal phytopathogens, most of which complete the pathogenic process using a semi-biological nutrition mode. First, conidia germinate on the plant surface to give rise to appressoria, which, in turn, produce penetration pegs that begin the initial infection. Then, the penetration pegs develop into primary hyphae in the plant cells that secrete low-molecular-weight proteins and absorb secondary metabolites as nutrients. Finally, secondary hyphae arise from the primary hyphae and grow rapidly within the plant cells, releasing carbohydrate-active enzymes to decompose and cause necrosis in plant cells [1,2]. Anthracnose occurs easily under warm and humid conditions and is one of the most economically detrimental diseases of fruit crops [3].
The anthracnose blight of walnut, caused by Colletotrichum and Ophiognomonia leptostyla, is characterized by the rapid onset and spread of lesions that result in fruit rot, leaf blight, branch death, and even plant death in severe cases [4,5]. The disease poses a serious threat to walnut production in the primary walnut plantations of Asia, Europe, the United States of America, and South America and is one of the most serious diseases affecting the yield and quality of walnuts in China [6,7]. In this disease, dark-brown round lesions appear on the fruits, with a central depression, a concentric ring, and long streaks of yellow spots being observed, in the case of a leaf infection [8]. To date, the control and management of walnut anthracnose is mainly based on chemical pesticides [9], but this method exhibits a few disadvantages. For example, the use of chemical pesticides may lead to environmental pollution, as these pesticides may remain in the soil and water and harm the ecosystem. Furthermore, the long-term use of pesticides results in the emergence of pesticide-resistant pathogens [10,11]. Therefore, the most fundamental and effective method to manage walnut anthracnose is to explore the mechanism of disease resistance and breed new anthracnose-resistant walnut varieties [12]. In this regard, transcriptome sequencing has been widely used as an effective technology for gene identification in species whose genomes have not yet been sequenced. It has also been used to analyze and functionally annotate differentially expressed genes (DEGs) in plants exposed to various stresses and to then explore stress-resistance mechanisms [13].
According to a study by Fang et al. [2], RNA sequencing (RNA-seq) and label-free quantitative techniques can be used to generate transcriptome and proteome maps of tissues in plants exposed to different lifestyle changes of Colletotrichum gloeosporioides. In the anthracnose-resistant F26 and anthracnose-sensitive F423 fruit bracts, they were determined using scanning electron microscopy. Additionally, 21,798 DEGs and 1929 differentially expressed proteins (DEPs) were identified at five time points in the fruit bracts of F26 and F423 plants. Furthermore, pairwise comparison and network analysis revealed two transcriptional gene network modules and nine hub genes significantly associated with anthracnose resistance, which were related to immune response, plant hormone signal transduction, and secondary metabolites. Similarly, Jurado et al. [14] used RNA-seq to identify DEGs in two near-isogenic lines (A25 and A4804) of species (that varied in the presence of a resistance gene, Co-2), in response to infection by race 38 of C. lindemuthianum. The responses of both lines were analyzed at different time points after inoculation (0, 24, and 48 h), as well as both within and between genotypes. In total, 2850 DEGs were detected, with 2373 DEGs assigned to at least one functional gene ontology (GO) term. The enriched graphene oxide in the resistant genotype was primarily attributed to stimulus–response, hormone signal transduction, cell component tissue, phosphorylation activity, and transcriptional regulation. Comparably, Li et al. [15] conducted RNA-seq analysis on wild type (WT) and Cfmk1 mutant of pear and identified 1886 upregulated and 1554 downregulated genes in the mutant. The DEGs were significantly enriched in cell wall functions and pathogenesis, which was consistent with the defects observed in Cfmk1 mutants, with regard to cell wall integrity and pathogen infection.
In this study, we used anthracnose-infected and healthy fruits to conduct transcriptome sequencing and analyze differential gene expression and changes in related biological processes in walnut fruits exposed to anthracnose infection. Thus, this study aimed to determine the key genes and signaling pathways involved in anthracnose resistance in walnuts and to provide a theoretical basis for breeding novel anthracnose-resistant walnut varieties.
2. Materials and Methods
2.1. Plant Material
Plant samples were collected from the walnut test base at Henan University of Science and Technology (35°06′ N, 112°49′ E), which exhibited a warm continental monsoon climate, an altitude of 180–300 m, and fluvo-aquic soil. The annual average temperature of the site was 14.6 °C, with the annual minimum and maximum temperatures being −5.6 °C and 32.6 °C, respectively; the frost-free period spanned 216 days; the annual average precipitation was 549.5 mm; and the annual sunshine duration was 2496.1 h.
In July 2020, we conducted a sampling of the fruits from walnut varieties “Qinyou 1”, “Qinyou 2”, “Qinyou 3”, “Diamond 1”, and “Liaohe 1”. “Qinyou 1”, “Qinyou 2”, and “Qinyou 3” are exceptional strains that were selected from the seedlings of the walnut variety “8518” in our test base. On the other hand, “Diamond 1” and “Liaohe 1” are seedlings that were purchased from Luoyang Nongfeng agricultural technology Co., Ltd., Luoyang, China. Our observations over the years have shown significant differences in plant and fruit traits among these five strains. The results of indoor anthracnose inoculation tests in the early stage indicate that these five strains have different disease resistance, with disease indices of 8.8% (Qinyou 1), 47.5% (Qinyou 2), 30.6% (Qinyou 3), 15.2% (Diamond 1), and 14.8% (Liaohe 1).
Thirty fruit samples were selected, consisting of six healthy fruits (free from diseases and pests) from five trees, exhibiting similar growth for each variety. Fifteen fruits were inoculated using the following method: On a ultra-clean workbench, the surface of each fruit was wiped with 75% ethanol and rinsed twice with sterile water. Four inoculation points were symmetrically selected on each fruit, with a distance of about 2 cm between the points. At each point, five holes in a plum blossom shape were punched with a needle. A 5 mm diameter mushroom cake (the Anthrax was inoculated onto PDA medium, activated and cultured at 28 °C for 7 days, and the 5 mm diameter mushroom cake was made using a puncher) was placed at each inoculation point. The mycelium side of the mushroom cake was tightly attached to the inoculation point. After inoculation, a small amount of sterile water was sprayed onto the fruit; then, the fruit stem was wrapped with sterile water-moistened, degreased cotton and sealed in a self-sealing bag for moisture retention. The fruits were then placed in a 28 °C constant temperature climate box for cultivation. The other fifteen fruits underwent the same treatment, but were only inoculated with blank culture medium as controls. Five fruits of one variety served as one biological replicate (n = 3). The green skins of diseased fruits were collected before inoculation and on the 3rd, 6th, and 9th days following inoculation. They were then chopped, mixed, and stored in an ultra-low temperature refrigerator at −80 °C for future use.
2.2. Methodology
2.2.1. RNA Extraction and cDNA Synthesis
Total RNA was extracted from the samples using an extraction kit (RNAprep Pure Plant Plus Kit (Polysaccharides and Polyphenolics), TIANGEN BIOTECH (Beijing) Co., Ltd., Beijing, China). After RNA extraction, its integrity was determined using agarose gel electrophoresis (electrophoresis conditions as follows: 1% agarose gel, 0.5× Tris-Borate-EDTA electrophoresis buffer, 120 V, and 15 min). Moreover, the RNA concentration and the ratio of its optical density at 260 nm and 280 nm (OD260/280) were estimated using a NanoDrop spectrophotometer, BEIJING PUXI GENGRAL INSTRUMENT Co., Ltd, Beijing, China. Thereafter, RNA was reverse transcribed into complementary DNA (cDNA) using the Novozan reverse transcription kit (HiScript II 1st Strand cDNA Synthesis Kit (+gDNA wiper, Nanjing Novozan Biotechnology Co., Ltd., Nanjing, China)) and was then amplified through polymerase chain reaction (PCR), with the walnut 18S rRNA gene as the reference [16,17] (see Table 1 and Table 2 for details about the reaction system and conditions). The amplification products were detected using 1% agarose gel electrophoresis and the good-quality cDNA template was diluted 10 times for subsequent experiments.
2.2.2. Library Construction and Sequencing
The mRNA was first enriched with magnetic beads comprising Oligo dT and was then randomly interrupted using the fragmentation buffer. The first cDNA strand was synthesized using random hexamers; then, the second cDNA strand was synthesized by adding buffer, dNTPs, RNase H, and DNA polymerase I. Subsequently, cDNA was purified using AMPure XP beads and end repaired. Thereafter, a polyA tail was added, sequencing joints were connected, and the fragment size was selected using AMPure XP beads. Finally, the cDNA library was obtained using PCR enrichment.
Next, the concentration of the cDNA library (effective concentration of the library > 2 nm) was accurately quantified using quantitative real-time PCR (qRT-PCR), to ensure adequate quality. Following this, different libraries were pooled according to the target data volume and sequenced using the Illumina platform.
2.2.3. Identification and Functional Annotation of DEGs
We compared and analyzed the transcriptome data of healthy and infected Qinyou 1 and 2 fruits, using DESeq2 [18]. For differential expression analysis, a fold change (FC) ≥ 2 and a false discovery rate < 0.01 were used as the screening criteria. The genes that met the screening criteria were considered DEGs. These DEGs then underwent functional annotation and enrichment analysis using the Kyoto Encyclopedia of Genes and Genomes (KEGG) database. The homologous genes of the five differentially expressed genes (DEGs) were retrieved and analyzed using blastn on the NCBI website (https://0-www-ncbi-nlm-nih-gov.brum.beds.ac.uk/) (accessed on 19 April 2024).
2.2.4. qRT-PCR Analysis
18S rRNA was used as an internal reference for qRT-PCR validation and the relative expression of each gene was calculated using the 2−ΔΔCt method. To validate the transcriptome data, five genes from six major pathways were selected, based on KEGG functional analysis, for qRT-PCR. The 18S rRNA primer design was conducted following the method described by Li X. et al. [19]. The other primers for qRT-PCR were designed using the software Primer3 3.0, with the following criteria—Tm: 55–60 °C; GC content: 45–55%; primer length: 18–22 bp; and product length: 150–250 bp. Details of the primers are given in Table 3.
The qRT-PCR reaction system (25 μL) included 2 × SYBR Green PCR mix (12.5 μL), forward primer (1.0 μL), reverse primer (1.0 μL), template DNA (5.0 μL), and double-distilled H2O (5.5 μL). The PCR was set up using the three-step method with the following conditions: hot start at 95 °C for 10 min, followed by denaturation at 95 °C for 15 s, annealing at 60 °C for 15 s, and extension at 72 °C for 30 s, with a total of 39 cycles. Finally, a dissolution curve was used for analysis.
2.3. Data Processing and Statistical Analysis
The data processing was conducted using Microsoft Excel 2016, while IBM SPSS Statistics 21.0 was utilized for principal component analysis and correlation analysis (using the Pearson correlation coefficient method). Graphing of the results was performed using GraphPad Prism 8.3.
3. Results
3.1. Quality Assessment of Transcriptome Data
Table 4 reveals that 56.74 gb of clean bases were obtained after RNA-seq of the nine samples, with each sample comprising 5.81 gb of clean bases. Furthermore, the value of the RNA integrity number (RIN) of the samples ranged from 7 to 10, which indicated that the integrity of the RNA samples was high. Moreover, the 28S/18S ratio was approximately 2, suggesting that the rRNA components of the RNA samples were relatively stable. The OD260/280 of the samples was approximately 2.10, indicating that the RNA samples were of good quality. In addition, the GC content of the samples ranged from 46.29% to 46.92%, with a small deviation; the Q30 values were >92.11%, indicating that the sequencing quality was high.
Principal component analysis (PCA) was performed on the sequenced samples (Figure 1); the two main components, principal component 1 (PC1; 43.9%) and PC2 (16.6%), explained 60.5% of the variation before and after infection. In PC1, the nine samples were divided into three groups, with a clear aggregation relationship between them, indicating the reliability of the replicates.
We also used Pearson’s correlation analysis to determine the relationship between transcript abundance in walnut fruit samples before and after infection (Figure 2). As shown in Figure 2, the samples susceptible to the disease were enriched and clustered into two groups; the first group (Q1) exhibited a high correlation coefficient interval of 0.98–1, while the second group (Q2) exhibited a correlation coefficient interval of 0.94–1, suggesting that the groups included genes with similar expression patterns. The correlation coefficient interval was as high as 0.97–1 for the disease-free samples, which clustered independently. Six susceptible fruit samples clustered together and showed correlation differences with other varieties, indicating good-quality sequencing. These results indicated that the quality and total amount of RNA were adequate and that the sequencing data were highly reliable for use in subsequent experimental analyses.
3.2. Expression and Functional Annotation of DEGs Involved in Anthracnose Resistance
3.2.1. Differential Gene Expression Analysis
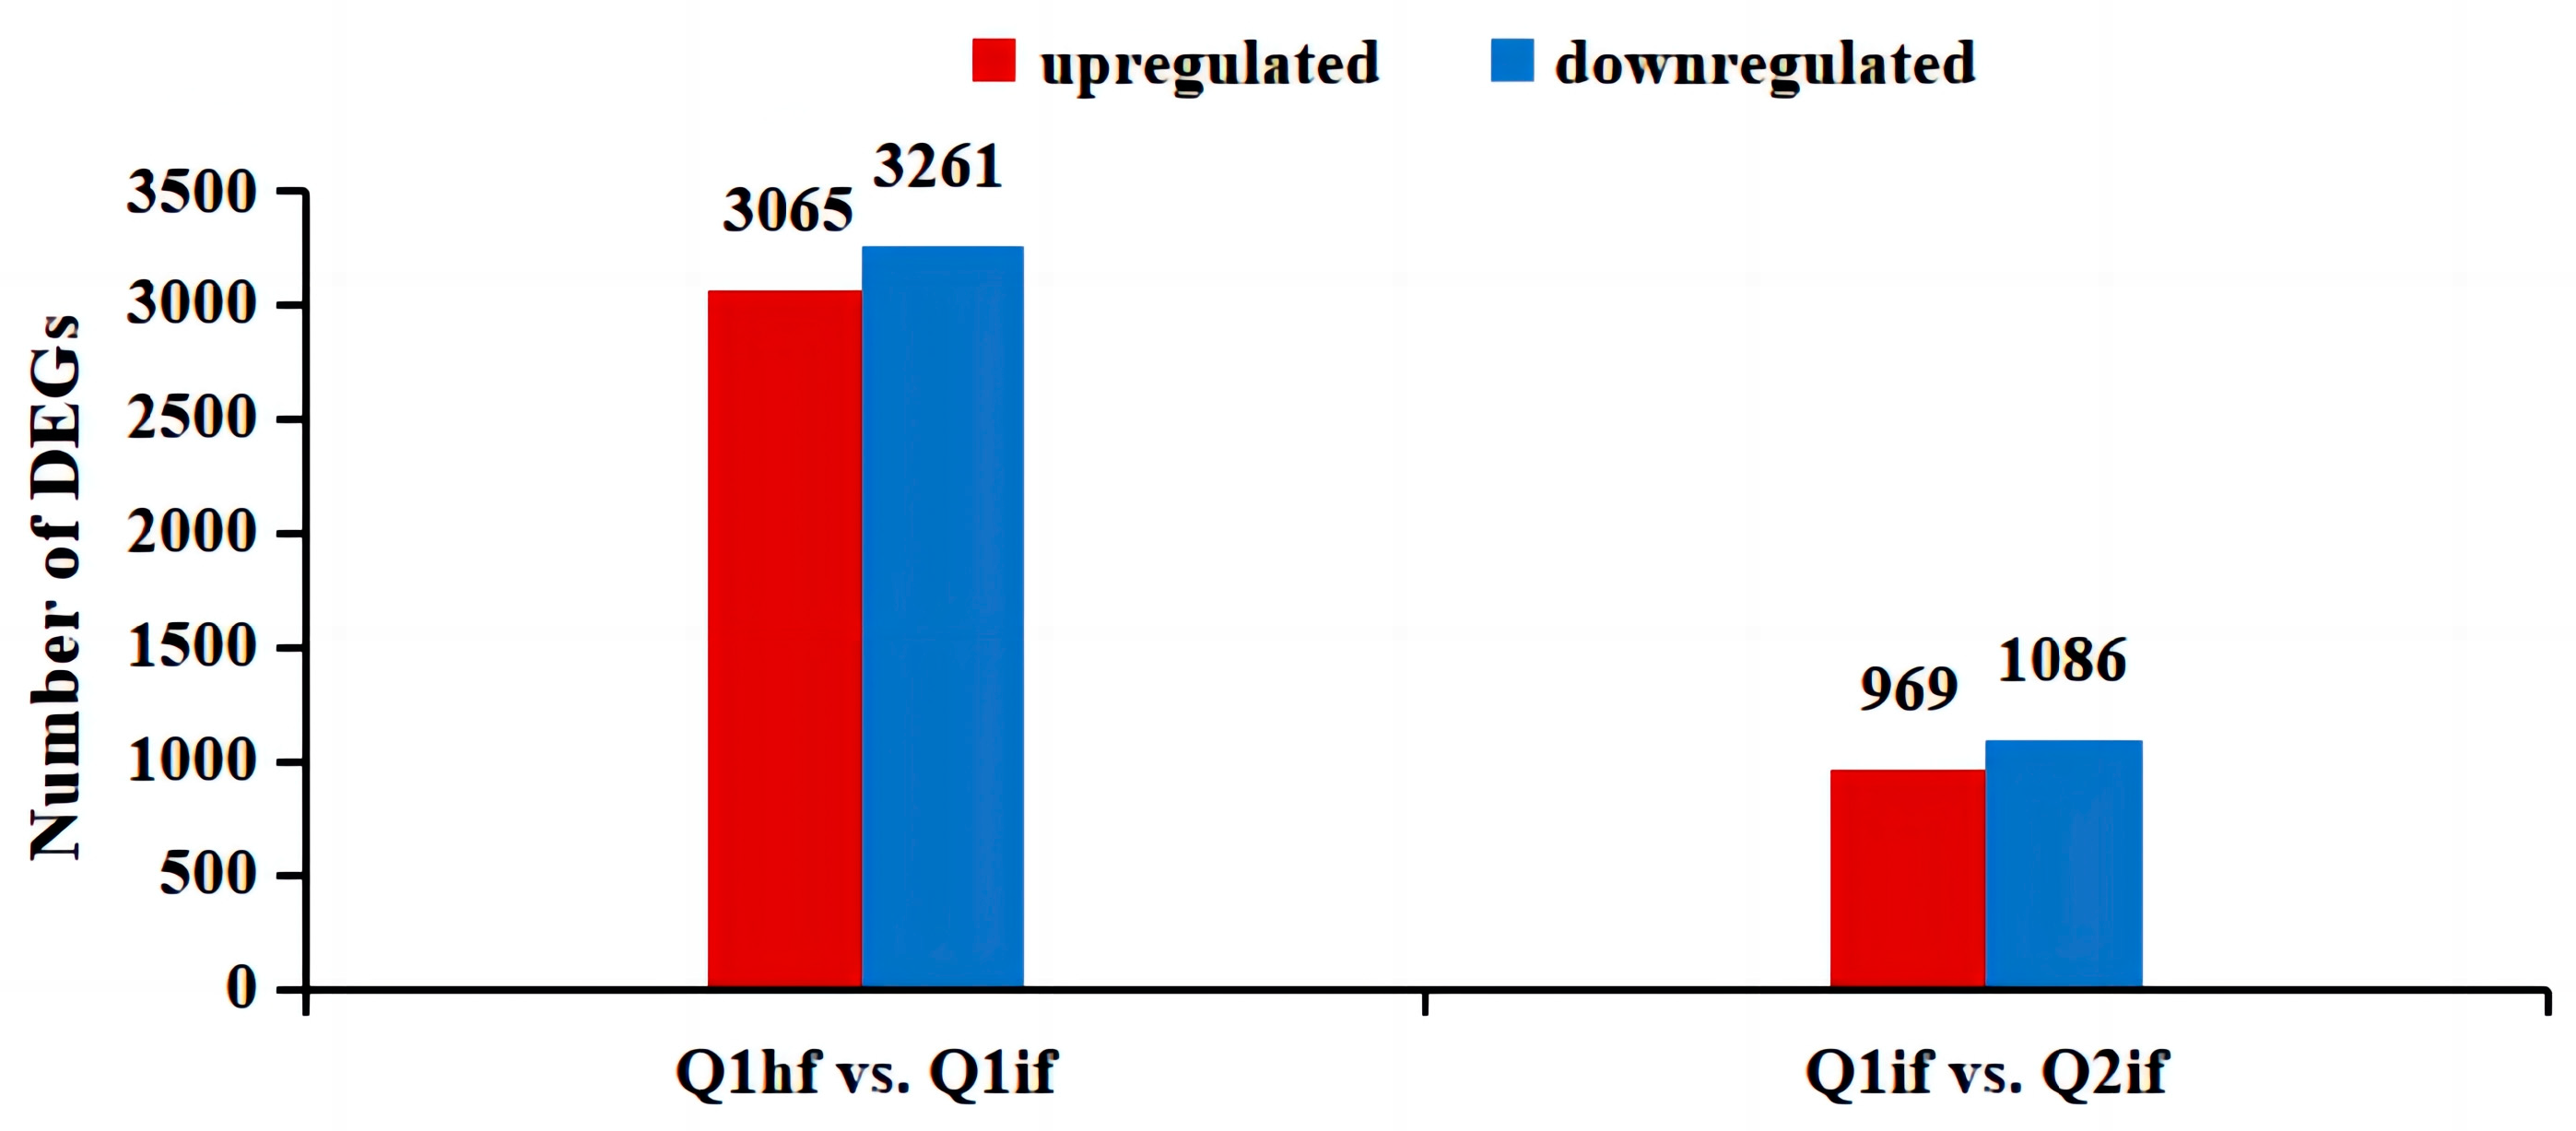
In this study, Q1hf, Q1if, and Q2if were analyzed for differential gene expression, to determine the resistance genes in Qinyou 1. For this purpose, two subgroups—Q1hf and Q1if, as well as Q1if and Q2if—were used and we identified 6326 DEGs (3065 upregulated and 3261 downregulated) between Q1hf and Q1if and 2055 DEGs (969 upregulated and 1086 downregulated) between Q1if and Q2if (Figure 2). These results demonstrated the differences in the expression levels of resistance genes and suggested that these DEGs might be related to anthracnose resistance in Qinyou 1.
3.2.2. Functional Annotations
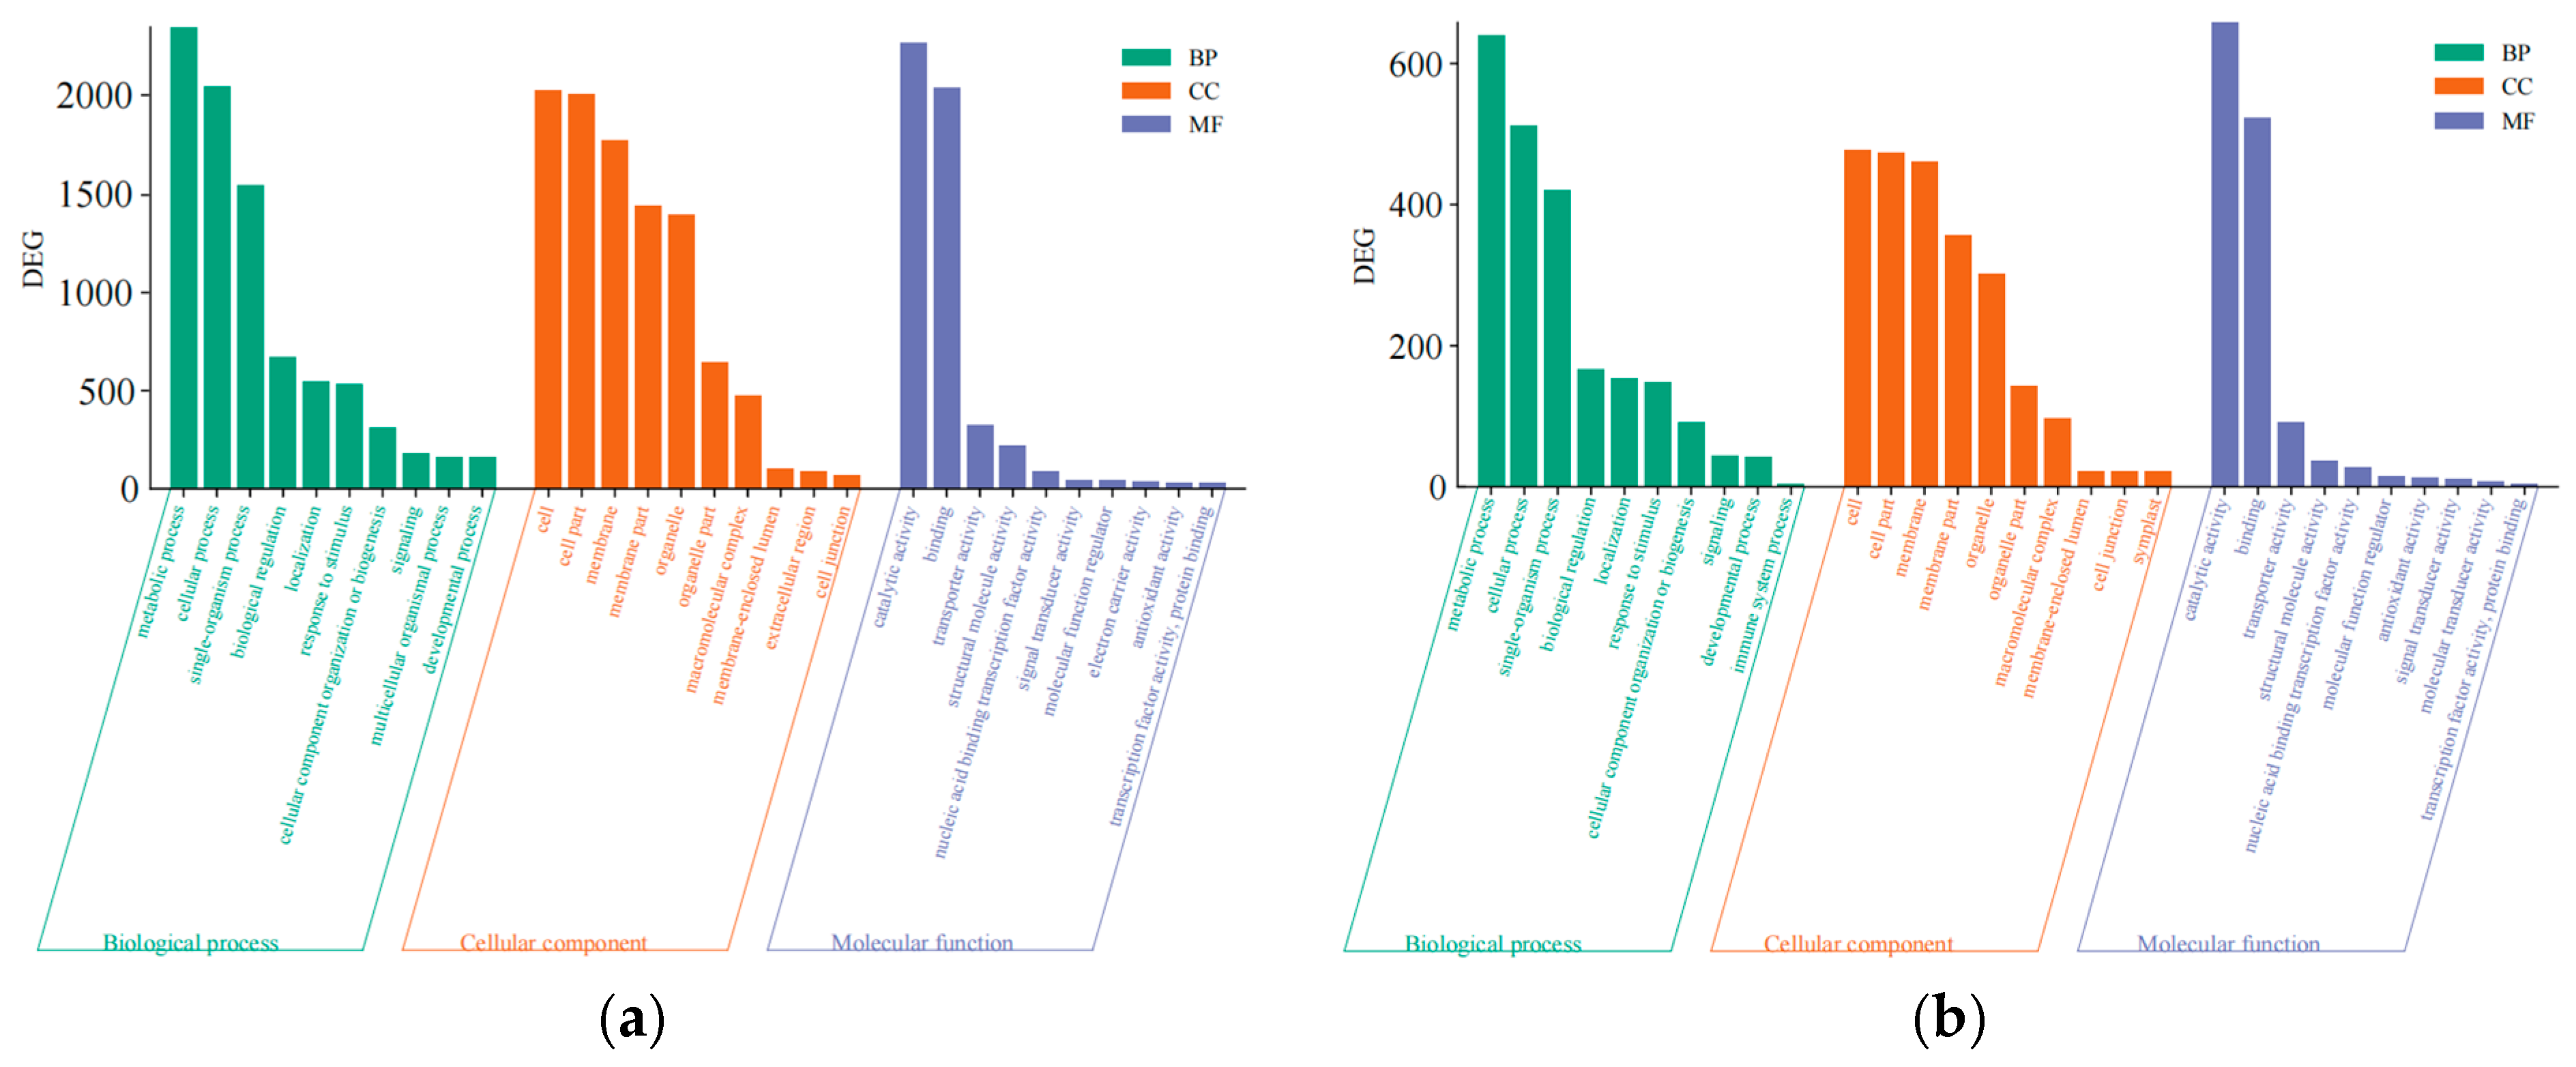
Gene sequences obtained under different treatment conditions were analyzed using the GO and KEGG databases, with GO analysis comprising the categorization of the terms into the following three branches: biological processes, molecular functions, and cellular components. DEGs from the two subgroups of disease-resistant varieties were first annotated using the GO database (Figure 3). The biological processes in which the DEGs were enriched included “metabolic processes” and “cellular processes”; the DEGs were enriched in cellular components such as “cell”, “cellular components”, “cell structure”, and “membrane structure”; and the molecular functions in which the DEGs were enriched included “catalytic activity” and “binding activity.” Preliminary analysis also suggested that the above functions affected the disease outcome, which verified that Qinyou 1 was more resistant to anthracnose than Qinyou 2.
KEGG functional enrichment analysis identified the top 20 most significantly enriched pathways for each group. The amino acid biosynthesis pathway was significantly enriched in the Q1hf–Q1if group, suggesting that the disease may enhance the production of essential amino acids in this variety, contributing to the synthesis of antimicrobial peptides or other secondary metabolites with antifungal properties (Figure 4a). In contrast, plant–pathogen interactions were significantly enriched in the Q1if–Q2if group (Figure 4b), suggesting that fungal attack may enhance metabolic activities in the two varieties and anthracnose incidence may result in a more robust response.
3.3. Screening of DEGs Associated with Anthracnose Resistance
In this study, the plant–pathogen interaction pathway was the focus of further analysis and the following five DEGs, which were simultaneously enriched in the two subgroups, were analyzed: gene13760, gene32437, gene39328, gene40819, and gene8772 (Figure 5).
The absolute value of log2FC of the five DEGs was >1, indicating that their expression levels were significantly different. gene13760 and gene39328 comprised the NB-ARC domain (Pfam) and encoded disease-resistance proteins (Swiss-Prot and NR databases) (Table 5). gene32437 and gene40819 contained the EF-hand domain (Pfam) and encoded calcium-binding proteins (Swiss-Prot and NR databases). gene8772 belonged to the carbohydrate kinase FGGY family (Pfam) and encoded a glycerol kinase (Swiss-Prot and NR databases). These findings suggest that these five DEGs were involved in plant resistance to pathogens, biological processes regulated by calcium ions, and carbohydrate or glycerol metabolism.
Table 6 shows that a batch of nucleotide sequences exhibiting high homology to the five DEGs were retrieved. Nucleotide sequences showing high homology to gene13760 and gene39328 may encode proteins associated with disease resistance, such as the disease-resistance protein RPM1-like (LOC121249925, LOC122305500, LOC121246097, and LOC122300288) and RPP13-like (LOC108995877). Additionally, nucleotide sequences highly similar to gene32437 and gene40819 may encode calcium-binding proteins CML48 (LOC108988263 and LOC122291228) and CML41 (LOC108997497, LOC121247812, and LOC122296804). Furthermore, nucleotide sequences highly homologous to gene8772 may encode glycerol kinases (LOC108980358, LOC121259222, and LOC122284433). It is worth noting that calcium-binding proteins and glycerol kinases are also potentially related to plant disease resistance. Therefore, it can be concluded that the five DEGs are indeed associated with disease resistance and further investigation into their functions is warranted.
3.4. Validation of DEGs Involved in Anthracnose Resistance
3.4.1. Validation of Differential Gene Expression Using Fluorescence Quantitative PCR
With the walnut 18S rRNA gene as the reference, bright and clear cDNA bands were obtained for the walnut samples (Figure 6). Furthermore, sample RNA showed five bands, indicating that the primers were able to successfully amplify the target gene (Figure 7).
As shown in Figure 8, the five DEGs were significantly upregulated in the fruits of Qinyou 1, after 6 days of inoculation. After 6 days of inoculation of Qinyou 1 and Qinyou 2, gene13760, gene32437, and gene39328 were significantly upregulated, whereas gene40819 and gene8772 were significantly downregulated. Although the relative expression levels of the DEGs obtained using qRT-PCR were different from those obtained through transcriptome sequencing, the expression patterns of the DEGs were consistent, indicating that the transcriptome data were reliable.
3.4.2. Analysis of Differential Gene Expression in the Fruits of Five Walnut Varieties
The expression of gene13760 showed a significantly increasing trend from 0 to 6 days after inoculation in the fruits of the five walnut varieties (Figure 9a). Among them, the highest mean relative expression of gene13760 was 9.37, in Qinyou 3 fruits.
The expression of gene32437 increased in Qinyou 1 and Qinyou 2, 0–6 days after inoculation with the pathogen (Figure 9b). In Qinyou 3, the expression of gene32437 significantly increased 3 days after inoculation, with the highest mean relative expression value of 29.14; whereas, the expression of this gene gradually decreased in Diamond 1, with a significant difference in expression level between 0, 6, and 9 days after inoculation. In Liaohe 1, the expression of gene32437 decreased significantly from 0 to 3 days after inoculation and then began to increase significantly thereafter.
The expression of gene39328 increased significantly on the third day after inoculation in Qinyou 1 and Qinyou 3, after which the change was not significant (Figure 9c). In contrast, in Qinyou 2, Diamond 1, and Liaohe 1, the expression of this gene continued to significantly increase from 0 to 6 days after inoculation. The highest mean relative expression value of gene39328 was 35.36. Furthermore, after 6 days of inoculation, the expression of gene39328 in Diamond 1 and Liaohe 1 continued to increase significantly, whereas its expression decreased significantly in Qinyou 2.
Except in Diamond 1, the expression of gene40819 varied significantly after pathogen inoculation in all the walnut varieties (Figure 9d). In Qinyou 1, Qinyou 3, and Liaohe 1, the expression of gene40819 significantly increased after inoculation with the pathogen. Among them, Qinyou 1 and Qinyou 3 exhibited the maximum expression of gene40819 on day 6 after inoculation, which then began to decline significantly. However, gene40819 exhibited the highest expression level in Liaohe 1 on day 3 after inoculation, which then varied irregularly. In contrast, the expression of gene40819 in Qinyou 2 did not change significantly after inoculation with the pathogen and did not start to decline significantly until the 8th day. In addition, the expression of this gene did not change significantly in the fruits of Diamond 1 inoculated with the pathogen and the maximum relative expression value of this gene was 5.63.
The expression of gene8772 increased significantly on day 3 after inoculation of Qinyou 3 and Diamond 1 fruits with the pathogen; then, it continued to decrease (Figure 9e). In contrast, the expression of this gene increased significantly on day 6 after inoculation of Qinyou 1 fruits with the pathogen and then decreased significantly. Similarly, the expression of gene8772 significantly increased on day 6 and decreased thereafter in pathogen-inoculated Liaohe 1 fruits (Figure 9e). Moreover, the expression of this gene in Qinyou 2 fruits showed significant changes and the maximum relative expression value of this gene was 38.59.
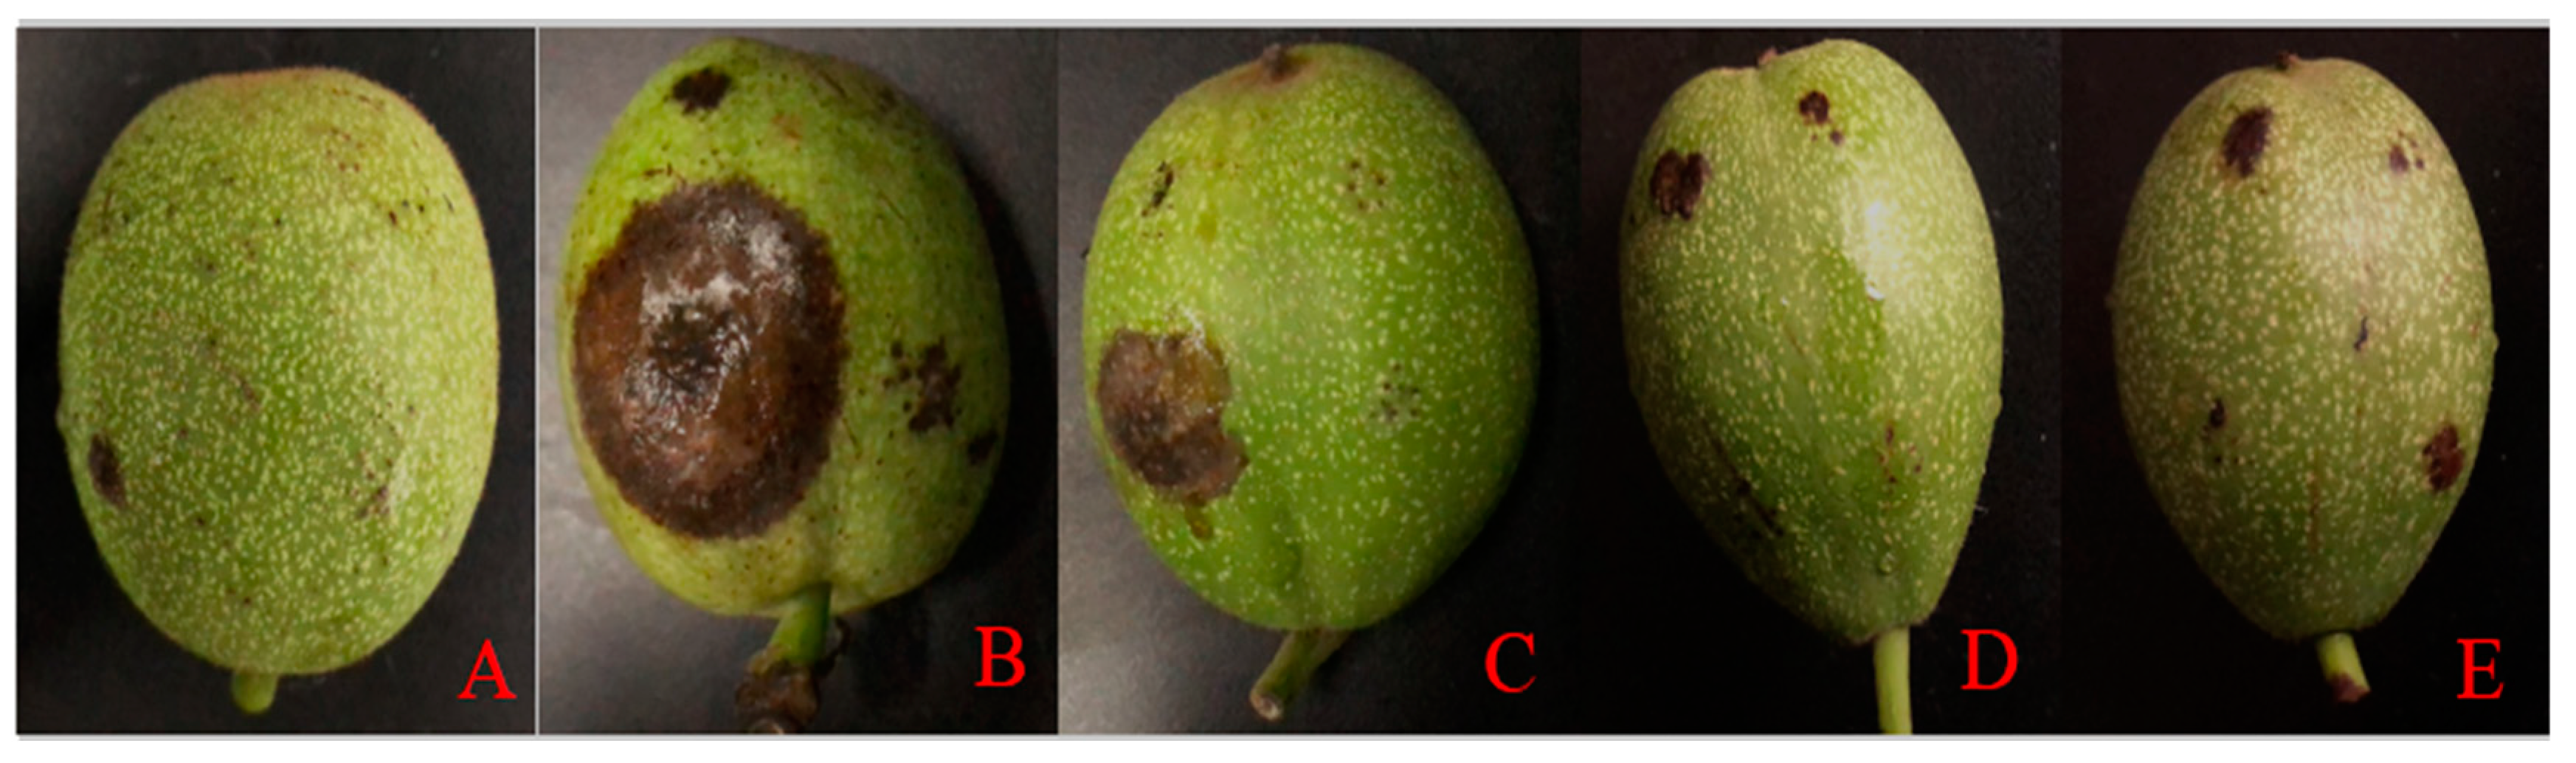
Thus, the findings of this study indicated that these five genes were related to disease resistance, but the expression of gene40819 varied with walnut variety. Disease development in the five varieties after 9 days of inoculation with the pathogen is shown in Figure 10.
4. Discussion
To understand the molecular mechanism underlying anthracnose resistance in Qinyou 1, the transcriptomes of healthy and infected fruits were systematically analyzed using a high-throughput sequencing method, which provided a theoretical basis for breeding anthracnose-resistant walnut varieties. In a previous study on using transcriptome analysis to reveal the role of salicylic acid in anthracnose of tea plants, the plant–pathogen interaction pathway was shown to be an important metabolic pathway [20]. In the present study, the annotation of DEGs using the GO database revealed that “metabolic processes”, “cellular processes”, and “cellular structures” were the most enriched biological processes, while “catalytic activity” and “binding activity” were the most enriched molecular functions. These results suggested that these biological processes and functional pathways may play an important role in the infection dynamics and reproduction of pathogens in plants. Additionally, these results also explained why Qinyou 1 was more resistant to anthracnose than Qinyou 2. Furthermore, several other related biological processes and pathways may also be better regulated and protect Qinyou 1 plants against anthracnose.
KEGG analysis revealed that the DEGs were associated with multiple metabolic pathways, especially those involved in plant–pathogen interactions. Plants exposed to infection show enhanced responses to the pathogen by increasing the production of essential amino acids and regulating plant–pathogen interactions. With this aim, plants have evolved complex signaling and defense pathways in response to pathogen attacks [21]. Pei et al. [22] used RNA-seq to analyze the differences in the resistance response of disease-resistant and -sensitive tomato plants carrying Cf-19 at 0, 7, and 20 days after inoculation. The results revealed that the expression of this gene was associated with the phytopathogen interaction pathway. Similarly, gene13760 and gene39328 have been shown to contain the NB-ARC domain, which is a key component of plant NLR proteins that recognize exogenous pathogen stimuli and transmit downstream signals [23]. gene32437 and gene40819 contained the EF-hand domain, which is a part of calcium-binding proteins that plays an important role in plant signaling [24]. Calcium ions bind to this domain and its structure, which alters the function of the protein. gene8772 belonged to the carbohydrate kinase FGGY family (Pfam) and was a glycerol kinase (Swiss-Prot and NR databases). Glycerol is a metabolic intermediate that is not only involved in various stress responses, but also as a carbon source in pathogenic microorganisms. Hence, it exhibits an enhanced impact on pathogenic microorganisms. Moreover, glycerol kinase is an important rate-limiting enzyme that catalyzes the conversion of glycerol to glycerol-3-phosphate in response to abiotic and biotic stresses and is a key enzyme in glycerol metabolism and is closely related to glycolysis [25,26]. In this study, we used RNA-seq as a tool to measure gene expression [27]. We measured the expression levels of the five identified DEGs in walnut fruits of different varieties inoculated with the pathogen using real-time fluorescence. The results showed that the expression levels of these five DEGs were significantly different before and after infection. However, the expression level of gene40819 was not significantly altered in Diamond 1 fruits after infection, indicating that its expression level was related to the variety.
5. Conclusions
In this study, RNA-seq analysis was used to identify DEGs in different walnut varieties (with varying degrees of anthracnose resistance) before and after anthracnose infection. The results revealed that Qinyou 1 showed stronger disease resistance than Qinyou and, thus, the two varieties were used to determine the key genes and metabolic pathways involved in the disease resistance process.
According to gene annotation analysis, the DEGs in Qinyou 1 and Qinyou 2 were significantly enriched in biological processes, molecular functions, and cell components and were involved in metabolic processes, cellular processes, catalytic activity, and other functions. In KEGG enrichment analysis, we noted several DEGs involved in plant–pathogen interactions and amino acid biosynthesis pathways. Thus, these pathways are associated with anthracnose resistance in walnut and play a vital role in anthracnose resistance responses.
Five anthracnose resistance genes, namely gene13760, gene32437, gene39328, gene40819 and gene8772, were screened through the plant–pathogen interaction pathway and were further subjected to qRT-PCR. We noted that the transcriptomic data were consistent with the qRT-PCR results, which verified the reliability of the transcriptomic data. Then, qRT-PCR was used to verify the relative expression levels of these DEGs in the fruits of five walnut varieties at 0, 3, 6, and 9 days after pathogen inoculation. There were significant differences in the expression levels of the DEGs between different varieties and the expression level of gene8772 varied with walnut varieties. These findings indicated that these genes played an important role in anthracnose resistance in walnut varieties.
Author Contributions
Conceptualization, X.L. (Xiuzhen Li), W.D. and L.Z.; methodology, X.L. (Xiuzhen Li), X.L. (Xueqiang Li) and W.D.; software, Y.W., W.D., S.C. and P.L.; validation, X.L. (Xiuzhen Li), Y.W., X.L. (Xueqiang Li) and L.Z.; formal analysis, X.L. (Xiuzhen Li), S.C. and W.D.; investigation, P.L. and X.L. (Xiuzhen Li); resources, X.L. (Xueqiang Li); data curation, X.L. (Xiuzhen Li), Y.W. and W.D.; writing—original draft preparation, X.L. (Xiuzhen Li), W.D., X.L. (Xueqiang Li), S.C. and Y.W.; writing—review and editing, X.L. (Xiuzhen Li), L.Z., X.L. (Xueqiang Li) and Y.W.; visualization, L.Z.; supervision, L.Z.; project administration, L.Z.; funding acquisition, S.C. and L.Z.; All authors have read and agreed to the published version of the manuscript.
Funding
This work was supported by the National Natural Science Foundation of China (No. 52309050), Henan Science and Technology Research and Development Program Joint Fund (Application Public Relations) (No. 232103810040), Key R&D and Promotion Projects in Henan Province (Science and Technology Development) (No. 232102110264), and Key Scientific Research Projects of Colleges and Universities in Henan Province (No. 24B416001).
Data Availability Statement
Data are contained within the article.
Conflicts of Interest
The authors declare no conflicts of interest.
References
- Rogério, F.; Van Oosterhout, C.; Ciampi-Guillardi, M.; Correr, F.H.; Hosaka, G.K.; Cros-Arteil, S.; Rodrigues Alves Margarido, G.; Massola Júnior, N.S.; Gladieux, P. Means, motive and opportunity for biological invasions: Genetic introgression in a fungal pathogen. Mol. Ecol. 2023, 32, 2428–2442. [Google Scholar] [CrossRef] [PubMed]
- Fang, H.; Liu, X.; Dong, Y.; Feng, S.; Zhou, R.; Wang, C.; Ma, X.; Liu, J.; Yang, K.Q. Transcriptome and proteome analysis of walnut (Juglans regia L.) fruit in response to infection by Colletotrichum gloeosporioides. BMC Plant Biol. 2021, 21, 249. [Google Scholar] [CrossRef]
- Choub, V.; Ajuna, H.B.; Won, S.-J.; Moon, J.-H.; Choi, S.-I.; Maung, C.E.; Kim, C.-W.; Ahn, Y.S. Antifungal Activity of Bacillus velezensis CE 100 against Anthracnose Disease (Colletotrichum gloeosporioides) and Growth Promotion of Walnut (Juglans regia L.) Trees. Int. J. Mol. Sci. 2021, 22, 10438. [Google Scholar] [CrossRef] [PubMed]
- Wang, L.; Zhu, T. Strong Opponent of Walnut Anthracnose–Bacillus velezensis and Its Transcriptome Analysis. Microorganisms 2023, 11, 1885. [Google Scholar] [CrossRef] [PubMed]
- Yang, H.; Cao, G.; Jiang, S.; Han, S.; Yang, C.; Wan, X.; Zhang, F.; Chen, L.; Xiao, J.; Zhu, P.; et al. Identification of the anthracnose fungus of walnut (Juglans spp.) and resistance evaluation through physiological responses of resistant vs. susceptible hosts. Plant Pathol. 2021, 70, 1219–1229. [Google Scholar] [CrossRef]
- Khelghatibana, F.; Javan-Nikkhah, M.; Safaie, N.; Sobhani, A.; Shams, S.; Sari, E. A reference transcriptome for walnut anthracnose pathogen, Ophiognomonia leptostyla, guides the discovery of candidate virulence genes. Fungal Genet. Biol. 2023, 169, 103828. [Google Scholar] [CrossRef] [PubMed]
- Ma, T.; Yang, C.; Cai, F.; Chen, Z. Morpho-cultural, physiological and molecular characterisation of Colletotrichum nymphaeae causing anthracnose disease of walnut in China. Microb. Pathogen. 2022, 166, 105537. [Google Scholar] [CrossRef] [PubMed]
- Zhang, L.; Yin, Y.Q.; Zhao, L.L.; Xie, Y.Q.; Han, J.; Zhang, Y. Two new species of Colletotrichum (Glomerellaceae, Glomerellales) causing walnut anthracnose in Beijing. MycoKeys 2023, 99, 131–152. [Google Scholar] [CrossRef] [PubMed]
- Wang, Q.-H.; Fan, K.; Li, D.-W.; Han, C.-M.; Qu, Y.-Y.; Qi, Y.-K.; Wu, X.-Q. Identification, Virulence and Fungicide Sensitivity of Colletotrichum gloeosporioides s.s. Responsible for Walnut Anthracnose Disease in China. Plant Dis. 2019, 104, 1358–1368. [Google Scholar] [CrossRef]
- Chen, X.; Chen, X.; Tan, Q.; Mo, X.; Liu, J.; Zhou, G. Recent progress on harm, pathogen classification, control and pathogenic molecular mechanism of anthracnose of oil-tea. Front. Microbiol. 2022, 13, 918339. [Google Scholar] [CrossRef]
- Medic, A.; Solar, A.; Hudina, M.; Veberic, R. Phenolic Response to Walnut Anthracnose (Ophiognomonia leptostyla) Infection in Different Parts of Juglans regia Husks, Using HPLC-MS/MS. Agriculture 2021, 11, 659. [Google Scholar] [CrossRef]
- Jeyaraj, A.; Elango, T.; Chen, X.; Zhuang, J.; Wang, Y.; Li, X. Advances in understanding the mechanism of resistance to anthracnose and induced defence response in tea plants. Mol. Plant Pathol. 2023, 24, 1330–1346. [Google Scholar] [CrossRef] [PubMed]
- Zhou, X.; Tan, F.; Zhang, S.; Zhang, T. Combining single-cell RNA sequencing data and transcriptomic data to unravel potential mechanisms and signature genes of the progression of idiopathic pulmonary fibrosis to lung adenocarcinoma and predict therapeutic agents. Funct. Integr. Genom. 2023, 23, 346. [Google Scholar] [CrossRef]
- Jurado, M.; Campa, A.; Ferreira, J.J. Differentially expressed genes against Colletotrichum lindemuthiamum in a bean genotype carrying the Co-2 gene revealed by RNA-sequencing analysis. Front. Plant Sci. 2022, 13, 981517. [Google Scholar] [CrossRef]
- Li, C.; Sun, W.; Cao, S.; Hou, R.; Li, X.; Ming, L.; Kan, J.; Zhao, Y.; Liu, F. The CfMK1 Gene Regulates Reproduction, Appressorium Formation, and Pathogenesis in a Pear Anthracnose-Causing Fungus. J. Fungi 2022, 8, 77. [Google Scholar] [CrossRef] [PubMed]
- Bengtsson-Palme, J.; Hartmann, M.; Eriksson, K.M.; Pal, C.; Thorell, K.; Larsson, D.G.J.; Nilsson, R.H. Metaxa2: Improved identification and taxonomic classification of small and large subunit rRNA in metagenomic data. Mol. Ecol. Resour. 2015, 15, 1403–1414. [Google Scholar] [CrossRef] [PubMed]
- Hadziavdic, K.; Lekang, K.; Lanzen, A.; Jonassen, I.; Thompson, E.M.; Troedsson, C. Characterization of the 18S rRNA Gene for Designing Universal Eukaryote Specific Primers. PLoS ONE 2014, 9, e87624. [Google Scholar] [CrossRef] [PubMed]
- Love, M.I.; Huber, W.; Anders, S. Moderated estimation of fold change and dispersion for RNA-seq data with DESeq2. Genome Biol. 2014, 15, 550. [Google Scholar] [CrossRef] [PubMed]
- Li, X.; Pan, X.-J.; Zhang, W.-E.; Zhang, R.; Chen, J. Stability evaluation of reference genes for quantitative real-time PCR analysis in walnut (Juglans spp.). Plant Physiol. J. 2017, 53, 1795–1802. [Google Scholar]
- Sun, J.; Zhang, J.; Fang, H.; Peng, L.; Wei, S.; Li, C.; Zheng, S.; Lu, J. Comparative transcriptome analysis reveals resistance-related genes and pathways in Musa acuminata banana ‘Guijiao 9’ in response to Fusarium wilt. Plant Physiol. Biochem. 2019, 141, 83–94. [Google Scholar] [CrossRef]
- Shi, Y.; Sheng, Y.; Cai, Z.; Yang, R.; Li, Q.; Li, X.; Li, D.; Guo, X.; Lu, J.; Ye, J.; et al. Involvement of Salicylic Acid in Anthracnose Infection in Tea Plants Revealed by Transcriptome Profiling. Int. J. Mol. Sci. 2019, 20, 2439. [Google Scholar] [CrossRef] [PubMed]
- Pei, T.; Ge, S.; Wang, Z.; Wang, Y.; Liu, C.; Zhang, H.; Xu, X.; Li, D.; Zhao, T. Transcription factor network analysis of the Cf-19-mediated resistance response in tomato infected by Cladosporium fulvum. Sci. Hortic. 2024, 325, 112681. [Google Scholar] [CrossRef]
- Steele, J.F.C.; Hughes, R.K.; Banfield, M.J. Structural and biochemical studies of an NB-ARC domain from a plant NLR immune receptor. PLoS ONE 2019, 14, e0221226. [Google Scholar] [CrossRef] [PubMed]
- Mohanta, T.K.; Yadav, D.; Khan, A.L.; Hashem, A.; Abd_Allah, E.F.; Al-Harrasi, A. Molecular Players of EF-hand Containing Calcium Signaling Event in Plants. Int. J. Mol. Sci. 2019, 20, 1476. [Google Scholar] [CrossRef] [PubMed]
- Xiao, X.; Wang, R.; Khaskhali, S.; Gao, Z.; Guo, W.; Wang, H.; Niu, X.; He, C.; Yu, X.; Chen, Y. A Novel Glycerol Kinase Gene OsNHO1 Regulates Resistance to Bacterial Blight and Blast Diseases in Rice. Front. Plant Sci. 2022, 12, 800625. [Google Scholar] [CrossRef] [PubMed]
- Wang, G.; Wang, M.; Liu, L.; Hui, X.; Wang, B.; Ma, K.; Yang, X. Improvement of the catalytic performance of glycerol kinase from Bacillus subtilis by chromosomal site-directed mutagenesis. Biotechnol. Lett. 2022, 44, 1051–1061. [Google Scholar] [CrossRef]
- Makino, M.; Shimizu, K.; Kadota, K. Enhanced clustering-based differential expression analysis method for RNA-seq data. MethodsX 2024, 12, 102518. [Google Scholar] [CrossRef]
Figure 1.
PCA analysis of expression levels of each sample and correlation analysis of expression matrix. (a) Principal component analysis of the expression levels of genes in each sample; (b) correlation analysis of expression matrices of the samples.
Figure 1.
PCA analysis of expression levels of each sample and correlation analysis of expression matrix. (a) Principal component analysis of the expression levels of genes in each sample; (b) correlation analysis of expression matrices of the samples.

Figure 2.
Histogram indicating the number of differentially expressed genes (DEGs).

Figure 3.
GO enrichment analysis diagram. (a) Histogram showing functional enrichment analysis of the Q1if–Q1hf group; (b) histogram showing functional enrichment analysis of the Q1if–Q2if group.
Figure 3.
GO enrichment analysis diagram. (a) Histogram showing functional enrichment analysis of the Q1if–Q1hf group; (b) histogram showing functional enrichment analysis of the Q1if–Q2if group.

Figure 4.
KEGG enrichment analysis diagram. (a) KEGG pathway enrichment analysis of DEGs in the Q1if–Q1hf group; (b) KEGG pathway enrichment analysis of DEGs in the Q1if–Q2if group.
Figure 4.
KEGG enrichment analysis diagram. (a) KEGG pathway enrichment analysis of DEGs in the Q1if–Q1hf group; (b) KEGG pathway enrichment analysis of DEGs in the Q1if–Q2if group.

Figure 5.
Venn diagram showing the DEGs involved in the plant–pathogen interaction pathway in the two subgroups.
Figure 5.
Venn diagram showing the DEGs involved in the plant–pathogen interaction pathway in the two subgroups.

Figure 6.
Agarose gel showing cDNA bands obtained from the samples of five walnut varieties. 1–4: Qinyou 1 samples after 0, 3, 6, and 9 days of inoculation; 5–8: Qinyou 2 samples after 0, 3, 6, and 9 days of inoculation; 9–12: Qinyou 3 samples after 0, 3, 6, and 9 days of inoculation; 13–16: Diamond 1 samples after 0, 3, 6, and 9 days of inoculation; 17–20: Liaohe 1 samples after 0, 3, 6, and 9 days of inoculation.

Figure 7.
Results of qRT-PCR of the DEGs using different primer pairs. 1: gene13760; 2: gene32437; 3: gene39328; 4: gene40819; 5: gene8772.
Figure 7.
Results of qRT-PCR of the DEGs using different primer pairs. 1: gene13760; 2: gene32437; 3: gene39328; 4: gene40819; 5: gene8772.

Figure 8.
The relative expression of differential genes using real-time fluorescence quantitation and transcriptome sequencing. (a,c) Real-time fluorescence quantitative expression of differential genes; (b,d) transcriptome sequencing expression. Q1T0: Qinyou 1 inoculated with anthrax for 0 d; Q1T6: Qinyou 1 inoculated with anthrax for 6d; Q2T6: Qinyou 2 inoculated with anthrax for 6 d. * and ** denote pairwise differences, * means significant, ** means very significant.


Figure 9.
Expression levels of DEGs in walnut fruits inoculated with the pathogen. (a): DEGs expression levels in Qinyou 1 walnut fruits after pathogen inoculation. (b): DEGs expression levels in Qinyou 2 walnut fruits after pathogen inoculation. (c): DEGs expression levels in Qinyou 3 walnut fruits after pathogen inoculation. (d): DEGs expression levels in Liaohe 1 walnut fruits after pathogen inoculation. (e): DEGs expression levels in Diamond 1 walnut fruits after pathogen inoculation. A: Qinyou 1, B: Qinyou 2, C: Qinyou 3, D: Liaohe 1, E: Diamond 1; a, b, c as a sign of significant differences; 0, 3, 6, 9 indicates the number of days the virus was inoculated.

Figure 10.
Different walnuts were inoculated with anthrax for 9 d. (A): Qinyou 1; (B): Qinyou 2; (C): Qinyou 3; (D): Liaohe 1; (E): Diamond 1.
Figure 10.
Different walnuts were inoculated with anthrax for 9 d. (A): Qinyou 1; (B): Qinyou 2; (C): Qinyou 3; (D): Liaohe 1; (E): Diamond 1.


Table 1.
PCR reaction system.
| Reagents | 25 μL System |
|---|---|
| 2 × Taq MasterMIX (Dye) | 12.5 μL |
| Forward Primer, 10 μM | 1 μL |
| Reverse Primer, 10 μM | 1 μL |
| Template DNA | 1 μL |
| ddH2O | 9.5 μL |
Table 2.
PCR reaction conditions.
| Steps | Temperature (°C) | Time | |
|---|---|---|---|
| Preprocessing | 94 | 2 min | |
| Denature | 94 | 30 s | 35 cycles |
| Anneal | 58 | 30 s | |
| Extend | 72 | 45 s | |
| Eventually, extend | 72 | 5 min | |
Table 3.
Primer information.
| Gene ID | Direction of Primers | Primer Sequences (5′-3′) |
|---|---|---|
| gene13760 | F | TCAAGGGTATTGCGGAAGAC |
| R | CATAGTGCTGCCAGTTTTCG | |
| gene32437 | F | CTGCAAGTTCCTTTTGAGGC |
| R | CGCCATGCTTTTGATCCTTC | |
| gene39328 | F | CTACAAAAGACAAGCGCAGG |
| R | TTGCTCAATACGACAGTGCT | |
| gene40819 | F | AGAGGCTCAGGCGGTAATCG |
| R | AATCATGGCTTCGCACTCATCC | |
| gene8772 | F | GGCGGGGTTTATTTTGTTCC |
| R | CTTCTCCCCAGCATCTTTGT | |
| 18S rRNA | F | GGTCAATCTTCTCGTTCCCTT |
| R | TCGCATTTCGCTACGTTCTT |
F: Forward primer; R: Reverse primer.
Table 4.
Sample inspection quality sheet.
| Samples | RIN | 28S/18S | OD260/280 | Clean Reads | Clean Bases | GC Content (%) | Q30 (%) |
|---|---|---|---|---|---|---|---|
| Q1hf-1 | 7.60 | 1.70 | 2.10 | 20,886,798 | 6,247,138,404 | 46.35 | 92.98 |
| Q1hf-2 | 7.60 | 1.70 | 2.10 | 21,294,448 | 6,375,348,894 | 46.38 | 92.45 |
| Q1hf-3 | 7.80 | 1.80 | 2.20 | 19,402,301 | 5,808,731,446 | 46.29 | 92.11 |
| Q1if-1 | 8.30 | 1.60 | 2.20 | 20,968,560 | 6,279,371,888 | 46.52 | 92.72 |
| Q1if-2 | 8.50 | 1.70 | 2.20 | 21,485,354 | 6,432,094,444 | 46.92 | 92.69 |
| Q1if-3 | 8.70 | 1.80 | 2.10 | 22,697,081 | 6,799,859,402 | 46.31 | 92.81 |
| Q2if-1 | 8.80 | 1.80 | 2.10 | 22,136,593 | 6,623,364,056 | 46.73 | 92.92 |
| Q2if-2 | 8.80 | 2.00 | 2.10 | 20,575,448 | 6,156,640,896 | 46.38 | 92.51 |
| Q2if-3 | 8.40 | 1.70 | 2.10 | 20,114,874 | 6,019,352,870 | 46.29 | 92.94 |
Table 5.
Multiples and annotations of disease-resistant genes.
| Gene ID | Q1hf vs. Q1if DESeq_log2FC | Q1hf vs. Q2hf DESeq_log2FC | Pfam_Annotation | Swiss-Prot_Annotation | NR_Annotation |
|---|---|---|---|---|---|
| gene13760 | 1.48 | 1.58 | NB-ARC domain; Leucine-rich repeat | Disease-resistance protein RPM1 | PREDICTED: disease-resistance protein RPM1-like [Juglans regia] |
| gene32437 | 2.54 | 1.50 | EF-hand; EF-hand domain; EF-hand; EF-hand domain pair | Probable calcium-binding protein CML48 | PREDICTED: probable calcium-binding protein CML48 [Juglans regia] |
| gene39328 | 3.65 | 1.10 | NB-ARC domain | Disease-resistance protein RPM1 | PREDICTED: disease-resistance protein RPP13-like, partial [Juglans regia] |
| gene40819 | 2.90 | −1.46 | EF-hand domain pair; EF-hand domain pair; EF-hand; EF-hand domain; EF-hand | Probable calcium-binding protein CML41 | PREDICTED: probable calcium-binding protein CML41 [Juglans regia] |
| gene8772 | 1.157188 | −5.14712 | FGGY family of carbohydrate kinases; C-terminal domain | Glycerol kinase | PREDICTED: glycerol kinase-like, partial [Juglans regia] |
Table 6.
Analysis results of DEGs BLAST.
| Gene ID | Description | Scientific Name | Max Score | Total Score | Query Cover | E Value | Per. Ident | Acc. Len | Accession |
|---|---|---|---|---|---|---|---|---|---|
| gene13760 | PREDICTED: Juglans microcarpa × Juglans regia disease-resistance protein RPM1-like (LOC121249925), transcript variant X2, mRNA | Juglans microcarpa × Juglans regia | 5282 | 5282 | 99% | 0 | 98.75% | 3032 | XM_041148789.1 |
| PREDICTED: Juglans microcarpa × Juglans regia disease-resistance protein RPM1-like (LOC121249925), transcript variant X1, mRNA | Juglans microcarpa × Juglans regia | 5236 | 5236 | 99% | 0 | 98.42% | 3009 | XM_041148788.1 | |
| PREDICTED: Carya illinoinensis disease-resistance protein RPM1-like (LOC122305500), mRNA | Carya illinoinensis | 4763 | 4890 | 100% | 0 | 96.53% | 3064 | XM_043118075.1 | |
| gene32437 | PREDICTED: Juglans regia probable calcium-binding protein CML48 (LOC108988263), transcript variant X1, mRNA | Juglans regia | 2091 | 2091 | 99% | 0 | 100.00% | 1170 | XM_018961478.2 |
| PREDICTED: Juglans regia probable calcium-binding protein CML48 (LOC108988263), transcript variant X2, misc_RNA | Juglans regia | 1749 | 2015 | 95% | 0 | 99.89% | 1127 | XR_001995647.2 | |
| PREDICTED: Carya illinoinensis probable calcium-binding protein CML48 (LOC122291228), mRNA | Carya illinoinensis | 1661 | 1661 | 97% | 0 | 93.80% | 1165 | XM_043098874.1 | |
| gene39328 | PREDICTED: Juglans regia disease-resistance protein RPP13-like (LOC108995877), partial mRNA | Juglans regia | 3166 | 3166 | 96% | 0 | 99.94% | 1717 | XM_018971520.2 |
| PREDICTED: Juglans microcarpa × Juglans regia disease-resistance protein RPM1-like (LOC121246097), mRNA | Juglans microcarpa × Juglans regia | 2662 | 2662 | 95% | 0 | 94.79% | 3280 | XM_041144096.1 | |
| PREDICTED: Carya illinoinensis disease-resistance protein RPM1-like (LOC122300288), mRNA | Carya illinoinensis | 2303 | 2303 | 95% | 0 | 91.10% | 3472 | XM_043110813.1 | |
| gene40819 | PREDICTED: Juglans regia probable calcium-binding protein CML41 (LOC108997497), mRNA | Juglans regia | 1748 | 1748 | 98% | 0 | 100.00% | 946 | XM_018973814.2 |
| PREDICTED: Juglans microcarpa × Juglans regia probable calcium-binding protein CML41 (LOC121247812), mRNA | Juglans microcarpa × Juglans regia | 1557 | 1557 | 97% | 0 | 96.81% | 947 | XM_041146263.1 | |
| PREDICTED: Carya illinoinensis probable calcium-binding protein CML41 (LOC122296804), mRNA | Carya illinoinensis | 1459 | 1459 | 97% | 0 | 95.08% | 1130 | XM_043106602.1 | |
| gene8772 | PREDICTED: Juglans regia glycerol kinase (LOC108980358), mRNA | Juglans regia | 1411 | 1411 | 99% | 0 | 98.99% | 1939 | XM_018951254.2 |
| PREDICTED: Juglans microcarpa × Juglans regia glycerol kinase (LOC121259222), mRNA | Juglans microcarpa × Juglans regia | 1310 | 1310 | 94% | 0 | 98.39% | 1890 | XM_041160735.1 | |
| PREDICTED: Carya illinoinensis glycerol kinase (LOC122284433), transcript variant X1, mRNA | Carya illinoinensis | 1264 | 1264 | 95% | 0 | 95.65% | 1902 | XM_043095291.1 |
Disclaimer/Publisher’s Note: The statements, opinions and data contained in all publications are solely those of the individual author(s) and contributor(s) and not of MDPI and/or the editor(s). MDPI and/or the editor(s) disclaim responsibility for any injury to people or property resulting from any ideas, methods, instructions or products referred to in the content. |
© 2024 by the authors. Licensee MDPI, Basel, Switzerland. This article is an open access article distributed under the terms and conditions of the Creative Commons Attribution (CC BY) license (https://creativecommons.org/licenses/by/4.0/).
Share and Cite
MDPI and ACS Style
Li, X.; Wang, Y.; Zhao, L.; Ding, W.; Chen, S.; Li, X.; Li, P. Transcriptome Analysis and Validation of Anthracnose Resistance Genes in Walnut Varieties. Agronomy 2024, 14, 911. https://0-doi-org.brum.beds.ac.uk/10.3390/agronomy14050911
AMA Style
Li X, Wang Y, Zhao L, Ding W, Chen S, Li X, Li P. Transcriptome Analysis and Validation of Anthracnose Resistance Genes in Walnut Varieties. Agronomy. 2024; 14(5):911. https://0-doi-org.brum.beds.ac.uk/10.3390/agronomy14050911
Chicago/Turabian StyleLi, Xiuzhen, Yuman Wang, Long Zhao, Wenxuan Ding, Sudan Chen, Xueqiang Li, and Peijie Li. 2024. "Transcriptome Analysis and Validation of Anthracnose Resistance Genes in Walnut Varieties" Agronomy 14, no. 5: 911. https://0-doi-org.brum.beds.ac.uk/10.3390/agronomy14050911
Note that from the first issue of 2016, this journal uses article numbers instead of page numbers. See further details here.