Article

Genome-Wide Identification and Analysis of Plasma Membrane H+-ATPases Associated with Waterlogging in Prunus persica (L.) Batsch

1
Institute of Pomology, Jiangsu Academy of Agricultural Sciences, Jiangsu Key Laboratory of Horticultural Crop Genetic Improvement, Nanjing 210014, China
2
College of Horticulture, Nanjing Agricultural University, Nanjing 210095, China
*
Author to whom correspondence should be addressed.
Submission received: 19 March 2024 / Revised: 10 April 2024 / Accepted: 22 April 2024 / Published: 26 April 2024
(This article belongs to the Special Issue Crop and Vegetable Physiology under Environmental Stresses)

Abstract

:
Plant plasma membrane H+-ATPase is a transport protein that is generally located on the plasma membrane and generates energy by hydrolyzing adenosine triphosphate (ATP) to pump hydrogen ions (H+) in the cytoplasm out of the cell against a concentration gradient. The plasma membrane H+-ATPases in plants are encoded by a multigene family and potentially play a fundamental role in regulating plant responses to various abiotic stresses, thus contributing to plant adaptation under adverse conditions. To understand the characteristics of the plasma membrane H+-ATPase family in peach (Prunus persica), this study analyzed the plasma membrane H+-ATPase family genes in peach. The results showed that there were 27 members of the plasma membrane H+-ATPase family in peach with amino acid sequences ranging from 943 to 1327. Subcellular localization showed that 23 of the 27 members were located on the cell membrane, and the phylogenetic tree analysis indicated that peach plasma membrane H+-ATPase members were divided into five groups. There were four genes with tandem repeat relationships, and six plasma membrane H+-ATPase genes were differentially expressed after 5 days of flooding and under non-flooding conditions based on the RNA-seq and RT-qPCR analyses. This study also investigated the characteristics and possible functions of the plasma membrane H+-ATPase family members in peach. The results provide theoretical support for further studies on their biological functions in peach.

1. Introduction

Water is the primary factor determining the productivity of plant ecosystems, but excessive or insufficient water is detrimental to plant growth. Peach (Prunus persica) is an important fruit tree in the Rosaceae family and is widely grown in China. However, peach trees have poor waterlogging tolerance and production is susceptible to waterlogging damage because they have shallow roots, vigorous respiration rates, and consume large amounts of oxygen [1,2]. Waterlogging of peach trees often occurs in areas with high annual rainfall and groundwater levels, excessive rainfall, or poor drainage. This waterlogging affects fruit yields and quality and can lead to tree death, resulting in serious economic losses [3]. Global climate change, increased precipitation, and frequent flood disasters mean that it is particularly important to find ways of reducing peach waterlogging damage [4]. In addition to cultivation measures, such as drainage and waterlogging reduction, the most fundamental way to reduce waterlogging damage is to adopt various mitigating techniques, such as molecular biology techniques, genetic improvement, and germplasm innovation, to improve peach waterlogging tolerance.
In recent years, significant progress has been made in the study of plant waterlogging tolerance traits and their mechanisms, especially in cereals and the model plant Arabidopsis [5,6,7,8,9], and several genes related to waterlogging tolerance have been isolated and identified [10,11,12,13,14]. This is particularly so for plant ATPase, which plays an important role in waterlogging stress tolerance in cereal crops [5,15,16,17,18,19], vegetable crops [20,21,22], and Arabidopsis [23,24,25,26]. These studies have laid an important foundation for the molecular regulation of plant waterlogging tolerance and provide important references for in-depth research on waterlogging tolerance mechanisms in other crops.
The plasma membrane is a boundary layer for plant cells and a part of the plant cell external defense barrier. When cells encounter adversity, the plasma membrane and the functional proteins on it react first. Plasma membrane H+-ATPase is a functional protein that is widely distributed across the plasma membrane, is present in almost all cells [27], and is the most abundant plasma membrane protein in plants [28,29,30]. A large number of studies have confirmed that plasma membrane H+-ATPase mainly generates energy by hydrolyzing ATP, and this energy is used to promote the transport of H+ across membrane gradients, transport protons out of cells, and create a H+ electrochemical gradient on both sides of the cell membrane. The ion gradient maintains a dynamic equilibrium under the action of plasma membrane H+-ATPase and then participates in the plant response to various stresses, such as salt stress [31,32,33,34,35,36], heavy metal stress [37], low temperatures, oxidation, acid treatment [38,39], and other stresses [40,41].
Given the important role of plasma membrane H+-ATPase in plant growth, genome-wide identification and analyses of plasma membrane H+-ATPase genes were conducted in many plant species. A number of plasma membrane proton pump coding genes were cloned from plants such as Arabidopsis [42], rice [41,43], Medicago species [44], tomato [45], and peach [46]. This study focused on the whole-genome identification and analysis of the peach plasma membrane H+-ATPase family genes and lays the foundation for the functional analysis of H+-ATPase gene responses to flooding and the breeding of peaches that can tolerate waterlogging.

2. Materials and Methods

2.1. Plant Materials and Waterlogging Treatment

The experiment was conducted in 2022 at the National Peach Germplasms Repository, Nanjing, Jiangsu Province, China (118.87° E, 32.03° N), and 1-year-old peach trees were selected as the experimental materials. The peach plants were grown in 3 L plastic pots in a 3:1 mixture of peat (Pindstrup Mosebrug A/S, Pindstrup, Denmark) and vermiculite. The plants were watered with tap water three times a week, fertilized with 1 g/pot N:P:K (25:10:10) (Ultrasol™, Soquimich, Santiago, Chile) every 2 weeks, and maintained in the field under a shading net (Raschel shading net a light transmittance of 50%) during the growing season until needed for the hypoxia experiment. Flooding stress was induced by submerging the pots with excess water to approximately 2 cm above the soil surface. The standard of 2 cm was determined based on our previous evaluation of flooding tolerance. The leaves were sampled at 0 (control) and 5 days after the flooding treatment. Our previous work showed that 5 days is the limit for peach tree flooding. In the first three days of flooding, peach plants all grew well and showed no obvious signs of flooding stress. However, on the fifth day of flooding, red brown patches appeared on the middle leaves of the peach, and the lower leaves showed severe chlorosis. The containers were regularly refilled with tap water to maintain a constant water level. The control plants were watered to maintain a soil water content level of 75–80%. Each time point sample consisted of 9 plants and there were 3 plants in 1 plastic container. After treatment, the plants were carefully dug out and washed with tap water to remove material attached to the roots. Then, the root samples were immediately frozen in liquid nitrogen and stored at –80 °C until needed for RNA extraction.

2.2. Identification of H+-ATP Family Members in the P. persica Genome

A hidden Markov model (HMM) profile of the H+-ATP domain was constructed using 11 Arabidopsis H+-ATP protein sequences and 10 rice H+-ATP protein sequences and was used to query P. persica protein sequences using HMMER 3.0 software. The putative H+-ATP protein sequences were further Blast-searched against all the P. persica protein sequences using the blastp program (version: ncbi-blast-2.10.1+) [47] with an e-value of 1 × 10⁻²⁰ to obtain the candidate H+-ATP sequences. The candidate H+-ATP protein sequences were annotated using the pfamscan software (version v1.6) and Pfam A (version v33.1) databases [48,49] to confirm the target sequences containing the PF00690 and PF00122 domains in H+-ATP-type protein. The theoretical isoelectric points (PIs) and molecular weights were calculated using the ExPASy Bioinformatics Resource Portal (http://web.expasy.org/protparam) (accessed on 10 May 2023) [50]. The P. persica genomic sequences were downloaded from the GDR Phytozome plant genome database (URL: https://www.rosaceae.org/species/prunus_persica/genome_v2.0.a1) (accessed on 6 April 2023), and the H+-ATP family protein sequences for Arabidopsis and rice were sourced from the websites http://www.arabidopsis.org/) (accessed on 13 March 2023) and (http://rice.uga.edu/pub/data/Eukaryotic_Projects/o_sativa/annotation_dbs/pseudomolecules) (accessed on 16 April 2023), respectively.

2.3. Chromosomal Localization and the Ka/Ks Calculation

The H+-ATPase genes were mapped onto the P. persica chromosomes based on the physical positions using TBtools [51]. Ka/Ks represents the ratio between the non-synonymous substitution rate (Ka) and the synonymous substitution rate (Ks) for two sequences of proteins; it can determine whether there is selective pressure on the protein sequences. The KaKs value was calculated using KaKs Calculator (version 2.0)

2.4. Phylogenetic Tree, Gene Structure, and Conserved Motif Analysis

Multiple sequence alignments of the protein sequences for H+-ATPase genes from P. persica, Arabidopsis, and rice were performed using Mafft (version: v7.427). A phylogenetic tree was constructed using Molecular Evolutionary Genetics Analysis software (MEGA10) [52] via the neighbor-joining method with the following parameters: settings were the p-distance for the model, partial deletion of missing data, 50% cutoff, and 1000 bootstrap replicates. Then, iTOL v6 (https://itol.embl.de/) (accessed on 16 April 2023) annotation software was used to create the evolutionary tree. Genes with similar motifs will also have similar functions [53]. Therefore, a conservative motif analysis was performed using MEME software (version: v5.0.5) (http://meme-suite.org/) (accessed on 16 April 2023) [54] to better understand the similarity and diversity of the P. persica H+-ATP family gene motifs. The subcellular localization of the H+-ATPase proteins was predicted using ProtComp Version 9.0 (Softberry, Inc. 116 Radio Circle, Suite 400 Mount Kisco, NY, USA). The signal peptide was predicted with SignaIP (v5.0) (https://services.healthtech.dtu.dk/service.php?SignalP-5.0) (accessed on 16 April 2023).

2.5. Expression Profiles of the Plasma Membrane H+-ATPase Genes in P. persica Using RNA Sequencing

A gene expression analysis was conducted using an RNA-seq dataset (unpublished data) that was obtained from non-flooded and flooded plants. The transcript abundance of each gene was estimated by calculating the RPKM (reads per kilobase of exon per million fragments mapped), and the RPKM data were used to analyze the expression profiles of the H+-ATPase genes under the control and flooding treatments. A hierarchical cluster was generated using Java TreeView 1.0.13 [55].

2.6. Total RNA Isolation and cDNA Synthesis

Total RNA was extracted from root samples taken from the non-flooded (control) and flooded plants using a TRIzol reagent (Invitrogen, Carlsbad, CA, USA), according to the manufacturer’s instructions, and the samples were treated with DNase I (RNase-Free, Applied Biosystems, Waltham, MA, USA). RNA was purified using a RNeasy Plant Mini Kit (Qiagen, Germantown, MD, USA). The integrity of the total RNA was verified using 1% agarose gel. The quantity was measured using NanoDrop ND-1000® (GE Healthcare™, Chicago, IL, USA). The RNA sample was converted into cDNA using the GoScript Reverse Transcription System® (Promega, Madison, WI, USA).

2.7. Quantitative Real-Time PCR (RT-qPCR) Validation

The RT-qPCR reaction solution consisted of 10 μL of SYBR® Premix Ex Taq (2×) (Takara, Tokyo, Japan), 1 μL (10 μM) of each primer (forward and reverse), 1 μL of cDNA, and 7 μL of ddH2O. The reactions were run on a Bio-Rad CFX96 Real Time Thermal system (Hercules, CA, USA) using a two-step RT-qPCR method as follows: initial denaturation at 95 °C for 5 min, 40 cycles of 10 s at 95 °C, and 30 s at 60 °C. This was followed via the use of the dissociation curve analysis program (15 s at 95 °C, 60 s at 60 °C, and 15 s at 95 °C). There were three technical replicates (triplicates) for each biological replicate. The actin gene was used as an internal reference, and this gene was also the most commonly used as internal reference gene for gene expression analysis in peach [56]. The relative expression levels were calculated using the 2−ΔΔCt method [57].

2.8. Statistical Analysis

Statistical significance of differences between treatment and control was calculated with Student’s t-test. Data were normalized to the expression level of the actin gene. The asterisks represents the corresponding genes that are significantly upregulated or downregulated compared to the control group. The error bars represent the standard deviation (SD) of three biological replicates, with significance levels of 0.05 and 0.01, respectively. * and ** represent significant differences at p values of <0.05 and <0.01, respectively. ns = nonsignificant.

3. Results

3.1. Identification and Characteristics of Plasma Membrane H+-ATPase Family Genes in the Peach Genome

A total of 27 ATPase family genes with PF00690 and PF00122 domains were identified in the peach genome (Table S1). The predicted protein lengths of the ATPases ranged from 943 (PPA20) to 1327 (PPA24) amino acids. The calculated molecular weight (MW) of the ATPase genes ranged from 104.12 kDa (Pbr002091) to 146.39 kDa (PPA24), with an average value of 112.03 kDa. The calculated theoretical PIs ranged from 5.23 (PPA22) to 8.36 (PPA2), with an average of 6.42. Only four ATPases (PPA2, PPA3, PPA4, and PPA5) had a PI > 7.0. The results of subcellular localizations showed that three of the 27 identified ATPase genes were located in the endoplasmic reticulum, namely PPA10, PPA21, and PPA22; 1 gene (PPA20) was extracellular; and 23 were located on the plasma membrane. Detailed information about the genes is shown in Table S1.

3.2. Chromosomal Distribution and Gene Duplication of Plasma Membrane H+-ATPase Genes

The 27 ATPase genes were mapped to 7 of the 12 chromosomes in peach (Figure 1). Among the seven chromosomes, chromosome 1 contained nine genes, whereas only one gene (PPA27) was found on chromosome 8. The other five chromosomes contained two to four ATPase genes. Only four peach ATPase family genes had undergone tandem duplication (PPA1, PPA2, PPA3, and PPA4), and these were on chromosome 1 (Table S1). The Ka/Ks values of the duplicated ATPase genes ranged from 0.134 to 0.302, indicating that the selection process of peach ATPase genes eliminates harmful mutations and maintains proteins stability (purifying selection) (Table S2).

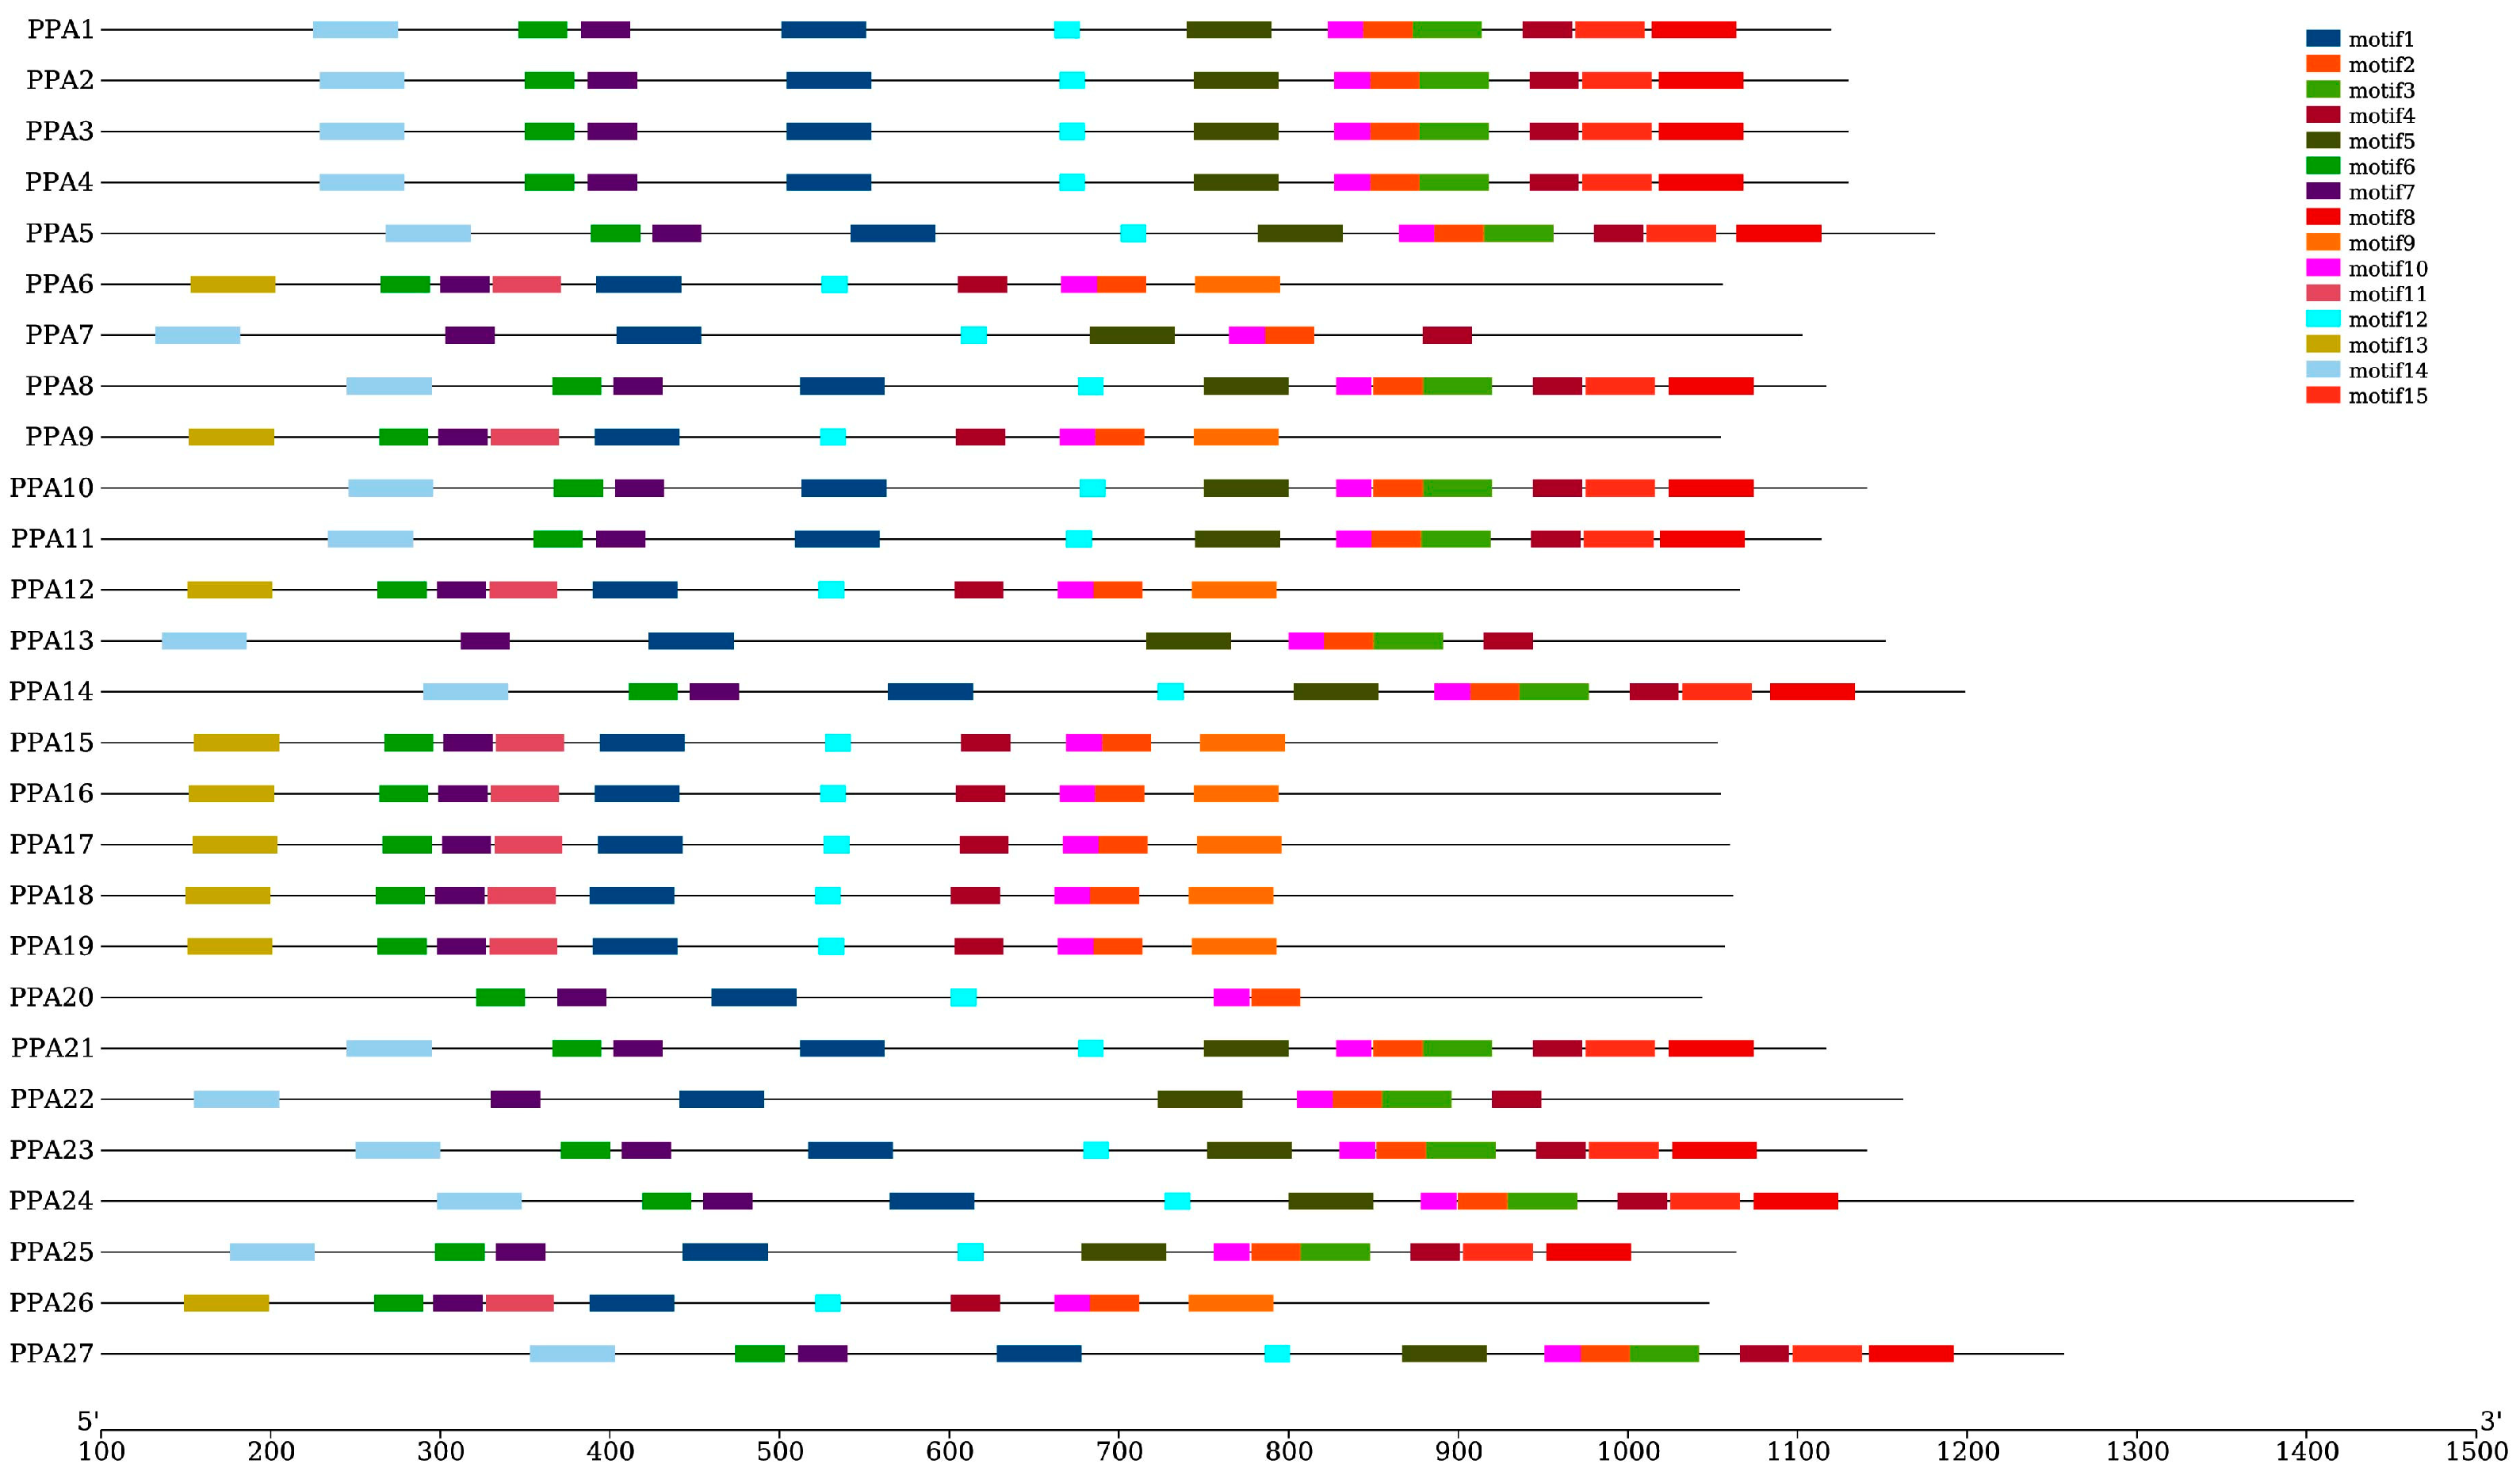
3.3. Phylogenetic Analysis, Gene Structure, and Motif Composition of Plasm Membrane H+-ATPase Genes

A total of 48 ATPase genes (27 peach, 11 Arabidopsis, and 10 rice ATPase genes) were used to construct a phylogenetic tree to better understand the homologous relationship between peach ATPase genes and Arabidopsis and rice ATPases, and their functions were better elucidated. Figure 2 shows that the 48 ATPase genes were divided into 5 groups. Group 1 contained eight members—two from peach, three from Arabidopsis, and three from rice; Group 2 contained two peach, four Arabidopsis, and two rice ATPase genes; Groups 3 and 4 contained seven genes (two peach, two Arabidopsis, and three rice ATPase genes) and four genes (two peaches, one Arabidopsis, and one rice ATPase genes), respectively; and Group 5 contained the largest number of genes and consisted of nineteen peach, one Arabidopsis, and one rice ATPase genes. In Group 5, 20 of the 21 peach ATPase genes had close phylogenetic relationships and the peach ATPase gene PPA15 was close to the Arabidopsis gene AHA10. The rice ATPase gene (OSA9) formed a separate branch (Figure 2).
Introns are unique sequences in eukaryotes that are typically transcribed into precursor mRNA and then cleaved to produce mature mRNA. Different splicing methods can produce different transcripts, which can be translated into different proteins that play an important role in the variable splicing of genes [58]. The gene structure analysis of ATPase showed that 23 of the 27 coding regions in these genes contained at least 1 intron, and 4 genes contained no introns (Figure 3). Among the 22 genes, PPA5 and PPA7 contained the most introns (33); PPA27 contained the least number of introns (1), and 12 genes contained more than 10 introns.
The online MEME motif search identified 15 conserved motifs, which were named motifs 1–15. Figure 4 shows that motifs 1 and 2 are fundamental in the ATPase domain, as all ATPase genes contain these two motifs. The number of ATPase motifs ranges from six to twelve. ATPase members of Groups 1, 2, and 3 contained 10 motifs (motif 1, motif 2, motif 4, motif 6, motif 7, motif 9, motif 10, motif 11, motif 12, and motif 13). Fourteen of the nineteen peach ATPase members in Group 5 contained twelve motifs, while three members contained eight motifs, of which two contained the same motif and the other one contained motif 12 instead of motif 3. PPA15 contained ten motifs, and five of the motifs were the same as those in other genes in this group. However, it also contained three additional motifs (motif 9, motif 11, and motif 13). The gene with the least number of motifs was PPA20. In general, members of the same group have similar exon/intron structures and motifs (Figure 4). No signal peptide was predicted in the present study.

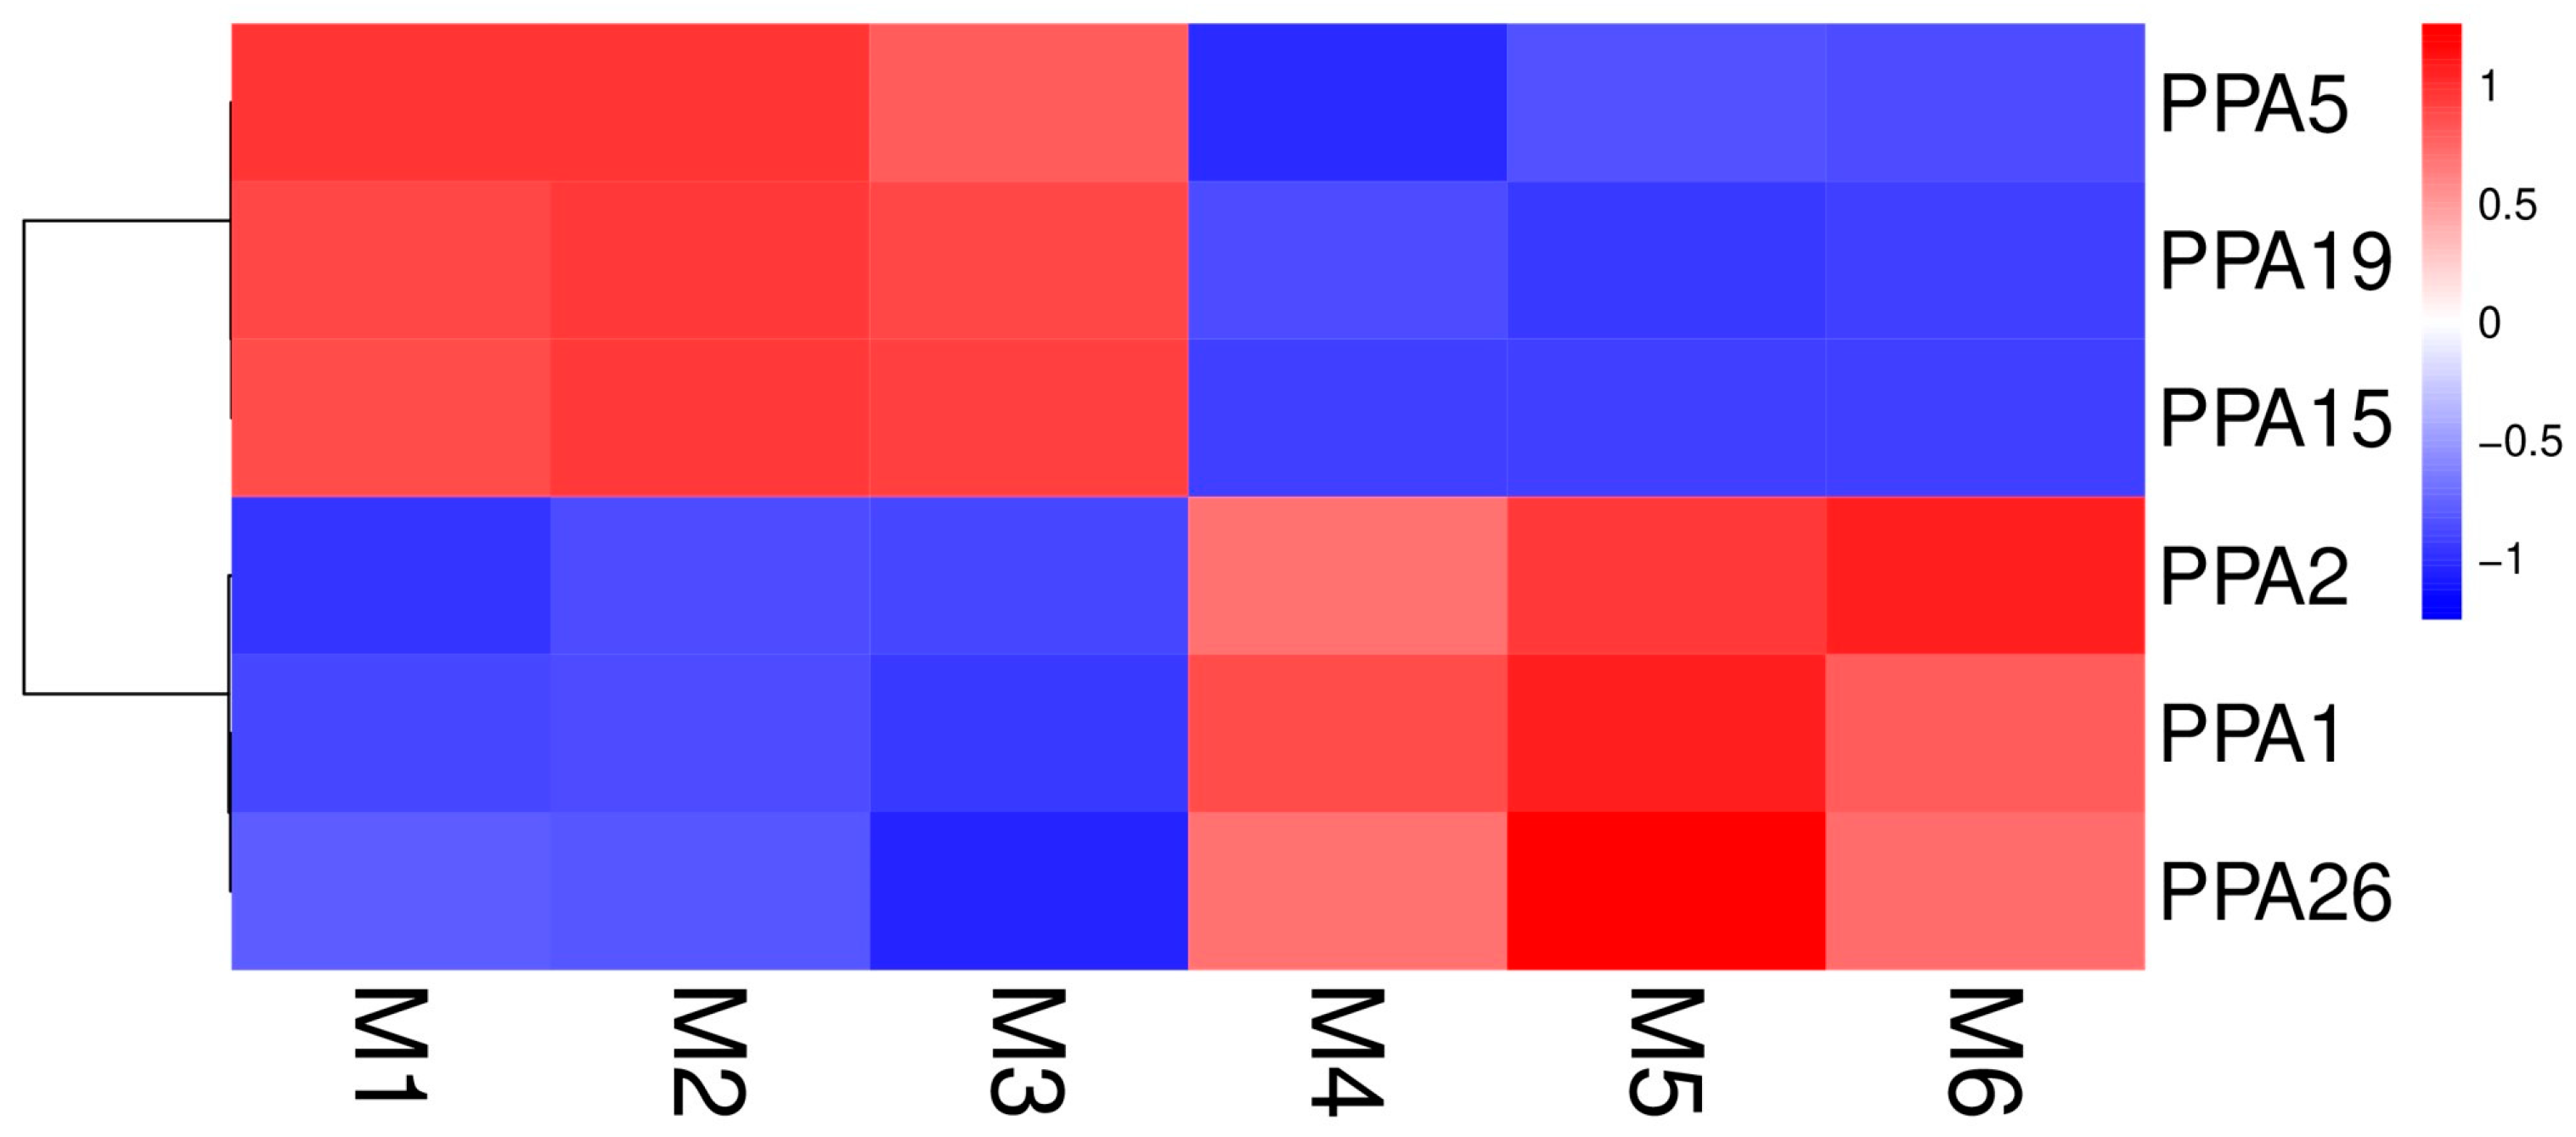
3.4. Expression Analysis of Plasma Membrane H+-ATPase Genes after Flooding Stress

To verify whether the expression of ATPase genes is affected by environmental stress, the genes were analyzed after 5 days of flooding to see whether they were differentially expressed (|log2FoldChange| > 1 and q-value < 0.05). The results showed that 6 genes out of the 27 ATPase genes exhibited differential expression after 5 days of flooding. PPA5, PPA15, and PPA19 were downregulated after 5 days of flooding, while genes PPA1, PPA2, and PPA26 were upregulated (Figure 5, Table S3). The expression profile data of all the ATPase genes and the results of differential gene expression analysis are shown in Table S3.

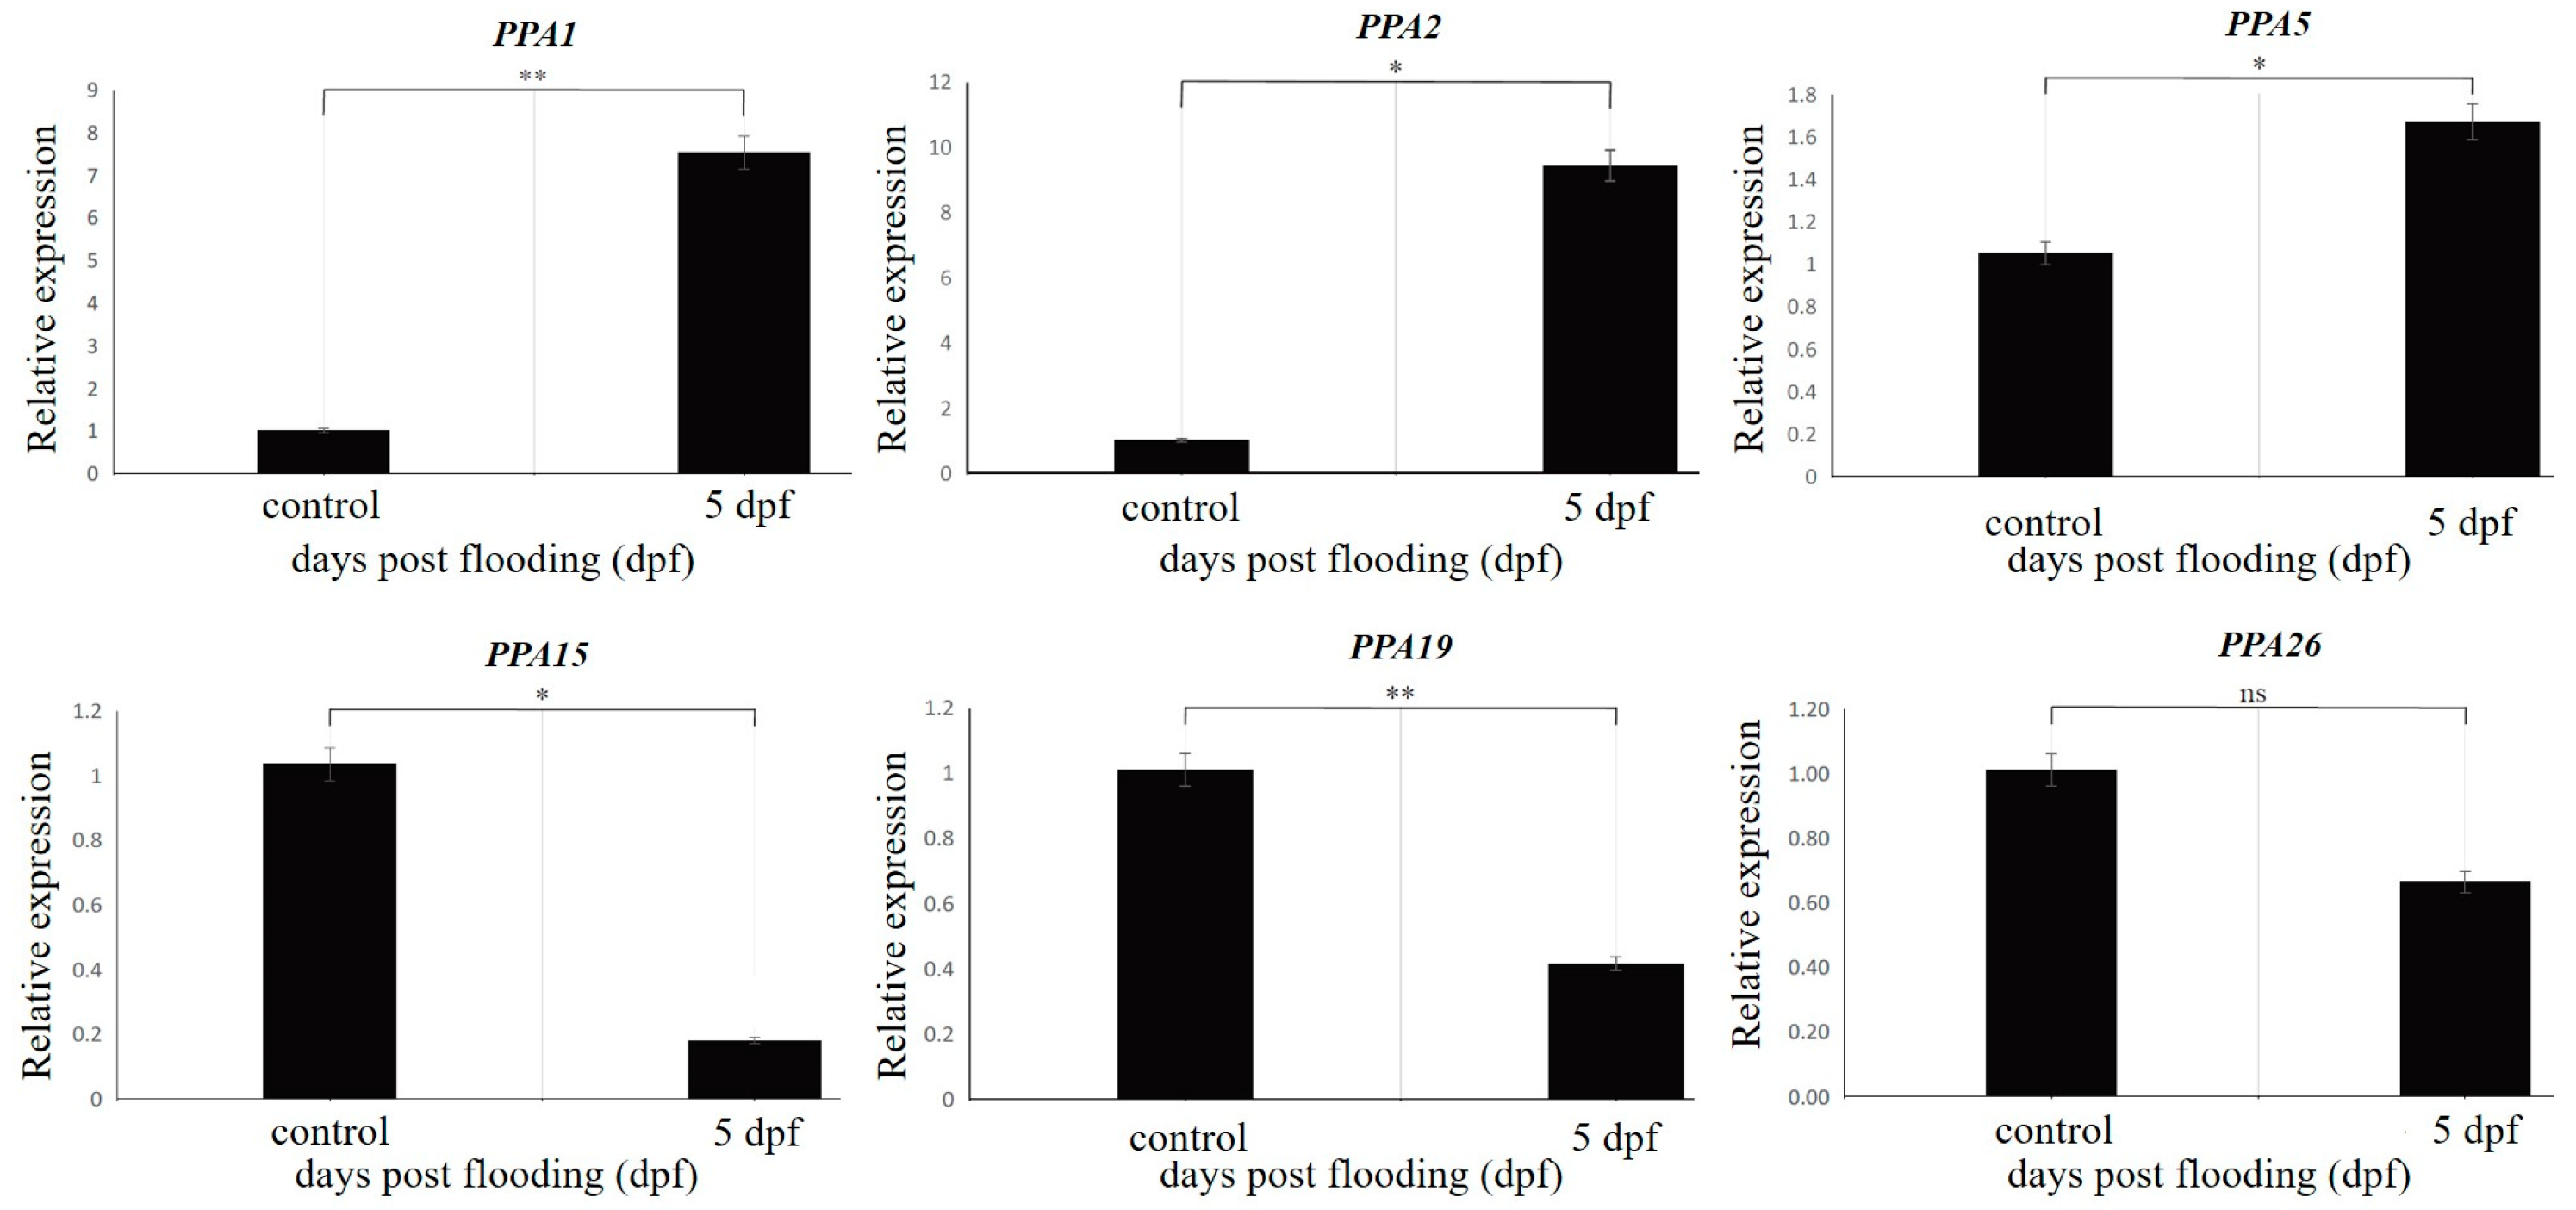
3.5. Real-Time Quantitative PCR (RT-qPCR) Validation

Six genes were selected for validation via RT-qPCR analysis: PPA1 (Prupe.1G023100), PPA2 (Prupe.1G023200), PPA5 (Prupe.1G072600), PPA15 (Prupe.3G029800), PPA19 (Prupe.5G185000), and PPA26 (Prupe.7G258000) (Figure 6). The Quantitative real-time PCR (RT-qPCR) analysis results identified similar trends for up- and downregulated genes, except for gene PPA26, which showed no significant trend (Figure 6). These results confirm the accuracy and reproducibility of the RNA-seq results as indicative of actual transcriptome changes. Table 1 provides the details of the selected genes and the primers.

4. Discussion

Plasma membrane H+-ATPases are very important functional proteins on plant cell membranes and are considered to be the dominant enzymes in plant cell metabolism. Previous studies have shown that the activity of plasma membrane H+-ATPase is closely related to many physiological processes during plant development, such as cell elongation and growth, stomatal opening and closing, intracellular pH regulation, and nutrient absorption [29,30,59]. It also provides proton power for secondary active transport, which is involved in regulating the normal growth of plants and the construction of resistance mechanisms when plants respond to abiotic stresses such as environmental stress. Plasma membrane H+-ATPase enzyme abundance varies depending on plant cell type and tissue. The enzyme is particularly abundant in plant roots, epidermal cells, endoderm, xylem, and phloem. The aim of the present study was to provide a research foundation for improving peach tolerance to waterlogging and other abiotic stresses from the perspective of the ATPase gene through a genome-wide identification and a characteristics’ analysis of ATPase genes in peach. The plant organ most directly affected by waterlogging is the root system [60,61], where it can lead to a reduced main root elongation rate, gradual blackening of the root, and a decrease in the number of root hairs. Flooding causes soil hypoxia, and rhizosphere hypoxia inhibits aerobic respiration by the roots, leading to a lack of energy in the roots, which inhibits water and mineral nutrient adsorption and affects root vitality.
The plasma membrane H+-ATPase in plants is almost entirely encoded by a multigene family, and different members have certain specificities and partial overlaps in expression [43]. For example, 11 homeotic genes (AHA1–11) encoding plasma membrane H+-ATPase were identified in A. thaliana [43]. Among them, AHA1 and AHA2 are expressed in all tissues and organs and their expression patterns tend to be constitutive [62]; AHA3 is mainly expressed in vascular tissue and reproductive organs [63]; AHA6, AHA8, and AHA9 are almost exclusively expressed in floral organs [64]; and AHA10 is mainly expressed on the inner membrane of the developing seed coat [65]. The results suggest that these genes are relatively conserved and/or have specific physiological functions formed by the differentiation of different plasma membrane H+-ATPase genes at different stages of plant development during long-term evolution. The regulation of plant plasma membrane H+-ATPase activity at the gene expression level is also affected by hormones, such as indole-3-acetic acid, and environmental factors, such as salt damage, pathogen infection, and mycorrhizal fungi symbiosis [66]. In this study, there were six peach genes with significantly different expressions under flooded and non-flooded conditions. Among them, PPA5, PPA19, and PPA15 were downregulated under flooded conditions compared to non-flooded conditions, while PPA1, PPA2, and PPA26 were upregulated. These six genes need further analysis and functional verification via gene editing and RNA interference technologies. However, this study provides a good foundation for the further study of peach ATPase genes.
The phylogenetic relationship between Arabidopsis, rice, and peach plasma membrane H+-ATPase genes may provide important insights that could be used to further investigate the functions of the peach plasma membrane H+-ATPase genes. Many genes in rice and Arabidopsis were cloned, and their related functions and molecular mechanisms were illustrated. Therefore, in peach trees, these homologous genes with identified functions are likely to have similar functions. Genetic engineering and transgenic techniques can be used to genetically manipulate these genes and improve peach related traits, such as the differentially expressed genes related to flooding identified in this study. In this study, two peach genes, three Arabidopsis genes, and three rice genes were clustered together in Group 1. However, the relationships between the Arabidopsis and rice ATPase genes and abiotic stress have not been investigated to date. Therefore, there is no available information about the functions of the two peach ATPase genes.
Plasma membrane proton (H+)-ATPases play important roles in plant responses to abiotic stresses. Eleven members of the plasma membrane H+-ATPases have been identified in ArabidopsisAHA1 to AHA11 [67]—of which AHA1 and AHA2 are the most highly expressed isoforms [62,68]. In Group 2, there are two peach genes, four Arabidopsis genes, and two rice genes clustered together, among which Arabidopsis gene AHA1 (AT2G18960) has been reported to be involved in salt tolerance [67,69], stomatal response [70,71], slow wave potential duration, and wound response jasmonate pathway activation [72]. Overexpression of the Arabidopsis gene (AHA3) AT5G57350 can lead to acid tolerance in seedlings [73], and the PM H+-ATPase (AHA5) AT2G24520 is negatively involved in Arabidopsis PAMP (pathogen-associated molecular patterns)-triggered immunity (PTI) against infection by Pseudomonas syringae pvr. tomato (Pto) DC3000, which is particularly virulent [74]. Therefore, it can be inferred that the two peach genes in this group are also likely to be associated with resistance to abiotic stress. AHA2 (AT4G30190) is involved in the low potassium response by forming a proton motive force in roots and by promoting solute uptake [62]. It is also involved in iron uptake [75] and salt stress [76,77]. In Group 3, there were two Arabidopsis genes, two peach genes, and three rice genes, among which that the (AHA4) AT3G47950 responded to drought treatment and could be involved in water use efficiency. AHA2 (AT4G30190) in Group 2 and AHA7 (AT3G60330) in Group 4 have also been reported to play important roles in plant responses to low-phosphorus stress [78,79], oxidative stress [80], and the hydrotropic response [81]. Several studies have reported that AHA1 (AT2G18960), AHA2 (AT4G30190), and AHA7 (AT3G60330) are all expressed in the roots and play major roles in root nutrient uptake, development, and growth [64,68,82]. Several members of the plasma membrane H+-ATPase gene family (AHA1 (AT2G18960), AHA7 (AT3G60330), AHA8 (AT3G42640), AHA4 (AT3G47950), AHA2 (AT4G30190), and AHA3 (AT5G57350)) were involved in the response to oxidative stress by affecting H+ flux and AHA gene expression after RNA-seq and RT-qPCR analysis [80]. Group 5 contained the largest number of genes. There was one Arabidopsis gene, one rice gene, and nineteen peach genes. However, there has been no relevant research on Arabidopsis gene AHA10 (AT2G18960) and rice gene OSA9, which means that they cannot provide any information about the functions of related peach genes.

5. Conclusions

This study characterized the plasma membrane H+-ATPase family genes in peach by undertaking phylogenetic gene structure, conservative motifs, and chromosome location analyses. The waterlogging-responsive H+-ATPase genes were analyzed by examining their transcriptome changes, and six genes were shown to be differentially expressed in response to flooding via the RT-qPCR analysis. These findings provide theoretical support for further studies on the characteristics and functions of plasma membrane H+-ATPase family members in response to flooding in peach, which can lead to the development of waterlogging resilient peaches in the future.

Supplementary Materials

The following supporting information can be downloaded at: https://0-www-mdpi-com.brum.beds.ac.uk/article/10.3390/agronomy14050908/s1, Table S1: Characteristic features of the 27 plasma membrane H+-ATPase genes identified in this study; Table S2: Duplicated plasma membrane H+-ATPase gene pairs in the present study; Table S3: RNA-seq data of differentially expressed plasma membrane H+-ATPase genes between flooding and non-flooding treatment of peach.

Author Contributions

Y.Z. designed this study; Y.Z., Q.M. and X.G. collected data and completed the bioinformatics analyses; Y.Z., J.X. and S.G. performed the experiments; Y.Z., R.M. and M.Y. wrote this manuscript. All authors have read and agreed to the published version of the manuscript.

Funding

This work was supported by the Jiangsu Key Research and Development Program (Modern Agriculture) (BE2022381), the National Natural Science Foundation of China (31901979), and the National Key Research and Development Program subproject of China (2019YFD1000801-02).

Data Availability Statement

The raw RNA-seq dataset were deposited in the NCBI database and are accessible at https://0-www-ncbi-nlm-nih-gov.brum.beds.ac.uk/bioproject/PRJNA1050015/ (submitted on 8 December 2023).

Conflicts of Interest

The authors declare no conflicts of interest.

References

  1. Vartapetian, B.B.; Jackson, M.B. Plant adaptations to anaerobic stress. Ann. Bot. 1997, 79 (Suppl. S1), 3–20. [Google Scholar] [CrossRef]
  2. Jackson, M.; Armstrong, W. Formation of aerenchyma and the processes of plant ventilation in relation to soil flooding and submergence. Plant Biol. 1999, 1, 274–287. [Google Scholar] [CrossRef]
  3. Xiao, Y.; Wu, X.; Sun, M.; Peng, F. Hydrogen sulfide alleviates waterlogging-induced damage in peach seedlings via enhancing antioxidative system and inhibiting ethylene synthesis. Front. Plant Sci. 2020, 11, 696. [Google Scholar] [CrossRef] [PubMed]
  4. Kreuzwieser, J.; Gessler, A. Global climate change and tree nutrition: Influence of water availability. Tree Physiol. 2010, 30, 1221–1234. [Google Scholar] [CrossRef] [PubMed]
  5. Tong, C.; Hill, C.B.; Zhou, G.; Zhang, X.Q.; Jia, Y.; Li, C. Opportunities for improving waterlogging tolerance in cereal crops—Physiological traits and genetic mechanisms. Plants 2021, 10, 1560. [Google Scholar] [CrossRef] [PubMed]
  6. Pan, J.; Sharif, R.; Xu, X.; Chen, X. Mechanisms of waterlogging tolerance in plants: Research progress and prospects. Front. Plant Sci. 2021, 11, 627331. [Google Scholar] [CrossRef]
  7. Lin, C.; Zhu, T.; Ogorek, L.L.P.; Wang, Y.; Sauter, M.; Pedersen, O. The pyramiding of three key root traits aid breeding of flood-tolerant rice. Plants 2022, 11, 2033. [Google Scholar] [CrossRef] [PubMed]
  8. Luan, H.; Li, H.; Li, Y.; Chen, C.; Li, S.; Wang, Y.; Yang, J.; Xu, M.; Shen, H.; Qiao, H. Transcriptome analysis of barley (Hordeum vulgare L.) under waterlogging stress, and overexpression of the HvADH4 gene confers waterlogging tolerance in transgenic Arabidopsis. BMC Plant Biol. 2023, 23, 62. [Google Scholar]
  9. Du, H.; Shen, X.; Huang, Y.; Huang, M.; Zhang, Z. Overexpression of Vitreoscilla hemoglobin increases waterlogging tolerance in Arabidopsis and maize. BMC Plant Biol. 2016, 16, 35. [Google Scholar] [CrossRef] [PubMed]
  10. Kumutha, D.; Sairam, R.K.; Ezhilmathi, K.; Chinnusamy, V.; Meena, R.C. Effect of waterlogging on carbohydrate metabolism in pigeon pea (Cajanus cajan L.): Upregulation of sucrose synthase and alcohol dehydrogenase. Plant Sci. 2008, 175, 706–716. [Google Scholar] [CrossRef]
  11. Pedersen, O.; Malik, A.I.; Colmer, T.D. Submergence tolerance in Hordeum marinum: Dissolved CO2 determines underwater photosynthesis and growth. Funct. Plant Biol. 2010, 37, 524–531. [Google Scholar] [CrossRef]
  12. Xu, K.; Xu, X.; Fukao, T.; Canlas, P.; Maghirang-Rodriguez, R.; Heuer, S.; Ismail, A.M.; Bailey-Serres, J.; Ronald, P.C.; Mackill, D.J. Sub1A is an ethylene-response-factor-like gene that confers submergence tolerance to rice. Nature 2006, 442, 705–708. [Google Scholar] [CrossRef] [PubMed]
  13. Licausi, F.; Van Dongen, J.T.; Giuntoli, B.; Novi, G.; Santaniello, A.; Geigenberger, P.; Perata, P. HRE1 and HRE2, two hypoxia-inducible ethylene response factors, affect anaerobic responses in Arabidopsis thaliana. Plant J. 2010, 62, 302–315. [Google Scholar] [CrossRef]
  14. Lee, K.W.; Chen, P.W.; Lu, C.A.; Chen, S.; Ho, T.H.D.; Yu, S.M. Coordinated responses to oxygen and sugar deficiency allow rice seedlings to tolerate flooding. Sci. Signal. 2009, 2, ra61. [Google Scholar] [CrossRef] [PubMed]
  15. Cai, K.; Gao, H.; Wu, X.; Zhang, S.; Han, Z.; Chen, X.; Zhang, G.; Zeng, F. The ability to regulate transmembrane potassium transport in root is critical for drought tolerance in barley. Int. J. Mol. Sci. 2019, 20, 4111. [Google Scholar] [CrossRef] [PubMed]
  16. Gill, M.B.; Zeng, F.; Shabala, L.; Böhm, J.; Zhang, G.; Zhou, M.; Shabala, S. The ability to regulate voltage-gated K+-permeable channels in the mature root epidermis is essential for waterlogging tolerance in barley. J. Exp. Bot. 2018, 69, 667–680. [Google Scholar] [CrossRef]
  17. Gill, M.B.; Zeng, F.; Shabala, L.; Zhang, G.; Fan, Y.; Shabala, S.; Zhou, M. Cell-based phenotyping reveals QTL for membrane potential maintenance associated with hypoxia and salinity stress tolerance in barley. Front. Plant Sci. 2017, 8, 1941. [Google Scholar] [CrossRef] [PubMed]
  18. Zeng, F.; Konnerup, D.; Shabala, L.; Zhou, M.; Colmer, T.D.; Zhang, G.; Shabala, S. Linking oxygen availability with membrane potential maintenance and K+ retention of barley roots: Implications for waterlogging stress tolerance. Plant Cell Environ. 2014, 37, 2325–2338. [Google Scholar] [CrossRef] [PubMed]
  19. Liu, M.; Sun, J.; Wang, K.; Liu, D.; Li, Z.; Zhang, J. Spermidine enhances waterlogging tolerance via regulation of antioxidant defence, heat shock protein expression and plasma membrane H+-ATPase activity in Zea mays. J. Agron. Crop Sci. 2014, 200, 199–211. [Google Scholar] [CrossRef]
  20. Xu, X.; Liu, M.; Hu, Q.; Yan, W.; Pan, J.; Yan, Y.; Chen, X. A CsEIL3-CsARN6. 1 module promotes waterlogging-triggered adventitious root formation in cucumber by activating the expression of CsPrx5. Plant J. 2023, 114, 824–835. [Google Scholar] [CrossRef] [PubMed]
  21. Siddiqui, M.H.; Khan, M.N.; Mukherjee, S.; Alamri, S.; Basahi, R.A.; Al-Amri, A.A.; Alsubaie, Q.D.; Al-Munqedhi, B.M.; Ali, H.M.; Almohisen, I.A. Hydrogen sulfide (H2S) and potassium (K+) synergistically induce drought stress tolerance through regulation of H+-ATPase activity, sugar metabolism, and antioxidative defense in tomato seedlings. Plant Cell Rep. 2021, 40, 1543–1564. [Google Scholar] [CrossRef] [PubMed]
  22. He, L.; Li, B.; Lu, X.; Yuan, L.; Yang, Y.; Yuan, Y.; Du, J.; Guo, S. The effect of exogenous calcium on mitochondria, respiratory metabolism enzymes and ion transport in cucumber roots under hypoxia. Sci. Rep. 2015, 5, 11391. [Google Scholar] [CrossRef] [PubMed]
  23. Su, N.; Wu, Q.; Chen, J.; Shabala, L.; Mithöfer, A.; Wang, H.; Qu, M.; Yu, M.; Cui, J.; Shabala, S. GABA operates upstream of H+-ATPase and improves salinity tolerance in Arabidopsis by enabling cytosolic K+ retention and Na+ exclusion. J. Exp. Bot. 2019, 70, 6349–6361. [Google Scholar] [CrossRef] [PubMed]
  24. Wang, F.; Chen, Z.H.; Liu, X.; Colmer, T.D.; Shabala, L.; Salih, A.; Zhou, M.; Shabala, S. Revealing the roles of GORK channels and NADPH oxidase in acclimation to hypoxia in Arabidopsis. J. Exp. Bot. 2017, 68, 3191–3204. [Google Scholar] [CrossRef] [PubMed]
  25. Planes, M.D.; Niñoles, R.; Rubio, L.; Bissoli, G.; Bueso, E.; García-Sánchez, M.J.; Alejandro, S.; Gonzalez-Guzmán, M.; Hedrich, R.; Rodriguez, P.L. A mechanism of growth inhibition by abscisic acid in germinating seeds of Arabidopsis thaliana based on inhibition of plasma membrane H+-ATPase and decreased cytosolic pH, K+, and anions. J. Exp. Bot. 2015, 66, 813–825. [Google Scholar] [CrossRef] [PubMed]
  26. Brault, M.; Amiar, Z.; Pennarun, A.M.; Monestiez, M.; Zhang, Z.; Cornel, D.; Dellis, O.; Knight, H.; Bouteau, F.; Rona, J.P. Plasma membrane depolarization induced by abscisic acid in Arabidopsis suspension cells involves reduction of proton pumping in addition to anion channel activation, which are both Ca2+ dependent. Plant Physiol. 2004, 135, 231–243. [Google Scholar] [CrossRef] [PubMed]
  27. Kanczewska, J.; Marco, S.; Vandermeeren, C.; Maudoux, O.; Rigaud, J.-L.; Boutry, M. Activation of the plant plasma membrane H+-ATPase by phosphorylation and binding of 14-3-3 proteins converts a dimer into a hexamer. Proc. Natl. Acad. Sci. USA 2005, 102, 11675–11680. [Google Scholar] [CrossRef] [PubMed]
  28. Palmgren, M.G. Plant plasma membrane H+-ATPases: Powerhouses for nutrient uptake. Annu. Rev. Plant Biol. 2001, 52, 817–845. [Google Scholar] [CrossRef] [PubMed]
  29. Michelet, B.; Boutry, M. The plasma membrane H+-ATPase (A highly regulated enzyme with multiple physiological functions). Plant Physiol. 1995, 108, 1. [Google Scholar] [CrossRef] [PubMed]
  30. Sondergaard, T.E.; Schulz, A.; Palmgren, M.G. Energization of transport processes in plants. Roles of the plasma membrane H+-ATPase. Plant Physiol. 2004, 136, 2475–2482. [Google Scholar] [CrossRef] [PubMed]
  31. Serrano, R. Salt tolerance in plants and microorganisms: Toxicity targets and defense responses. Int. Rev. Cytol. 1996, 165, 1–52. [Google Scholar] [PubMed]
  32. Reuveni, M.; Bressan, R.A.; Hasegawa, P.M. Modification of proton transport kinetics of the plasma membrane H+-ATPase after adaptation of tobacco cells to NaCI. J. Plant Physiol. 1993, 142, 312–318. [Google Scholar] [CrossRef]
  33. Niu, X.; Damsz, B.; Kononowicz, A.K.; Bressan, R.A.; Hasegawa, P.M. NaCl-induced alterations in both cell structure and tissue-specific plasma membrane H+-ATPase gene expression. Plant Physiol. 1996, 111, 679–686. [Google Scholar] [CrossRef] [PubMed]
  34. Wu, J.; Seliskar, D.M. Salinity adaptation of plasma membrane H+-ATPase in the salt marsh plant Spartina patens: ATP hydrolysis and enzyme kinetics. J. Exp. Bot. 1998, 49, 1005–1013. [Google Scholar] [CrossRef]
  35. Yu, Y.; Wang, A.; Li, X.; Kou, M.; Wang, W.; Chen, X.; Xu, T.; Zhu, M.; Ma, D.; Li, Z. Melatonin-stimulated triacylglycerol breakdown and energy turnover under salinity stress contributes to the maintenance of plasma membrane H+–ATPase activity and K+/Na+ homeostasis in sweet potato. Front. Plant Sci. 2018, 9, 256. [Google Scholar] [CrossRef] [PubMed]
  36. Yang, Y.; Guo, J.; Zhang, F.; Zhao, L.; Zhang, L. NaCl induced changes of the H+-ATPase in root plasma membrane of two wheat cultivars. Plant Sci. 2004, 166, 913–918. [Google Scholar] [CrossRef]
  37. Jakubowska, D.; Janicka, M. The role of brassinosteroids in the regulation of the plasma membrane H+-ATPase and NADPH oxidase under cadmium stress. Plant Sci. 2017, 264, 37–47. [Google Scholar] [CrossRef] [PubMed]
  38. Bobik, K.; Boutry, M.; Duby, G. Activation of the plasma membrane H+-ATPase by acid stress: Antibodies as a tool to follow the phosphorylation status of the penultimate activating Thr. Plant Signal. Behav. 2010, 5, 681–683. [Google Scholar] [CrossRef] [PubMed]
  39. Haruta, M.; Gray, W.M.; Sussman, M.R. Regulation of the plasma membrane proton pump (H+-ATPase) by phosphorylation. Curr. Opin. Plant Biol. 2015, 28, 68–75. [Google Scholar] [CrossRef] [PubMed]
  40. Ballesteros, E.; Kerkeb, B.; Donaire, J.P.; Belver, A. Effects of salt stress on H+-ATPase activity of plasma membrane-enriched vesicles isolated from sunflower roots. Plant Sci. 1998, 134, 181–190. [Google Scholar] [CrossRef]
  41. Arango, M.; Gévaudant, F.; Oufattole, M.; Boutry, M. The plasma membrane proton pump ATPase: The significance of gene subfamilies. Planta 2003, 216, 355–365. [Google Scholar] [CrossRef] [PubMed]
  42. Falhof, J.; Pedersen, J.T.; Fuglsang, A.T.; Palmgren, M. Plasma membrane H+-ATPase regulation in the center of plant physiology. Mol. Plant 2016, 9, 323–337. [Google Scholar] [CrossRef] [PubMed]
  43. Baxter, I.; Tchieu, J.; Sussman, M.R.; Boutry, M.; Palmgren, M.G.; Gribskov, M.; Harper, J.F.; Axelsen, K.B. Genomic comparison of P-type ATPase ion pumps in Arabidopsis and rice. Plant Physiol. 2003, 132, 618–628. [Google Scholar] [CrossRef] [PubMed]
  44. Sibole, J.V.; Cabot, C.; Michalke, W.; Poschenrieder, C.; Barceló, J. Relationship between expression of the PM H+-ATPase, growth and ion partitioning in the leaves of salt-treated Medicago species. Planta 2005, 221, 557–566. [Google Scholar] [CrossRef] [PubMed]
  45. Ewing, N.N.; Bennett, A.B. Assessment of the number and expression of P-type H+-ATPase genes in tomato. Plant Physiol. 1994, 106, 547–557. [Google Scholar] [CrossRef] [PubMed]
  46. Gévaudant, F.; Pétel, G.; Guilliot, A. Differential expression of four members of the H+-ATPase gene family during dormancy of vegetative buds of peach trees. Planta 2001, 212, 619–626. [Google Scholar] [CrossRef] [PubMed]
  47. Altschul, S.F.; Gish, W.; Miller, W.; Myers, E.W.; Lipman, D.J. Basic local alignment search tool. J. Mol. Biol. 1990, 215, 403–410. [Google Scholar] [CrossRef] [PubMed]
  48. Sammut, S.J.; Finn, R.D.; Bateman, A. Pfam 10 years on: 10,000 families and still growing. Brief. Bioinform. 2008, 9, 210–219. [Google Scholar] [CrossRef] [PubMed]
  49. Finn, R.D.; Bateman, A.; Clements, J.; Coggill, P.; Eberhardt, R.Y.; Eddy, S.R.; Heger, A.; Hetherington, K.; Holm, L.; Mistry, J. Pfam: The protein families database. Nucleic Acids Res. 2014, 42, D222–D230. [Google Scholar] [CrossRef] [PubMed]
  50. Gasteiger, E.; Hoogland, C.; Gattiker, A.; Duvaud Se Wilkins, M.R.; Appel, R.D.; Bairoch, A. Protein Identification and Analysis Tools on the ExPASy Server; Springer: Berlin/Heidelberg, Germany, 2005. [Google Scholar]
  51. Chen, C.; Chen, H.; Zhang, Y.; Thomas, H.R.; Frank, M.H.; He, Y.; Xia, R. TBtools: An integrative toolkit developed for interactive analyses of big biological data. Mol. Plant 2020, 13, 1194–1202. [Google Scholar] [CrossRef] [PubMed]
  52. Kumar, S.; Nei, M.; Dudley, J.; Tamura, K. MEGA: A biologist-centric software for evolutionary analysis of DNA and protein sequences. Brief. Bioinform. 2008, 9, 299–306. [Google Scholar] [CrossRef] [PubMed]
  53. Bork, P.; Koonin, E.V. Protein sequence motifs. Curr. Opin. Struct. Biol. 1996, 6, 366–376. [Google Scholar] [CrossRef] [PubMed]
  54. Bailey, T.L.; Boden, M.; Buske, F.A.; Frith, M.; Grant, C.E.; Clementi, L.; Ren, J.; Li, W.W.; Noble, W.S. MEME SUITE: Tools for motif discovery and searching. Nucleic Acids Res. 2009, 37 (Suppl. S2), W202–W208. [Google Scholar] [CrossRef] [PubMed]
  55. Saldanha, A.J. Java Treeview—Extensible visualization of microarray data. Bioinformatics 2004, 20, 3246–3248. [Google Scholar] [CrossRef] [PubMed]
  56. Tong, Z.; Gao, Z.; Wang, F.; Zhou, J.; Zhang, Z. Selection of reliable reference genes for gene expression studies in peach using real-time PCR. BMC Mol. Biol. 2009, 10, 71. [Google Scholar] [CrossRef] [PubMed]
  57. Livak, K.J.; Schmittgen, T.D. Analysis of relative gene expression data using real-time quantitative PCR and the 2−ΔΔCT method. Methods 2001, 25, 402–408. [Google Scholar] [CrossRef] [PubMed]
  58. Chen, M.; Manley, J.L. Mechanisms of alternative splicing regulation: Insights from molecular and genomics approaches. Nat. Rev. Mol. Cell Biol. 2009, 10, 741–754. [Google Scholar] [CrossRef] [PubMed]
  59. Ding, M.; Zhang, M.; Zeng, H.; Hayashi, Y.; Zhu, Y.; Kinoshita, T. Molecular basis of plasma membrane H+-ATPase function and potential application in the agricultural production. Plant Physiol. Biochem. 2021, 168, 10–16. [Google Scholar] [CrossRef] [PubMed]
  60. Bramley, H.; Turner, D.; Tyerman, S.; Turner, N. Water flow in the roots of crop species: The influence of root structure, aquaporin activity, and waterlogging. Adv. Agron. 2007, 96, 133–196. [Google Scholar]
  61. Yamauchi, A.; Pardales, J.R., Jr.; Kono, Y. Root system structure and its relation to stress tolerance. In Proceedings of the Roots and Nitrogen in Cropping Systems of the Semi-Arid Tropics, Patancheru, India, 21–25 November 1994; pp. 211–233. [Google Scholar]
  62. Haruta, M.; Burch, H.L.; Nelson, R.B.; Barrett-Wilt, G.; Kline, K.G.; Mohsin, S.B.; Young, J.C.; Otegui, M.S.; Sussman, M.R. Molecular characterization of mutant Arabidopsis plants with reduced plasma membrane proton pump activity. J. Biol. Chem. 2010, 285, 17918–17929. [Google Scholar] [CrossRef] [PubMed]
  63. Robertson, W.R.; Clark, K.; Young, J.C.; Sussman, M.R. An Arabidopsis thaliana plasma membrane proton pump is essential for pollen development. Genetics 2004, 168, 1677–1687. [Google Scholar] [CrossRef]
  64. Lan, P.; Li, W.; Lin, W.-D.; Santi, S.; Schmidt, W. Mapping gene activity of Arabidopsis root hairs. Genome Biol. 2013, 14, R67. [Google Scholar] [CrossRef] [PubMed]
  65. Baxter, I.R.; Young, J.C.; Armstrong, G.; Foster, N.; Bogenschutz, N.; Cordova, T.; Peer, W.A.; Hazen, S.P.; Murphy, A.S.; Harper, J.F. A plasma membrane H+-ATPase is required for the formation of proanthocyanidins in the seed coat endothelium of Arabidopsis thaliana. Proc. Natl. Acad. Sci. USA 2005, 102, 2649–2654. [Google Scholar] [CrossRef] [PubMed]
  66. Schaller, A.; Oecking, C. Modulation of plasma membrane H+-ATPase activity differentially activates wound and pathogen defense responses in tomato plants. Plant Cell 1999, 11, 263–272. [Google Scholar] [PubMed]
  67. Fan, Y.; Wan, S.; Jiang, Y.; Xia, Y.; Chen, X.; Gao, M.; Cao, Y.; Luo, Y.; Zhou, Y.; Jiang, X. Over-expression of a plasma membrane H+-ATPase SpAHA1 conferred salt tolerance to transgenic Arabidopsis. Protoplasma 2018, 255, 1827–1837. [Google Scholar] [CrossRef] [PubMed]
  68. Młodzińska, E.; Kłobus, G.; Christensen, M.D.; Fuglsang, A.T. The plasma membrane H+-ATPase AHA2 contributes to the root architecture in response to different nitrogen supply. Physiol. Plant. 2015, 154, 270–282. [Google Scholar] [CrossRef]
  69. Hsu, J.L.; Wang, L.Y.; Wang, S.Y.; Lin, C.H.; Ho, K.C.; Shi, F.K.; Chang, I.F. Functional phosphoproteomic profiling of phosphorylation sites in membrane fractions of salt-stressed Arabidopsis thaliana. Proteome Sci. 2009, 7, 42. [Google Scholar] [CrossRef]
  70. Yamauchi, S.; Takemiya, A.; Sakamoto, T.; Kurata, T.; Tsutsumi, T.; Kinoshita, T.; Shimazaki, K.-I. The plasma membrane H+-ATPase AHA1 plays a major role in stomatal opening in response to blue light. Plant Physiol. 2016, 171, 2731–2743. [Google Scholar] [CrossRef]
  71. Merlot, S.; Leonhardt, N.; Fenzi, F.; Valon, C.; Costa, M.; Piette, L.; Vavasseur, A.; Genty, B.; Boivin, K.; Müller, A. Constitutive activation of a plasma membrane H+-ATPase prevents abscisic acid-mediated stomatal closure. EMBO J. 2007, 26, 3216–3226. [Google Scholar] [CrossRef] [PubMed]
  72. Kumari, A.; Chételat, A.; Nguyen, C.T.; Farmer, E.E. Arabidopsis H+-ATPase AHA1 controls slow wave potential duration and wound-response jasmonate pathway activation. Proc. Natl. Acad. Sci. USA 2019, 116, 20226–20231. [Google Scholar] [CrossRef]
  73. Young, J.C.; DeWitt, N.D.; Sussman, M.R. A transgene encoding a plasma membrane H+-ATPase that confers acid resistance in Arabidopsis thaliana seedlings. Genetics 1998, 149, 501–507. [Google Scholar] [CrossRef] [PubMed]
  74. Zhao, Z.; Fan, J.; Gao, Y.G.; Wang, Z.; Yang, P.; Liang, Y.; Opiyo, S.; Xia, Y. Arabidopsis plasma membrane ATPase AHA5 is negatively involved in PAMP-triggered immunity. Int. J. Mol. Sci. 2022, 23, 3857. [Google Scholar] [CrossRef] [PubMed]
  75. Yao, Z.; Hao, W.; Wang, Y.; Chen, Z.; Cao, S.; Jiang, L. Loss-of-function mutations in the ERF96 gene enhance iron-deficient tolerance in Arabidopsis. Plant Physiol. Biochem. 2022, 175, 1–11. [Google Scholar] [CrossRef] [PubMed]
  76. Yang, Y.; Han, X.; Ma, L.; Wu, Y.; Liu, X.; Fu, H.; Liu, G.; Lei, X.; Guo, Y. Dynamic changes of phosphatidylinositol and phosphatidylinositol 4-phosphate levels modulate H+-ATPase and Na+/H+ antiporter activities to maintain ion homeostasis in Arabidopsis under salt stress. Mol. Plant 2021, 14, 2000–2014. [Google Scholar] [CrossRef] [PubMed]
  77. Cai, Y.S.; Cai, J.L.; Lee, J.T.; Li, Y.M.; Balladona, F.K.; Sukma, D.; Chan, M.T. Arabidopsis AtMSRB5 functions as a salt-stress protector for both Arabidopsis and rice. Front. Plant Sci. 2023, 14, 1072173. [Google Scholar] [CrossRef] [PubMed]
  78. Knight, C.A.; Vogel, H.; Kroymann, J.; Shumate, A.; Witsenboer, H.; Mitchell-Olds, T. Expression profiling and local adaptation of Boechera holboellii populations for water use efficiency across a naturally occurring water stress gradient. Mol. Ecol. 2006, 15, 1229–1237. [Google Scholar] [CrossRef] [PubMed]
  79. Yuan, W.; Zhang, D.; Song, T.; Xu, F.; Lin, S.; Xu, W.; Li, Q.; Zhu, Y.; Liang, J.; Zhang, J. Arabidopsis plasma membrane H+-ATPase genes AHA2 and AHA7 have distinct and overlapping roles in the modulation of root tip H+ efflux in response to low-phosphorus stress. J. Exp. Bot. 2017, 68, 1731–1741. [Google Scholar] [CrossRef] [PubMed]
  80. Feng, S.; Peng, Y.; Liu, E.; Ma, H.; Qiao, K.; Zhou, A.; Liu, S.; Bu, Y. Arabidopsis V-ATPase d2 subunit plays a role in plant responses to oxidative stress. Genes 2020, 11, 701. [Google Scholar] [CrossRef]
  81. Yuan, W.; Li, Y.; Li, L.; Siao, W.; Zhang, Q.; Zhang, Y.; Liu, J.; Xu, W.; Miao, R. BR-INSENSITIVE1 regulates hydrotropic response by interacting with plasma membrane H+-ATPases in Arabidopsis. Plant Signal. Behav. 2018, 13, e1486147. [Google Scholar] [CrossRef] [PubMed]
  82. Santi, S.; Schmidt, W. Dissecting iron deficiency-induced proton extrusion in Arabidopsis roots. New Phytol. 2009, 183, 1072–1084. [Google Scholar] [CrossRef] [PubMed]
Figure 1. Genomic distributions of 27 plasma membrane H+-ATPase genes on 7 of the 12 peach chromosomes. Tandemly duplicated genes are connected by green lines. The scale bar on the left is shown in megabases (Mb).
Agronomy 14 00908 g001
Figure 2. Phylogenetic analyses of plasma membrane H+-ATPases. Phylogenetic relationships among plasma membrane H+-ATPases from P. persica, rice, and A. thaliana. Genes on branch ends from P. persica, rice, and A. thaliana are denoted by green solid triangles, blue stars, and red solid circles, respectively. The different-colored arcs and branches indicate different groups of plasma membrane H+-ATPases.
Agronomy 14 00908 g002
Figure 3. Gene structures of P. persica plasma membrane H+-ATPases. Exon/intron organization in the 27 plasma membrane H+-ATPase genes. The orange solid boxes, blue solid boxes, and black lines indicate exons, untranslated regions (UTRs), and introns, respectively. Their length is represented by base pairs, and the scale is displayed at the bottom.
Agronomy 14 00908 g003
Figure 4. Conserved motif compositions of P. persica plasma membrane H+-ATPases. Motif numbers 1–15 are shown in different-colored boxes. Protein lengths can be estimated using the scale at the bottom.
Agronomy 14 00908 g004
Figure 5. Heatmap showing the expressions of six plasma membrane H+-ATPases after the P. persica roots were subjected to flooding or non-flooding treatment. Color scale at the right of the image represents log10-transformed RPKM values. Red indicates high and blue indicates low transcript abundance levels.
Agronomy 14 00908 g005
Figure 6. Validation of the RNA-seq data for the six selected differentially expressed plasma membrane H+-ATPase genes via RT-qPCR analysis. * and ** represent significant differences, p value < 0.05 and <0.01, respectively. ns = Non-significant.
Agronomy 14 00908 g006
Table 1. Primers used in this study.
Gene NameGene IDPrimer NamePrimer Sequence
PPA1Prupe.1G023100PPA1-FCAGACGCCTTTACAAGAACGG
PPA1-RAGAGAGCCTCCTCACCAACG
PPA2Prupe.1G023200PPA2-FCCAAAATACCTCGCTCTCCC
PPA2-RTGCTGGTGGCTTCATGTATGT
PPA5Prupe.1G072600PPA5-FTGCTGGGTATAAAGACAGAGGG
PPA5-RTCTGCCGCCTCTAATGACC
PPA15Prupe.3G029800PPA15-FTGTACAGTTTGATTTTCTACATTCC
PPA15-RTTGGCTGCCCTATCTTCCTT
PPA19Prupe.5G185000PPA19-FTGAAGTATTGGACGCTGTGTTG
PPA19-RCCACGAGAGAGGGTTCCACAT
PPA26Prupe.7G258000PPA26-FCGCACACATTTCACAGAACTCA
PPA26-RCACTTTCCATCCCTCAAGACCTTAG
PPactinPPactinPPactin-FGTTATTCTTCATCGGCGTCTTCG
PPactin-RCTTCACCATTCCAGTTCCATTGTC
Disclaimer/Publisher’s Note: The statements, opinions and data contained in all publications are solely those of the individual author(s) and contributor(s) and not of MDPI and/or the editor(s). MDPI and/or the editor(s) disclaim responsibility for any injury to people or property resulting from any ideas, methods, instructions or products referred to in the content.

