Article

Soil Fertility and Bacterial Community Composition in Response to the Composting of Biochar-Amended Chicken Manure

Institute of Resources, Environment and Soil Fertilizer, Fujian Academy of Agricultural Sciences, 247 Wusi Road, Gulou District, Fuzhou 353000, China
*
Author to whom correspondence should be addressed.
Submission received: 22 February 2024 / Revised: 20 March 2024 / Accepted: 25 March 2024 / Published: 24 April 2024
(This article belongs to the Section Soil and Plant Nutrition)

Abstract

:
Amidst the burgeoning expanse of the poultry sector, the escalation of chicken manure production has ensued, potentially exacerbating ecological contamination. However, the application of chicken manure is bound to transmute the habitat of edaphic microorganisms, precipitating an alteration in the soil’s microbial consortium. The composting of biochar-amended chicken manure and wood chips (biochar composting products, BCPs) was used to improve Chinese cabbage (Brassica campestris L.) production and regulate soil properties and bacterial community structure. On the 40th day of Chinese cabbage growth, soil and Chinese cabbage were collected for laboratory analysis. The effects of different proportions of BCPs (0, 1%, 3%, 5% and 7% biochar) on soil fertility, enzyme activity, the microbial community and the growth of Chinese cabbage were studied under facility conditions. The results showed that the growth performance and quality of Chinese cabbage were significantly increased with increasing BCP ratios. Soil fertility indicators including pH, AN, AP, AK and SOM were significantly increased, except for the pH value in the 1% BCP group. The activities of phosphatase, catalase and urease were increased for all groups of BCP treatment. The soil microbial community response was significantly different, and the application of 5% and 7% BCPs reduced the abundance, diversity and evenness of soil bacteria. Chinese cabbage growth performance was positively correlated with an increase in BCP supplemental levels in the range of 3–5%. Also, the abundance, diversity and uniformity of the soil microbial community were improved in the 3% BCP treatment group. Therefore, the dominant bacterial phyla were Bacteroidetes, Actinobacteriota, Gemmatimonadota, Myxococcota, Bdellovibrionota and Firmicutes, especially the Bradyrhizobium of Proteobacteria. BCP treatment reduced the degradation of soil organic matter. In addition, it also improved the relative abundance of sequences associated with improving soil fertility. Collectively, these findings offer insights for the re-evaluation of application management strategies for BCP organic fertilizers.

1. Introduction

A variety of chemical fertilizers and pesticides used in facility cultivation have also been of great detriment to land and crops, causing soil compaction, soil microbial environment deterioration and crop pesticide residue. In order to ensure soil nutrient supply and crop yield, accelerating cultivated land restoration and improving product quality are important issues facing current agricultural production. At present, an effective way to improve soil fertility and nutrient vitality is by increasing the application of organic fertilizers, purifying the soil environment and ensuring high yield and quality of crops based on various amino acids and humus [1,2,3]. Previous studies showed that organic fertilizers contain a large number of amino acids and organic matter, as well as nitrogen, phosphorus, potassium and other nutrients required for plant growth [4]. Also, they optimize the rhizosphere bacterial community structure and improve soil fertility and soil continuous production capacity [4]. Gelaye and Tadele (2022) suggested a combination of two cabbage buds and five tons of farmyard manure/ha−1 fertilizer for the economical production of cabbage [5]. Bio-organic fertilizers, on the one hand, proffer a bounty of nutrients, modulating and invigorating crops while mitigating the onslaught of pests and pathogens during the maturation of tomatoes [6]. On the other, they alleviate soil compaction and augment its porosity, thereby optimizing nutrient uptake [2]. Previous research indicated that after composting it, compound organic matter can improve soil fertility, promote the accumulation and conversion of nutrients and promote the production of basmati rice [1,3]. Therefore, the compound application of bio-organic fertilizer can optimize the soil environment, increase soil fertility and increase crop yields.
Biochar is a common composting product. Biochar composting products (BCPs) are soil remediators that are environmentally friendly and cost effective and promote the availability and distribution of food, facilitate planetary conservation, alleviate poverty and enhance the attainment of Sustainable Millennium Development Goals [7]. The purpose of biochar composting is to improve waste utilization. It is well known that chicken manure is a common farm waste. The reason for this is that chicken manure is an important source of pathogenic microorganisms such as Salmonella, Escherichia coli, Staphylococcus, Streptococcus, Clostridium, Listeria, Campylobacter, Corynebacterium and Mycobacterium [8]. Although chicken manure contains many pathogens [9], it can be used effectively as fertilizer and is useful for incineration, anaerobic digestion, direct burning and compost [10,11,12,13]. At present, composting is an ideal environmentally friendly technology that can utilize organic fertilizer and biomass resources [14]. The composting of biochar-amended chicken manure and sawdust mixtures could reduce pathogenic microorganisms and improve plant nutrients [15]. Previous studies indicated that composting can enhance the soil environment by increasing soil organic matter, nitrogen, phosphorus and many trace elements [14,16]. In addition, compound organic fertilizer with biochar can increase crop yield by increasing the soil organic carbon content and the activity of acid phosphatase, catalase and other microbial enzymes [12,17,18].
At present, many studies have shown the effects of biochar organic fertilizers on soil and crops. However, there is a lack of information regarding the effects of biochar on the soil–crop system. Therefore, the aims of this study were to (1) investigate the mechanism of different proportions of biochar composting products in “soil-microbial-cash crops” and (2) assess the microbiological composition of compost treatment by employing high-throughput genomic sequencing and qPCR. The results are expected to provide a scientific basis for crop cultivation and soil health.

2. Materials and Methods

2.1. Collection of Raw Materials

Fresh chicken manure was collected from a large-scale livestock farm located at Fujian Sunner Development Inc. (Nanping, China). Sawdust was collected from a local timber processing plant (Minhou, Fuzhou, China). Biochar (corn stalk, grain size 100 mesh, specific surface area 1000–1300 m2/g, C content 95%, ash 5%) was purchased from Pingdingshan Lvzhiyuan Activated Carbon Co., Ltd. (Pingdingshan, China). The corn stalk was pyrolyzed at 500 °C under anaerobic conditions and passed through a 100-mesh sieve.

2.2. Compost Treatment and Experimental Design

The raw materials of chicken manure (30%) and wood chips (70%) were used in the compost products. The composting process was conducted in the compost research laboratory of the Fujian Academy of Agricultural Sciences, China (longitude: 119.3016234, latitude: 26.1069109). The composting process followed Ravindran’s method [12] using a 100 L container. The compost mixture for each treatment was prepared based on fresh weight to achieve a C/N ratio of 20:1 and a moisture content of 60%. After 50 days of the composting reaction, the compost samples were collected for testing. Five different treatments were set up in triplicate. In all the treatments, different ratios of biochar composting products (BCPs) were added into the soil and mixed thoroughly and were designated as 0% BCP (control, C), 1% BCP (T1, containing 1% biochar), 3% BCP (T2, containing 3% biochar), 5% BCP (T3, containing 5% biochar) and 7% BCP (T4, containing 7% biochar), including 6 replicates in each group. The experimental pots (21 cm × 18 cm) were filled with 3.0 kg soil collected from the 0–30 cm layer from a vegetable-growing garden from the town of Minhou (Fuzhou, China). All soil samples were passed through a 2 mm sieve. The 3.0 g compound fertilizer was added as basal fertilization before planting Chinese cabbage (Brassica campestris L.). During the test, timely manual weeding and regular and quantitative watering were required, but no pesticides were used. Seeds of Chinese cabbage were germinated on a tray, and 1 seedling with maximum leaves length was planted in each pot with three replications. Seedlings were first thinned when the leaves were 4 cm long, with 5 seedlings per pot. When the leaves were 8 cm long, the seedlings were thinned a second time, with 3 seedlings per pot. When the leaf length was 13 cm, the seedlings were thinned for the third time, with 1 seedling per pot. On the 40th day of Chinese cabbage growth, both soil and Chinese cabbage samples were collected for laboratory detection.

2.3. Sample Collection and Measurements

For all of the Chinese cabbages, height of the plant, maximum leaf width and length and the grain yield at harvest were determined. Fresh plant samples were cleaned and cut into pieces. Soluble sugar, nitrate and vitamin C contents were determined according to the Kit instructions (Jiancheng, Nanjing, China). Soil samples were collected after Chinese cabbage harvesting and air dried at room temperature. Electrical conductivity (EC) of the soil samples was measured in a 1:5 (w/v) aqueous extract using a conductivity meter (DDSJ-308A, CHN). pH was determined from soil–water suspensions (1:10 w/v) using a pH meter (AB150, Thermo Fisher Scientific Inc., Beijing, China). Organic matter (OM) content was determined by the potassium dichromate oxidation method. Available N content was determined by an elemental analyzer. Available K was extracted with ammonium acetate and determined by a flame photometer (M410, Sherwood, Cambridge, UK). Olsen-P was extracted with 0.5 mol/L NaHCO3 and determined by molybdenum blue colorimetry [19,20].
The determination of soil enzyme activity was as follows: soil phosphatase activity was determined according to previous research, which described the mass (μg) of phenol released from 1 g soil after 24 h using sodium diphenyl phosphate colorimetry. Urease activity was measured by phenol sodium colorimetry, expressed in mg of NH3-N in 1 g soil after 24 h. Catalase was expressed by the volume (mL) of 0.1 mol/L KMnO4 consumed by 1 g of dry soil in 1 h [16,17].

2.4. DNA Extraction and High-Throughput Sequencing

Soil samples of 0.5 g were used to extract DNA with an Omega Soil DNA Kit (Omega Bio-Tek, Norcross, GA, USA). Conventional qualitative PCR was performed by a Fast DNA® Spin Kit (MP Biomedicals, Irvine city, CA, USA). The V3-V4 hypervariable region of 16S rRNA genes was amplified using the primers 343F TACGGRAGGCAGCAG and 798R AGGGTATCTAATCCT equipped with 12-base barcodes for sample distinction. A 25 μL reaction solution containing 12.5 μL PCR Master Mix, 5 μM of each primer, 5.5 μL ddH2O and 10 ng of template DNA was used for analysis. The PCR condition was set at 98 °C for 1 min, followed by 34 cycles for denaturation at 98 °C for 15 s, annealing at 50 °C for 45 s and extension at 72 °C for 45 s, with a final extension at 72 °C for 5 min. The PCR product was extracted with a Qiagen DNA gel extraction kit (Qiagen, Beijing, China,) and purified by running 1.5% agarose gel electrophoresis. A sequencing library was generated using a TruSeq® DNA PCR-Free Sample Preparation Kit (Illumina, San Diego, CA, USA). The library was applied to an Illumina NovaSeq PE250 platform by Oebiotech Bio-Pharm Technology Co., Ltd. (Shanghai, China).

2.5. Bioinformatic and Statistical Analysis

The data were reported as the mean and standard deviation (n = 3) for each treatment and analyzed with Microsoft Excel 2019. A one-way analysis of variance (ANOVA) and Duncan multiple comparisons test using SPSS (version 21.0, IBM, New York, NY, USA) (p  <  0.05) were used to analyze the high-throughput sequencing data, and visualization of the OTUs for each sample was performed using the online platform Genes Cloud (https://www.genescloud.cn, accessed on 26 December 2023). A nonmetric multidimensional scaling analysis (NMDS) and redundancy analysis (RDA) were used to evaluate the changes in soil bacterial community structure under different treatments [21]. An LEfSe analysis and LDA scores were completed using the Wekemo Bioincloud (https://www.bioincloud.tech, accessed on 26 December 2023). The data show means and standard deviations (SDs). Statistical significance was set at p < 0.05.

3. Results

3.1. Effect of BCP Treatments on Production Quality of Chinese Cabbage

The biomass and morphology of Chinese cabbage are shown in Table 1. The biomass and morphology of the Chinese cabbage were both significantly affected by the BCP treatments. Compared with the control (CK), the BCP treatments obviously improved fresh weight, plant height and maximum leaf width and length. In addition, the growth trend of Chinese cabbage increased with an increasing BCP ratio. The addition of 3% BCP (T2) had the highest fresh weight, plant height, maximum leaf width and maximum leaf length.
Table 1 further elucidates the effect of BCPs on the quality of Chinese cabbage. The contents of soluble sugar, nitrate and vitamin C were 11.15–15.47%, 517.47–583.25 mg·kg−1 and 164.18–289.89 mg·kg−1, respectively. Compared with the CK, the contents of soluble sugar and vitamin C of the Chinese cabbage in all the BCP treatments were significantly increased (p < 0.05). Nitrate levels in all the BCP treatments were significantly (p < 0.05) lower than that of the CK. The T3 treatment showed the highest soluble sugar content and vitamin C content, and the T4 treatment showed the lowest nitrate content.

3.2. Effect of BCP Treatments on Fertility-Related Properties of Soil

The soil-fertility-related properties of the BCP treatments after harvesting are listed in Table 2. The soil pH of the BCP treatments at the end of the experiment was 5.91–6.21. The EC value was maintained at 1.08–1.52 ms/cm in each BCP treatment. Soil alkali-hydrolyzable nitrogen (AN), available phosphorus (AP) and available potassium (AK) are important indices of soil effective fertility. The results showed that BCP treatments significantly improved the contents of AN, AP and AK (Table 2). The contents of AN, AP and AK of the BCP treatments were 8.0%, 36% and 16.7% higher than the CK, respectively. Importantly, the contents of AN, AP and AK were positively correlated with the application ratio of the BCP treatments. The increase in the AP content was higher than the CK, which was mainly due to the increased adsorption of phosphorus in soil after the application of BCPs.
The BCP treatments also invigorated the soil enzymatic activities (Table 3). The activities of phosphatase, catalase and urease were significantly increased alongside the BCP increments. Soil urease activity initially rose then waned, mirroring the microflora’s abundance and diversity trends (Figure 1A), hinting at bacterial microflora’s influence on soil urease. Phosphatase was significantly increased, and the pH value had a similar trend in the BCP treatments.

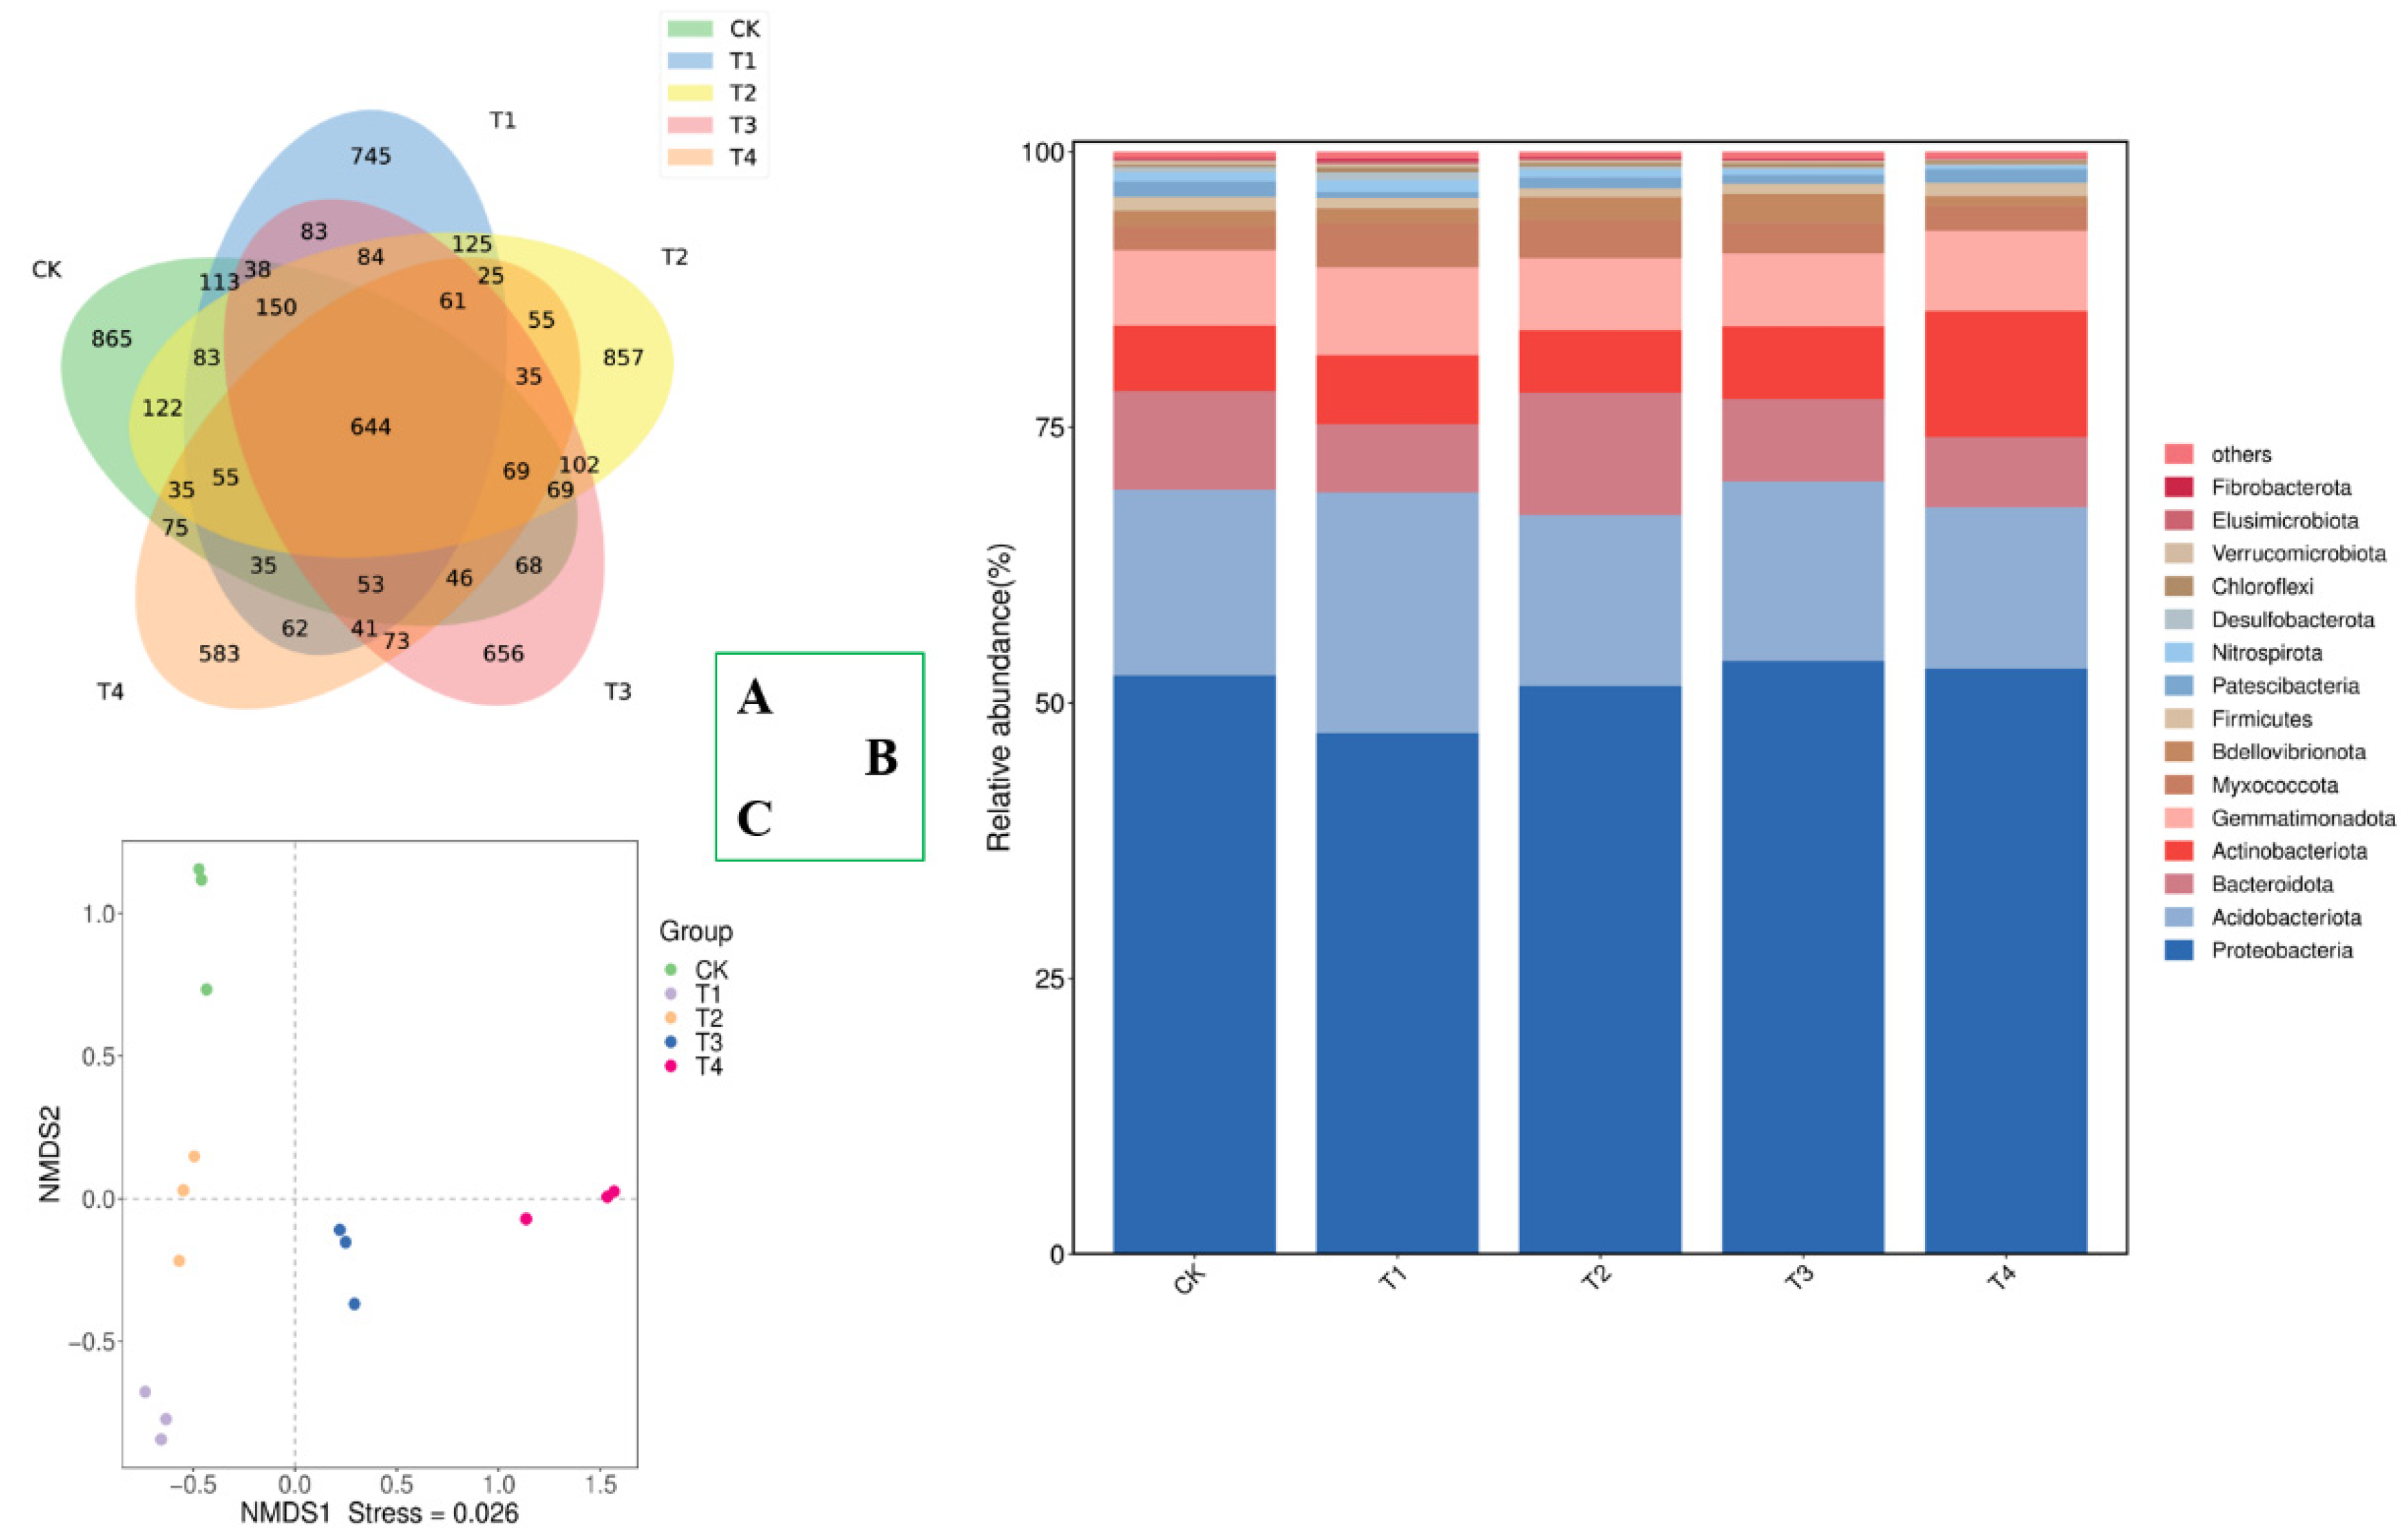
3.3. Effect of BCP Treatments on Bacterial Community Diversity and Composition

The BCP treatments were found to enhance the bacterial community’s diversity within the soil (Figure 1). There were 865, 745, 857, 656 and 583 unique operational taxonomic units (OTUs) observed in the groups of CK, T1, T2, T3 and T4, respectively. The bacterial community compositions of rhizosphere soils were changed within different BCP treatments. These results were also consistent with the NMDS ordination (Figure 1B). The different bacterial community compositions were also shown by the relative abundances of bacterial taxa at the phylum level (Figure 1C). The dominant taxa were Proteobacteria and Actinobacteria, followed by Bacteroidetes, Actinobacteriota, Gemmatimonadota, Myxococcota, Bdellovibrionota and Firmicutes, which accounted for more than 90% of the total bacterial sequences (Figure 1C). Furthermore, the bacterial community diversity difference was proved according to alpha and beta diversity analyses (Figure 2). The T4 treatment exhibited the lowest Chao1 (Figure 2A) and Shannon indices (Figure 2B) compared to all other treatments and exhibited the highest goods-average index of bacteria in the rhizosphere soils (Figure 2C). The nonmetric multidimensional scaling (NMDS) analysis revealed that different BCP treatments affect the distribution of the rhizosphere soil samples (Figure 2C). For samples located in different quadrants, the same color points represent the same group sample and indicate significant differences in bacterial communities after the BCP treatments.
The relative abundances of bacteria at the phylum level of the BCP treatments are shown at Figure 3. The BCP depicts the relative abundances of the top 15 genera, with the dominant genera being Ellin6067, Bradyrhizobium, Ralstonia and pseudarthrobacter (Figure 3A). The T4 treatment significantly increased the relative abundance of Ellin6067, Bradyrhizobium, Ralstonia and pseudarthrobacter (T4) and significantly decreased the relative abundance of Massilia, Candidatus Solibater, SC-1-84 and Flavisolibacter compared with the CK. In particular, BCP treatment can increase the relative abundance of Bradyrhizobium, which is an important diazotrophic bacteria.

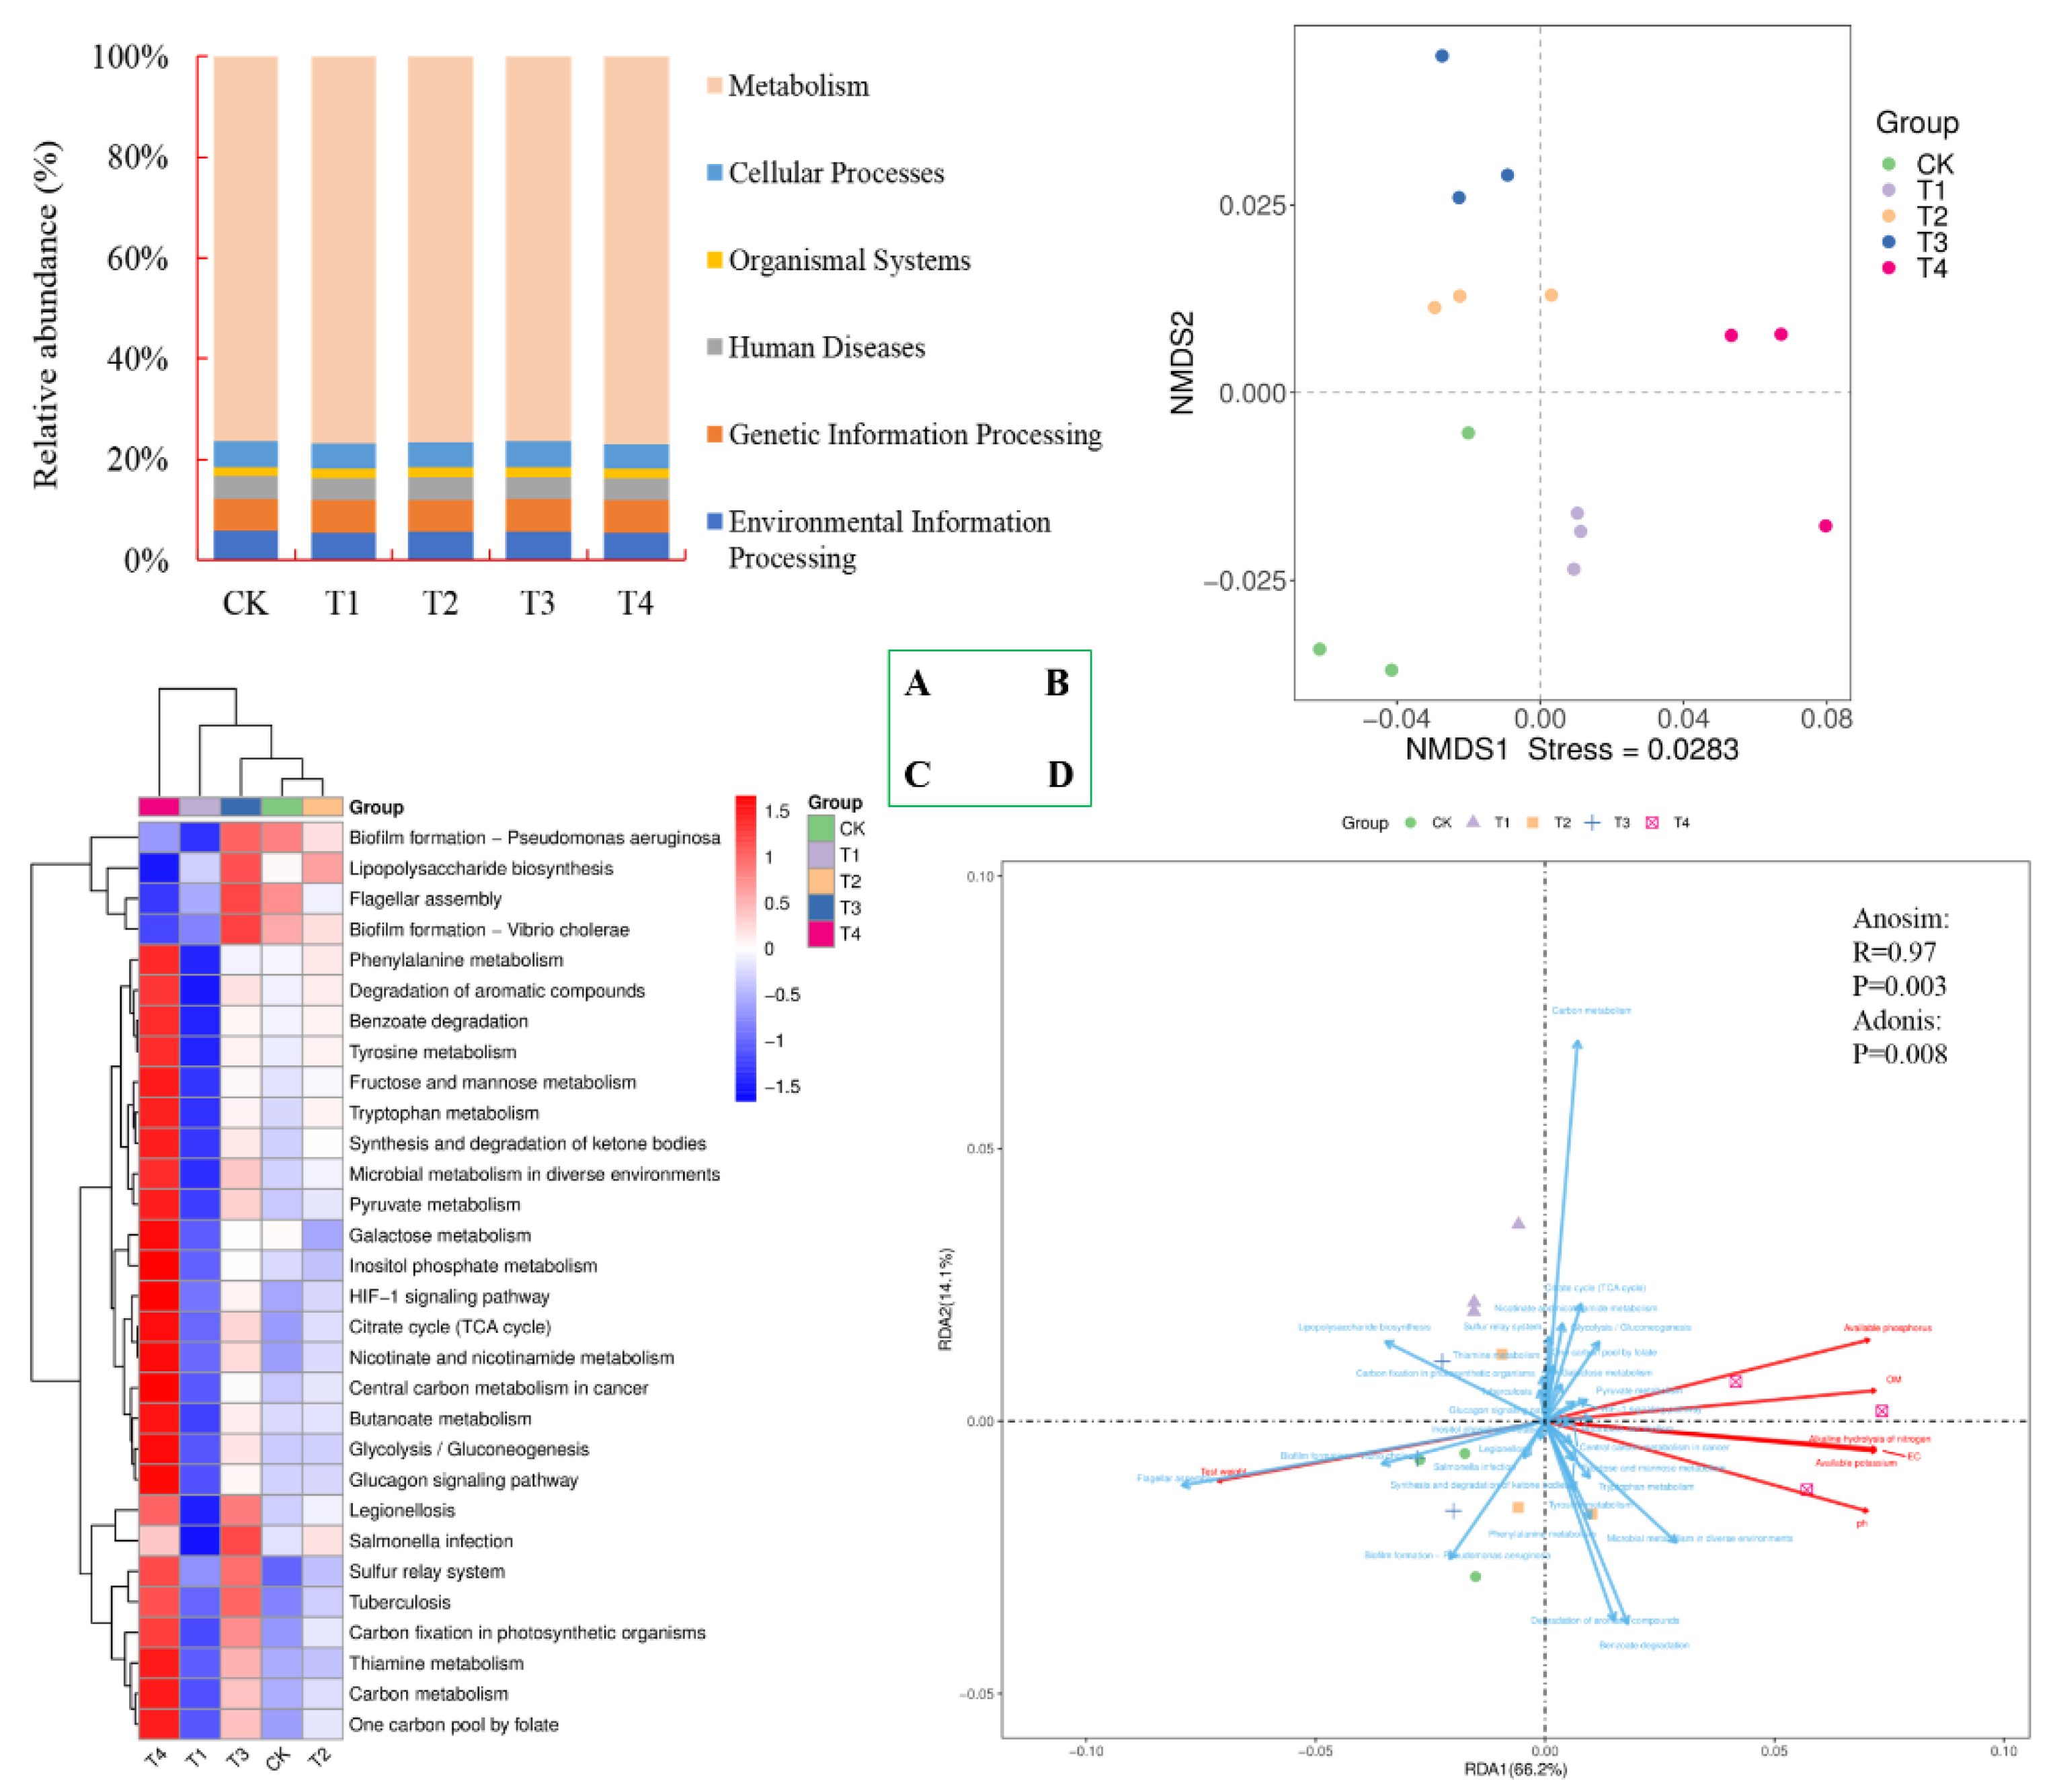
3.4. Effect of BCP Treatments on Soil Microbial Metabolism Functions

Soil bacterial function with BCP treatment was analyzed by PICRUSt based on the Kyoto Encyclopedia of Genes and Genomes (KEGG) database (Figure 4). In the present study, the relative abundance of six function categories of level-1 was recorded (Figure 4A). Metabolism was the most primary, whose relative abundance was more than 70%, and the rest were less than 6%, including cellular processes, organismal systems, human diseases, genetic information processing and environmental information processing. The bacterial function compositions in the groups of BCP treatments were different from each other based on the NMDS results, indicating that BCP treatment significantly affects bacterial metabolism functions (Figure 4B). The heatmap showed that BCP treatment, especially at a 7% rate (T4 group), increased the relative abundance of some bacterial genes associated with amino acid metabolism (e.g., phenylalanine, tyrosine, tryptophan and pyruvate metabolism), carbohydrate metabolism (e.g., fructose and mannose metabolism, galactose metabolism, glycolysis/gluconeogenesis, the citrate cycle (TCA cycle) and the glucagon signaling pathway), lipid metabolism (inositol phosphate metabolism, the synthesis and degradation of ketone bodies and butanoate metabolism) and benzoate degradation, the degradation of aromatic compounds and microbial metabolism in diverse environments (Figure 4C).
A redundancy analysis (RDA) further shed light on the intricate interplay between soil nutrients and bacterial composition, with the RDA1 and RDA2 axes accounting for a significant percentage of the variance (Figure 4D). The RDA1 and RDA2 axes demonstrate 66.2% and 14.1%. The BCP treatments’ influence on the soil’s physicochemical properties, including pH, SOM, AK and AP, was profound, thereby reshaping the bacterial community and metabolic function composition of the soil.

4. Discussion

The BCP treatments’ boon to growth metrics such as fresh weight and plant dimensions was evident, including the best fresh weight, plant height, maximum leaf width and maximum leaf length. A previous study showed that an appropriate proportion of compound bio-organic fertilizer improved wheat yield, mainly because the application of the appropriate proportion of the compound bio-organic fertilizer maintained the supply of effective nutrients [22]. However, an excess may hinder plant growth due to the indirect nutrient absorption, necessitating microbial decomposition. This result is also reported in previous research [23,24], which showed that most of the nutrients in organic fertilizer cannot be directly absorbed by plants and instead are decomposed and mineralized by microorganisms. The reason for this may be due to that the release rate of nutrients lags behind the needs of the plant, which affects the growth of Chinese cabbage. In general, the quality of Chinese cabbage was improved with increasing the BCP treatment proportion. These results were similar to Yu’s studies [25], which showed that the treatment of soil with a high organic fertilizer content can promote the plant metabolic process and improve sunflower quality [25].
At the beginning of the composting process, the pH values of the BCP treatments increased due to the consumption of organic acids. The decomposition of organic material produced organic acids, which caused the pH values to decrease gradually [26]. No significant effect was seen on the soil EC value with the addition of the BCP. The soluble salt of the EC reaction is mainly formed by comprehensive changes in mineral release and precipitation, water evaporation and ammonia volatilization during the composting process [27]. Previous studies have shown that organic fertilizers can improve soil structure and water status, enhance soil water retention capacity and aeration, and provide long-term favorable conditions for microbial decomposition mineralization processes [1,2,14,28,29]. Additionally, soil organic matter content increased with an increasing BCP ratio. The variation in soil organic matter content is greatly affected by the microbial community. The main reason for this is that the decomposition of soil organic matter is different depending on the composition of the microbial community. The soil enzyme activity and soil properties were significantly increased similar to the increase in the pH value. Based on that, it is speculated that soil pH may affect phosphatase activity [30]. Previous research has shown that the storage and stability of soil organic matter (SOM) are greatly affected by humus type and factors affecting soil carbon storage [31]. Additionally, previous evidence indicated that the BCP could provide long-term favorable conditions for the microbial decomposition mineralization process [29]. Therefore, it is speculated that BCP treatment could increase the ability to secrete enzymes and then increase the activity of soil enzymes. These data show that the BCP treatments’ favorable impact on soil fertility is further evidenced.
However, the soil fertility and plant growth were inseparable from the soil bacterial community. BCP treatment improved the diversity of the bacterial communities, which is consistent with previous studies [32,33]. It has also been reported that some of these phyla were the most predominant in biochar-amended compost. According to the previous results, Proteobacteria and Actinobacteria are important phyla. The Proteobacteria played a vital role during the process of nitrogen and carbon cycling and directly affect the quality of compost [26,34]. Actinomyces are also important because they can degrade lignocellulose [35] and secrete multiple antibiotics to eliminate pathogenic microorganisms. At the generic level, bacteroides includes Clostridium and Enterobacter, which have proved to directly promote the plant Ageratina Adenophora [36]. Furthermore, different BCP treatments affect the distribution of the rhizosphere soil samples by decreasing the Chao1 index and Shannon index and increasing the goods-average index of bacteria. For example, peanuts can be infected by Bradyrhizobium to form root nodules for biological nitrogen fixation, which can provide 40.9 kg/ha of nitrogen fertilizer per year, which is 35.4–76.1% of the nitrogen fertilizer required for peanut growth [37]. Thus, this may also be one of the reasons why BCP addition can improve the growth of Chinese cabbage.
PICRUSt was used to analyze soil bacterial function with biochar compost product treatments based on the Kyoto Encyclopedia of Genes and Genomes (KEGG) database. The results showed that the metabolism was the most primary. According to the previous results, the amino acid metabolism and carbohydrate metabolism of the soil bacteria were increased with the biochar addition [26]. BCP treatment can increase crop production by regulating the relative abundance of bacteria related to amino acid metabolism and humic substance synthesis [38]. The physicochemical properties (main pH, SOM, AK and AP) could influence soil bacterial communities and metabolism. According to evidence reported in previous research [26,28,33], using compost with livestock manure and biochar could significantly influence the bacterial community and metabolic function composition of soil. Therefore, BCP treatment changes the soil microbial composition and then affects the utilization of organic matter.
Previous studies usually emphasize the high sorption capacity of biochar. However, biochar is also more easily saturated when the substance concentration increases or there is high moisture, temperature and organic matter content [39], which could limit its sorption capacity. Zhang also emphasized the role of non-carbonized organic matter content, which in compost biochar could explain the high potential of this biochar for the sorption of volatile organic compounds [40]. Furthermore, the conditions of biochar production also limit its use [40]. For example, biochar produced at 300 °C has a larger sorption capacity, retains heavy metals present in the soil on its surface and reduces carbon dioxide emissions [40,41,42]. Therefore, the selection of biochar produced at the right temperature and the addition of the appropriate proportion are conducive to the use of livestock and poultry breeding waste compost.

5. Conclusions

In the realm of scientific inquiry, this manuscript delved into the effect of a BCP on soil fertility, enzyme activity, the diversity of microscopic lifeforms and the yield and caliber of Chinese cabbage. It illuminated the intricate interplay between the BCP and the triad of soil, microbes and lucrative agrarian produce. An ascension in the fecundity of the soil was observed concomitant with the augmentation of the BCP. The optimal enhancement of soil fecundity, enzymatic dynamism, microbial heterogeneity and the cultivation and refinement of Chinese cabbage was attained post-administration of the BCP at concentrations of 3% and 5%. These changes improved the performance and quality of Chinese cabbage and increased the catalase, urease and phosphatase activities and the enrichment of microbial community heterogeneity. The predominant bacterial taxa included the likes of Bacteroidetes, Actinobacteriota, Gemmatimonadota, Myxococcota, Bdellovibrionota and Firmicutes. The RDA unveiled that the BCP treatments exerted a profound sway on the bacterial community and metabolic functionality within the soil, intertwined with the soil’s physicochemical attributes (notably pH, SOM, AK and AP). Hence, the 3–5% BCP treatments had better efficiency in improving the soil microbial environment and vegetable growth.

Author Contributions

C.L.: experimental design, performed the experiment, data curation and analysis, writing—original draft preparation. Y.F. and L.C.: performed the experiment, writing—editing. H.Z.: sample pretreatment, DNA extraction. X.J.: sample collection, sample pretreatment. All authors have read and agreed to the published version of the manuscript.

Funding

The authors would like to acknowledge the financial support of the Fujian Public Welfare Research Institute: Study on the effects of biochar on aerobic composting of chicken manure and its microbiological mechanism (No.: 2022R1025005), the Fujian Spark Project: Research and development and application of efficient bio-organic fertilizer (No.: 2023S0064), the Fujian Science and Technology Program Public Welfare Special Project (2023R1074) and the Special Fund Project for the high-quality development of marine services and fisheries in Fujian Province (No.: FJHY-YYKJ-2024-2-2).

Data Availability Statement

The data that support the findings of this study are available from the corresponding author upon reasonable request.

Conflicts of Interest

The authors declare no conflicts of interest.

References

  1. Ahmad, S.; Hussain, I.; Ghaffar, A.; Rahman, M.H.U.; Saleem, M.Z.; Yonas, M.W.; Hussnain, H.; Ikram, R.M.; Arslan, M. Organic amendments and conservation tillage improve cotton productivity and soil health indices under arid climate. Sci. Rep. 2022, 12, 14072. [Google Scholar] [CrossRef] [PubMed]
  2. Wang, X.; Yan, J.; Zhang, X.; Zhang, S.; Chen, Y. Organic manure input improves soil water and nutrients use for sustainable maize (Zea mays. L) productivity on the loess plateau. PLoS ONE 2020, 15, e0238042. [Google Scholar] [CrossRef] [PubMed]
  3. Dhaliwal, S.S.; Sharma, V.; Shukla, A.K.; Verma, V.; Kaur, M.; Singh, P.; Gaber, A.; Hossain, A. Effect of addition of organic manures on basmati yield, nutrient content and soil fertility status in north-western india. Heliyon 2023, 9, e14514. [Google Scholar] [CrossRef] [PubMed]
  4. Wang, J.; Zhang, X.; Yuan, M.; Wu, G.; Sun, Y. Effects of partial replacement of nitrogen fertilizer with organic fertilizer on rice growth, nitrogen utilization efficiency and soil properties in the yangtze river basin. Life 2023, 13, 624. [Google Scholar] [CrossRef] [PubMed]
  5. Gelaye, Y.; Tadele, E. Agronomic productivity and organic fertilizer rates on growth and yield performance of cabbage (Brassica oleracea var. Capitata L.) in northwestern ethiopia. Sci. World J. 2022, 2022, 2108401. [Google Scholar] [CrossRef] [PubMed]
  6. Bonanomi, G.; Alioto, D.; Minutolo, M.; Marra, R.; Cesarano, G.; Vinale, F. Organic amendments modulate soil microbiota and reduce virus disease incidence in the tswv-tomato pathosystem. Pathogens 2020, 9, 379. [Google Scholar] [CrossRef] [PubMed]
  7. Ajibade, S.; Nnadozie, E.C.; Iwai, C.B.; Ghotekar, S.; Chang, S.W.; Ravindran, B.; Kumar Awasthi, M. Biochar-based compost: A bibliometric and visualization analysis. Bioengineered 2022, 13, 15013–15032. [Google Scholar] [CrossRef] [PubMed]
  8. Shepherd, M.W., Jr.; Liang, P.; Jiang, X.; Doyle, M.P.; Erickson, M.C. Microbiological analysis of composts produced on south carolina poultry farms. J. Appl. Microbiol. 2010, 108, 2067–2076. [Google Scholar] [CrossRef] [PubMed]
  9. Ravindran, B.; Mnkeni, P.N. Bio-optimization of the carbon-to-nitrogen ratio for efficient vermicomposting of chicken manure and waste paper using eisenia fetida. Environ. Sci. Pollut. Res. Int. 2016, 23, 16965–16976. [Google Scholar] [CrossRef] [PubMed]
  10. Li, J.; Chen, Q.; Li, H.; Li, S.; Liu, Y.; Yang, L.; Han, X. Impacts of different sources of animal manures on dissemination of human pathogenic bacteria in agricultural soils. Environ. Pollut. 2020, 266, 13. [Google Scholar] [CrossRef] [PubMed]
  11. Ravindran, B.; Mupambwa, H.A.; Silwana, S.; Mnkeni, P.N.S. Assessment of nutrient quality, heavy metals and phytotoxic properties of chicken manure on selected commercial vegetable crops. Heliyon 2017, 3, e00493. [Google Scholar] [CrossRef] [PubMed]
  12. Ravindran, B.; Nguyen, D.D.; Chaudhary, D.K.; Chang, S.W.; Kim, J.; Lee, S.R.; Shin, J.; Jeon, B.H.; Chung, S.; Lee, J. Influence of biochar on physico-chemical and microbial community during swine manure composting process. J. Environ. Manag. 2019, 232, 592–599. [Google Scholar] [CrossRef] [PubMed]
  13. Sharma, S.; Basu, S.; Shetti, N.P.; Kamali, M.; Walvekar, P.; Aminabhavi, T.M. Waste-to-energy nexus: A sustainable development. Environ. Pollut. 2020, 267, 27. [Google Scholar] [CrossRef] [PubMed]
  14. Chia, W.Y.; Chew, K.W.; Le, C.F.; Lam, S.S.; Chee, C.S.C.; Ooi, M.S.L.; Show, P.L. Sustainable utilization of biowaste compost for renewable energy and soil amendments. Environ. Pollut. 2020, 267, 16. [Google Scholar] [CrossRef] [PubMed]
  15. Chung, W.J.; Chang, S.W.; Chaudhary, D.K.; Shin, J.; Kim, H.; Karmegam, N.; Govarthanan, M.; Chandrasekaran, M.; Ravindran, B. Effect of biochar amendment on compost quality, gaseous emissions and pathogen reduction during in-vessel composting of chicken manure. Chemosphere 2021, 283, 131129. [Google Scholar] [CrossRef] [PubMed]
  16. Wang, Z.; Tan, X.; Lu, G.; Liu, Y.; Naidu, R.; He, W. Soil properties influence kinetics of soil acid phosphatase in response to arsenic toxicity. Ecotoxicol. Environ. Saf. 2018, 147, 266–274. [Google Scholar] [CrossRef] [PubMed]
  17. Liu, Y.; Fan, X.; Zhang, T.; He, W.; Song, F. Effects of the long-term application of atrazine on soil enzyme activity and bacterial community structure in farmlands in china. Environ. Pollut. 2020, 262, 24. [Google Scholar] [CrossRef] [PubMed]
  18. Sengupta, I.; Dhal, P.K. Impact of elevated phosphogypsum on soil fertility and its aerobic biotransformation through indigenous microorganisms (imo’s) based technology. J. Environ. Manag. 2021, 297, 16. [Google Scholar] [CrossRef] [PubMed]
  19. Kafle, G.K.; Chen, L. Comparison on batch anaerobic digestion of five different livestock manures and prediction of biochemical methane potential (bmp) using different statistical models. Waste Manag. 2016, 48, 492–502. [Google Scholar] [CrossRef]
  20. Darby, B.; Goodale, C.; Chin, N.; Fuss, C.; Lang, A.; Ollinger, S.; Lovett, G. Depth patterns and connections between gross nitrogen cycling and soil exoenzyme activities in three northern hardwood forests. Soil. Biol. Biochem. 2020, 147, 107836. [Google Scholar] [CrossRef]
  21. Li, F.; Yu, H.; Li, Y.; Wang, Y.; Shen Resource, J.; Hu, D.; Feng, B.; Han, Y. The quality of compost was improved by low concentrations of fulvic acid owing to its optimization of the exceptional microbial structure. Bioresour. Technol. 2021, 342, 25. [Google Scholar] [CrossRef] [PubMed]
  22. Tyagi, S.; Shumayla; Verma, P.C.; Singh, K.; Upadhyay, S.K. Molecular characterization of ascorbate peroxidase (apx) and apx-related (apx-r) genes in Triticum aestivum L. Genomics 2020, 112, 4208–4223. [Google Scholar] [CrossRef] [PubMed]
  23. Zhu, Z.K.; Ge, T.; Liu, S.L.; Hu, Y.J.; Ye, R.Z.; Xiao, M.L.; Tong, C.L.; Kuzyakov, Y.; Wu, J.S. Rice rhizodeposits affect organic matter priming in paddy soil: The role of n fertilization and plant growth for enzyme activities, CO2 and CH4 emissions. Soil. Biol. Biochem. 2018, 116, 369–377. [Google Scholar] [CrossRef]
  24. Novair, S.B.; Hosseini, H.M.; Etesami, H.; Razavipour, T. Rice straw and composted azolla alter carbon and nitrogen mineralization and microbial activity of a paddy soil under drying-rewetting cycles. Appl. Soil. Ecol. 2020, 154, 103638. [Google Scholar] [CrossRef]
  25. Yu, M.; Zhang, X.; Ma, X. Yield and quality responses of sunflowers to soil CO2 leakage from ccs projects. Int. J. Environ. Sci. Technol. 2022, 19, 6721–6728. [Google Scholar] [CrossRef]
  26. Zhou, G.; Xu, X.; Qiu, X.; Zhang, J. Biochar influences the succession of microbial communities and the metabolic functions during rice straw composting with pig manure. Bioresour. Technol. 2019, 272, 10–18. [Google Scholar] [CrossRef] [PubMed]
  27. Zhang, J.; Chen, G.; Sun, H.; Zhou, S.; Zou, G. Straw biochar hastens organic matter degradation and produces nutrient-rich compost. Bioresour. Technol. 2016, 200, 876–883. [Google Scholar] [CrossRef] [PubMed]
  28. Li, F.; Chen, L.; Zhang, J.; Yin, J.; Huang, S. Bacterial community structure after long-term organic and inorganic fertilization reveals important associations between soil nutrients and specific taxa involved in nutrient transformations. Front. Microbiol. 2017, 8, 238853. [Google Scholar] [CrossRef] [PubMed]
  29. Hou, Q.; Ning, Y.M.; Huang, S. Effects of manure substitution for chemical fertilizerson rice yield and soil labile nitrogen in paddy fields of china: A meta-analysis. Pedosphere 2022, 12, 87–99. [Google Scholar]
  30. Badiane, A.; Faye, B.; Sambou, A.; Ba, I.; Diop, K.; Diallo, M.; Gueye, S.; Bamba, B.; Fall, S. Cultural mode and organo-mineral amendment effect on growth and yield of rice (Oryza sativa L.) and soil chemical properties in sulfated acid soils of basse-casamance. Heliyon 2023, 9, e18830. [Google Scholar] [CrossRef] [PubMed]
  31. Svensson, T.; Redon, P.; Thiry, Y.; Montelius, M.; Bastviken, D. Chlorination of soil organic matter: The role of humus type and land use. Sci. Total Environ. 2022, 806, 150478. [Google Scholar] [CrossRef]
  32. Li, Y.; Ma, J.; Yong, X.; Luo, L.; Wong, J.W.C.; Zhang, Y.; Wu, H.; Zhou, J. Effect of biochar combined with a biotrickling filter on deodorization, nitrogen retention, and microbial community succession during chicken manure composting. Bioresour. Technol. 2022, 343, 13. [Google Scholar] [CrossRef]
  33. Yang, Y.; Awasthi, M.K.; Bao, H.; Bie, J.; Lei, S.; Lv, J. Exploring the microbial mechanisms of organic matter transformation during pig manure composting amended with bean dregs and biochar. Bioresour. Technol. 2020, 313, 6. [Google Scholar] [CrossRef] [PubMed]
  34. Awasthi, M.K.; Wang, Q.; Chen, H.; Wang, M.; Ren, X.; Zhao, J.; Li, J.; Guo, D.; Li, D.S.; Awasthi, S.K.; et al. Evaluation of biochar amended biosolids co-composting to improve the nutrient transformation and its correlation as a function for the production of nutrient-rich compost. Bioresour. Technol. 2017, 237, 156–166. [Google Scholar] [CrossRef] [PubMed]
  35. Taha, M.; Foda, M.; Shahsavari, E.; Aburto-Medina, A.; Adetutu, E.; Ball, A. Commercial feasibility of lignocellulose biodegradation: Possibilities and challenges. Curr. Opin. Biotechnol. 2016, 38, 190–197. [Google Scholar] [CrossRef] [PubMed]
  36. Chen, L.; Fang, K.; Zhou, J.; Yang, Z.P.; Dong, X.F.; Dai, G.H.; Zhang, H.B. Enrichment of soil rare bacteria in root by an invasive plant ageratina adenophora. Sci. Total Environ. 2019, 683, 202–209. [Google Scholar] [CrossRef] [PubMed]
  37. Li, Y.H.; Wang, R.; Sui, X.H.; Wang, E.T.; Zhang, X.X.; Tian, C.F.; Chen, W.F.; Chen, W.X. Bradyrhizobium nanningense sp. Nov., bradyrhizobium guangzhouense sp. Nov. And bradyrhizobium zhanjiangense sp. Nov., isolated from effective nodules of peanut in southeast china. Syst. Appl. Microbiol. 2019, 42, 19. [Google Scholar] [CrossRef]
  38. Wu, J.; Zhao, Y.; Qi, H.; Zhao, X.; Yang, T.; Du, Y.; Zhang, H.; Wei, Z. Identifying the key factors that affect the formation of humic substance during different materials composting. Bioresour. Technol. 2017, 244, 1193–1196. [Google Scholar] [CrossRef] [PubMed]
  39. Hwang, O.; Lee, S.R.; Cho, S.; Ro, K.S.; Spiehs, M.; Woodbury, B.; Silva, P.J.; Han, D.W.; Choi, H.; Kim, K.Y. Efficacy of different biochars in removing odorous volatile organic compounds (vocs) emitted from swine manure. ACS Sustain. Chem. Eng. 2018, 6, 14239–14247. [Google Scholar] [CrossRef]
  40. Zhang, X.; Gao, B.; Creamer, A.E.; Cao, C.; Li, Y. Adsorption of vocs onto engineered carbon materials: A review. J. Hazard. Mater. 2017, 338, 102–123. [Google Scholar] [CrossRef] [PubMed]
  41. Czekała, W.; Malińska, K.; Cáceres, R.; Janczak, D.; Dach, J.; Lewicki, A. Co-composting of poultry manure mixtures amended with biochar-the effect of biochar on temperature and C-CO2 emission. Bioresour. Technol. 2016, 200, 921–927. [Google Scholar] [CrossRef] [PubMed]
  42. Qiu, M.; Liu, L.; Ling, Q.; Cai, Y.; Yu, S.; Wang, S.; Fu, D.; Hu, B.; Wang, X. Biochar for the removal of contaminants from soil and water: A review. Biochar 2022, 4, 19. [Google Scholar] [CrossRef]
Figure 1. Effect of biochar composting products on the bacterial community profiles of the soil. (A) Specific and shared OTUs in different treatments; (B) relative abundance of bacteria at phylum level; (C) nonmetric multidimensional scaling (NMDS) ordination plots of bacterial community composition in different treatments based on the Bray–Curtis distance similarity. The bacterial phyla representing < 0.5% of the total bacterial sequences and not identified at the phylum level were all assigned to “Others”. Ellipses in the plots denote 95% confidence intervals for the centroids of different treatments. Bray–Curtis distance similarity considers the measurement method of sample abundance. CK, control, compost without biochar; T1, 1% biochar composting product (BCP) treatment; T2, 3% BCP treatment; T3, 5% BCP treatment; T4, 7% BCP treatment.
Agronomy 14 00886 g001
Figure 2. Effect of biochar composting products on soil microbiota diversity. (AC) Alpha diversity analysis; (D) beta diversity analysis. Alpha diversity explanation: the larger chao1 index is associated with higher species richness. The larger shannon index is associated with higher community diversity, and it also reflects the uniformity of community distribution. Beta diversity description: the same color is the same group. CK, control, compost without biochar; T1, 1% biochar composting product (BCP) treatment; T2, 3% BCP treatment; T3, 5% BCP treatment; T4, 7% BCP treatment. The “*” means p < 0.05, the “**” means p < 0.01, and the “***” means p < 0.001.
Agronomy 14 00886 g002
Figure 3. Effect of biochar composting products on bacterial relative abundance at genus level of soil microbiota. (A) Heatmap at the genus level; (B) relative abundance of top 15 dominant bacterial genera in different treatments; (C) LDA scores of rhizosphere soils in different treatments; (D) ANOVA analysis based on genus level in different treatments. Heatmap results are indicated by different colors. Red indicates a high relative abundance of species, while blue indicates a low relative abundance of species. CK, control, compost without biochar; T1, 1% biochar composting product (BCP) treatment; T2, 3% BCP treatment; T3, 5% BCP treatment; T4, 7% BCP treatment. Different letters indicate statistically significant differences (n = 5, p < 0.05). The “**” means p < 0.01, and the “***” means p < 0.001.
Agronomy 14 00886 g003
Figure 4. Effect of biochar composting products on soil bacterial metabolic function. (A) Relative abundance of six function categories; (B) NMDS ordination plots of soil bacterial function composition in BCP treatments based on the Bray–Curtis distance similarity; (C) relative abundance of the top 30 functional gene families; (D) redundancy analysis (RDA) revealing relationship of selected physicochemical properties and metabolic function of bacterial communities. KEGG results were predicted at level-1 according to Kruskal–Wallis algorithm. Gene families are colored by functional categories. CK, control, compost without biochar; T1, 1% biochar composting product (BCP) treatment; T2, 3% BCP treatment; T3, 5% BCP treatment; T4, 7% BCP treatment. Different letters indicate statistically significant differences (n = 5, p < 0.05).
Agronomy 14 00886 g004
Table 1. Effect of BCPs on production quality of Chinese cabbage.
TreatmentFresh Weight (g)Plant Height (cm)Maximum Leaf Width (cm)Maximum Leaf Length/cmSoluble Sugar Content (%)Nitrate Content (mg·kg−1)Vitamin C Content (mg·kg−1)
CK36.45 ± 0.22 a19.57 ± 0.11 a4.40 ± 0.02 a8.26 ± 0.03 a11.15 ± 0.26 a583.25 ± 12.7 a164.18 ± 9.67 a
T149.77 ± 0.28 b24.83 ± 0.04 b4.62 ± 0.06 e8.60 ± 0.06 e13.24 ± 0.19 b543.49 ± 22.6 b255.31 ± 7.91 b
T251.90 ± 0.38 b30.50 ± 0.17 c5.04 ± 0.13 e8.92 ± 0.08 e15.47 ± 0.6 c525.79 ± 20.3 b289.89 ± 10.44 c
T345.67 ± 0.11 bc29.23 ± 0.06 c4.89 ± 0.06 e8.83 ± 0.01 e15.37 ± 0.32 c520.86 ± 14.58 bc282.15 ± 13.81 c
T443.33 ± 0.09 bc26.67 ± 0.06 bc4.75 ± 0.05 e8.63 ± 0.02 e14.88 ± 0.14 bc517.98 ± 18.74 c281.25 ± 20.49 c
CK: control; T1–T4: 1%, 3%, 5% and 7% BCP treatment, respectively; BCPs: biochar composting products. Different lowercase letters represent significant differences at the level of p < 0.05.
Table 2. Effects of BCP treatment on fertility-related properties of soil.
TreatmentEC (ms/cm)pHAN (mg·kg−1)AP (mg·kg−1)AK (mg·kg−1)SOM (g·kg−1)
CK1.08 ± 0.18 a5.76 ± 0.03 a82.21 ± 8.07 a30.25 ± 0.09 a143.67 ± 12.1 a25.35 ± 3.71 a
T11.29 ± 0.23 a5.91 ± 0.02 a87.25 ± 10.13 b41.05 ± 1.22 b167.34 ± 13.21 b30.22 ± 5.44 b
T21.24 ± 0.11 a6.16 ± 0.02 b93.11 ± 0.03 c47.23 ± 3.09 c189.25 ± 18.46 b33.13 ± 6.08 b
T31.35 ± 0.19 a6.34 ± 0.02 b97.31 ± 0.03 c51.17 ± 6.14 c221.98 ± 9.33 c36.56 ± 7.12 c
T41.52 ± 0.27 a6.21 ± 0.04 b94.89 ± 0.03 c49.54 ± 4.38 c202.69 ± 10.47 c38.21 ± 3.18 c
CK: control; T1–T4: 1%, 3%, 5% and 7% BCP treatment, respectively; BCPs: biochar composting products; AN: available nitrogen; AP: available phosphorus; AK: available potassium; SOM: soil organic matter. Different lowercase letters represent significant differences at the level of p < 0.05.
Table 3. Effects of BCP treatment on soil enzyme activity.
TreatmentPhosphatase (mg/g·24 h)Catalase (µmol/g·24 h)Urease (mg/g·24 h)
CK5.67 ± 1.04 a60.32 ± 7.01 a36.25 ± 8.43 a
T18.13 ± 0.68 b73.76 ± 4.74 b54.63 ± 6.98 b
T28.89 ± 1.32 b89.36 ± 9.65 b58.52 ± 9.14 b
T310.24 ± 1.18 bc85.24 ± 8.12 b62.27 ± 11.09 bc
T49.35 ± 0.77 b82.22 ± 4.96 b59.86 ± 7.62 b
CK: control; T1–T4: 1%, 3%, 5% and 7% BCP treatment, respectively; BCPs: biochar composting products. Different lowercase letters represent significant differences at the level of p < 0.05.
Disclaimer/Publisher’s Note: The statements, opinions and data contained in all publications are solely those of the individual author(s) and contributor(s) and not of MDPI and/or the editor(s). MDPI and/or the editor(s) disclaim responsibility for any injury to people or property resulting from any ideas, methods, instructions or products referred to in the content.

