
Identification of Some Gem-Quality Red and Green Feldspars

1
School of Jewelry, West Yunnan University of Applied Sciences, Tengchong 679100, China
2
College of Natural Resources and Geographic Information, Hubei Land Resources Vocational College, Wuhan 430090, China
*
Author to whom correspondence should be addressed.
Crystals 2024, 14(5), 409; https://0-doi-org.brum.beds.ac.uk/10.3390/cryst14050409
Submission received: 8 April 2024
/
Revised: 20 April 2024
/
Accepted: 22 April 2024
/
Published: 27 April 2024
(This article belongs to the Special Issue Gems Decoded: Bridging Gemology, Mineralogy, Crystallography and Geology)
Abstract
:Sunstone is a member of the feldspar group. Natural sunstones from Oregon exhibit unique optical effects and hold significant market value. However, since 2008, there has been a persistent issue of diffused red feldspars masquerading as natural sunstones in the market, severely undermining consumer confidence in purchasing natural sunstones. Fluorescence characteristics under 305–335 nm ultraviolet excitation are considered an effective method for distinguishing copper-diffused red feldspars from natural sunstones. In this paper, through detailed analysis and testing of ten market-acquired red and green feldspar samples, including UV-vis spectra, microscopic characteristics, fluorescence spectra, and chemical compositions, we validate the efficacy of fluorescence characteristics in identifying copper-diffused feldspars. The results verify the widespread prevalence of copper diffusion treatment in market-acquired red and green feldspars, shedding light on their treatment history and providing valuable insights for jewelry consumers. This research not only enhances our understanding of sunstone treatments but also strengthens the reliability and applicability of fluorescence spectroscopy in gemstone identification, offering promising prospects for its broader adoption in the jewelry market.
1. Introduction
Sunstone is a member of the feldspar group. Both the orthoclase and the plagioclase feldspar species boast a sunstone variety. Other feldspar group gems include moonstone, non-phenomenal orthoclase, phenomenal and non-phenomenal labradorite, and amazonite. Sunstone exhibits a striking combination of golden and red metallic luster when exposed to light due to the presence of sheet metal inclusions, which are recognized as hematite (Fe2O3). However, a unique variant of sunstone ([NaAlSi3O8]30–50[CaAl2Si2O8]50–70) exists, distinguished by its ability to not only demonstrate the typical effects observed in daylight but also to simultaneously present body color reminiscent of ruby and emerald. This exceptional characteristic, coupled with its rarity and aesthetic appeal, contributes to the elevated market valuation of natural sunstones. Notably, gemologists have substantiated the origins of this particular sunstone variety in Oregon, United States, and the Afar region of Ethiopia through empirical evidence [1,2,3,4]. The coloring mechanism underlying the distinct appearance of natural sunstone has been attributed to the existence of copper nanoparticles within its structure. Wang et al. employed advanced FIB-TEM techniques to directly visualize and analyze the microscopic morphology of these copper nanoparticles within natural sunstone specimens [5].
Due to the substantial market potential and elevated value associated with natural sunstones, a kind of red and green andesine ([NaAlSi3O8]50–70[CaAl2Si2O8]30–50) or labradorite ([NaAlSi3O8]30–50[CaAl2Si2O8]50–70) feldspar, artificially diffused, emerged prominently at the beginning of this century during the jewelry exhibition all over the world [6,7,8,9,10,11,12,13]. Based on our previous research, it has indeed been found that nearly colorless labradorite or andesine can be treated to achieve a red hue through high-temperature copper diffusion [14,15]. The diameter of copper nanoparticles in copper-diffused red labradorite is 46.0 ± 5.9 nm. The coloring mechanism of copper-diffused labradorite is the same as that of the natural sunstones. Concurrently, we have proposed an efficient and reliable method to distinguish between natural sunstones and copper-diffused red andesine/labradorite feldspars [16].
Recently, through surveys conducted by the authors at various domestic jewelry exhibitions, it has been found that there are mainly two types of red and green feldspars available in the market. One type is sold by merchants as “irradiation-colored sunstones” at a very cheap price, ranging from USD 10–30 per carat. The other type, claimed by merchants as “natural sunstones”, commands a higher price, with small-grained gemstones priced at USD 140–300 per carat. There are certain visual differences between the two types of red and green feldspars. “Irradiation-colored sunstones” primarily exhibit a red color, which is intense and uniform but with slightly lower transparency. The claimed “natural sunstones” come in red, red–green bicolored, and green colors, with lighter hues and higher transparency. In this paper, we systematically analyze the gemological and spectroscopic characteristics of these two types of red and green feldspars and apply our proposed fluorescence identification method to these samples. This research not only serves to reaffirm the effectiveness of the fluorescence identification method but also provides detailed information about red and green feldspars available in the market, offering valuable reference for jewelry consumers when purchasing sunstones.
2. Materials and Methods
2.1. Materials
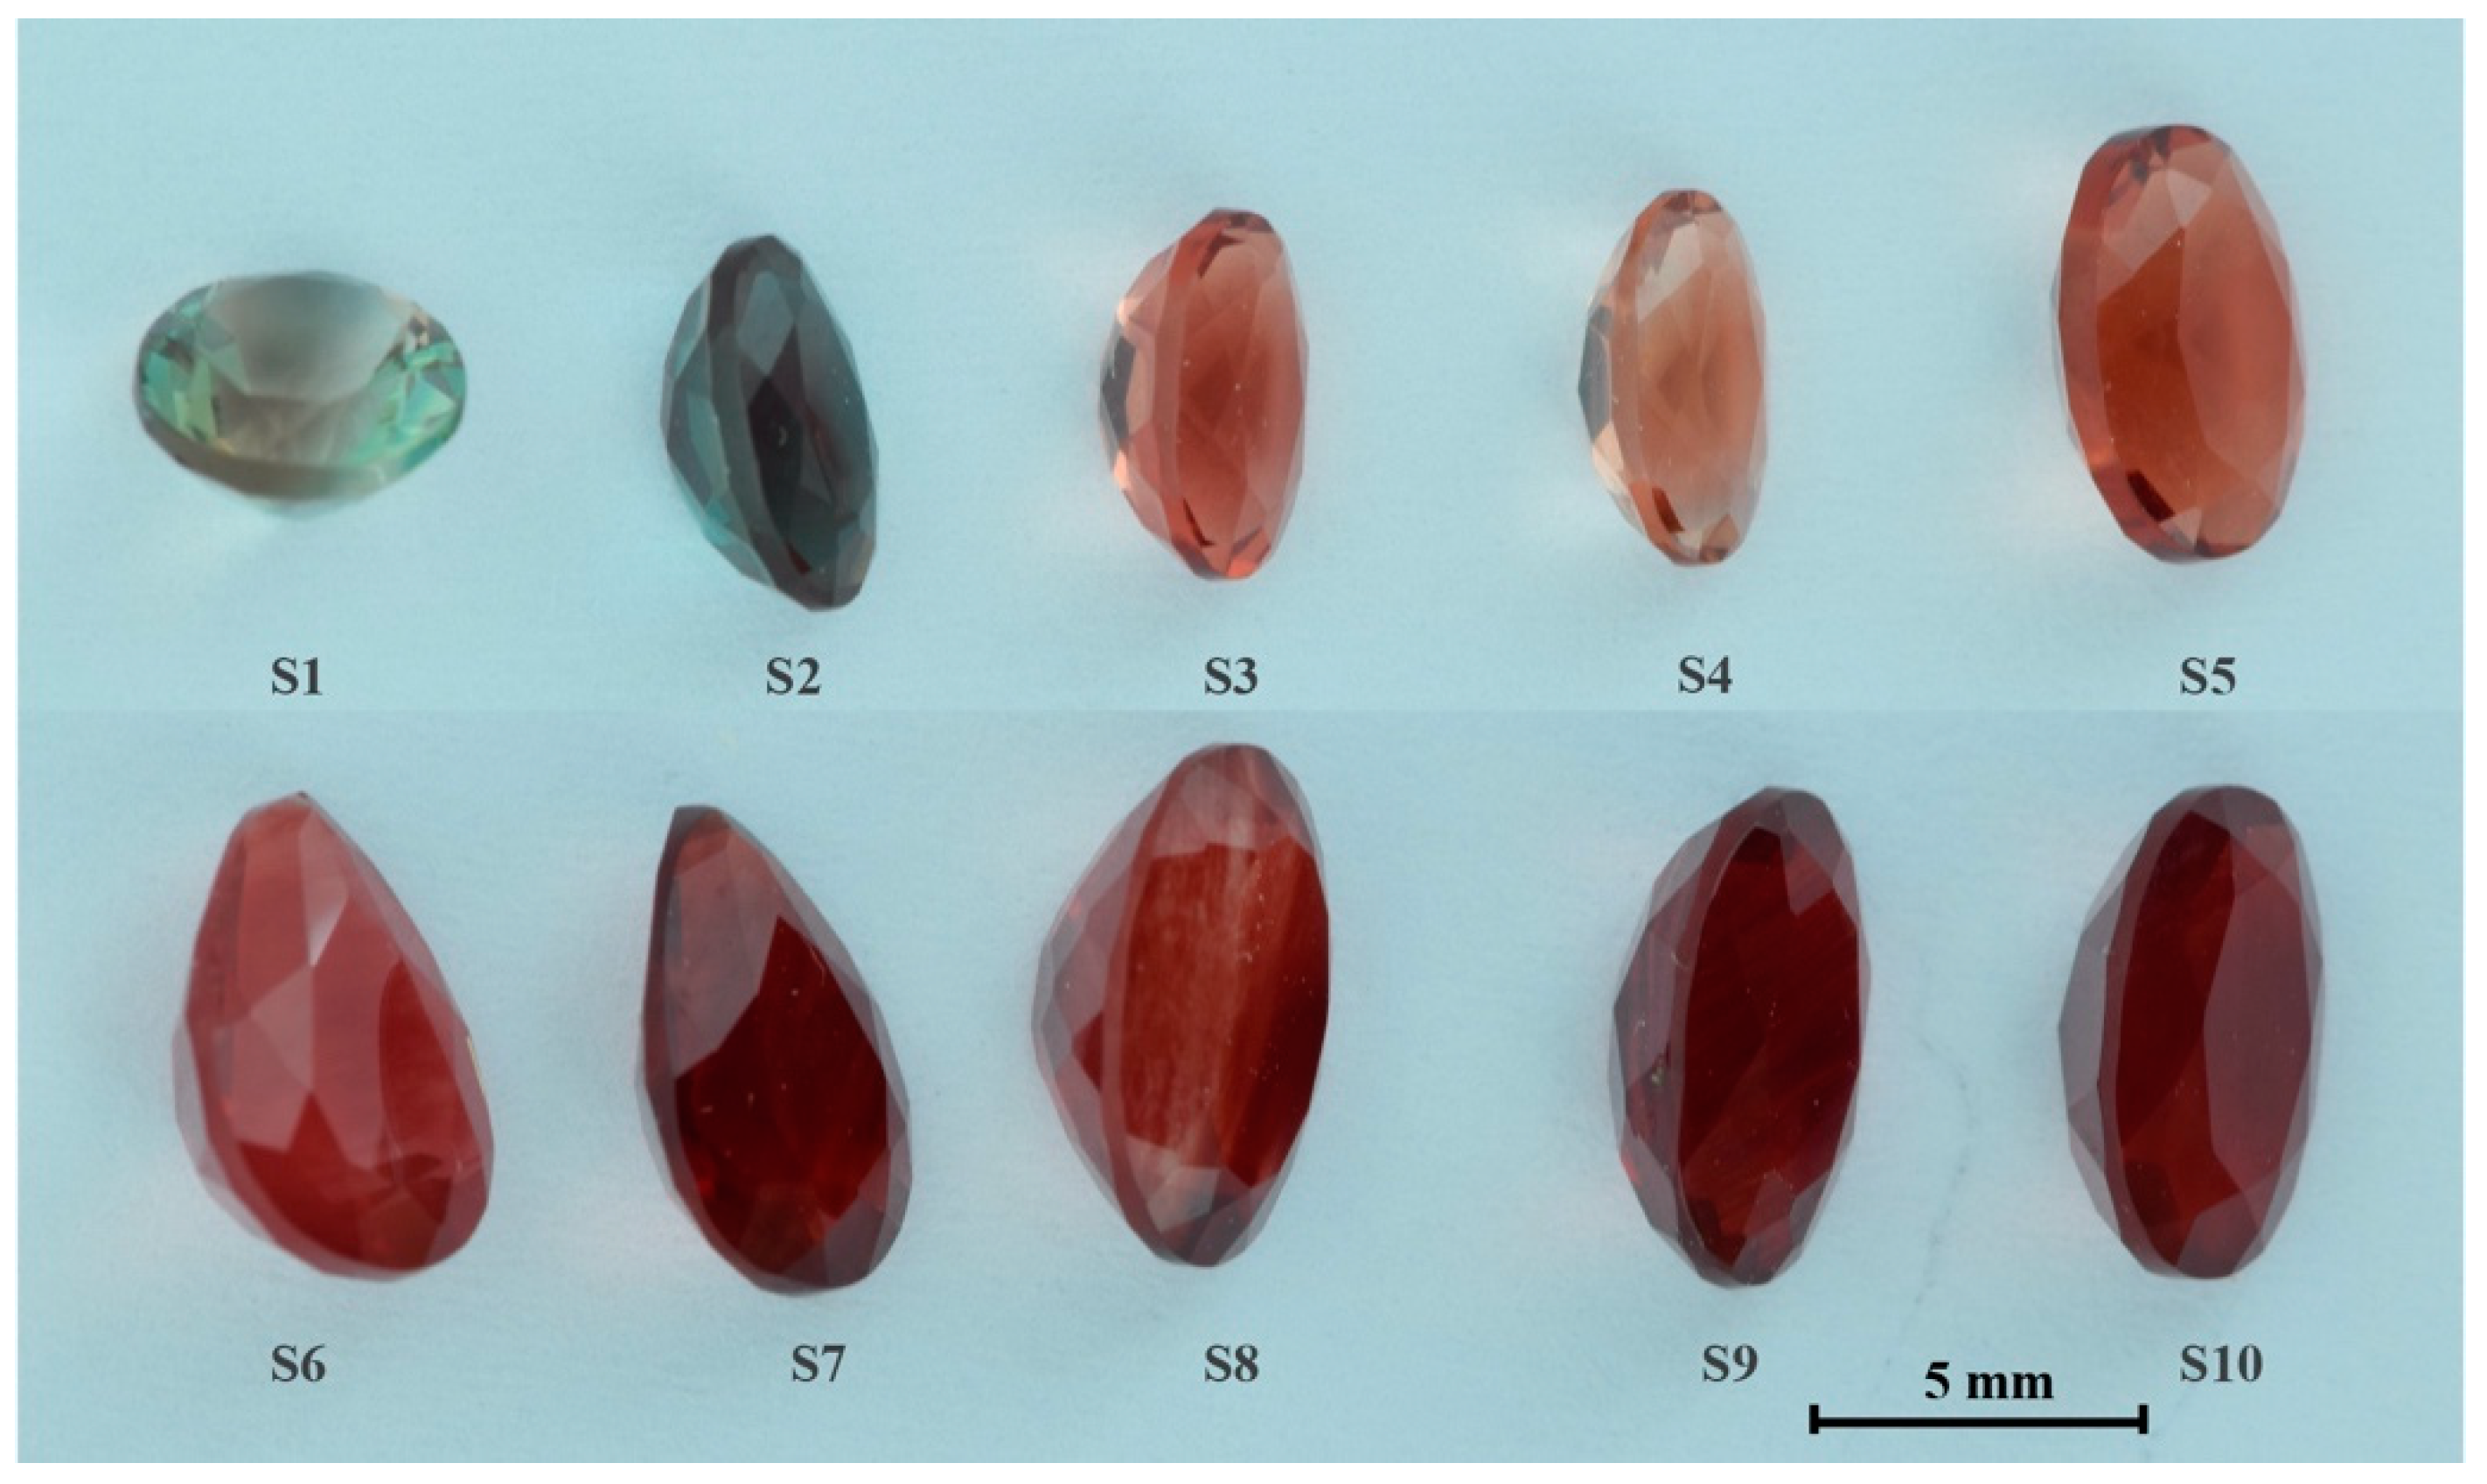
For this study, ten faceted red and green feldspars were bought from the China Kunming International Stone Expo & Yunnan International Jewelry and Jade Expo (Figure 1). The samples, their weight, exact color, pleochroism, RI, LW/SW-UV reaction, shape, and cut are presented in Table 1. The samples S1, S2, S3, S4, S5 were bought from a Hong Kong retailer, while the other five samples were bought from a distributor.
2.2. Methods
Images of all the samples were captured in a light box (D55 light source and 320 nm UV light source) under identical conditions to compare color changes. Microscopic observations were performed with a Leica M205A ((LAS X, Leica Microsystems AG, Wetzlar, Germany). Ultraviolet-visible (UV-vis) absorption spectra from 300 to 900 nm were characterized using a Gem 3000 spectrometer (Biaoqi Specsuite, Guangzhou Biaoqi Optoelectronics Technology Development Co., Ltd., China). Fluorescence spectra were analyzed using a FP8500 fluorescence spectrometer (Jasco, Tokyo, Japan). Three-dimensional fluorescence spectra were acquired at a scanning speed of 2000 nm/min. Excitation wavelengths ranged from 200 to 500 nm, with a step size of 5 nm and an excitation bandwidth of 5 nm. Emission spectra were collected starting 10 nm longer than the excitation wavelength and extending up to 750 nm, with a bandwidth of 2.5 nm and a data interval of 1 nm. The photomultiplier tube (PMT) voltage was maintained at 600 V for all samples to ensure comparability of fluorescence intensity measurements. Two-dimensional emission spectra (340–750 nm) were recorded with an excitation wavelength of 320 nm, using a response time of 0.5 s and a scanning speed of 1000 nm/min. The samples were scratched into micro-sized particles using a knife and then dispersed onto a holey carbon-coated molybdenum grid. This grid was subsequently loaded onto an FEI double-tilt holder. Scanning Transmission Electron Microscope High-Angle Annular Dark Field (STEM-HAADF) images were acquired using a Themis-Z microscope (Thermo Fisher Scientific, Waltham, MA, USA, former FEI Co) operating at an accelerating voltage of 300 kV. The microscope was equipped with a Oneview IS camera (Gatan Inc., Pleasanton, CA, USA) and a STEM-HAADF detector. Major and trace element analyses were conducted by Laser Ablation Inductively Coupled Plasma Mass Spectrometry (LA-ICP-MS) at the State Key Laboratory of Geological Processes and Mineral Resources, China University of Geosciences, Wuhan. Detailed operating conditions for the laser ablation system and the ICP-MS instrument and data reduction are the same as described by Liu et al. [17]. Relative standard deviation (RSD) is generally <5% for elements with concentrations >0.1 wt %. All data were obtained from the sample using single-spot ablation mode with a spot size of 44 μm. Each analysis consisted of acquiring a background signal for approximately 20–30 s (gas blank), followed by 50 s of data acquisition from the sample. The Agilent 7500 Chemstation software was employed for the acquisition of each individual analysis. Elemental contents were calibrated against various reference materials (BCR-2G, BIR-1G, and BHVO-2G) without the application of internal standardization.
3. Results and Discussion
3.1. UV-Vis Spectra and Coloring Mechanism
UV-vis spectroscopy is a useful tool for gem identification. It allows for the identification of characteristic absorption bands specific to different gemstone species. These absorption bands arise due to the presence of certain chromophores or trace elements within the gemstone, providing valuable information for identification. In fact, natural Cu-bearing sunstones are characterized by one strong absorption band at 560–590 nm due to the localized surface plasmon resonance (LSPR) of copper nanoparticles [5]. LSPR of copper nanoparticles refers to the collective oscillation of conduction electrons on the surface of copper nanoparticles when excited by an external electromagnetic field [18]. This phenomenon occurs due to the confinement of electrons within the nanoparticle, leading to resonant oscillations at specific wavelengths of incident light. Copper nanoparticles exhibit LSPR behavior because of their unique optical and electronic properties, which are heavily influenced by their size, shape, and surrounding environment. When the incident light interacts with copper nanoparticles, the electromagnetic field induces coherent oscillations of free electrons at the nanoparticle surface, resulting in a strong absorption and scattering of light at a characteristic resonance frequency. Figure 2 shows the UV-vis spectra for all the market-acquired red and green feldspars studied in this paper, where for two samples (S1 and S2), a strong absorption peak around 590 nm is observed and for three samples (S2, S3 and S4), a strong absorption peak around 565 nm is observed. It is noteworthy that the absorption peaks observed in samples S6–S10 exhibit variations compared to those observed in samples S1–S5. The variation in absorption peaks among different samples is attributed to the different size and morphology of copper nanoparticles within the crystals. As the size of copper nanoparticles increases, the wavelength of the absorption peak induced by LSPR undergoes a redshift [19].
It can be observed from Figure 1 that under D55 illumination, samples S1 and S2 appear green against a white background. Specifically, sample S1 exhibits both red and green colors when viewed from certain angles, while sample S2 is perceived as dark red under intense illumination. Figure 3a–c are the HAADF images of the copper nanoparticles embedded in samples S1, S3 and S6, in which the signal intensity is proportional to the atomic numbers (I ≈ Z2, where Z is the atomic number and I is the signal intensity) [20]; therefore, the bright copper nanoparticles could be visualized. As shown in Figure 3a, the color changes (red/green) in samples S1 and S2 can be explained by the presence of ellipsoidal copper nanoparticles (139.4 × 53.5 nm) dispersed within the samples, which exhibit anisotropic light absorption. When the incident light is perpendicular to the short axis of the ellipsoidal copper nanoparticles within the sample, the incident light interacts with the spherical copper nanoparticles, resulting in LSPR absorption identical to those of spherical copper nanoparticles. Therefore, the sample is perceived as red. Conversely, when the incident light is perpendicular to the long axis of the ellipsoidal copper nanoparticles within the sample, the interaction between the incident light and the copper nanoparticles causes a redshift in the LSPR absorption peak. Thus, the sample is perceived as green. In addition to ellipsoidal copper nanoparticles, spherical copper nanoparticles are also present in this type of sample (see the lower-right corner of Figure 3a). Samples S2, S3, and S4 are perceived as orange-red with higher transparency due to the presence of spherical copper nanoparticles with smaller size. As shown in Figure 3b, the mean diameter of the spherical copper nanoparticles dispersed in these samples ranged from 25 to 41 nm. The decrease in the size of copper nanoparticles corresponds to a blue shift in the LSPR absorption peak, manifesting as a color change from red to orange-red. Samples S6 to S10 are perceived as red to dark red; the phenomena can be explained by the dispersion of larger spherical copper nanoparticles with a diameter of 125–195 nm (Figure 3c).
According to the in situ formation mechanism of copper nanoparticles in labradorite feldspar at high temperatures [14], the visual discrepancies among different copper-diffused red and green feldspars on the market are primarily determined by diffusion conditions such as temperature, duration, and chemical atmosphere. Elevated temperatures during copper diffusion treatment or excessive copper concentration in the diffusant can accelerate the growth rate of copper nanoparticles within the feldspar crystals. Under such conditions, the size of the resulting copper nanoparticles is large and non-uniformly distributed, while simultaneously, micrometer-sized inclusions may form, causing a decrease in the transparency of the crystals. Conversely, by controlling the temperature or the concentration of copper compositions in the diffusant within an appropriate range, the growth rate of copper nanoparticles within the feldspar crystals can be matched with the copper diffusion rate. Under these conditions, the size of resulting copper nanoparticles is smaller and more uniformly distributed, which also helps maintain the transparency and color uniformity of the copper-diffused feldspar.
3.2. Inclusion Characteristics
Inclusions are unique to each gemstone and act as natural fingerprints, providing valuable clues to identify the gem’s treatment or enhancement, such as heat treatment, fracture filling, or diffusion treatment. Figure 4 shows the typical inclusions observed in these market-acquired red and green feldspars. From the images, it can be observed that both sample S1 and S3 exhibit high purity, as internal inclusions are barely discernible under magnification. Sample S2 shows parallelly arranged red needle-like inclusions on the shallow surface. Sample S4 presents numerous dot-like inclusions, which aggregate into linear or flocculent formations. Measurements conducted with a microscope ruler reveal that the size of the dot-like inclusions is approximately 1.5–3 μm when magnified 160 times. Sample S5 also exhibits high purity, with only one long needle-like inclusion and a healing fissure observable upon magnification. Among these five samples, except for the slightly lower transparency of sample S2, samples S1, S3, S4, and S5 exhibit relatively high transparency, which is similar to the natural sunstones. Therefore, top lighting was employed to photograph the inclusions. However, samples from S6 to S10 demonstrate decreased transparency due to the presence of numerous dot-like inclusions distributed on the shallow surface, resulting in a hazy appearance. As depicted in Figure 4, under bottom lighting, the abundant dot-like inclusions distributed on the shallow surface are clearly visible, most of which are arranged in linear formations, while others form feather-like, flocculent, or clustered structures. Based on our previous research findings, such distributions of inclusions on the shallow surface, rather than in the gemstone’s deep center, are likely generated during copper diffusion treatment. Owing to the relatively slow diffusion rate of copper, the majority of copper particles were aggregated on the shallow surface [21]. In contrast, the aggregated copper particles within natural sunstones tend to distribute predominantly at the deep center of the gemstone [22]. Based on the inclusion characteristics observed in these samples, it is believed that some of the red and green feldspars available on the jewelry market exhibit similar inclusion features to those of natural sunstones, while others display significant differences. The presence of these typical inclusions on the shallow surface may serve as indicative characteristics for identifying copper-diffused red and green feldspars. However, relying solely on inclusions to identify whether these commercially available red and green feldspars have undergone copper diffusion treatment or not is deemed unreliable.
3.3. Fluorescence Characteristics
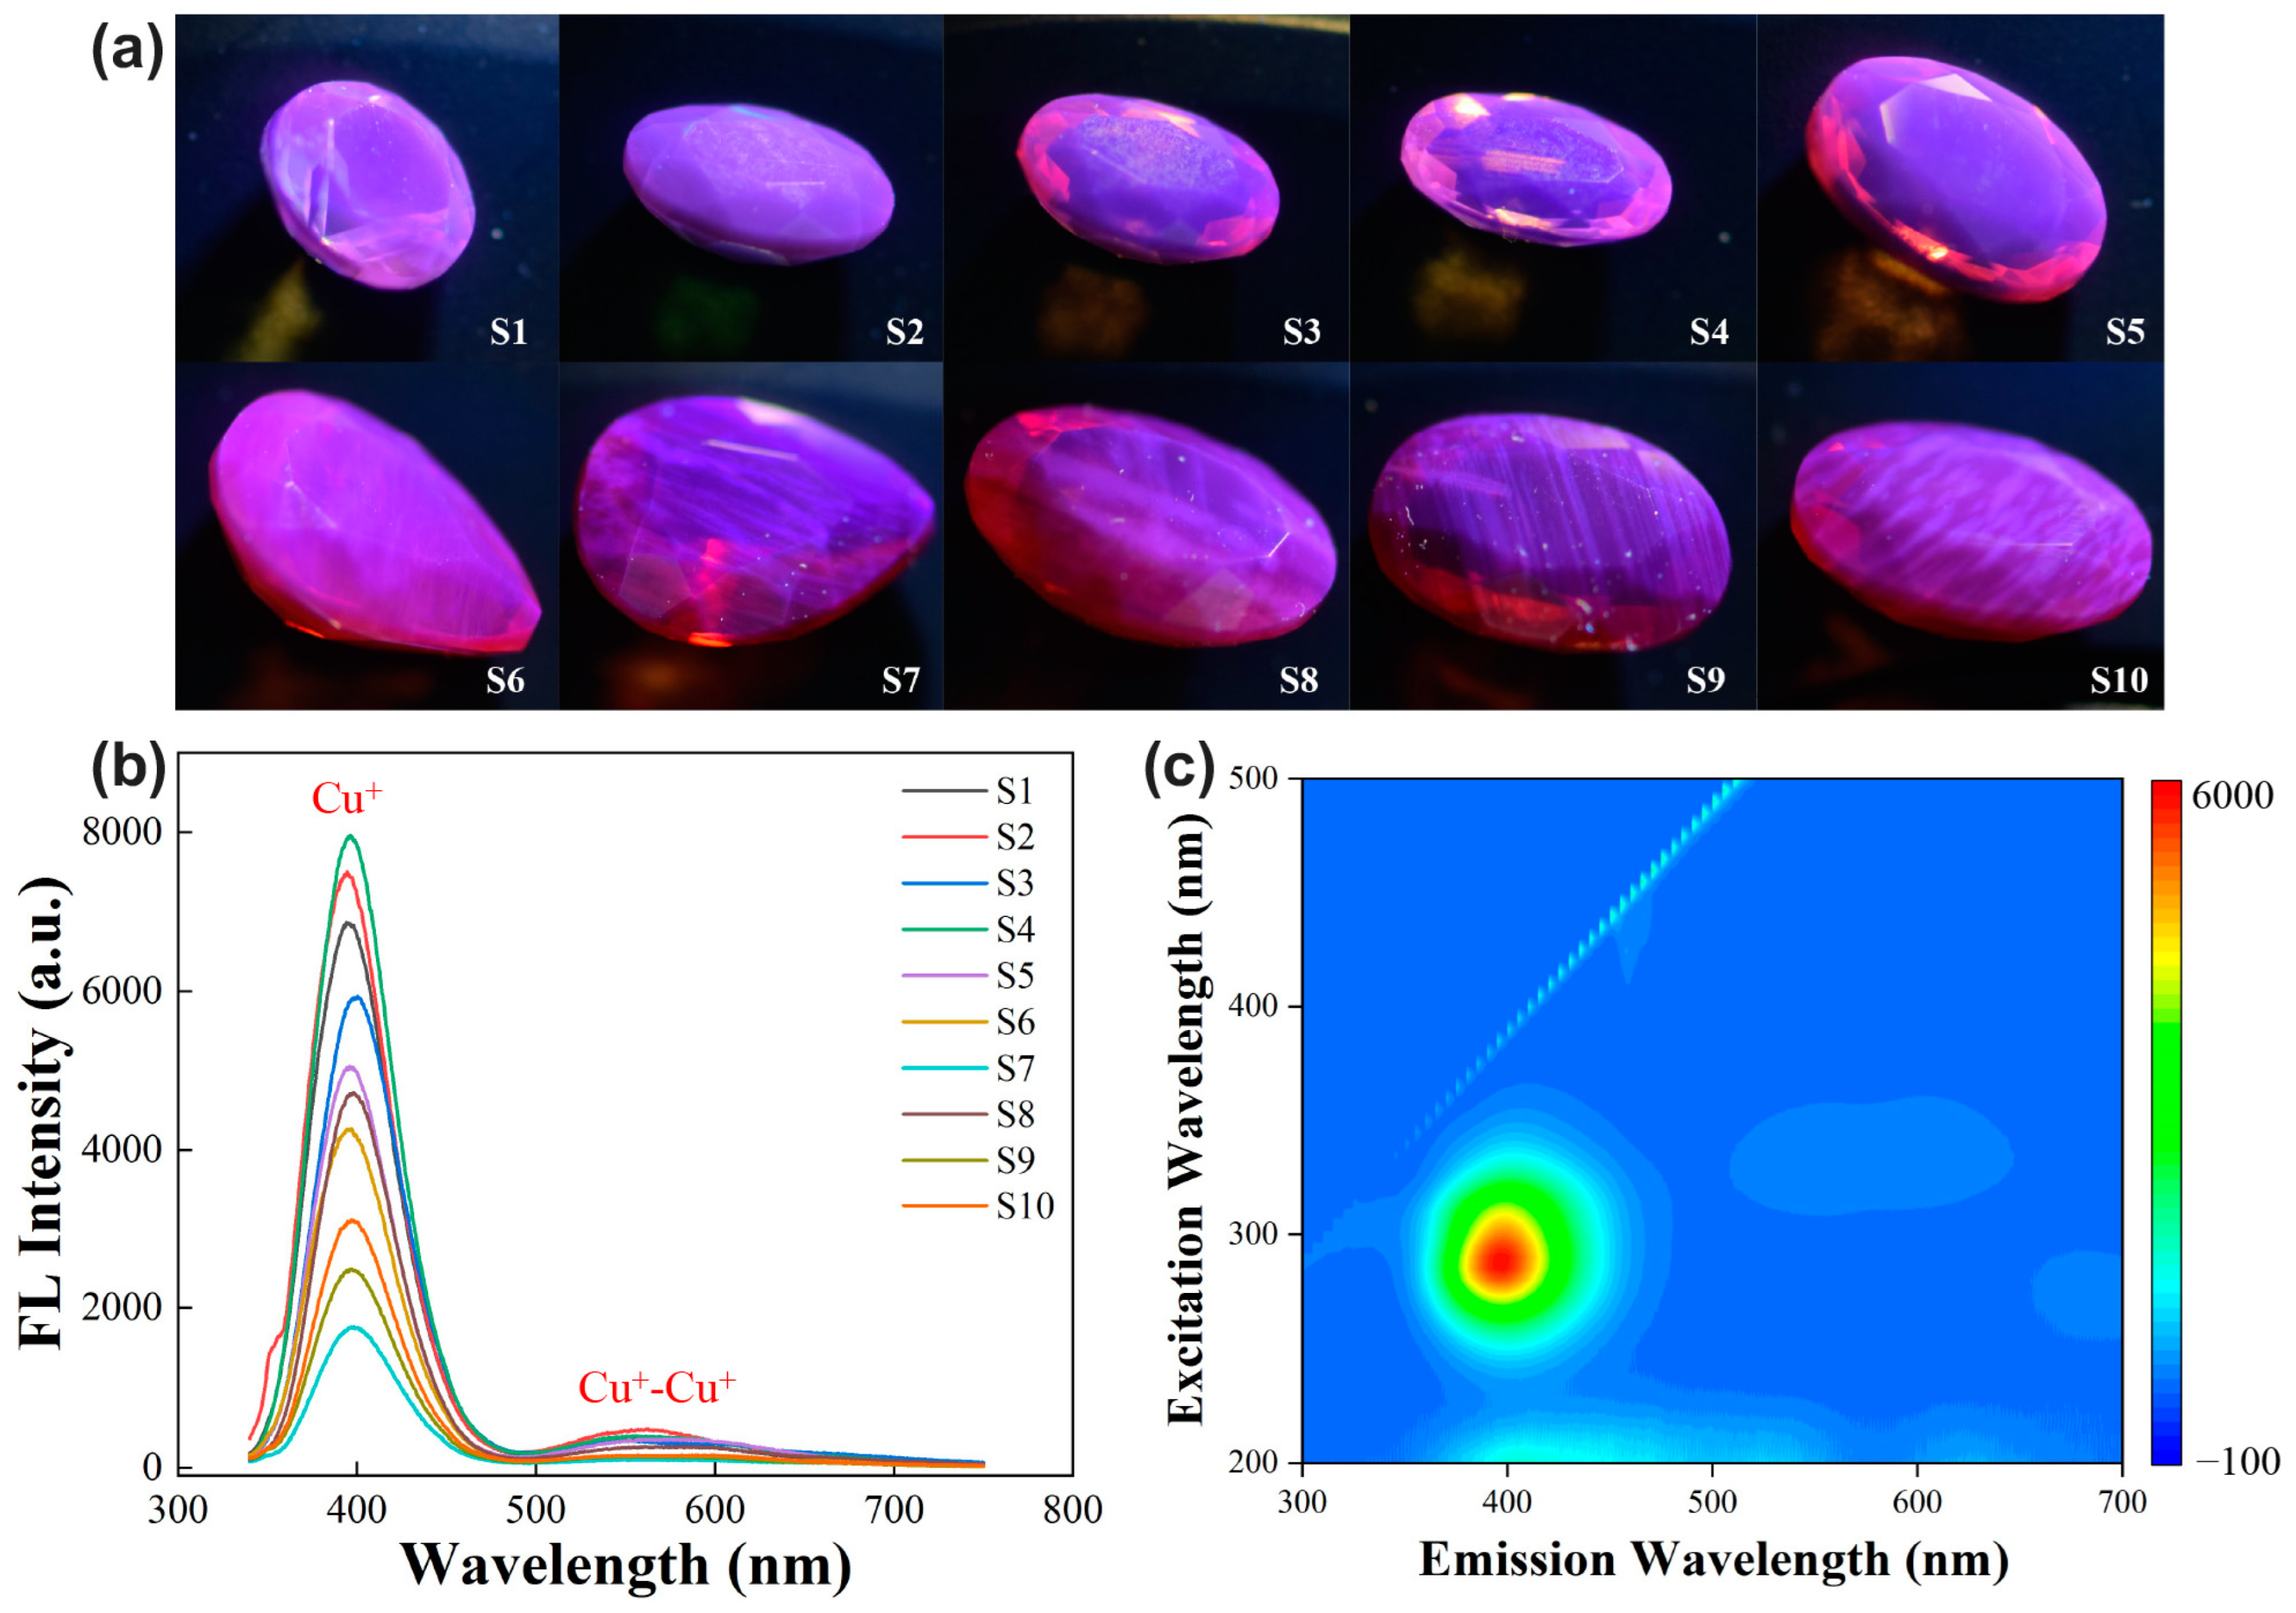
In our previous study, we systematically compared the fluorescence spectra of the labradorite and andesine feldspar before and after copper diffusion. The strong fluorescence (under 320 nm excitation) was verified as the key evidence of copper diffusion treatment. The strong fluorescence is attributed to residual Cu+ ions within the feldspar lattice resulting from copper diffusion treatment [14]. During the copper diffusion treatment of labradorite or andesine feldspar, elemental copper diffuses into the crystal lattice via Cu+–Na+ ion exchange. Once inside the crystal lattice, Cu+ ions capture electrons and are subsequently reduced to Cu0, which then aggregates to form copper nanoparticles. Throughout this process, a significant portion of the Cu+ ions may not be reduced to Cu0, thereby exhibiting strong fluorescence under 320 nm UV excitation. Therefore, we meticulously documented the fluorescence phenomena and fluorescence spectra of these ten samples under 320 nm UV light. As depicted in Figure 5a, all ten samples exhibit relatively strong purple fluorescence under 320 nm UV light irradiation. Samples S1 to S5 exhibit uniform fluorescence on the surface, whereas samples S6 to S10 exhibit uneven fluorescence with noticeable parallel striped patterns. These patterns could be associated with the copper diffusion treatment undergone by the samples, indicating the particular pathways of Cu+ ion diffusion within the feldspar.
As shown in Figure 5b, by employing the same fluorescence spectrometer and testing conditions, we obtained two-dimensional fluorescence spectra for the ten samples. From the spectra, it can be observed that the maximum fluorescence emission peaks of the samples are situated between 393.8 and 399.6 nm, with fluorescence intensities ranging from 1735 to 7930 cps. The main wavelength of the fluorescence emission peak in Figure 5b is consistent with the fluorescence color in Figure 5a. There are variations in the intensity of fluorescence emission peaks among different samples, with samples S1 to S5 generally exhibiting stronger fluorescence emission peaks compared to samples S6 to S10. This implies that samples S1 to S5 contain higher concentrations of residual Cu+ ions. Additionally, there exists a fluorescence emission peak between 500 and 650 nm due to Cu+–Cu+ dimers [23,24], characterized by a relatively broad half-peak width and low fluorescence intensity ranging from 100 to 500 cps. The presence of this fluorescence peak also reflects the higher concentration of Cu+ ions in the samples. Figure 5c illustrates the 3D fluorescence pattern of sample S3, and we found that the fluorescence emission consisted of three emission peaks at 399.6, 550, and 604 nm, with their corresponding optimal excitation wavelengths at 295, 335, and 335 nm. From the 3D fluorescence pattern of the sample, it is evident that under the excitation of commonly used LW or SW UV light (254 and 365 nm), the sample does not exhibit typical fluorescence phenomena. In gemstone identification, it is necessary to customize a UV light source with a wavelength between 295–335 nm to effectively excite the fluorescence of the sample for accurate identification.
Figure 6 presents a plot of fluorescence intensity vs. major peak wavelength of Cu+ using the spectral data in Figure 5b. Data points in this paper are represented by purple pentagrams. To facilitate better comparison, we also included data points corresponding to previously tested natural sunstones from Oregon and Ethiopia, copper-diffused andesine, and copper-diffused labradorite in the figure [16]. It can be seen from the figure that the corresponding coordinates of all the ten market-acquired red and green feldspars are distributed in the area of strong fluorescence. The data points of these market-acquired red and green feldspars intersect with the data points of previously copper-diffused labradorite and andesine feldspar. Therefore, based on the fluorescence data, we conclude that all the ten market-acquired red and green feldspars underwent copper diffusion treatment.
3.4. Chemical Compositions
To further validate the identification conclusions derived from fluorescence data (non-destructive testing method), we conducted additional LA-ICP-MS tests on the major and trace elements of these ten samples (Table 2). On the one hand, based on the obtained elemental compositions, we calculated the endmember compositions of albite, anorthite, and orthoclase in the ten samples [25]. The molar percentage of anorthite feldspar ranged from 46.08% to 50.03%, falling within the category of andesine and labradorite feldspar (Figure 7). Although most of the copper-diffused red or green feldspars available on the market are primarily composed of andesine feldspar, researchers and consumers need to be aware that there is also copper-diffused labradorite feldspar being sold in the market. Based on the mechanism of copper diffusion treatment, both labradorite and andesine belong to the plagioclase group. They can achieve color enhancement through nearly identical processes, with the only difference being that labradorite may require higher temperatures.
As demonstrated in Table 2, the copper concentration in the ten samples ranged from 448.05 to 788.37 ppmw, which is significantly higher than the copper concentration in natural sunstones (0.1–182.6 ppmw) [16]. For a significant period, the copper concentration in samples has been an effective criterion for distinguishing natural sunstones from copper-diffused red or green feldspar. Since LA-ICP-MS is a destructive and expensive testing method and not the preferred option in gemstone identification, the identification data systematically analyzed in this paper further validate the reliability and accuracy of using fluorescence spectroscopy to identify copper-diffused andesine or labradorite feldspar, making it applicable for broader use in the market. Additionally, fluorescence offers non-destructive and convenient testing advantages, allowing gemstone identification without altering or damaging the sample, thus preserving its integrity and value. This method’s broader applicability can significantly enhance gemstone authentication processes, ensuring consumers’ confidence in the authenticity and quality of their purchases.
4. Conclusions
Based on the comprehensive examination conducted in this study, we have thoroughly investigated the UV-vis absorption spectra, microscopic characteristics, fluorescence properties, and chemical compositions of ten market-acquired red and green feldspars. The color variations observed in the ten samples are attributed to absorption bands around 560–590 nm, which are caused by the localized surface plasmon resonance of copper nanoparticles with different size and morphology. From the perspective of inclusions, the distribution of dot-like inclusions on the shallow surface of the samples (aggregated into linear, feather-like, or clustered formations) may serve as identifying evidence of copper diffusion treatment. Certainly, fluorescence characteristics excited by 295–335 nm ultraviolet light are the most reliable solution for the identification of copper diffusion treatment. The reliability of this identification method was further confirmed through destructive chemical element analysis. The comprehensive analysis in this paper provides robust evidence supporting the assertion that all ten market-acquired red and green feldspars underwent copper diffusion treatment. These findings not only enhance our understanding of the treatment history of this kind of gemstones but also strengthen the efficacy of fluorescence spectroscopy as a reliable and non-destructive method for gemstone identification, with promising applications across the wider market.
Author Contributions
Conceptualization, Q.Z.; methodology, Z.S. and Z.Z.; validation, Z.S. and Q.Z.; writing—original draft preparation, Z.S. and Q.Z.; writing—review and editing, Q.Z. All authors have read and agreed to the published version of the manuscript.
Funding
This research was funded by the Special Basic Cooperative Research Programs of Yunnan Provincial Undergraduate Universities’ Association (grant NO. 202101BA070001-028).
Data Availability Statement
The raw data supporting the conclusions of this article will be made available by the authors on request.
Conflicts of Interest
The authors declare no conflicts of interest.
References
- Johnston, C.L.; Gunter, M.E.; Knowles, C.R. Sunstone Labradorite from the Ponderosa Mine, Oregon. Gems Gemol. 1991, 27, 220–233. [Google Scholar] [CrossRef]
- Kiefert, L.; Wang, C.; Sintayehu, T.; Link, K. Sunstone Labradorite-Bytownite from Ethiopia. J. Gemmol. 2019, 36, 694–696. [Google Scholar] [CrossRef]
- Sun, Z.; Renfro, N.D.; Palke, A.C.; Breitzmann, H.; Muyal, J.; Hand, D.; Rossman, G.R. Sunstone Plagioclase Feldspar from Ethiopia. Gems Gemol. 2020, 56, 184–188. [Google Scholar]
- Hofmeister, A.M.; Rossman, G.R. Exsolution of Metallic Copper from Lake County Labradorite. Geology 1985, 13, 644–647. [Google Scholar] [CrossRef]
- Wang, C.S.; Shen, A.H.; Palke, A.C. Color Origin of the Oregon Sunstone. In Proceedings of the 36th International Gemmological Conference IGC, Nantes, France, 27–31 August 2019; pp. 71–74. [Google Scholar]
- Fritsch, E. Gem News International: Red Andesine Feldspar from Congo. Gems Gemol. 2002, 38, 94–95. [Google Scholar]
- Krzemnicki, M.S. Red and Green Labradorite Feldspar from Congo. J. Gemmol. 2004, 29, 15–23. [Google Scholar] [CrossRef]
- Laurs, B.L. Gem News International: Gem Plagioclase Reportedly from Tibet. Gems Gemol. 2005, 41, 356–357. [Google Scholar]
- Lan, Y.; Chen, C.; Lu, T.J.; Wang, W.W. Characteristics of Surrounding Rocks and Surface Residues of “Red Feldspar from Tibet”. J. Gems Gemmol. 2011, 13, 1–5. (In Chinese) [Google Scholar]
- Wang, W.W.; Lan, Y.; Lu, T.J.; Jiang, W.; Chen, C.; Li, Q.; Chen, Z.; Xie, J. Documental Report of Geological Field Investigation on “Red Feldspar” in Tibet, China. J. Gems Gemmol. 2011, 13, 1–5. (In Chinese) [Google Scholar]
- Abduriyim, A. The Characteristics of Red Andesine from the Himalaya Highland, Tibet. J. Gemmol. 2009, 31, 283–298. [Google Scholar] [CrossRef]
- Fontaine, G.H.; Hametner, K.; Peretti, A.; Günther, D. Authenticity and Provenance Studies of Copper-Bearing Andesines Using Cu Isotope Ratios and Element Analysis by fs-LA-MC-ICPMS and ns-LA-ICPMS. Anal. Bioanal. Chem. 2010, 398, 2915–2928. [Google Scholar] [CrossRef] [PubMed]
- Rossman, G.R. The Chinese Red Feldspar Controversy: Chronology of Research through July 2009. Gems Gemol. 2011, 47, 16–30. [Google Scholar] [CrossRef]
- Zhou, Q.C.; Wang, C.S.; Shen, A.H. Copper Nanoparticles Embedded in Natural Plagioclase Mineral Crystals: In Situ Formation and Third-Order Nonlinearity. J. Phys. Chem. C 2022, 126, 387–395. [Google Scholar] [CrossRef]
- Zhou, Q.C.; Wang, C.S.; Shen, A.H. Application of High-Temperature Copper Diffusion in Surface Recoloring of Faceted Labradorites. Minerals 2022, 12, 920. [Google Scholar] [CrossRef]
- Zhou, Q.C.; Wang, C.S.; Shen, A.H. Fluorescence Characteristics of Two Copper-Diffused Plagioclase Feldspars: Labradorite and Andesine. Gems Gemol. 2022, 58, 424–437. [Google Scholar] [CrossRef]
- Liu, Y.; Hu, Z.; Gao, S.; Günther, D.; Xu, J.; Gao, C.; Chen, H. In situ analysis of major and trace elements of anhydrous minerals by LA-ICP-MS without applying an internal standard. Chem. Geol. 2008, 257, 34–43. [Google Scholar] [CrossRef]
- Liu, P.; Wang, H.; Li, X.; Rui, M.; Zeng, H. Localized Surface Plasmon Resonance of Cu Nanoparticles by Laser Ablation in Liquid Media. RSC Adv. 2015, 5, 79738–79745. [Google Scholar] [CrossRef]
- Wei, C.; Liu, Q. Shape-, Size-, and Density-Tunable Synthesis and Optical Properties of Copper Nanoparticles. CrystEngComm 2017, 19, 3254–3262. [Google Scholar] [CrossRef]
- Pennycook, S.J.; Boatner, L.A. Chemically Sensitive Structure-Imaging with a Scanning Transmission Electron Microscope. Nature 1988, 336, 565–567. [Google Scholar] [CrossRef]
- Audétat, A.; Zhang, L.; Ni, H. Copper and Li Diffusion in Plagioclase, Pyroxenes, Olivine and Apatite, and Consequences for the Composition of Melt Inclusions. Geochim. Cosmochim. Acta 2018, 243, 99–115. [Google Scholar] [CrossRef]
- Jin, S.; Palke, A.C.; Renfro, N.D.; Sun, Z. Special Colors and Optical Effects of Oregon Sunstone: Absorption, Scattering, Pleochroism, and Color Zoning. Gems Gemol. 2023, 59, 298–322. [Google Scholar] [CrossRef]
- Boutinaud, P.; Parent, C.; Le Flem, G.; Pedrini, C.; Moine, B. Spectroscopic Investigation of the Copper (I)-Rich Phosphate CuZr2(PO4)3. J. Phys-Condens. Mat. 1992, 4, 3031. [Google Scholar] [CrossRef]
- Boutinaud, P.; Garcia, D.; Parent, C.; Faucher, M.; Le Flem, G. Energy Levels of Cu+ in the Oxide Insulators CuLaO2 and CuZr2(PO4)3. J. Phys. Chem. Solids 1995, 56, 1147–1154. [Google Scholar] [CrossRef]
- Smith, J.V. Feldspar Minerals: 2 Chemical and Textural Properties; Springer: Berlin/Heidelberg, Germany, 2012; pp. 210–227. [Google Scholar]
Figure 1.
Images of the ten red and green feldspars analyzed in this work.

Figure 2.
UV-vis absorption spectra of the red and green feldspars studied in this paper.

Figure 3.
(a) HAADF STEM image of copper nanoparticles in sample S1; (b) HAADF STEM image of copper nanoparticles in sample S3; (c) HAADF STEM image of copper nanoparticles in sample S6.
Figure 3.
(a) HAADF STEM image of copper nanoparticles in sample S1; (b) HAADF STEM image of copper nanoparticles in sample S3; (c) HAADF STEM image of copper nanoparticles in sample S6.

Figure 4.
Microscopic images of the ten red and green feldspars studied in this paper. Samples S1–S5 were photographed under top lighting, while S6–S10 were photographed under bottom lighting. Note that the typical inclusions are marked with white dotted lines.
Figure 4.
Microscopic images of the ten red and green feldspars studied in this paper. Samples S1–S5 were photographed under top lighting, while S6–S10 were photographed under bottom lighting. Note that the typical inclusions are marked with white dotted lines.

Figure 5.
(a) The appearance of ten red and green feldspars under 320 nm UV light; (b) 2D fluorescence emission spectra of the ten red and green feldspars studied in this paper under 320 nm excitation; (c) Representative 3D fluorescence pattern of sample S3.
Figure 5.
(a) The appearance of ten red and green feldspars under 320 nm UV light; (b) 2D fluorescence emission spectra of the ten red and green feldspars studied in this paper under 320 nm excitation; (c) Representative 3D fluorescence pattern of sample S3.

Figure 6.
The plot of fluorescence intensity vs. peak wavelength shows an obvious separation between the market-acquired red and green feldspars and natural labradorite sunstones [16].
Figure 6.
The plot of fluorescence intensity vs. peak wavelength shows an obvious separation between the market-acquired red and green feldspars and natural labradorite sunstones [16].

Figure 7.
An-Ab-Or ternary diagram showing plagioclase composition of studied feldspars [25], ten samples (red circles) fall in the andesine and labradorite zone.
Figure 7.
An-Ab-Or ternary diagram showing plagioclase composition of studied feldspars [25], ten samples (red circles) fall in the andesine and labradorite zone.


Table 1.
List of red and green feldspars studied in this work with their main characteristics.
| Sample | Weight (ct) | Color | Shape-Cut | Pleochroism | RI | LW/SW-UV |
|---|---|---|---|---|---|---|
| S1 | 0.490 | Red and green | Round-Brilliant | distinct | RIα 1.554–1.556 RIβ 1.563–1.565 | none |
| S2 | 0.445 | Green | Oval-Brilliant | distinct | ||
| S3 | 0.450 | Orange red | Oval-Brilliant | very weak | ||
| S4 | 0.390 | Orange red | Oval-Brilliant | very weak | ||
| S5 | 0.755 | Orange red | Oval-Brilliant | very weak | ||
| S6 | 1.050 | Red | Pear-Brilliant | very weak | ||
| S7 | 0.845 | Red | Pear-Brilliant | very weak | ||
| S8 | 1.240 | Red | Oval-Brilliant | very weak | ||
| S9 | 1.035 | Red | Oval-Brilliant | very weak | ||
| S10 | 1.005 | Red | Oval-Brilliant | very weak |
Table 2.
Major and trace element composition of the samples of the study.
| An mol% | Or mol% | Ab mol% | Na2O wt% | MgO wt% | Al2O3 wt% | SiO2 wt% | P2O5 wt% | K2O wt% | CaO wt% | FeO wt% | Cu ppm | |
|---|---|---|---|---|---|---|---|---|---|---|---|---|
| S1 | 47.95 | 2.62 | 49.43 | 5.55 | 0.08 | 26.82 | 56.71 | 0.02 | 0.45 | 9.75 | 0.33 | 465.65 |
| S2 | 50.03 | 2.50 | 47.47 | 5.45 | 0.08 | 27.34 | 55.62 | 0.03 | 0.44 | 10.39 | 0.34 | 626.32 |
| S3 | 49.85 | 2.57 | 47.58 | 5.49 | 0.08 | 27.85 | 55.03 | 0.04 | 0.45 | 10.40 | 0.34 | 595.96 |
| S4 | 47.95 | 2.57 | 49.48 | 5.71 | 0.08 | 27.12 | 55.95 | 0.03 | 0.45 | 10.01 | 0.35 | 507.53 |
| S5 | 47.84 | 2.59 | 49.57 | 5.65 | 0.08 | 27.40 | 55.89 | 0.03 | 0.45 | 9.87 | 0.33 | 542.38 |
| S6 | 46.39 | 2.71 | 50.9 | 5.80 | 0.08 | 26.90 | 56.45 | 0.05 | 0.47 | 9.56 | 0.35 | 788.37 |
| S7 | 47.55 | 2.62 | 49.83 | 5.74 | 0.08 | 27.08 | 56.03 | 0.05 | 0.46 | 9.92 | 0.35 | 470.79 |
| S8 | 46.08 | 2.95 | 50.96 | 5.90 | 0.07 | 27.08 | 56.09 | 0.05 | 0.52 | 9.65 | 0.34 | 543.42 |
| S9 | 49.38 | 2.47 | 48.14 | 5.59 | 0.08 | 27.73 | 55.10 | 0.03 | 0.44 | 10.38 | 0.35 | 448.05 |
| S10 | 47.40 | 2.82 | 49.79 | 5.78 | 0.07 | 27.50 | 55.48 | 0.04 | 0.50 | 9.95 | 0.37 | 590.79 |
Abbreviations: Ab = albite, An = anorthite, Or = orthoclase.
Disclaimer/Publisher’s Note: The statements, opinions and data contained in all publications are solely those of the individual author(s) and contributor(s) and not of MDPI and/or the editor(s). MDPI and/or the editor(s) disclaim responsibility for any injury to people or property resulting from any ideas, methods, instructions or products referred to in the content. |
© 2024 by the authors. Licensee MDPI, Basel, Switzerland. This article is an open access article distributed under the terms and conditions of the Creative Commons Attribution (CC BY) license (https://creativecommons.org/licenses/by/4.0/).
Share and Cite
MDPI and ACS Style
Shang, Z.; Zhang, Z.; Zhou, Q. Identification of Some Gem-Quality Red and Green Feldspars. Crystals 2024, 14, 409. https://0-doi-org.brum.beds.ac.uk/10.3390/cryst14050409
AMA Style
Shang Z, Zhang Z, Zhou Q. Identification of Some Gem-Quality Red and Green Feldspars. Crystals. 2024; 14(5):409. https://0-doi-org.brum.beds.ac.uk/10.3390/cryst14050409
Chicago/Turabian StyleShang, Zhongyi, Zhiqing Zhang, and Qingchao Zhou. 2024. "Identification of Some Gem-Quality Red and Green Feldspars" Crystals 14, no. 5: 409. https://0-doi-org.brum.beds.ac.uk/10.3390/cryst14050409
Note that from the first issue of 2016, this journal uses article numbers instead of page numbers. See further details here.