
Genomic Characterization of Partial Tandem Duplication Involving the KMT2A Gene in Adult Acute Myeloid Leukemia
 , and
, and
Abstract
:Simple Summary
Abstract
1. Introduction
2. Materials and Methods
2.1. Study Cohort
2.2. Conventional Cytogenetics
2.3. DNA Target Enrichment and Sequencing
2.4. KMT2A-PTD Detection by NGS
2.5. KMT2A-PTD Detection by MLPA
2.6. KMT2A-PTD Detection by OGM
3. Results
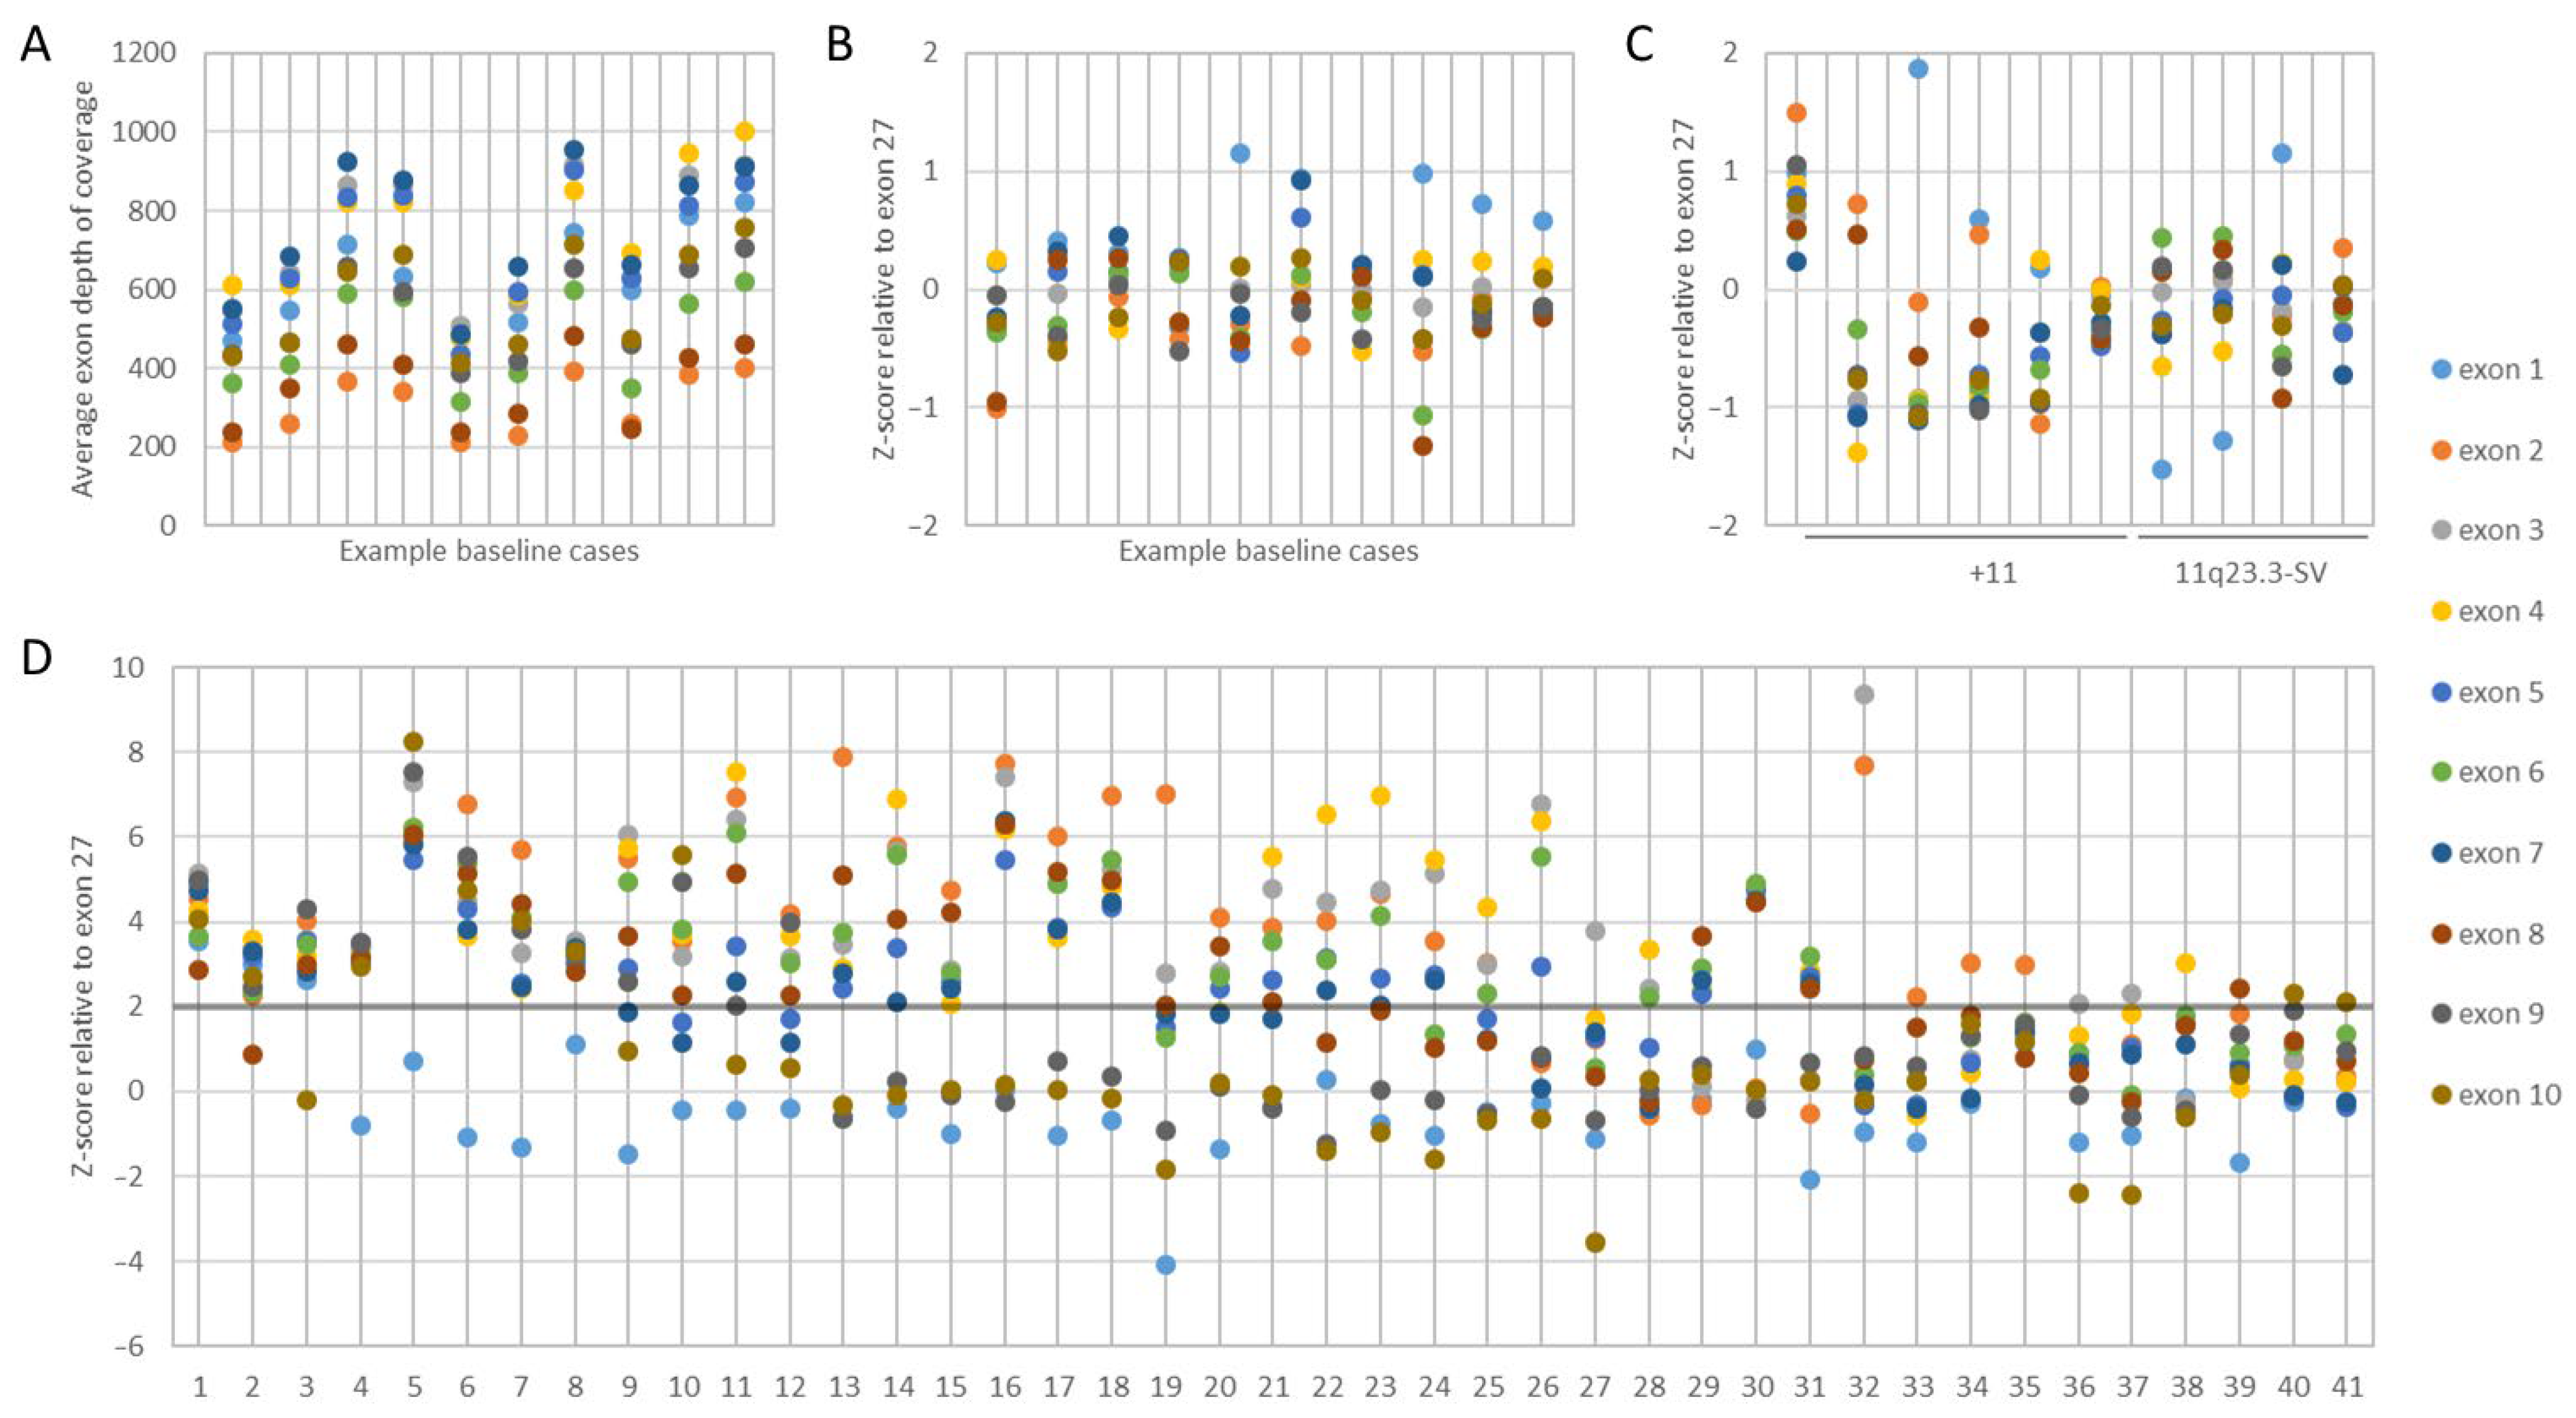
3.1. KMT2A Exon z-Score by NGS
3.2. KMT2A-PTD Detection Threshold by NGS
3.3. KMT2A-PTD Detection by NGS
3.4. KMT2A-PTD Detection by MLPA
3.5. KMT2A-PTD Detection by OGM
4. Discussion

| # | G-Banding Optical Genome Mapping | KMT2A FISH | KMT2A-PTD | ||
|---|---|---|---|---|---|
| NGS | MLPA | OGM | |||
| 1 | N/T | N/T | Yes | N/T | N/T |
| 2 | 46,XY,−20,+21[8]/46,idem,der(3)inv(3)(p23q27)inv(3)(q?21q26.2)[12] | N/T | Yes | INC | N/T |
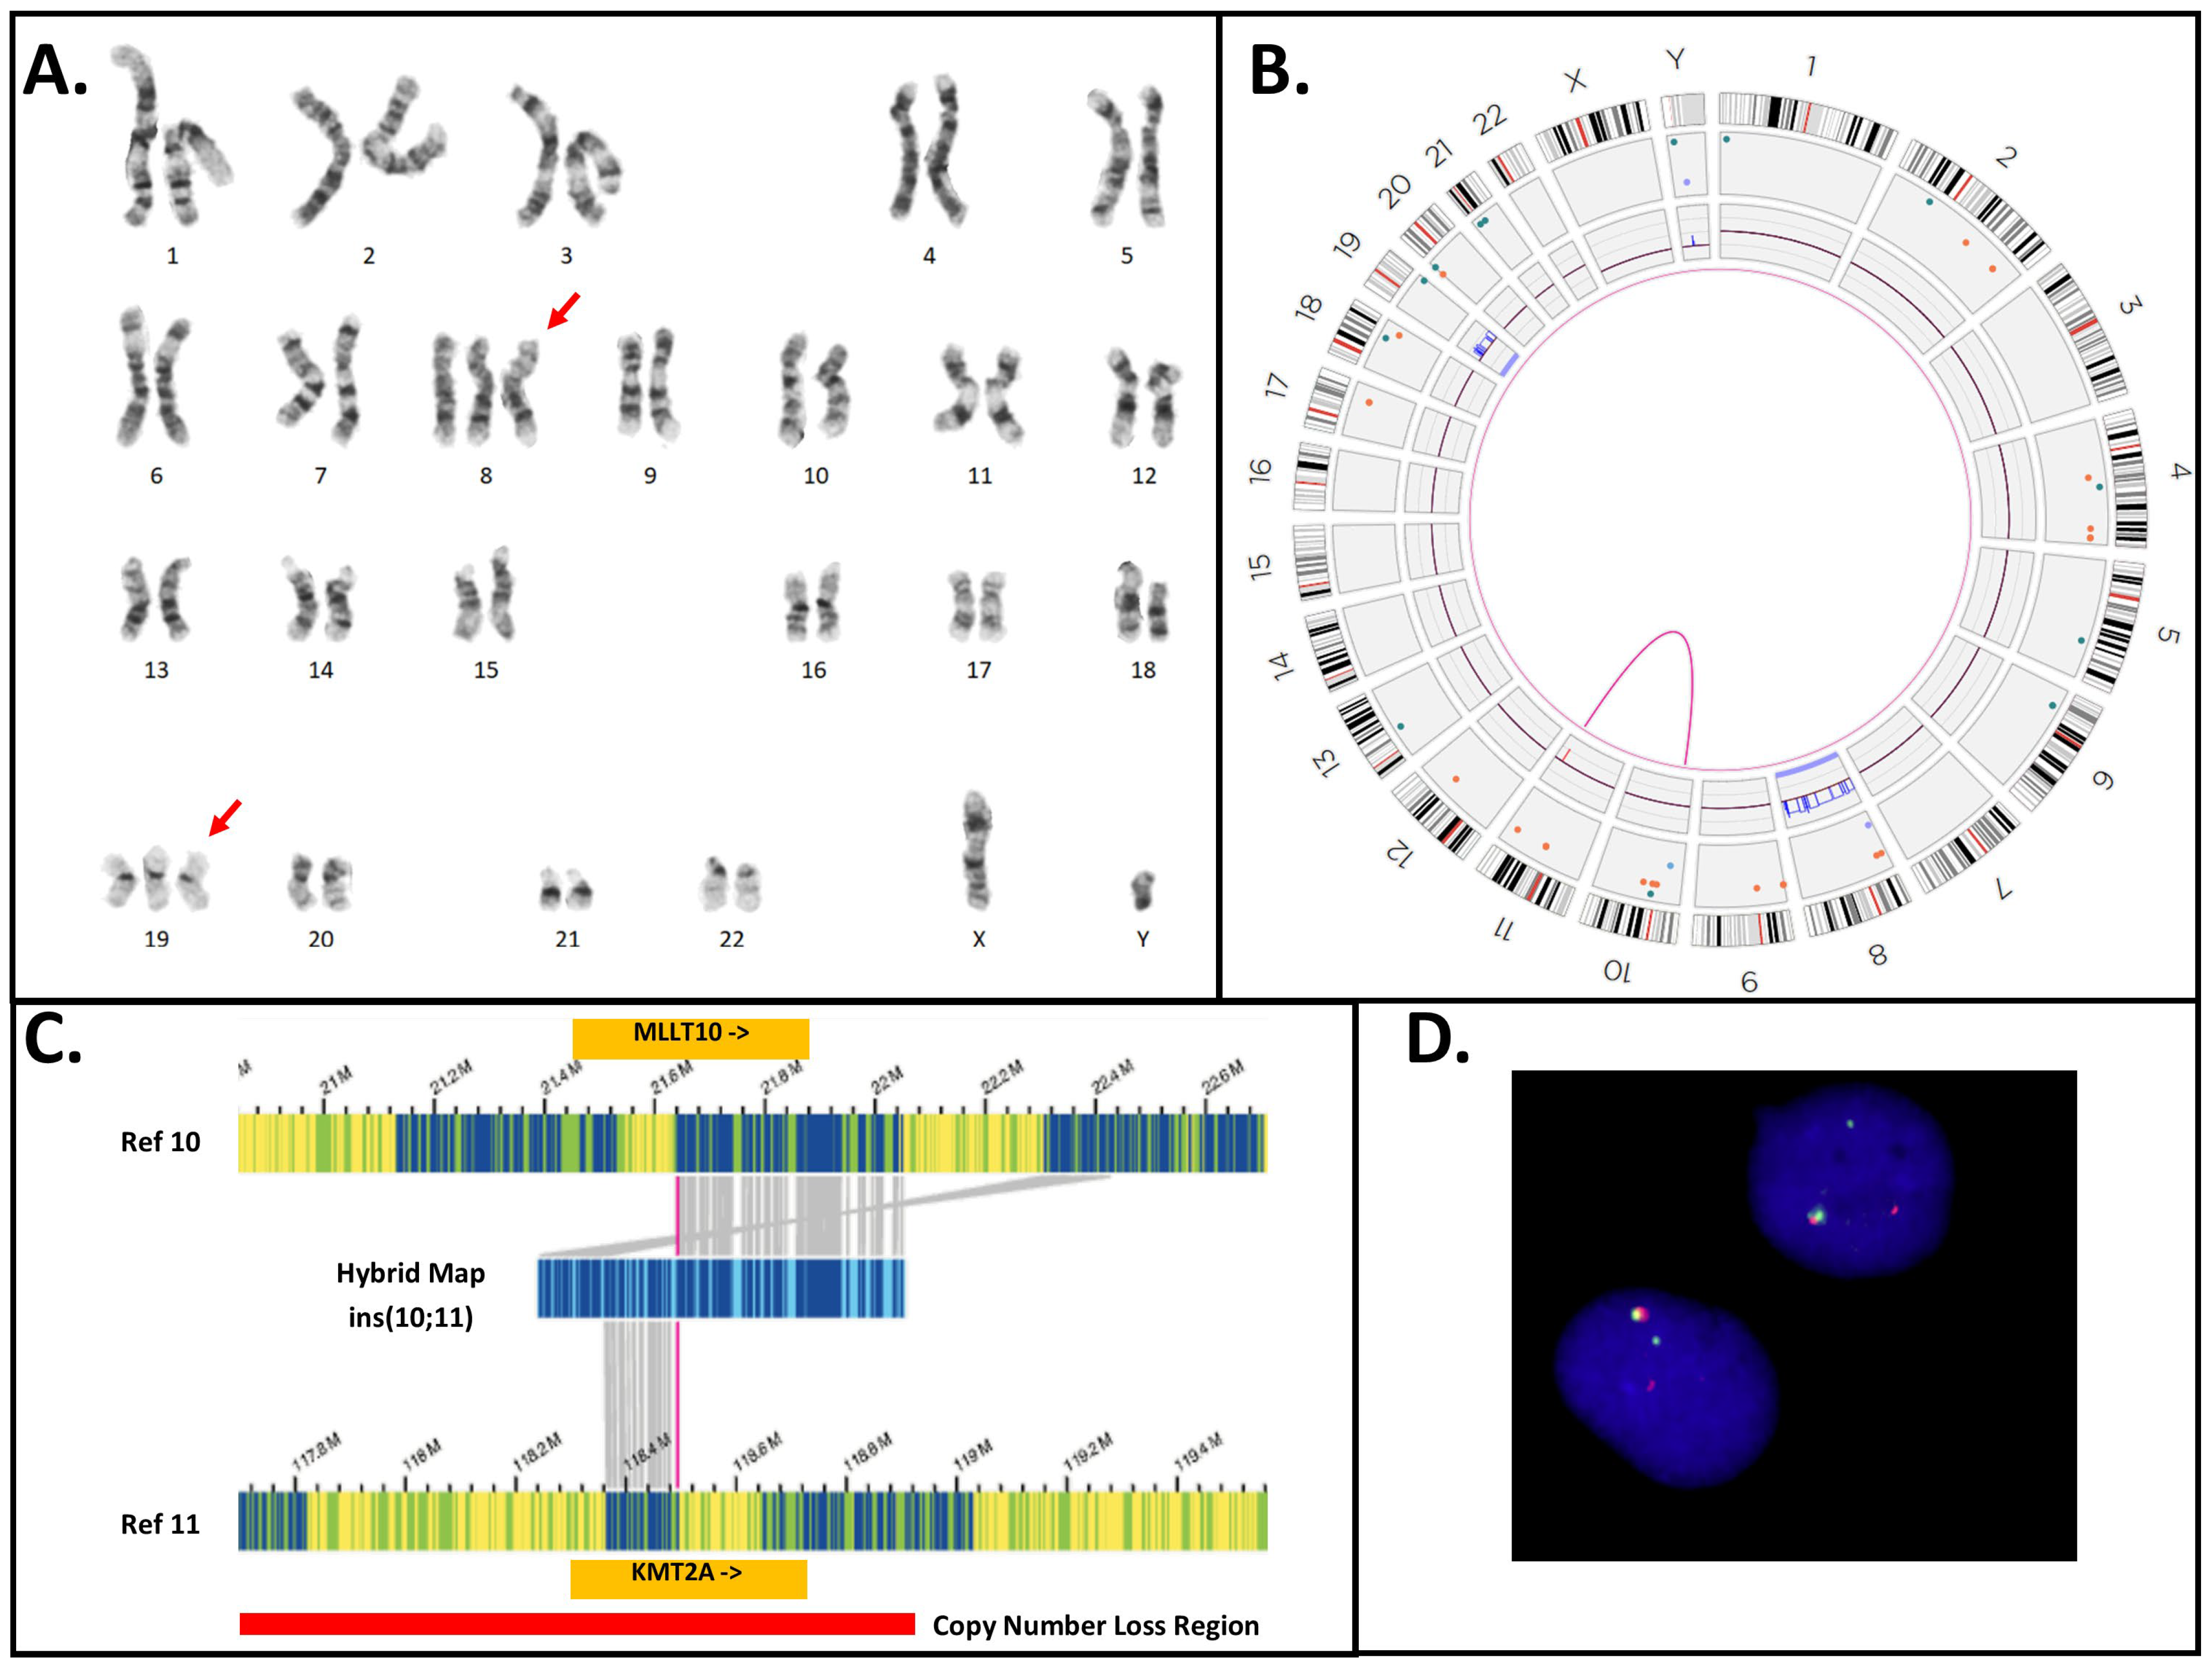
| 3 | 48,XY,+8,+19[20] ogm[GRCh38] (8)x3[0.96],del(11)(q23.3)(117,817,690_118,650,394)[0.99], t(10;11)(p12.31;q23.3)(21,642,030;118,493,942)MLLT10::KMT2A [0.98],(19)x3[0.66] | N/T | Yes | INC | No |
| 4 | N/T | N/T | Yes | N/T | N/T |
| 5 | 45,XX,−7[5]/49,XX,+8,+13,+22[1]/46,XX[17] ogm[GRCh38] (8)x3[0.27],ins(11;?)(q23.3;?)(118,470,405_118,479,068)[0.90],(13)x3[0.28] | N/T | Yes | Yes | Yes |
| 6 | 46,XY,del(11)(p15p11.2)[19]/46,XY[1] ogm[GRCh38] del(11)(p14.3p11.2)(24,233,253_45,484,059)[0.36], ins(11;?)(q23.3;?)(118,470,405_118,479,068)[0.85] | No | Yes | Yes | Yes |
| 7 | 47,XY,del(11)(p15p11.2),+del(11)[13]/48,XY,+11,+13[6]/46,XY[2] | No | Yes | Yes | N/T |
| 8 | Inconclusive | No | Yes | N/T | N/T |
| 9 | 46,XY[20] ogm[GRCh38] ins(11;?)(q23.3;?)(118,470,405_118,479,068)[0.81] | N/T | Yes | Yes | Yes |
| 10 | 46,XY,inv(7)(q11.2q22)?c[22] | No | Yes | Yes | N/T |
| 11 | 46,XY,del(7)(q22q32)[17]/46,XY[3] | N/T | Yes | Yes | N/T |
| 12 | 46,XY,add(7)(q32)[20] | N/T | Yes | N/T | N/T |
| 13 | 46,XY,add(2)(p13),add(14)(q24)[16]/46,idem,add(7)(q22)[4] | N/T | Yes | N/T | N/T |
| 14 | 46,XY[20] | N/T | Yes | Yes | N/T |
| 15 | 47,XY,del(9)(q13q22),+11[10] ogm[GRCh38] del(9)(q21.11q22.31)(67,717,842_92,504,226)[0.90],(11)x3[0.91], ins(11;?)(q23.3;?)(118,470,405_118,479,068)[0.84] | N/T | Yes | Yes | Yes |
| 16 | 46,XX,del(12)(p12p13)[22] | No | Yes | Yes | N/T |
| 17 | 46,XY[20] | No | Yes | Yes | N/T |
| 18 | Inconclusive | No | Yes | Yes | N/T |
| 19 | 46,XX[20] ogm[GRCh38] ins(11;?)(q23.3;?)(118,470,405_118,479,068)[0.91] | N/T | Yes | Yes | Yes |
| 20 | 47,XY,+11[19]/46,XY [1] ogm[GRCh38] (11)x3[0.90],dup(11)(q23.3q23.3)(118,452,293_118,479,068)[0.85] | N/T | Yes | Yes | Yes |
| 21 | 46,XY[20] | N/T | Yes | Yes | N/T |
| 22 | Inconclusive | No | Yes | Yes | N/T |
| 23 | 46,XX[21] | N/T | Yes | Yes | N/T |
| 24 | ogm[GRCh38] del(4)(q24)(105061991_105450148)x1[0.5], ins(11;?)(q23.3;?)(118,470,405_118,479,068)[0.86] | N/T | Yes | N/T | Yes |
| 25 | N/T | N/T | Yes | N/T | N/T |
| 26 | 46,XX[21] | N/T | Yes | N/T | N/T |
| 27 | 45,XY,−7[9]/46,idem,+mar [9]/46,XY[3] ogm[GRCh38] (7)x1[0.63],ins(11;?)(q23.3;?)(118,470,405_118,479,068)[0.74] | N/T | Yes | N/T | Yes |
| 28 | 46,XY[21] | No | Yes | N/T | N/T |
| 29 | 46,XY,+1,der(1;14)(q10;q10)[15]/46,XY[5] | N/T | Yes | Yes | N/T |
| 30 | 46,XX[20] | No | Yes | N/T | N/T |
| 31 | N/T | N/T | Yes | N/T | N/T |
| 32 | ogm[GRCh38] ins(11;?)(q23.3;?)(118,470,101_118,477,357)[0.84] | N/T | Yes | Yes | Yes |
| 33 | 46,XY[20] | N/T | Yes | N/T | N/T |
| 34 | Inconclusive | No | Yes | N/T | N/T |
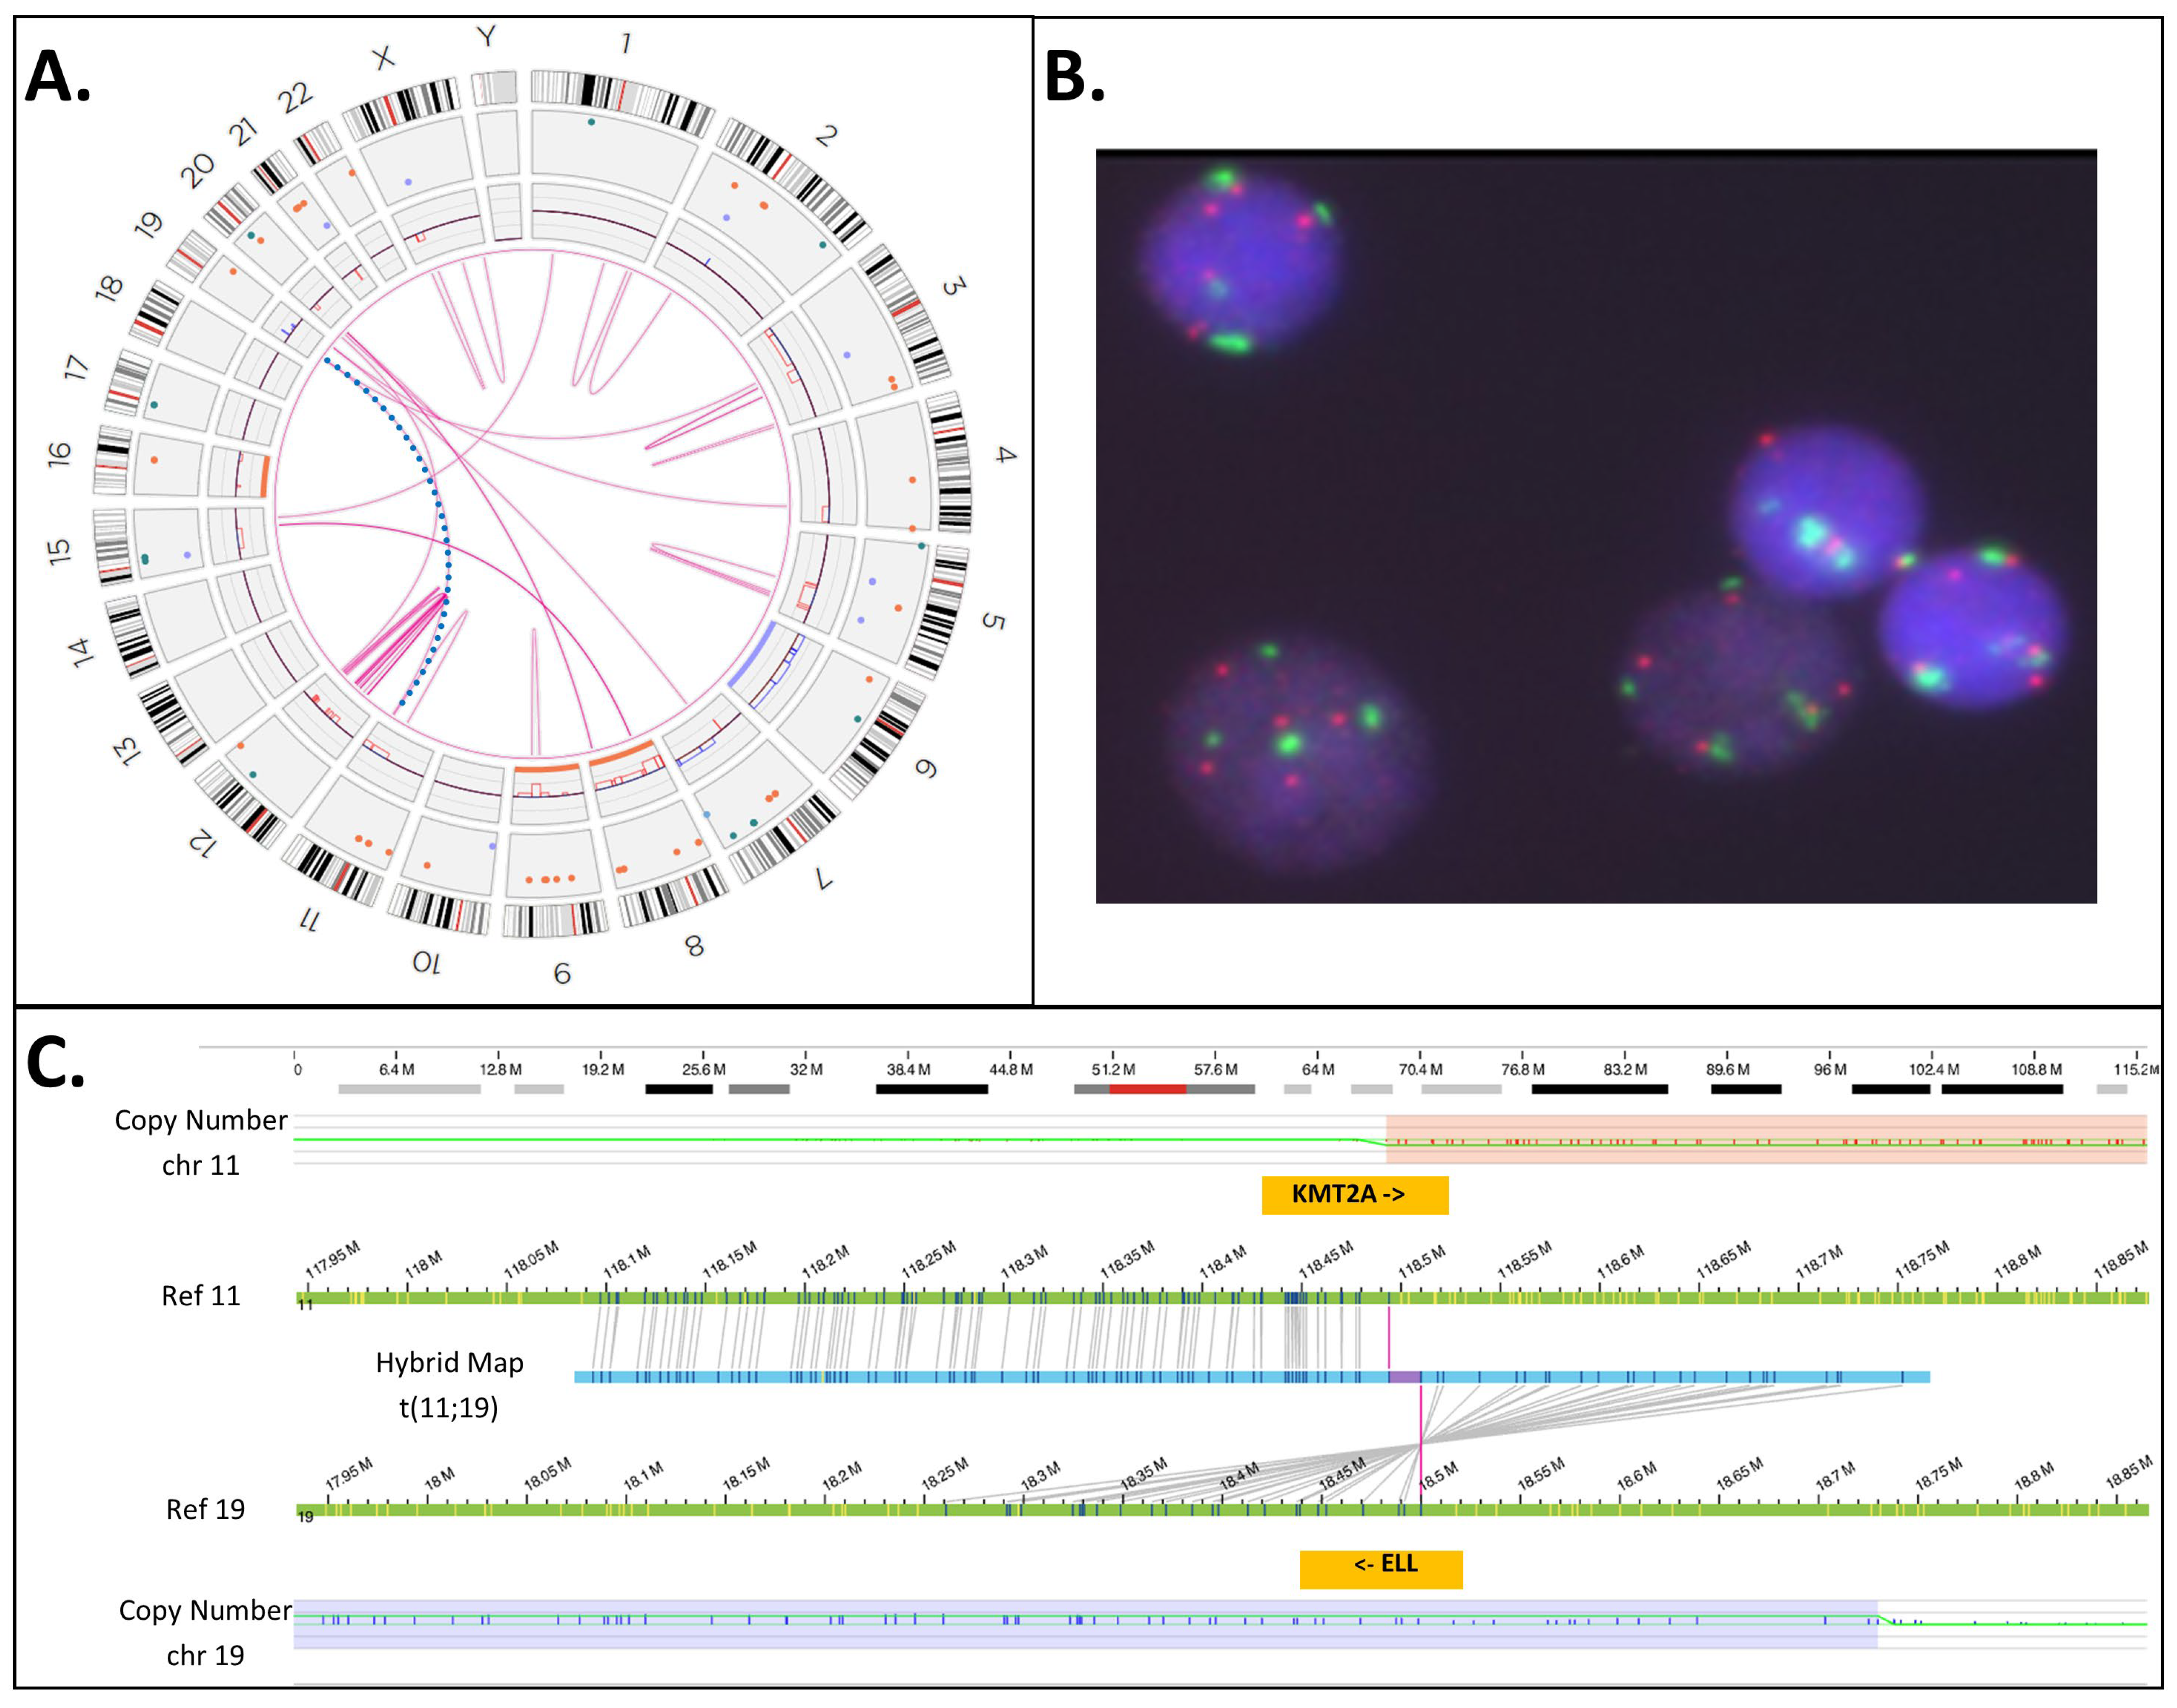
| 35 | ogm[GRCh38] (3,4,7,8,11,12,15,19,20)cx, del(5)(q21.3q32)(108917351_146240776)[0.54], t(11;19)(q23.3;p13.11)(118,493,942;18,499,964)KMT2A::ELL [0.54] | Yes | Yes | INC | No |
| 36 | 47,XY,+8[12]/46,XY[11] ogm[GRCh38] (8)x3[0.42],ins(11;?)(q23.3;?)(118,461,867_118,479,068)[0.62] | N/T | Yes | N/T | Yes |
| 37 | 46,XY[21] ogm[GRCh38] ins(11;?)(q23.3;?)(118,470,405_118,479,068)[0.87] | No | Yes | N/T | Yes |
| 38 | 46,XY[24] | No | Yes | N/T | N/T |
| 39 | 46,XX[20] | N/T | Yes | N/T | N/T |
| 40 | 46,XX,der(6)t(1;6)(q12;p23),del(12)(p11.2p13)[4]/46,XX,del(12)(p11.2p13),der(19)t(1;19)(q12;p13)[3]/46,XX[6] | N/T | Yes | N/T | N/T |
| 41 | 44,XY,der(3)add(3)(p22–24),del(5)(q13q33),−7,−8,add(11)(p15),−12, add(12)(p13),add(13)(q10),add(14)(q32),+mar [9]/46,XY[1] | No | Yes | N/T | N/T |
5. Conclusions
Supplementary Materials
Author Contributions
Funding
Institutional Review Board Statement
Informed Consent Statement
Data Availability Statement
Acknowledgments
Conflicts of Interest
References
- Döhner, K.; Tobis, K.; Ulrich, R.; Fröhling, S.; Benner, A.; Schlenk, R.F.; Döhner, H. Prognostic significance of partial tandem duplications of the MLL gene in adult patients 16 to 60 years old with acute myeloid leukemia and normal cytogenetics: A study of the Acute Myeloid Leukemia Study Group Ulm. J. Clin. Oncol. Off. J. Am. Soc. Clin. Oncol. 2002, 20, 3254–3261. [Google Scholar] [CrossRef] [PubMed]
- Krauter, J.; Wagner, K.; Schäfer, I.; Marschalek, R.; Meyer, C.; Heil, G.; Schaich, M.; Ehninger, G.; Niederwieser, D.; Krahl, R.; et al. Prognostic factors in adult patients up to 60 years old with acute myeloid leukemia and translocations of chromosome band 11q23: Individual patient data-based meta-analysis of the German Acute Myeloid Leukemia Intergroup. J. Clin. Oncol. Off. J. Am. Soc. Clin. Oncol. 2009, 27, 3000–3006. [Google Scholar] [CrossRef] [PubMed]
- Papaemmanuil, E.; Gerstung, M.; Bullinger, L.; Gaidzik, V.I.; Paschka, P.; Roberts, N.D.; Potter, N.E.; Heuser, M.; Thol, F.; Bolli, N.; et al. Genomic Classification and Prognosis in Acute Myeloid Leukemia. N. Engl. J. Med. 2016, 374, 2209–2221. [Google Scholar] [CrossRef] [PubMed]
- Schnittger, S.; Kinkelin, U.; Schoch, C.; Heinecke, A.; Haase, D.; Haferlach, T.; Büchner, T.; Wörmann, B.; Hiddemann, W.; Griesinger, F. Screening for MLL tandem duplication in 387 unselected patients with AML identify a prognostically unfavorable subset of AML. Leukemia 2000, 14, 796–804. [Google Scholar] [CrossRef] [PubMed]
- Meyer, C.; Larghero, P.; Almeida Lopes, B.; Burmeister, T.; Gröger, D.; Sutton, R.; Venn, N.C.; Cazzaniga, G.; Corral Abascal, L.; Tsaur, G.; et al. The KMT2A recombinome of acute leukemias in 2023. Leukemia 2023, 37, 988–1005. [Google Scholar] [CrossRef] [PubMed]
- Bera, R.; Chiu, M.-C.; Huang, Y.-J.; Huang, G.; Lee, Y.-S.; Shih, L.-Y. DNMT3A mutants provide proliferating advantage with augmentation of self-renewal activity in the pathogenesis of AML in KMT2A-PTD-positive leukemic cells. Oncogenesis 2020, 9, 7. [Google Scholar] [CrossRef] [PubMed]
- Swerdlow, S.H.; Campo, E.; Harris, N.L.; Jaffe, E.S.; Pileri, S.A.; Stein, H.; Thiele, J.; Vardiman, J.W. WHO Classification of Tumours of Haematopoietic and Lymphoid Tissues; International Agency for Research on Cancer: Lyon, France, 2008; Volume 2. [Google Scholar]
- Schoch, C.; Schnittger, S.; Klaus, M.; Kern, W.; Hiddemann, W.; Haferlach, T. AML with 11q23/MLL abnormalities as defined by the WHO classification: Incidence, partner chromosomes, FAB subtype, age distribution, and prognostic impact in an unselected series of 1897 cytogenetically analyzed AML cases. Blood 2003, 102, 2395–2402. [Google Scholar] [CrossRef]
- Satake, N.; Maseki, N.; Nishiyama, M.; Kobayashi, H.; Sakurai, M.; Inaba, H.; Katano, N.; Horikoshi, Y.; Eguchi, H.; Miyake, M.; et al. Chromosome abnormalities and MLL rearrangements in acute myeloid leukemia of infants. Leukemia 1999, 13, 1013–1017. [Google Scholar] [CrossRef]
- Cox, M.C.; Panetta, P.; Lo-Coco, F.; Del Poeta, G.; Venditti, A.; Maurillo, L.; Del Principe, M.I.; Mauriello, A.; Anemona, L.; Bruno, A.; et al. Chromosomal aberration of the 11q23 locus in acute leukemia and frequency of MLL gene translocation: Results in 378 adult patients. Am. J. Clin. Pathol. 2004, 122, 298–306. [Google Scholar] [CrossRef]
- Stock, W.; Thirman, M.J.; Dodge, R.K.; Rowley, J.D.; Diaz, M.O.; Wurster-Hill, D.; Sobol, R.E.; Davey, F.R.; Larson, R.A.; Westbrook, C.A.; et al. Detection of MLL gene rearrangements in adult acute lymphoblastic leukemia. A Cancer and Leukemia Group B study. Leukemia 1994, 8, 1918–1922. [Google Scholar]
- Super, H.J.; McCabe, N.R.; Thirman, M.J.; Larson, R.A.; Le Beau, M.M.; Pedersen-Bjergaard, J.; Philip, P.; Diaz, M.O.; Rowley, J.D. Rearrangements of the MLL gene in therapy-related acute myeloid leukemia in patients previously treated with agents targeting DNA-topoisomerase II. Blood 1993, 82, 3705–3711. [Google Scholar] [CrossRef] [PubMed]
- Górecki, M.; Kozioł, I.; Kopystecka, A.; Budzyńska, J.; Zawitkowska, J.; Lejman, M. Updates in KMT2A Gene Rearrangement in Pediatric Acute Lymphoblastic Leukemia. Biomedicines 2023, 11, 821. [Google Scholar] [CrossRef] [PubMed]
- Basecke, J.; Whelan, J.T.; Griesinger, F.; Bertrand, F.E. The MLL partial tandem duplication in acute myeloid leukaemia. Br. J. Haematol. 2006, 135, 438–449. [Google Scholar] [CrossRef] [PubMed]
- Nilson, I.; Löchner, K.; Siegler, G.; Greil, J.; Beck, J.D.; Fey, G.H.; Marschalek, R. Exon/intron structure of the human ALL-1 (MLL) gene involved in translocations to chromosomal region 11q23 and acute leukaemias. Br. J. Haematol. 1996, 93, 966–972. [Google Scholar] [CrossRef] [PubMed]
- Audemard, E.O.; Gendron, P.; Feghaly, A.; Lavallée, V.-P.; Hébert, J.; Sauvageau, G.; Lemieux, S. Targeted variant detection using unaligned RNA-Seq reads. Life Sci. Alliance 2019, 2, e201900336. [Google Scholar] [CrossRef] [PubMed]
- Krivtsov, A.V.; Hoshii, T.; Armstrong, S.A. Mixed-Lineage Leukemia Fusions and Chromatin in Leukemia. Cold Spring Harb. Perspect. Med. 2017, 7, a026658. [Google Scholar] [CrossRef] [PubMed]
- Vetro, C.; Haferlach, T.; Meggendorfer, M.; Stengel, A.; Jeromin, S.; Kern, W.; Haferlach, C. Cytogenetic and molecular genetic characterization of KMT2A-PTD positive acute myeloid leukemia in comparison to KMT2A-Rearranged acute myeloid leukemia. Cancer Genet. 2020, 240, 15–22. [Google Scholar] [CrossRef] [PubMed]
- Jamal, R.; Taketani, T.; Taki, T.; Bessho, F.; Hongo, T.; Hamaguchi, H.; Horiike, S.; Taniwaki, M.; Hanada, R.; Nakamura, H.; et al. Coduplication of the MLL and FLT3 genes in patients with acute myeloid leukemia. Genes Chromosomes Cancer 2001, 31, 187–190. [Google Scholar] [CrossRef] [PubMed]
- Shih, L.Y.; Liang, D.C.; Fu, J.F.; Wu, J.H.; Wang, P.N.; Lin, T.L.; Dunn, P.; Kuo, M.C.; Tang, T.C.; Lin, T.H.; et al. Characterization of fusion partner genes in 114 patients with de novo acute myeloid leukemia and MLL rearrangement. Leukemia 2006, 20, 218–223. [Google Scholar] [CrossRef]
- Steudel, C.; Wermke, M.; Schaich, M.; Schäkel, U.; Illmer, T.; Ehninger, G.; Thiede, C. Comparative analysis of MLL partial tandem duplication and FLT3 internal tandem duplication mutations in 956 adult patients with acute myeloid leukemia. Genes Chromosomes Cancer 2003, 37, 237–251. [Google Scholar] [CrossRef]
- Whitman, S.P.; Liu, S.; Vukosavljevic, T.; Rush, L.J.; Yu, L.; Liu, C.; Klisovic, M.I.; Maharry, K.; Guimond, M.; Strout, M.P.; et al. The MLL partial tandem duplication: Evidence for recessive gain-of-function in acute myeloid leukemia identifies a novel patient subgroup for molecular-targeted therapy. Blood 2005, 106, 345–352. [Google Scholar] [CrossRef] [PubMed]
- Burmeister, T.; Meyer, C.; Gröger, D.; Hofmann, J.; Marschalek, R. Evidence-based RT-PCR methods for the detection of the 8 most common MLL aberrations in acute leukemias. Leuk. Res. 2015, 39, 242–247. [Google Scholar] [CrossRef] [PubMed]
- Li, Q.; Xing, S.; Zhang, H.; Mao, X.; Xiao, M.; Wang, Y. FISH improves risk stratification in acute leukemia by identifying KMT2A abnormal copy number and rearrangements. Sci. Rep. 2022, 12, 9585. [Google Scholar] [CrossRef]
- Ross, L.L.; Peter, J.M.V. Next-generation sequencing in the diagnosis and minimal residual disease assessment of acute myeloid leukemia. Haematologica 2019, 104, 868–871. [Google Scholar] [CrossRef] [PubMed]
- Dai, B.; Yu, H.; Ma, T.; Lei, Y.; Wang, J.; Zhang, Y.; Lu, J.; Yan, H.; Jiang, L.; Chen, B. The Application of Targeted RNA Sequencing for KMT2A–Partial Tandem Duplication Identification and Integrated Analysis of Molecular Characterization in Acute Myeloid Leukemia. J. Mol. Diagn. 2021, 23, 1478–1490. [Google Scholar] [CrossRef] [PubMed]
- Afrin, S.; Zhang, C.R.C.; Meyer, C.; Stinson, C.L.; Pham, T.; Bruxner, T.J.C.; Venn, N.C.; Trahair, T.N.; Sutton, R.; Marschalek, R.; et al. Targeted Next-Generation Sequencing for Detecting MLL Gene Fusions in Leukemia. Mol. Cancer Res. 2018, 16, 279–285. [Google Scholar] [CrossRef] [PubMed]
- McKerrell, T.; Moreno, T.; Ponstingl, H.; Bolli, N.; Dias, J.M.L.; Tischler, G.; Colonna, V.; Manasse, B.; Bench, A.; Bloxham, D.; et al. Development and validation of a comprehensive genomic diagnostic tool for myeloid malignancies. Blood 2016, 128, e1–e9. [Google Scholar] [CrossRef] [PubMed]
- Engvall, M.; Cahill, N.; Jonsson, B.-I.; Höglund, M.; Hallböök, H.; Cavelier, L. Detection of leukemia gene fusions by targeted RNA-sequencing in routine diagnostics. BMC Med. Genom. 2020, 13, 106. [Google Scholar] [CrossRef] [PubMed]
- Hinai, A.S.A.A.; Pratcorona, M.; Grob, T.; Kavelaars, F.G.; Bussaglia, E.; Sanders, M.A.; Nomdedeu, J.; Valk, P.J.M. The Landscape of KMT2A-PTD AML: Concurrent Mutations, Gene Expression Signatures, and Clinical Outcome. HemaSphere 2019, 3, e181. [Google Scholar] [CrossRef]
- Creutzig, U.; van den Heuvel-Eibrink, M.M.; Gibson, B.; Dworzak, M.N.; Adachi, S.; de Bont, E.; Harbott, J.; Hasle, H.; Johnston, D.; Kinoshita, A.; et al. Diagnosis and management of acute myeloid leukemia in children and adolescents: Recommendations from an international expert panel. Blood 2012, 120, 3187–3205. [Google Scholar] [CrossRef]
- Smith, A.C.; Neveling, K.; Kanagal-Shamanna, R. Optical genome mapping for structural variation analysis in hematologic malignancies. Am. J. Hematol. 2022, 97, 975–982. [Google Scholar] [CrossRef] [PubMed]
- Levy, B.; Kanagal-Shamanna, R.; Sahajpal, N.S.; Neveling, K.; Rack, K.; Dewaele, B.; Olde Weghuis, D.; Stevens-Kroef, M.; Puiggros, A.; Mallo, M.; et al. A framework for the clinical implementation of optical genome mapping in hematologic malignancies. Am. J. Hematol. 2024, 99, 642–661. [Google Scholar] [CrossRef] [PubMed]
- Chaisson, M.J.P.; Sanders, A.D.; Zhao, X.; Malhotra, A.; Porubsky, D.; Rausch, T.; Gardner, E.J.; Rodriguez, O.L.; Guo, L.; Collins, R.L.; et al. Multi-platform discovery of haplotype-resolved structural variation in human genomes. Nat. Commun. 2019, 10, 1784. [Google Scholar] [CrossRef] [PubMed]
- Tsai, H.K.; Gibson, C.J.; Murdock, H.M.; Davineni, P.; Harris, M.H.; Wang, E.S.; Gondek, L.P.; Kim, A.S.; Nardi, V.; Lindsley, R.C. Allelic complexity of KMT2A partial tandem duplications in acute myeloid leukemia and myelodysplastic syndromes. Blood Adv. 2022, 6, 4236–4240. [Google Scholar] [CrossRef] [PubMed]
- Moore, S.; McGowan-Jordan, J.; Smith, A.C.; Rack, K.; Koehler, U.; Stevens-Kroeg, M.; Barseghyan, H.; Kanagal-Shamanna, R.; Hastings, R. Genome Mapping Nomenclature. Cytogenet. Genome Res. 2023. [Google Scholar] [CrossRef]
- Li, M.M.; Datto, M.; Duncavage, E.J.; Kulkarni, S.; Lindeman, N.I.; Roy, S.; Tsimberidou, A.M.; Vnencak-Jones, C.L.; Wolff, D.J.; Younes, A.; et al. Standards and Guidelines for the Interpretation and Reporting of Sequence Variants in Cancer: A Joint Consensus Recommendation of the Association for Molecular Pathology, American Society of Clinical Oncology, and College of American Pathologists. J. Mol. Diagn. 2017, 19, 4–23. [Google Scholar] [CrossRef]


Disclaimer/Publisher’s Note: The statements, opinions and data contained in all publications are solely those of the individual author(s) and contributor(s) and not of MDPI and/or the editor(s). MDPI and/or the editor(s) disclaim responsibility for any injury to people or property resulting from any ideas, methods, instructions or products referred to in the content. |
© 2024 by the authors. Licensee MDPI, Basel, Switzerland. This article is an open access article distributed under the terms and conditions of the Creative Commons Attribution (CC BY) license (https://creativecommons.org/licenses/by/4.0/).
Share and Cite
Seto, A.; Downs, G.; King, O.; Salehi-Rad, S.; Baptista, A.; Chin, K.; Grenier, S.; Nwachukwu, B.; Tierens, A.; Minden, M.D.; et al. Genomic Characterization of Partial Tandem Duplication Involving the KMT2A Gene in Adult Acute Myeloid Leukemia. Cancers 2024, 16, 1693. https://0-doi-org.brum.beds.ac.uk/10.3390/cancers16091693
Seto A, Downs G, King O, Salehi-Rad S, Baptista A, Chin K, Grenier S, Nwachukwu B, Tierens A, Minden MD, et al. Genomic Characterization of Partial Tandem Duplication Involving the KMT2A Gene in Adult Acute Myeloid Leukemia. Cancers. 2024; 16(9):1693. https://0-doi-org.brum.beds.ac.uk/10.3390/cancers16091693
Chicago/Turabian StyleSeto, Andrew, Gregory Downs, Olivia King, Shabnam Salehi-Rad, Ana Baptista, Kayu Chin, Sylvie Grenier, Bevoline Nwachukwu, Anne Tierens, Mark D. Minden, and et al. 2024. "Genomic Characterization of Partial Tandem Duplication Involving the KMT2A Gene in Adult Acute Myeloid Leukemia" Cancers 16, no. 9: 1693. https://0-doi-org.brum.beds.ac.uk/10.3390/cancers16091693