

Development of an Artificial-Intelligence-Based Tool for Automated Assessment of Cellularity in Bone Marrow Biopsies in Ph-Negative Myeloproliferative Neoplasms
 ,
,  and
and
Abstract
:Simple Summary
Abstract
1. Introduction
2. Materials and Methods
2.1. Cases Selection and Digital Images Scanning
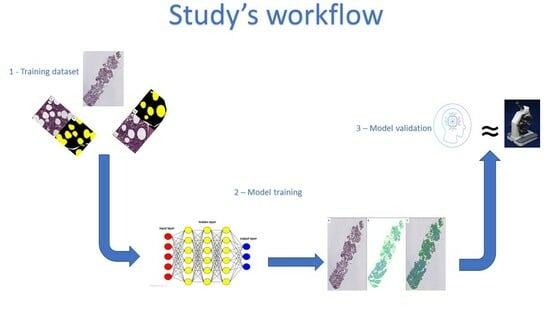
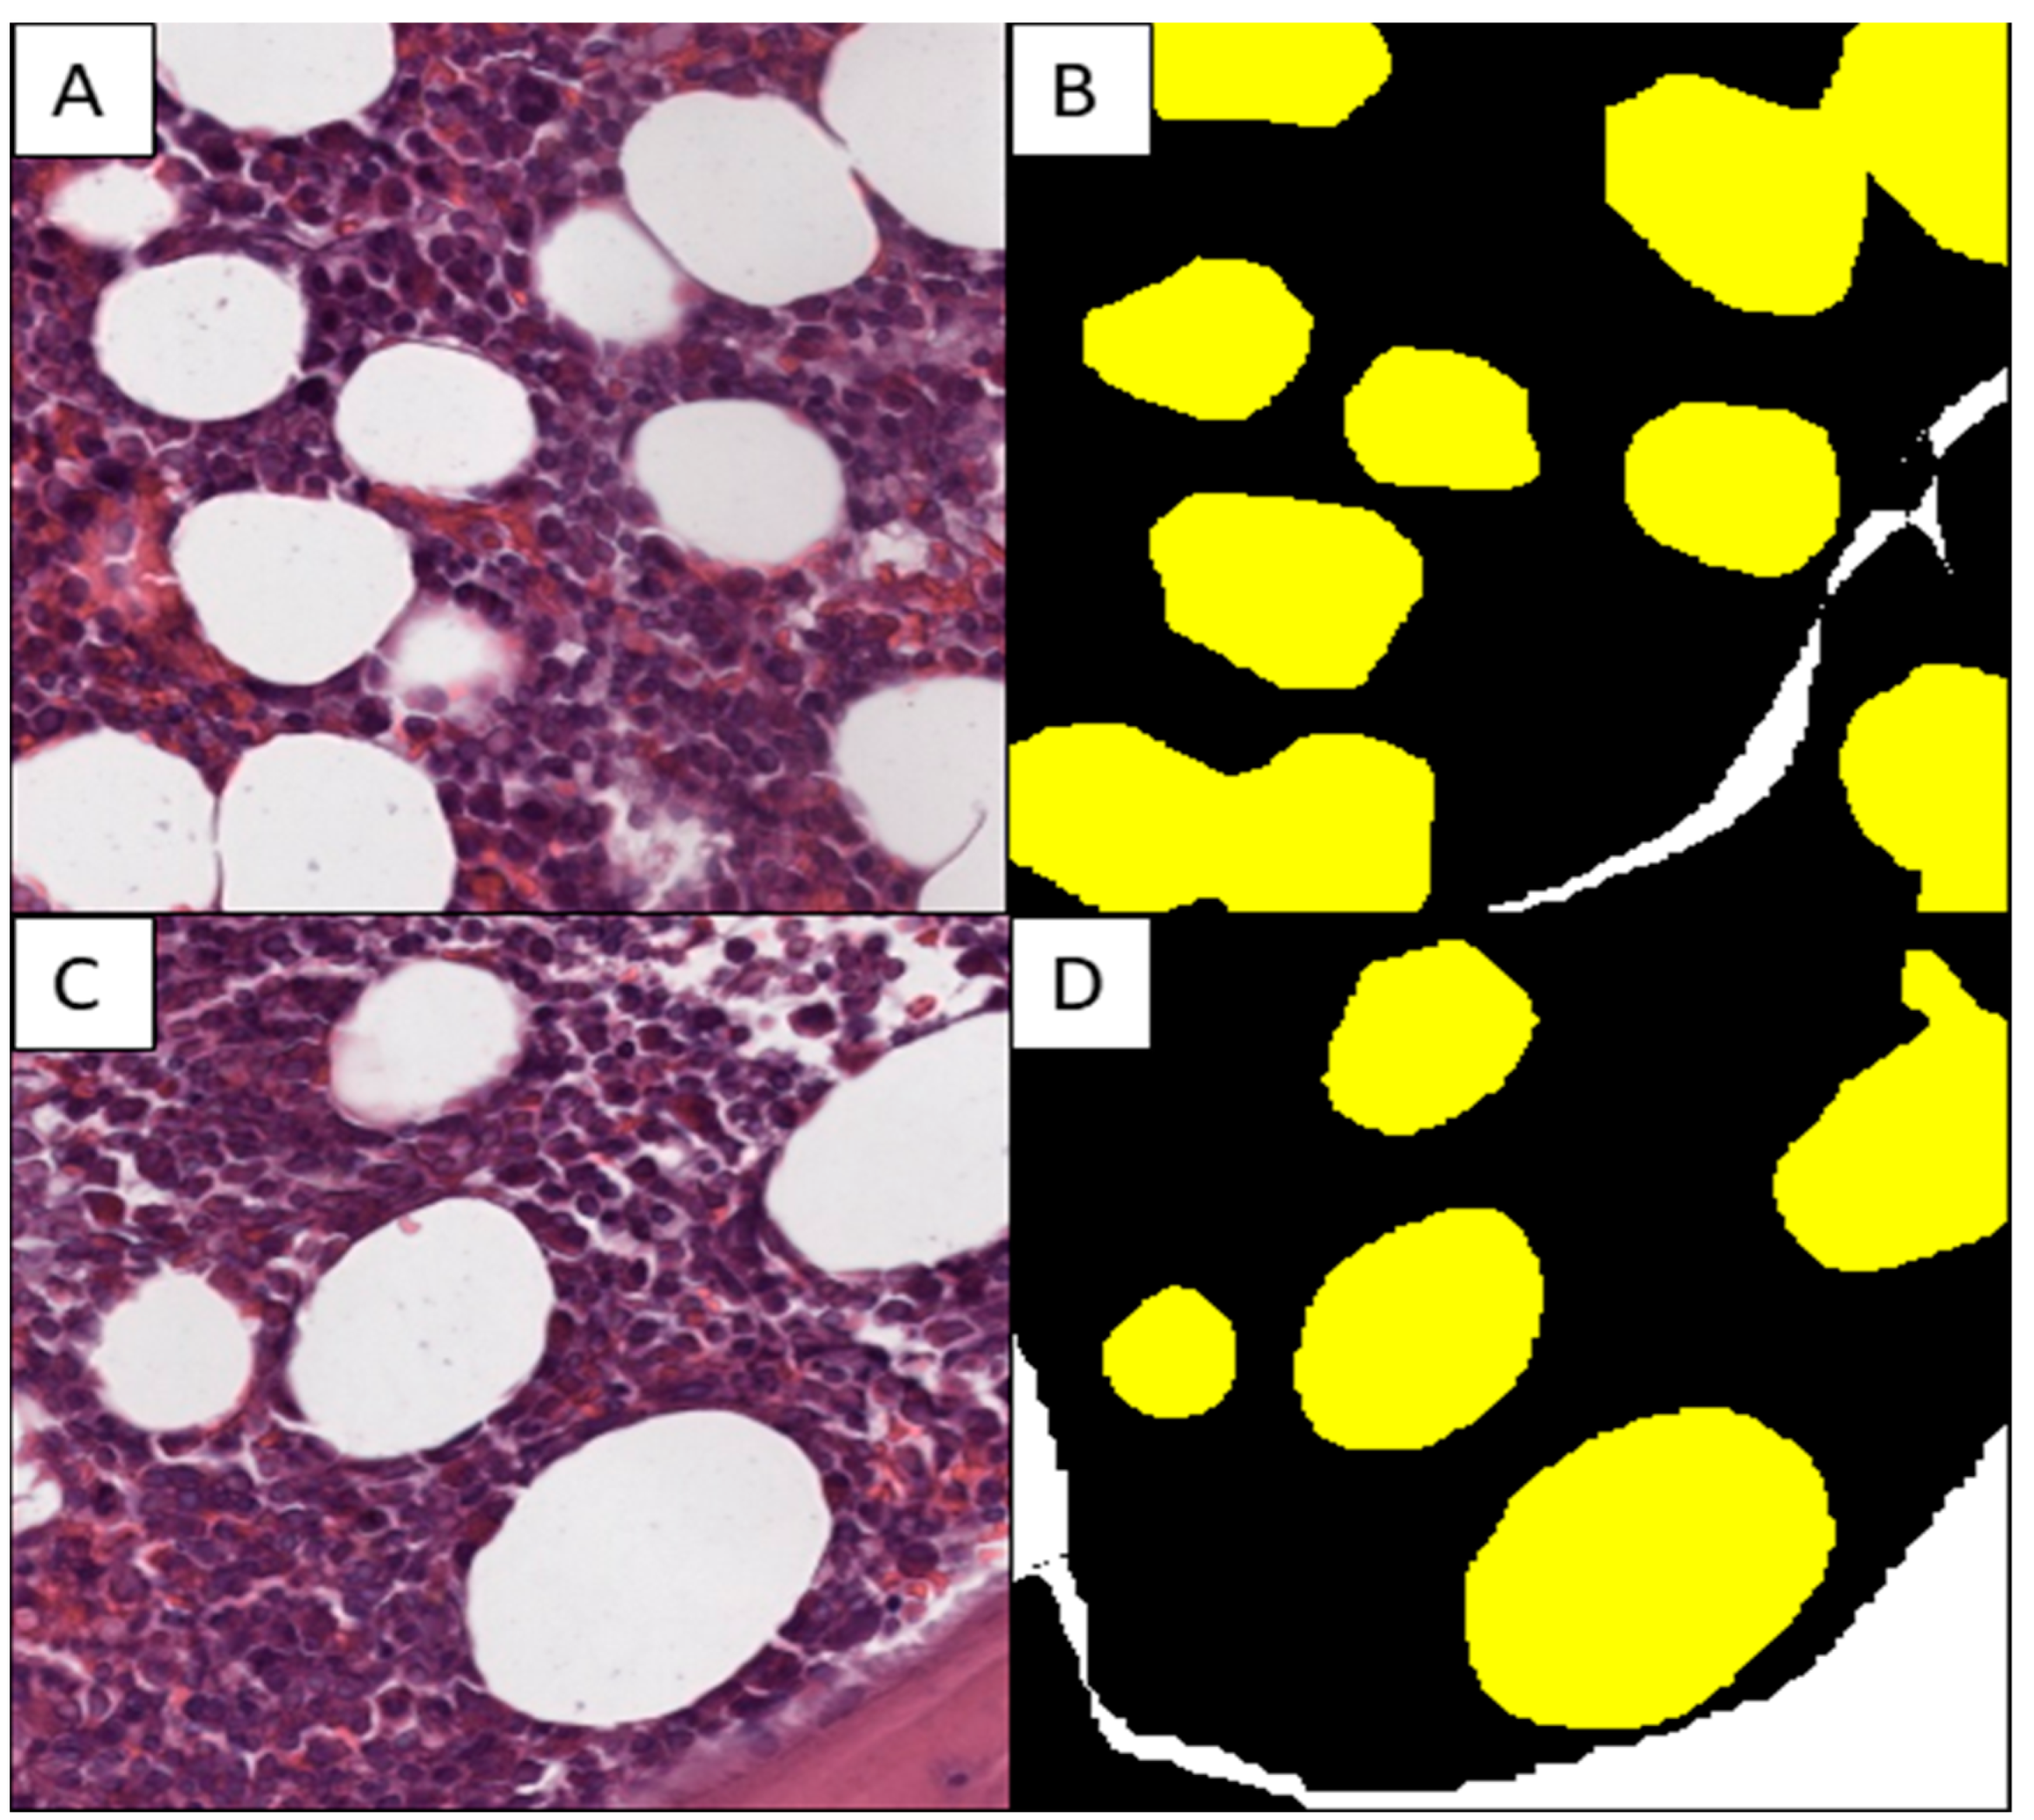
2.2. Production of the Training Set
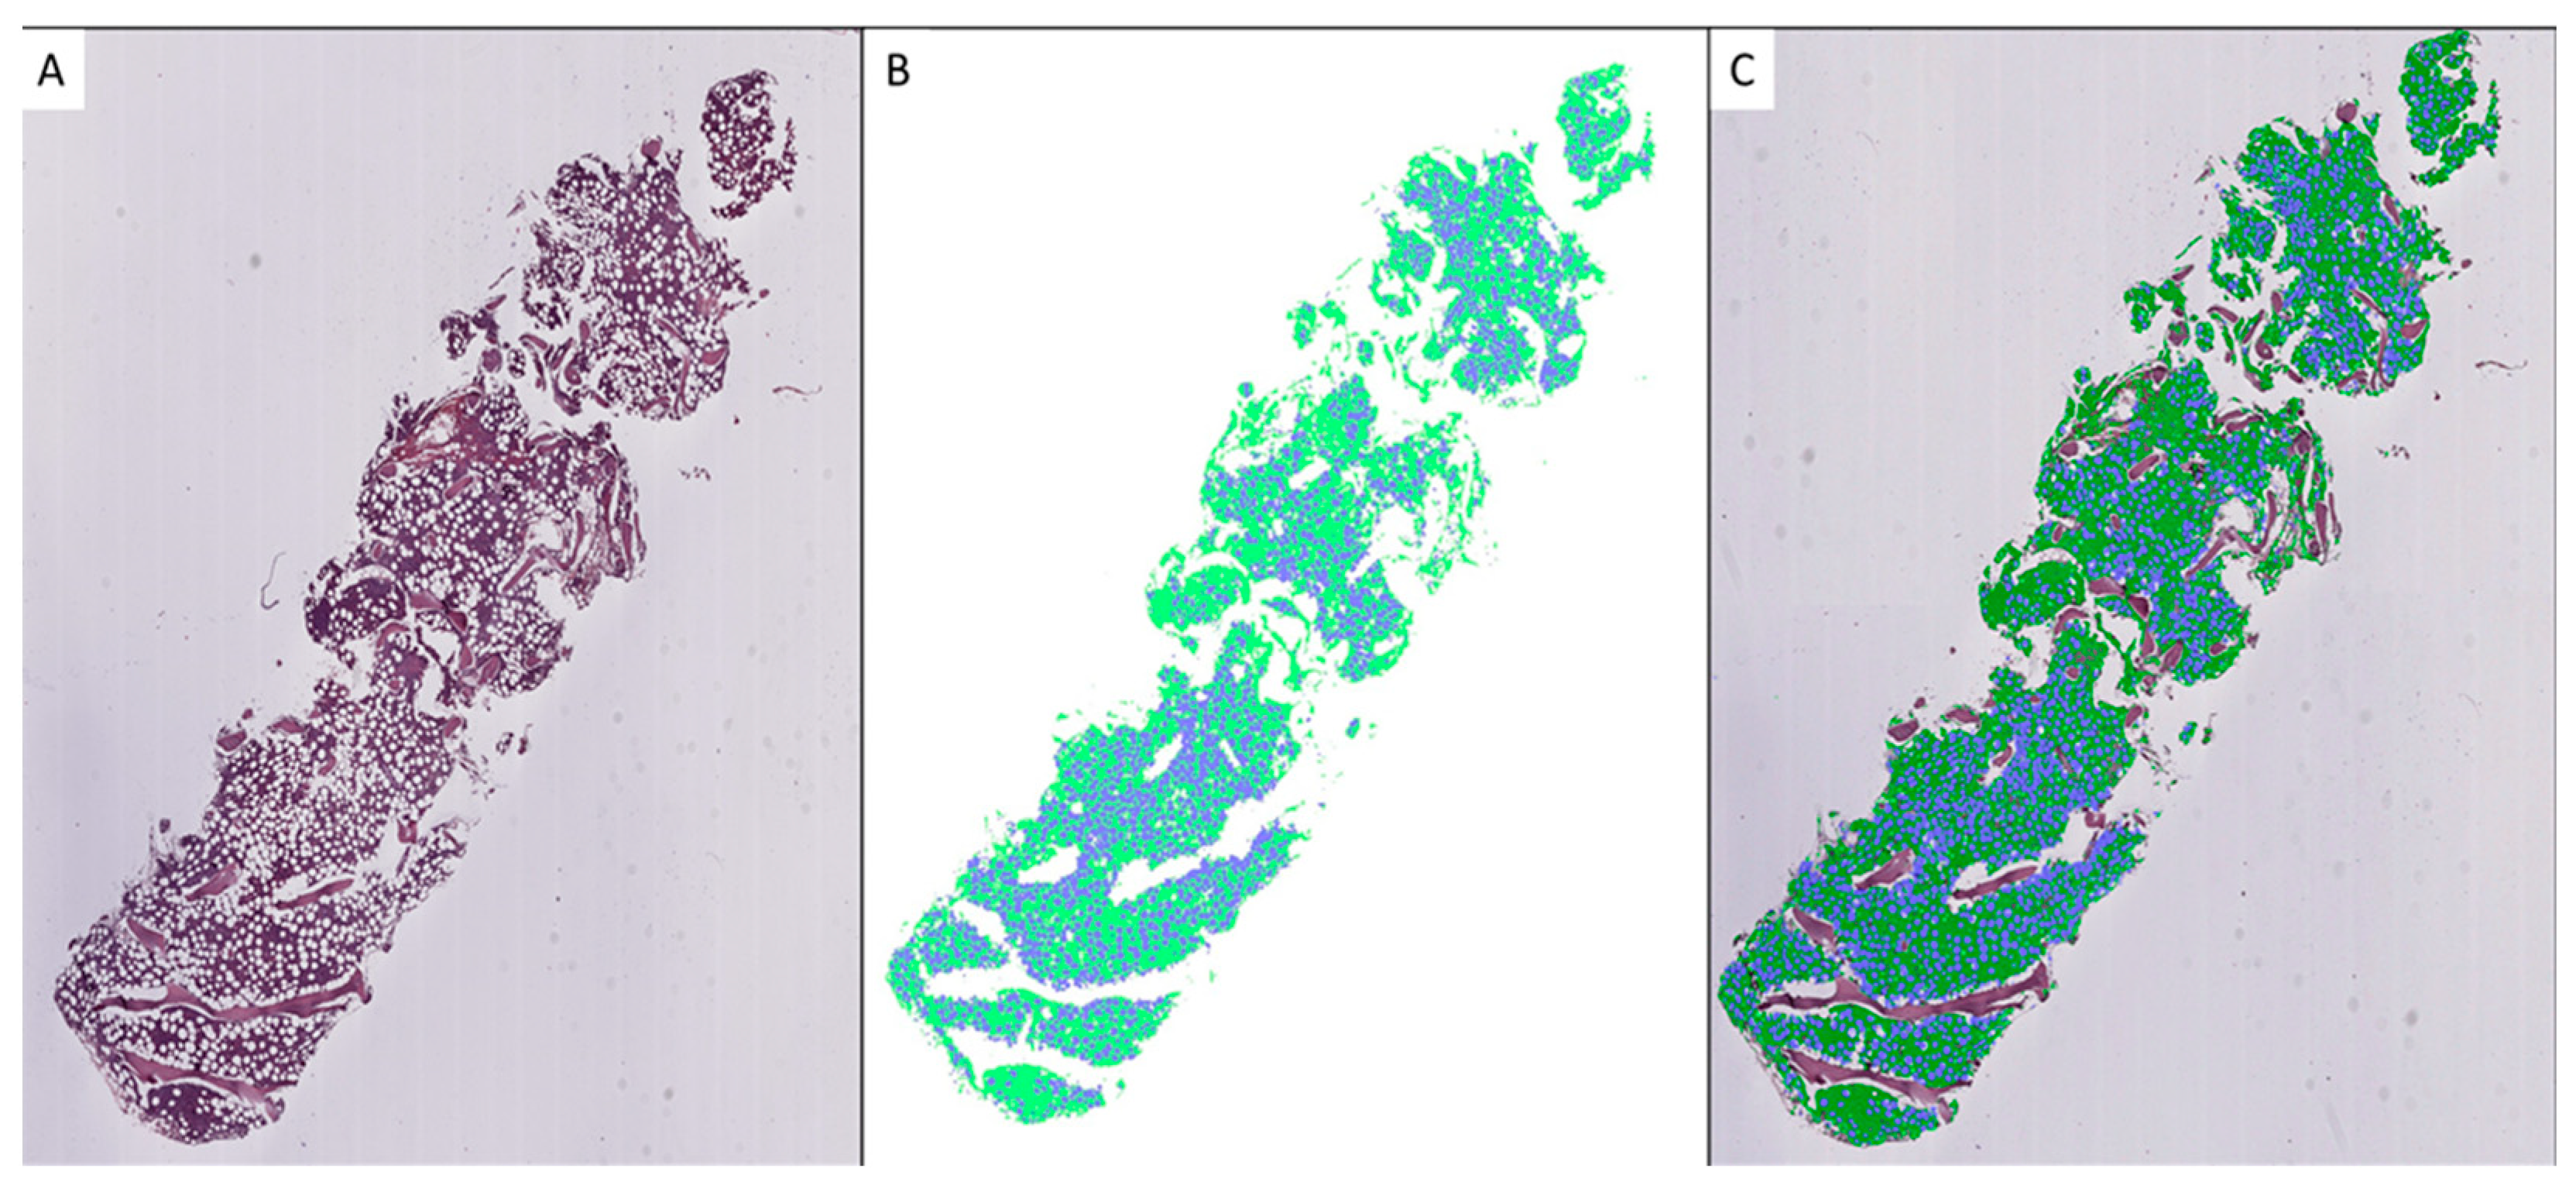
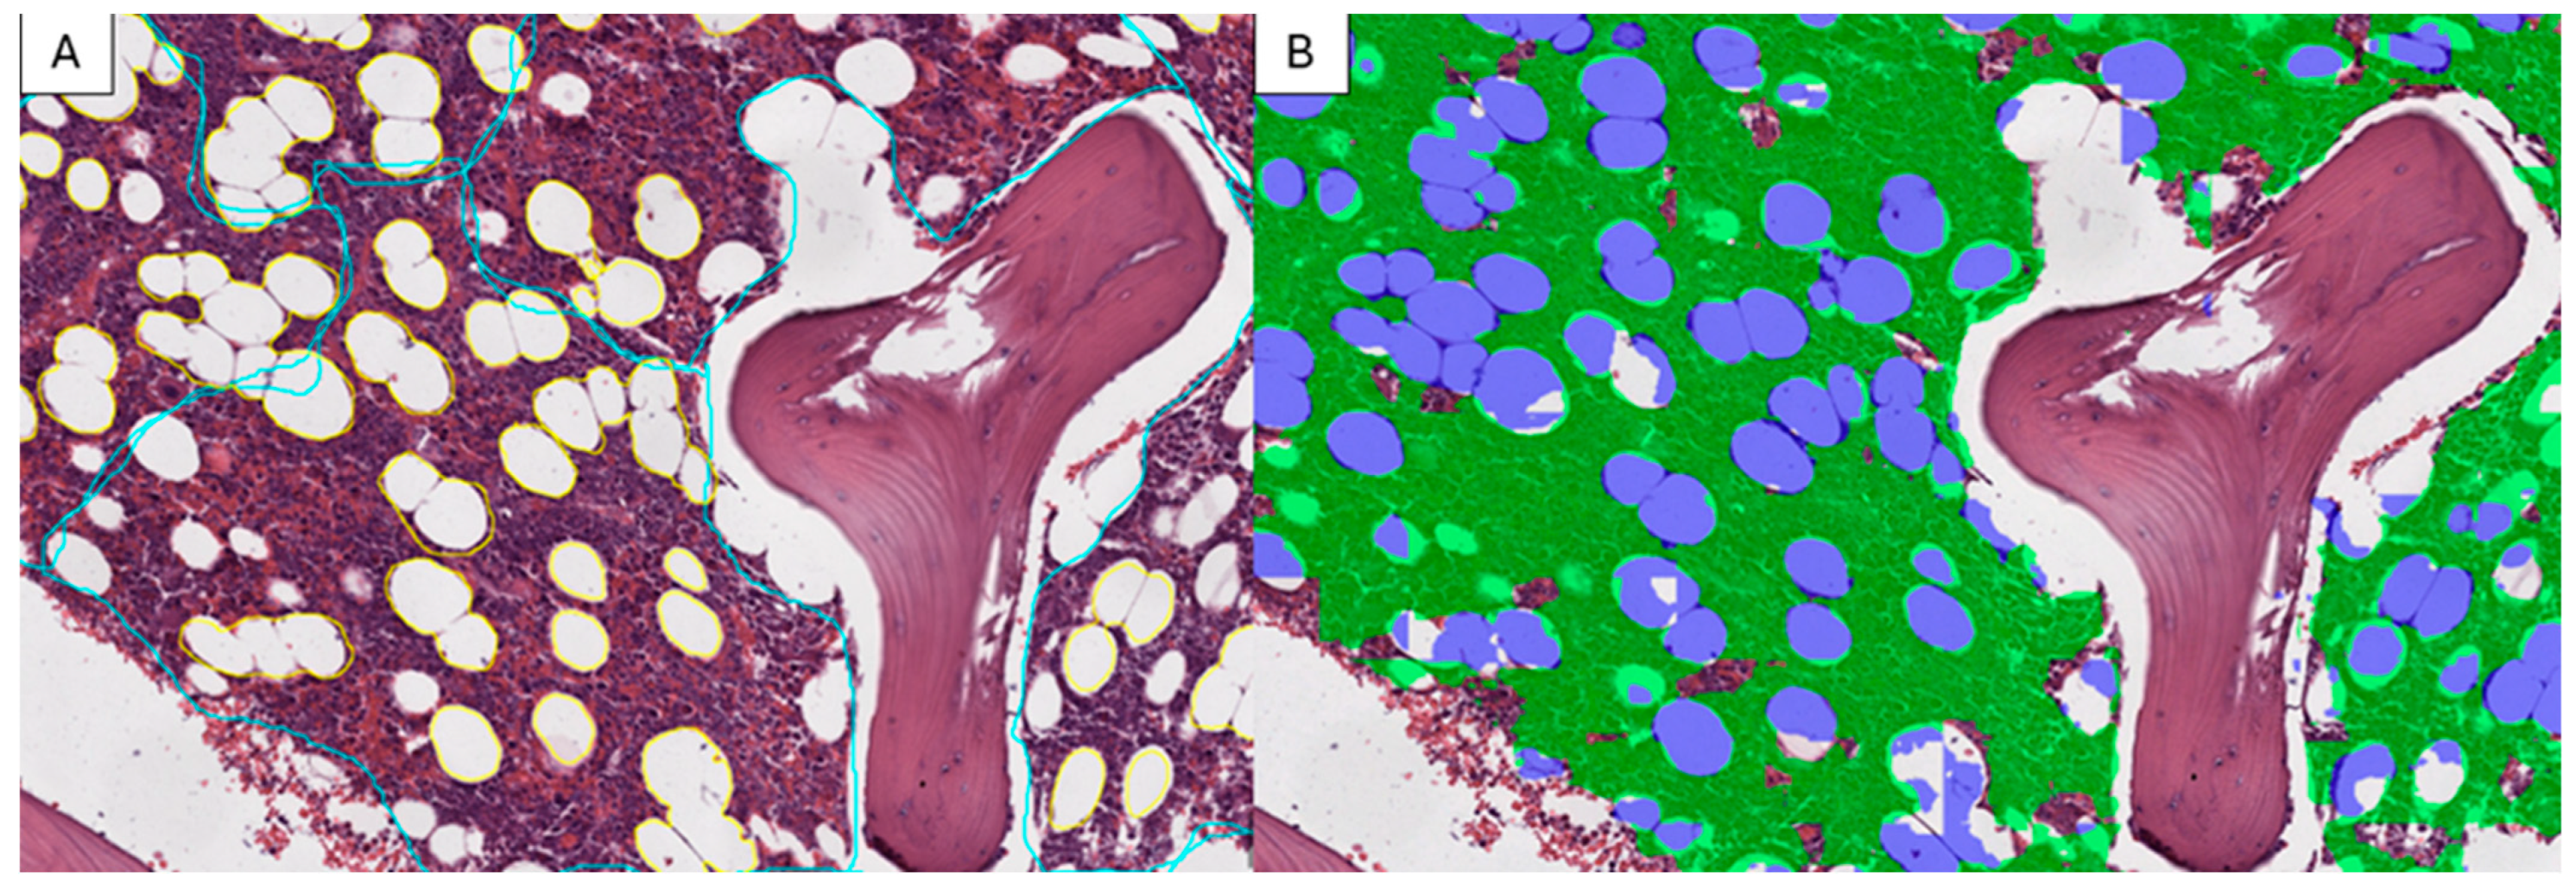
2.3. Model Testing
2.4. Statistical Analysis
2.5. Hardware and Software
3. Results
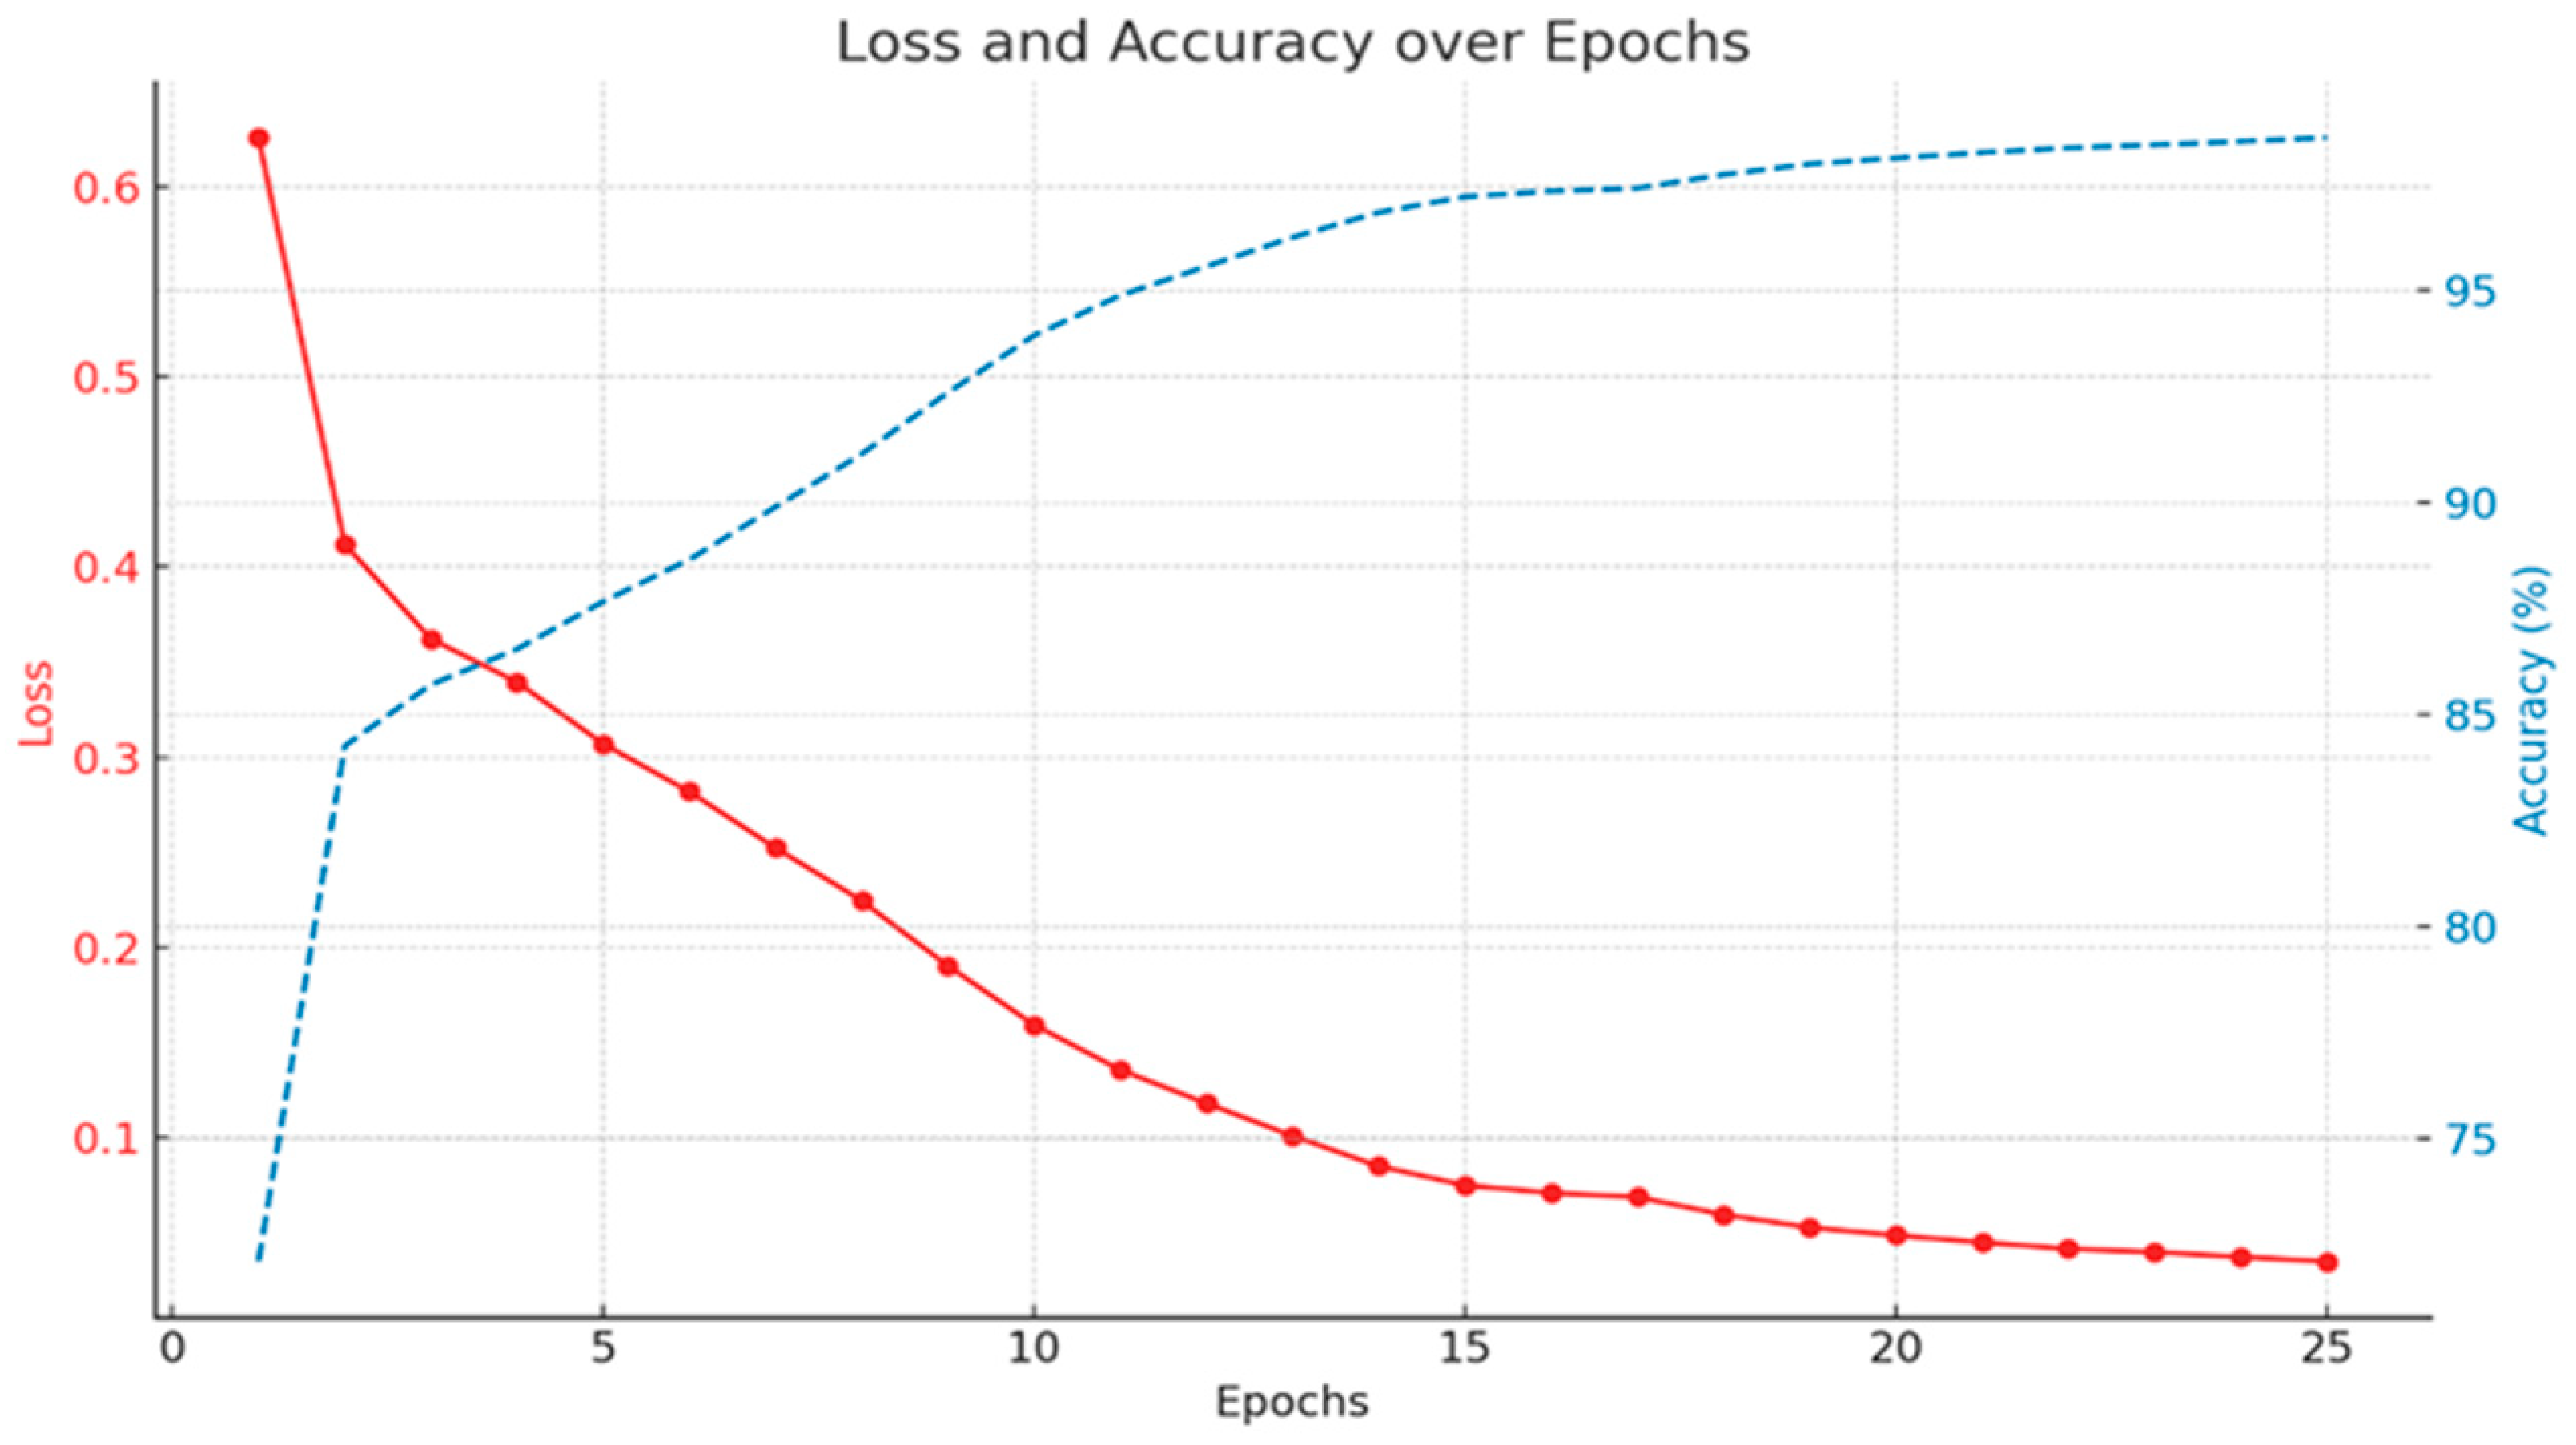
3.1. Model Training
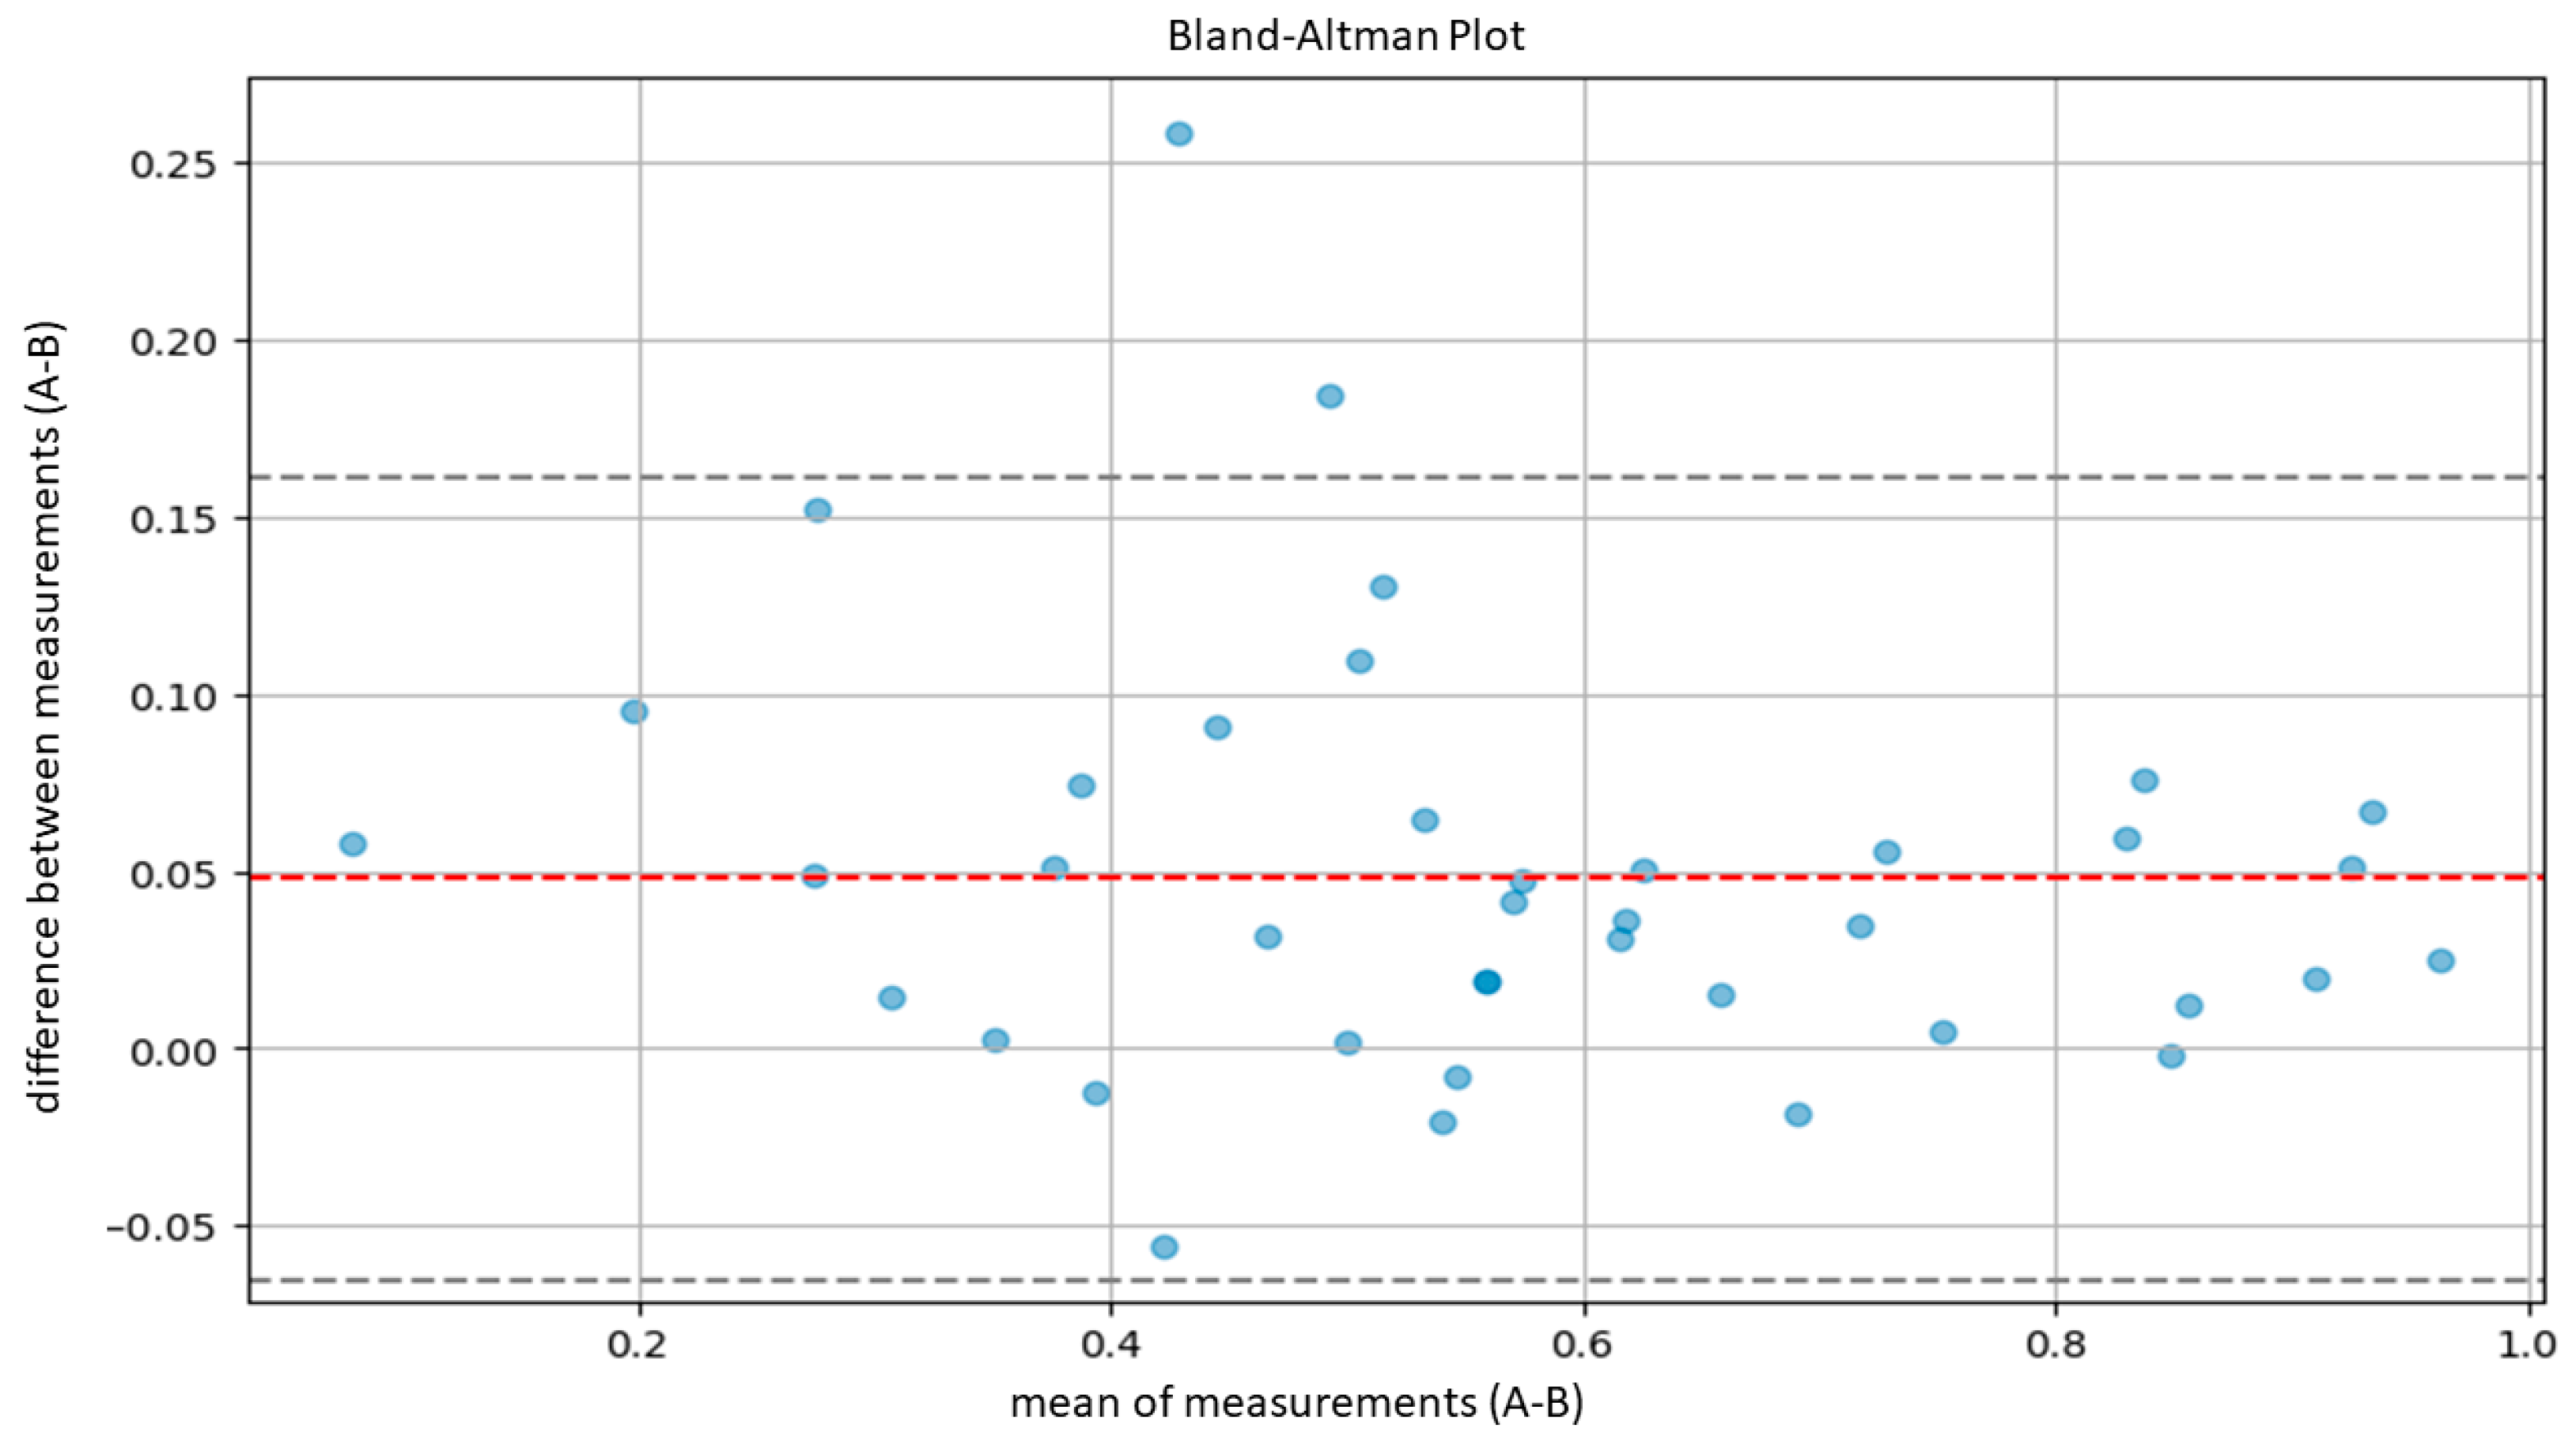
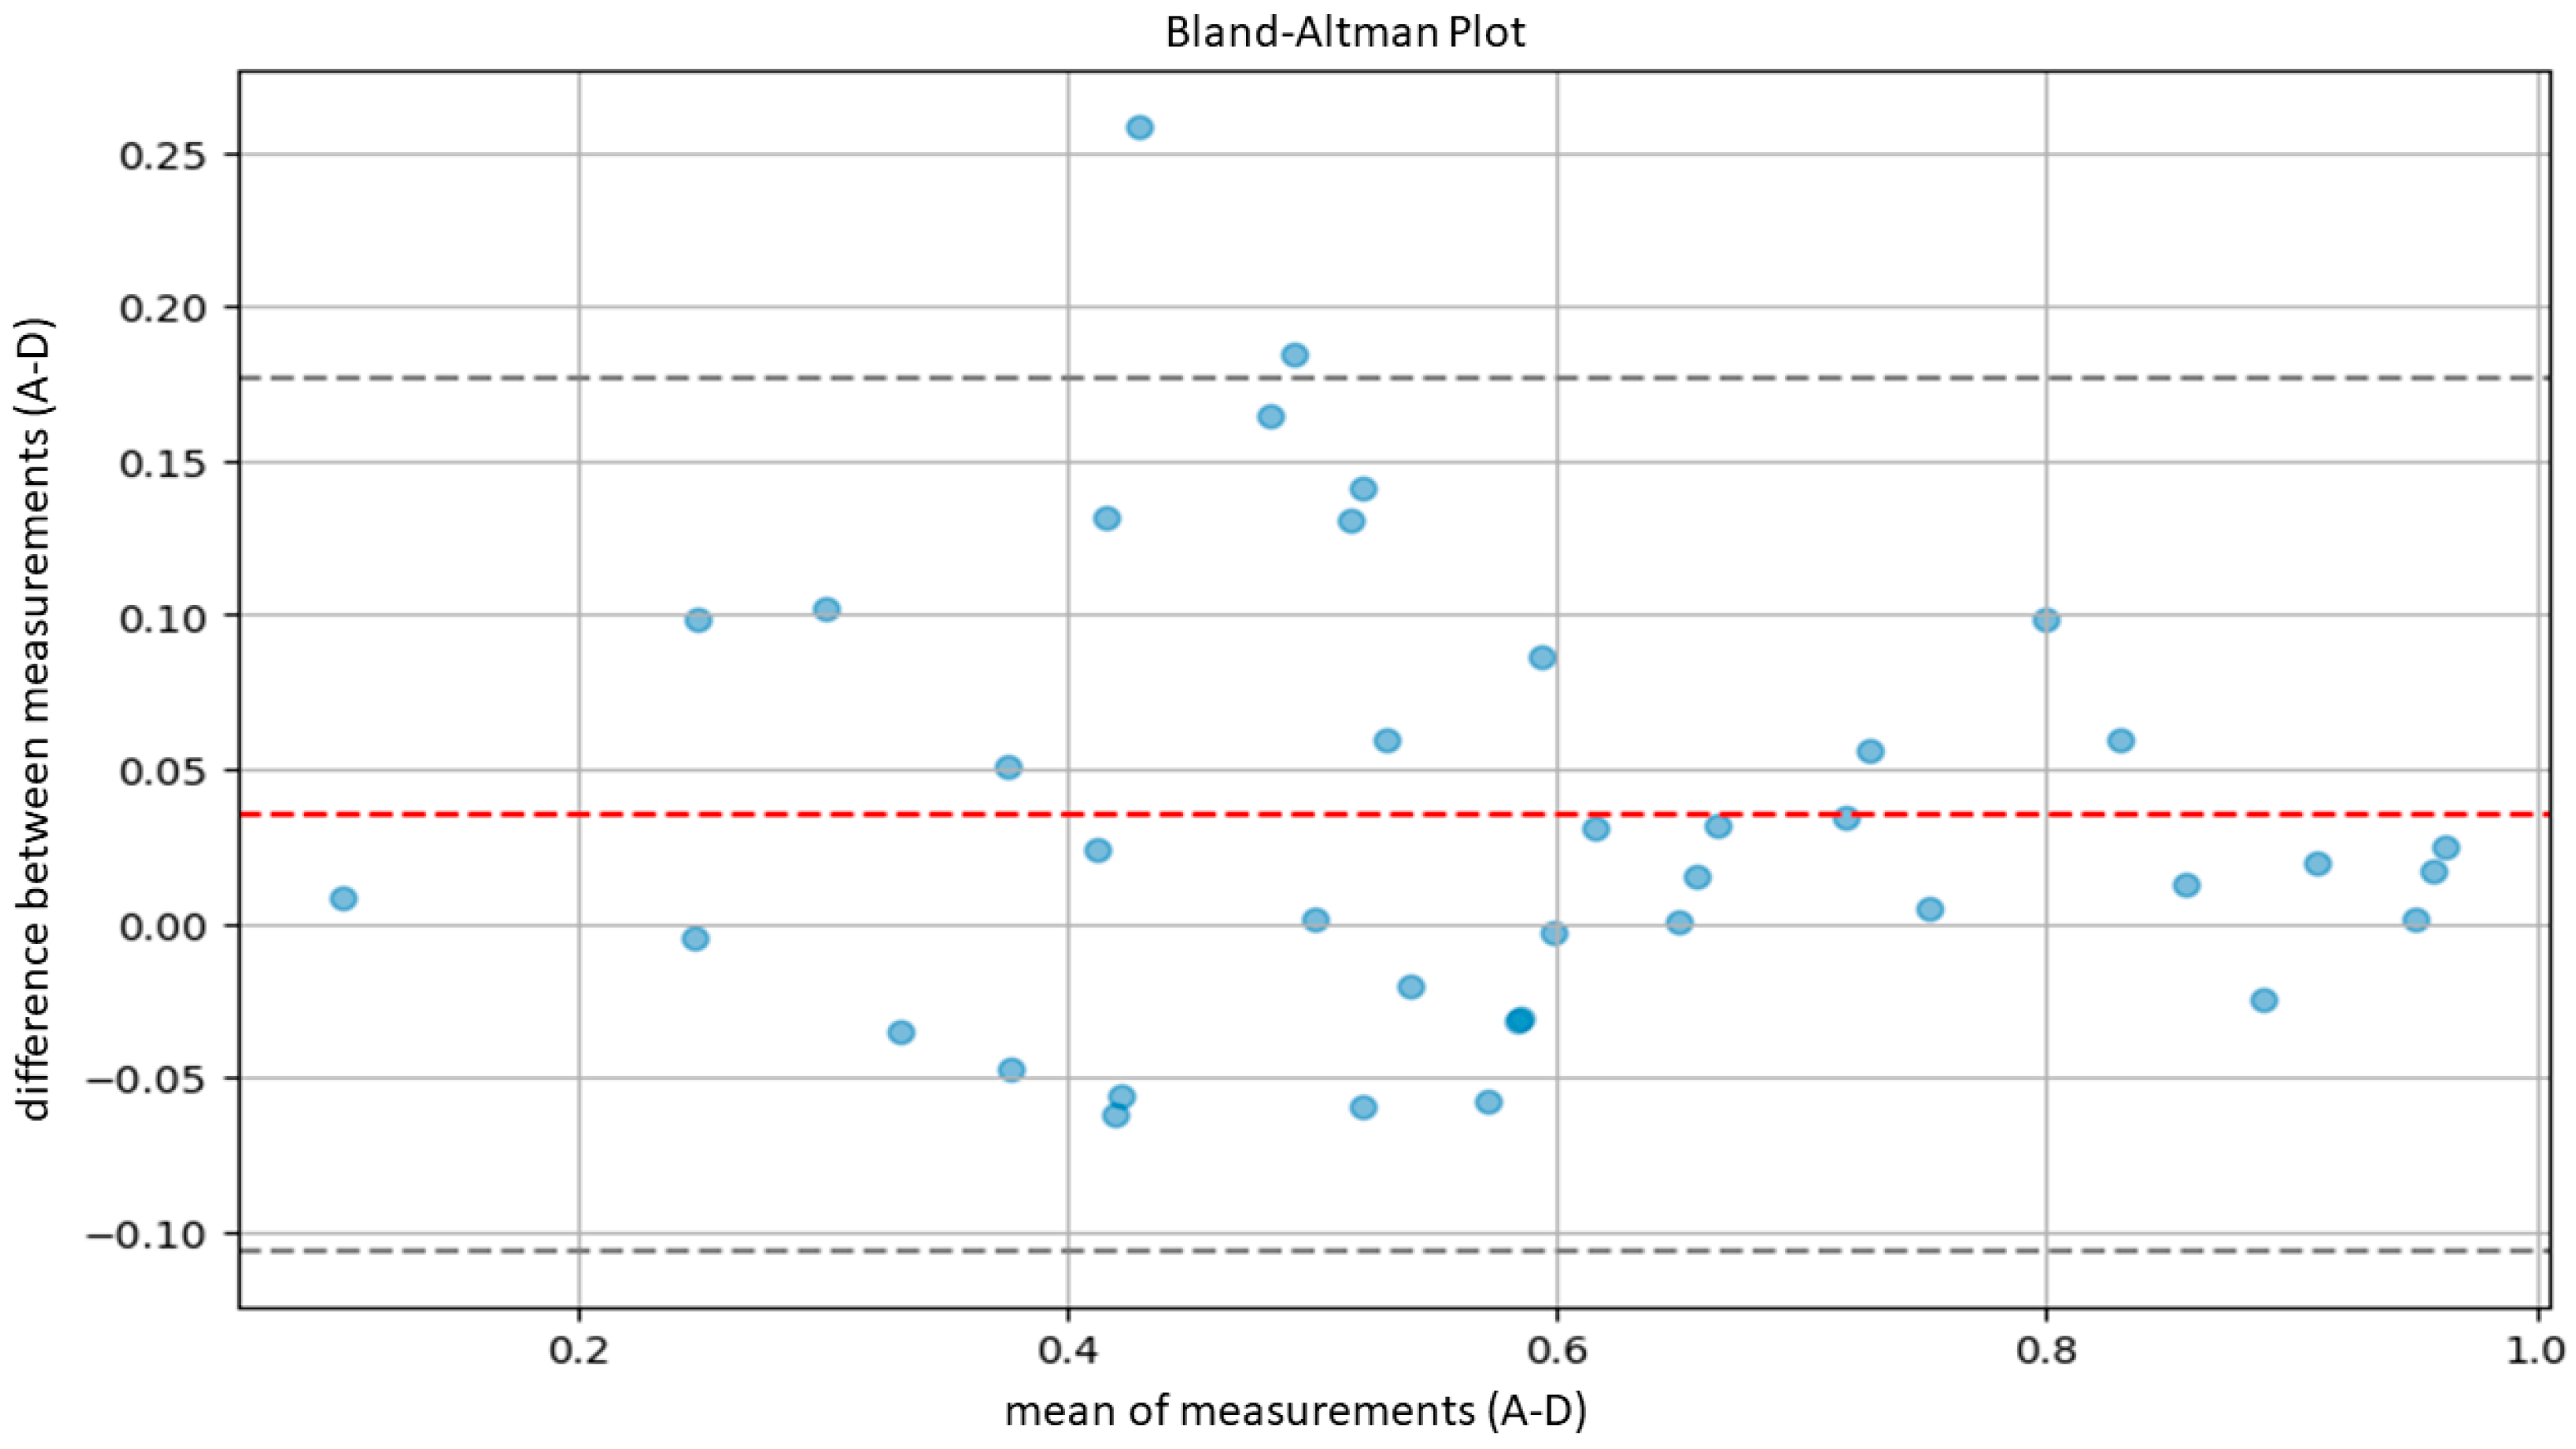
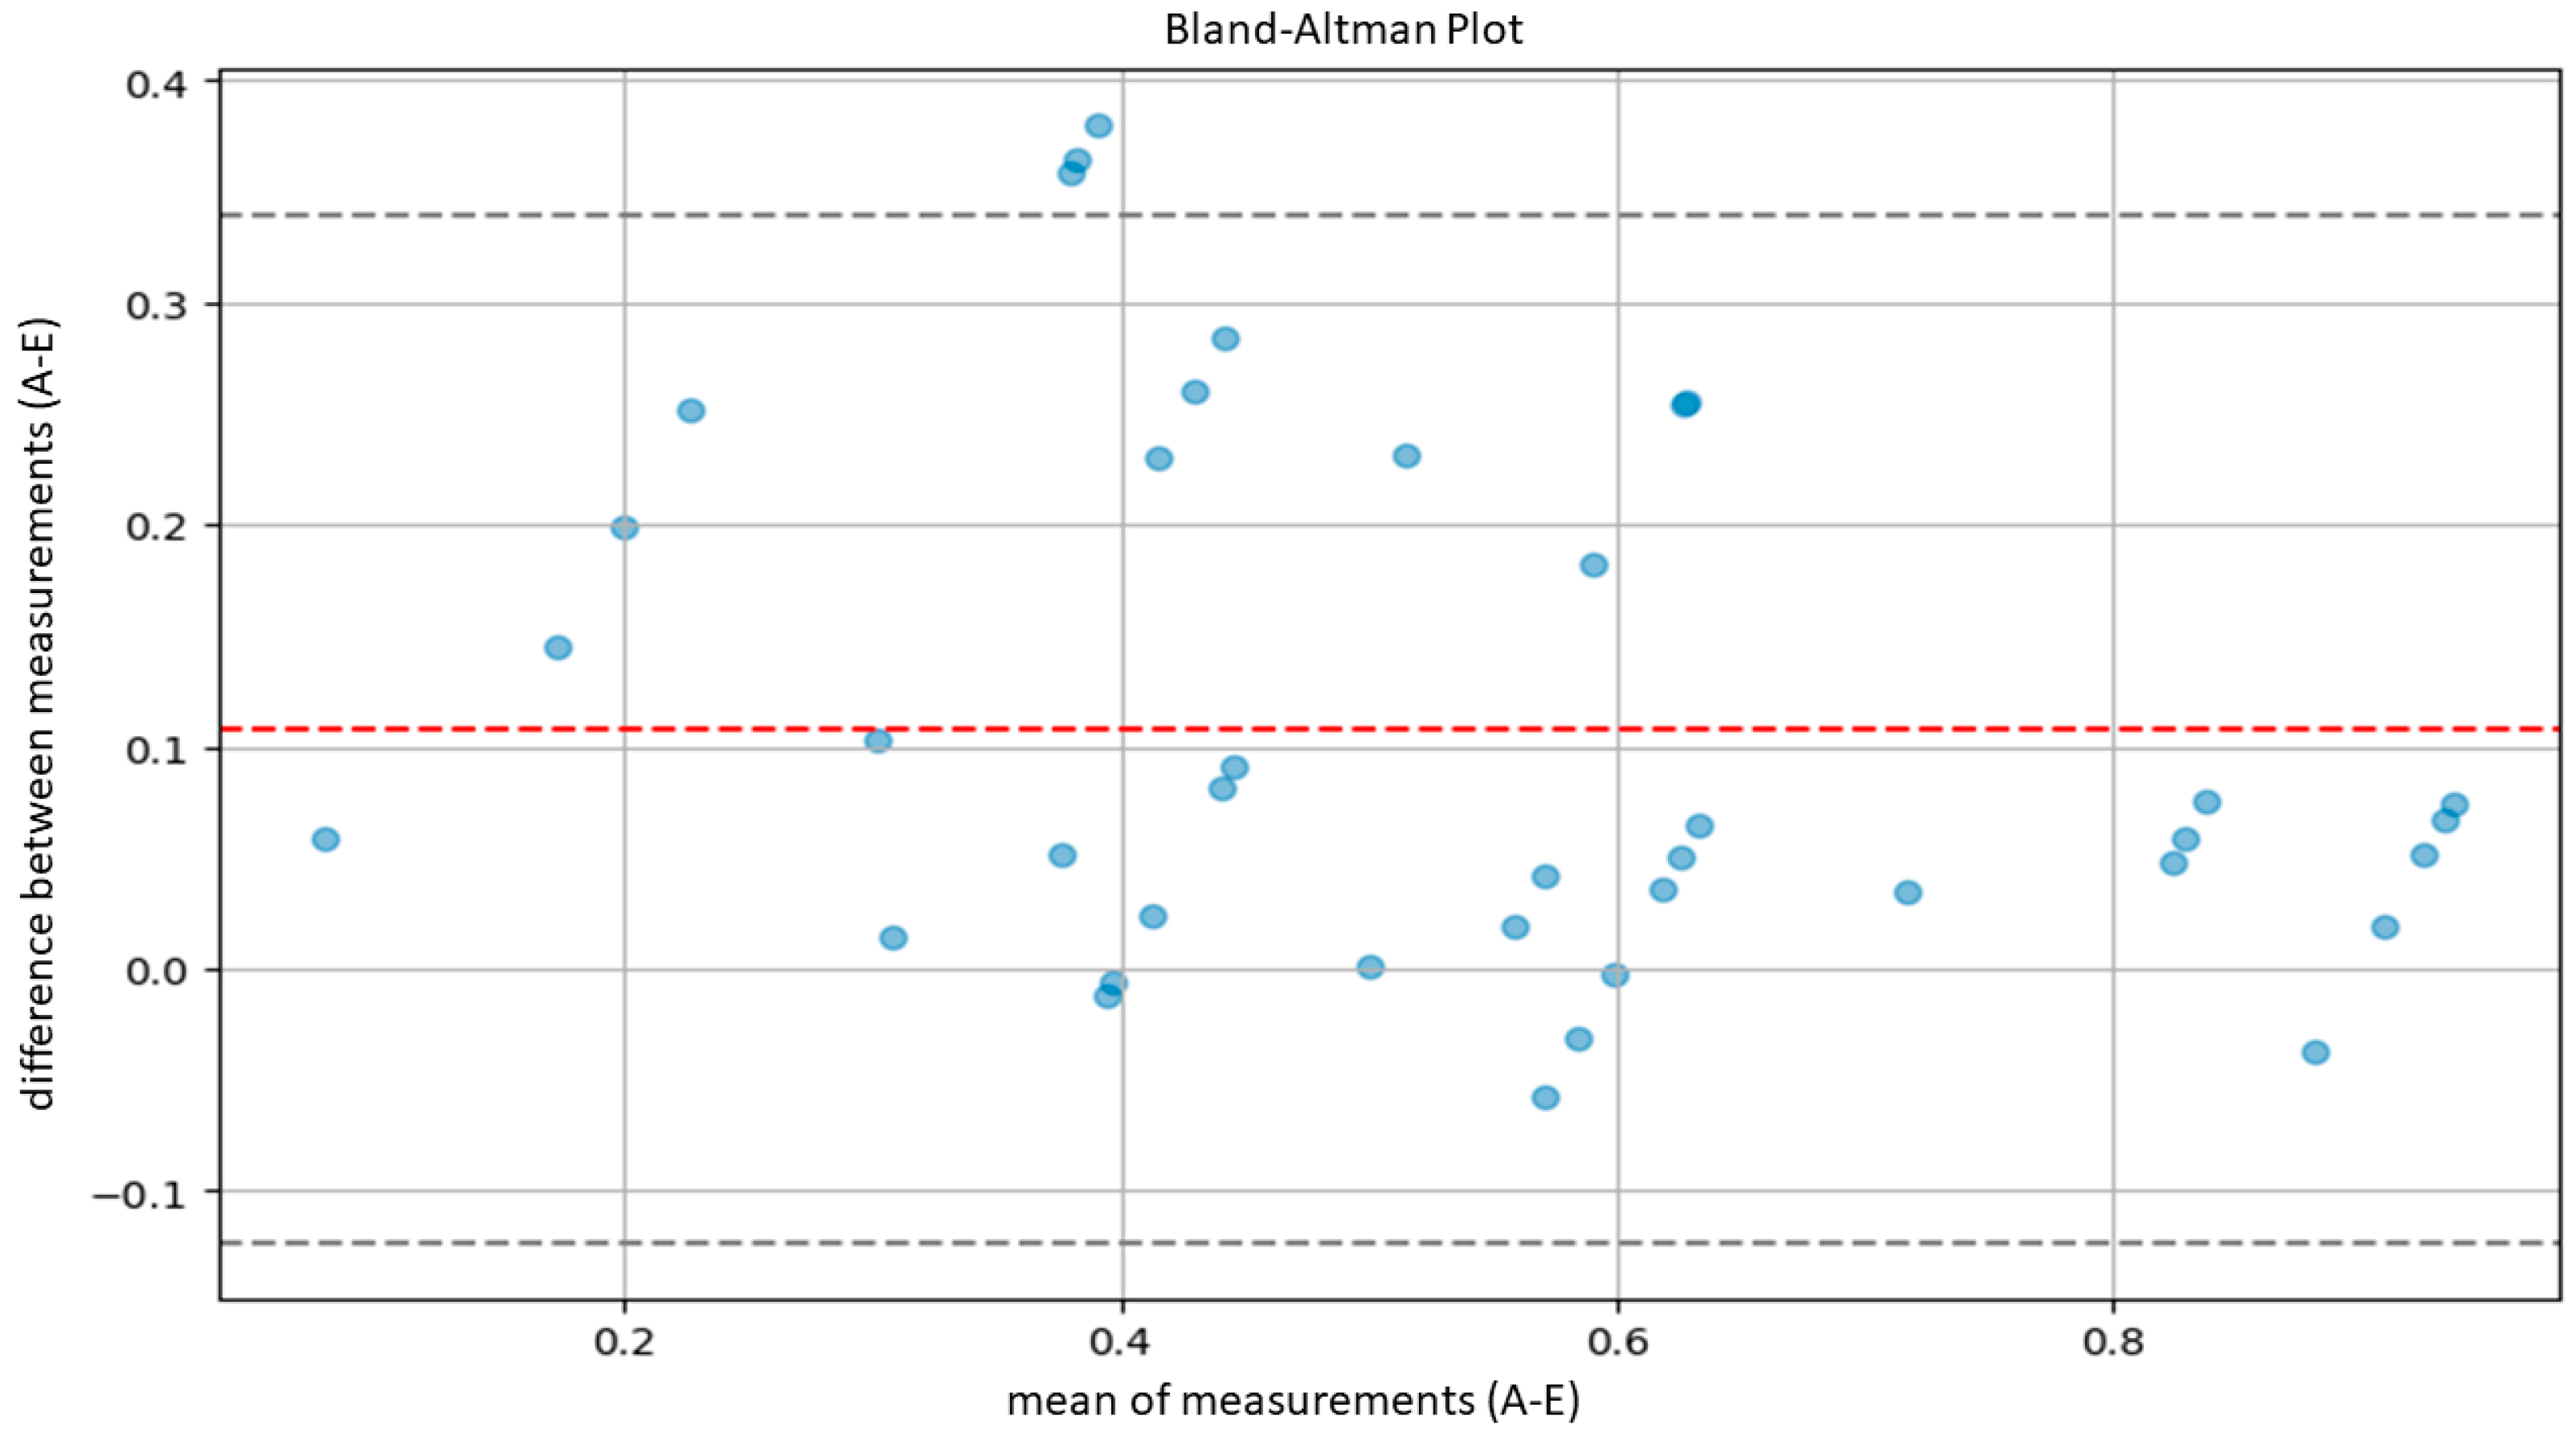
3.2. Model Validation
4. Discussion
5. Conclusions
Author Contributions
Funding
Institutional Review Board Statement
Informed Consent Statement
Data Availability Statement
Acknowledgments
Conflicts of Interest
References
- Angrisani, L.; Annuzzi, G.; Arpaia, P.; Bozzetto, L.; Cataldo, A.; Corrado, A.; De Benedetto, E.; Di Capua, V.; Prevete, R.; Vallefuoco, E. Neural Network-Based Prediction and Monitoring of Blood Glucose Response to Nutritional Factors in Type-1 Diabetes. In Proceedings of the 2022 IEEE International Instrumentation and Measurement Technology Conference (I2MTC), Ottawa, ON, Canada, 16–19 May 2022; pp. 1–6. [Google Scholar]
- Nartowt, B.J.; Hart, G.R.; Muhammad, W.; Liang, Y.; Stark, G.F.; Deng, J. Robust Machine Learning for Colorectal Cancer Risk Prediction and Stratification. Front. Big Data 2020, 3, 6. [Google Scholar] [CrossRef] [PubMed]
- Technical Performance Assessment of Digital Pathology Whole Slide Imaging Devices—Guidance for Industry and Food and Drug Administration Staff. Available online: https://www.fda.gov/media/90791/download?attachment (accessed on 17 March 2024).
- García-Rojo, M.; De Mena, D.; Muriel-Cueto, P.; Atienza-Cuevas, L.; Domínguez-Gómez, M.; Bueno, G. New European Union Regulations Related to Whole Slide Image Scanners and Image Analysis Software. J. Pathol. Inform. 2019, 10, 2. [Google Scholar] [CrossRef]
- Pantanowitz, L.; Hartman, D.; Qi, Y.; Cho, E.Y.; Suh, B.; Paeng, K.; Dhir, R.; Michelow, P.; Hazelhurst, S.; Song, S.Y.; et al. Accuracy and Efficiency of an Artificial Intelligence Tool When Counting Breast Mitoses. Diagn. Pathol. 2020, 15, 80. [Google Scholar] [CrossRef] [PubMed]
- Whitney, J.; Corredor, G.; Janowczyk, A.; Ganesan, S.; Doyle, S.; Tomaszewski, J.; Feldman, M.; Gilmore, H.; Madabhushi, A. Quantitative Nuclear Histomorphometry Predicts Oncotype DX Risk Categories for Early Stage ER+ Breast Cancer. BMC Cancer 2018, 18, 610. [Google Scholar] [CrossRef]
- Najdawi, F.; Sucipto, K.; Mistry, P.; Hennek, S.; Jayson, C.K.B.; Lin, M.; Fahy, D.; Kinsey, S.; Wapinski, I.; Beck, A.H.; et al. Artificial Intelligence Enables Quantitative Assessment of Ulcerative Colitis Histology. Mod. Pathol. 2023, 36, 100124. [Google Scholar] [CrossRef]
- Food and Drug Administration Approval for PAIG Prostate. Available online: https://www.fda.gov/news-events/press-announcements/fda-authorizes-software-can-help-identify-prostate-cancer (accessed on 1 March 2024).
- Shrestha, P.; Kneepkens, R.; Vrijnsen, J.; Vossen, D.; Abels, E.; Hulsken, B. A Quantitative Approach to Evaluate Image Quality of Whole Slide Imaging Scanners. J. Pathol. Inform. 2016, 7, 56. [Google Scholar] [CrossRef] [PubMed]
- Duenweg, S.R.; Bobholz, S.A.; Lowman, A.K.; Stebbins, M.A.; Winiarz, A.; Nath, B.; Kyereme, F.; Iczkowski, K.A.; LaViolette, P.S. Whole Slide Imaging (WSI) Scanner Differences Influence Optical and Computed Properties of Digitized Prostate Cancer Histology. J. Pathol. Inform. 2023, 14, 100321. [Google Scholar] [CrossRef]
- WHO Classification of Tumours Editorial Board. Haematolymphoid Tumors, 5th ed.; WHO Classification of Tumours Series; [Internet; beta version ahead of print]; International Agency for Research on Cancer: Lyon, France, 2022; Volume 11. Available online: https://tumourclassification.iarc.who.int/chapters/63 (accessed on 22 July 2023).
- Wilkins, B.S.; Erber, W.N.; Bareford, D.; Buck, G.; Wheatley, K.; East, C.L.; Paul, B.; Harrison, C.N.; Green, A.R.; Campbell, P.J. Bone Marrow Pathology in Essential Thrombocythemia: Interobserver Reliability and Utility for Identifying Disease Subtypes. Blood 2008, 111, 60–70. [Google Scholar] [CrossRef]
- Pozdnyakova, O.; Rodig, S.; Bhandarkar, S.; Wu, K.; Thiele, J.; Hasserjian, R. The Importance of Central Pathology Review in International Trials: A Comparison of Local versus Central Bone Marrow Reticulin Grading. Leukemia 2015, 29, 241–244. [Google Scholar] [CrossRef]
- Kvasnicka, H.M.; Thiele, J.; Bueso-Ramos, C.E.; Sun, W.; Cortes, J.; Kantarjian, H.M.; Verstovsek, S. Long-Term Effects of Ruxolitinib versus Best Available Therapy on Bone Marrow Fibrosis in Patients with Myelofibrosis. J. Hematol. Oncol. 2018, 11, 42. [Google Scholar] [CrossRef]
- Ng, W.Y.; Erber, W.N.; Grigg, A.; Dunne, K.; Perkins, A.; Forsyth, C.; Ross, D.M. Variability of Bone Marrow Biopsy Reporting Affects Accuracy of Diagnosis of Myeloproliferative Neoplasms: Data from the ALLG MPN01 Registry. Pathology 2023, 56, 75–80. [Google Scholar] [CrossRef] [PubMed]
- Hebeda, K. Necrosis, Stromal Changes and Artefacts. In Diagnostic Bone Marrow Haematopathology; Cambridge University Press: Cambridge, UK, 2020; pp. 26–41. [Google Scholar]
- Madelung, A.B.; Bondo, H.; Stamp, I.; Loevgreen, P.; Nielsen, S.L.; Falensteen, A.; Knudsen, H.; Ehinger, M.; Dahl-Sørensen, R.; Mortensen, N.B.; et al. World Health Organization-defined Classification of Myeloproliferative Neoplasms: Morphological Reproducibility and Clinical Correlations—The Danish Experience. Am. J. Hematol. 2013, 88, 1012–1016. [Google Scholar] [CrossRef] [PubMed]
- Alvarez-Larrán, A.; Ancochea, A.; García, M.; Climent, F.; García-Pallarols, F.; Angona, A.; Senín, A.; Barranco, C.; Martínez-Avilés, L.; Serrano, S.; et al. WHO-histological Criteria for Myeloproliferative Neoplasms: Reproducibility, Diagnostic Accuracy and Correlation with Gene Mutations and Clinical Outcomes. Br. J. Haematol. 2014, 166, 911–919. [Google Scholar] [CrossRef] [PubMed]
- Buhr, T.; Hebeda, K.; Kaloutsi, V.; Porwit, A.; Van der Walt, J.; Kreipe, H. European Bone Marrow Working Group Trial on Reproducibility of World Health Organization Criteria to Discriminate Essential Thrombocythemia from Prefibrotic Primary Myelofibrosis. Haematologica 2012, 97, 360–365. [Google Scholar] [CrossRef] [PubMed]
- Kim, I.; Kang, K.; Song, Y.; Kim, T.-J. Application of Artificial Intelligence in Pathology: Trends and Challenges. Diagnostics 2022, 12, 2794. [Google Scholar] [CrossRef] [PubMed]
- Sarwar, S.; Dent, A.; Faust, K.; Richer, M.; Djuric, U.; Van Ommeren, R.; Diamandis, P. Physician Perspectives on Integration of Artificial Intelligence into Diagnostic Pathology. NPJ Digit. Med. 2019, 2, 28. [Google Scholar] [CrossRef] [PubMed]
- Hassell, L.A.; Absar, S.F.; Chauhan, C.; Dintzis, S.; Farver, C.F.; Fathima, S.; Glassy, E.F.; Goldstein, J.A.; Gullapalli, R.; Ho, J.; et al. Pathology Education Powered by Virtual and Digital Transformation: Now and the Future. Arch. Pathol. Lab. Med. 2023, 147, 474–491. [Google Scholar] [CrossRef]
- Nielsen, F.S.; Pedersen, M.J.; Olsen, M.V.; Larsen, M.S.; Røge, R.; Jørgensen, A.S. Automatic Bone Marrow Cellularity Estimation in H&E Stained Whole Slide Images. Cytom. Part A 2019, 95, 1066–1074. [Google Scholar] [CrossRef] [PubMed]
- van Eekelen, L.; Pinckaers, H.; van den Brand, M.; Hebeda, K.M.; Litjens, G. Using Deep Learning for Quantification of Cellularity and Cell Lineages in Bone Marrow Biopsies and Comparison to Normal Age-Related Variation. Pathology 2022, 54, 318–327. [Google Scholar] [CrossRef]
- Bankhead, P.; Loughrey, M.B.; Fernández, J.A.; Dombrowski, Y.; McArt, D.G.; Dunne, P.D.; McQuaid, S.; Gray, R.T.; Murray, L.J.; Coleman, H.G.; et al. QuPath: Open Source Software for Digital Pathology Image Analysis. Sci. Rep. 2017, 7, 16878. [Google Scholar] [CrossRef]
- Pettersen, H.S.; Belevich, I.; Røyset, E.S.; Smistad, E.; Simpson, M.R.; Jokitalo, E.; Reinertsen, I.; Bakke, I.; Pedersen, A. Code-Free Development and Deployment of Deep Segmentation Models for Digital Pathology. Front. Med. 2022, 8, 816281. [Google Scholar] [CrossRef] [PubMed]
- Smistad, E.; Bozorgi, M.; Lindseth, F. FAST: Framework for Heterogeneous Medical Image Computing and Visualization. Int. J. Comput. Assist. Radiol. Surg. 2015, 10, 1811–1822. [Google Scholar] [CrossRef] [PubMed]
- Lin, L.I. A Concordance Correlation Coefficient to Evaluate Reproducibility. Biometrics 1989, 45, 255–268. [Google Scholar] [CrossRef] [PubMed]
- Altman, D.G. Practical Statistics for Medical Research; Chapman and Hall/CRC: Boca Raton, FL, USA, 1990; ISBN 9780429258589. [Google Scholar]
- Bland, J.M.; Altman, D.G. Statistical Methods for Assessing Agreement between Two Methods of Clinical Measurement. Lancet 1986, 1, 307–310. [Google Scholar] [CrossRef]
- Guan, Q.; Wan, X.; Lu, H.; Ping, B.; Li, D.; Wang, L.; Zhu, Y.; Wang, Y.; Xiang, J. Deep Convolutional Neural Network Inception-v3 Model for Differential Diagnosing of Lymph Node in Cytological Images: A Pilot Study. Ann. Transl. Med. 2019, 7, 307. [Google Scholar] [CrossRef] [PubMed]
- Sarkis, R.; Burri, O.; Royer-Chardon, C.; Schyrr, F.; Blum, S.; Costanza, M.; Cherix, S.; Piazzon, N.; Barcena, C.; Bisig, B.; et al. MarrowQuant 2.0: A Digital Pathology Workflow Assisting Bone Marrow Evaluation in Experimental and Clinical Hematology. Mod. Pathol. 2023, 36, 100088. [Google Scholar] [CrossRef] [PubMed]
- Dy, A.; Nguyen, N.-N.J.; Meyer, J.; Dawe, M.; Shi, W.; Androutsos, D.; Fyles, A.; Liu, F.-F.; Done, S.; Khademi, A. AI Improves Accuracy, Agreement and Efficiency of Pathologists for Ki67 Assessments in Breast Cancer. Sci. Rep. 2024, 14, 1283. [Google Scholar] [CrossRef]
- Steiner, D.F.; Nagpal, K.; Sayres, R.; Foote, D.J.; Wedin, B.D.; Pearce, A.; Cai, C.J.; Winter, S.R.; Symonds, M.; Yatziv, L.; et al. Evaluation of the Use of Combined Artificial Intelligence and Pathologist Assessment to Review and Grade Prostate Biopsies. JAMA Netw. Open 2020, 3, e2023267. [Google Scholar] [CrossRef]


| Couple of Pathologist | Lin’s Concordance Correlation Coefficient | Confidence Interval |
|---|---|---|
| B-C | 0.887 | 0.789, 0.938 |
| B-D | 0.967 | 0.941, 0.982 |
| B-E | 0.886 | 0.788, 0.944 |
| B-F | 0.899 | 0.813, 0.944 |
| C-D | 0.877 | 0.784, 0.925 |
| C-E | 0.951 | 0.906, 0.973 |
| C-F | 0.773 | 0.663, 0.860 |
| D-E | 0.878 | 0.794, 0.929 |
| D-F | 0.902 | 0.715, 0.952 |
| E-F | 0.784 | 0.648, 0.873 |
| Lin’s Concordance Correlation Coefficient (CCC) | Confidence Interval | ||
|---|---|---|---|
| A-B | 0.9400 | 0.8736 | 0.9728 |
| A-C | 0.7918 | 0.6529 | 0.8774 |
| A-D | 0.9291 | 0.8560 | 0.9680 |
| A-E | 0.7785 | 0.6288 | 0.8759 |
| A-F | 0.9386 | 0.8813 | 0.9672 |
| A-G | 0.9170 | 0.8399 | 0.9622 |
| Lin’s Concordance Correlation Coefficient (CCC) | Confidence Interval | ||
|---|---|---|---|
| Model–Resident 1 | 0.659 | 0.508 | 0.771 |
| Model–Resident 2 | 0.721 | 0.546 | 0.845 |
| Model–Resident 3 | 0.615 | 0.432 | 0.755 |
| Model–mean of residents | 0.664 | 0.513 | 0.776 |
| Usability | Rapidity | Correctness | |
|---|---|---|---|
| User1 | 2 | 5 | 5 |
| User2 | 2 | 5 | 4 |
| User3 | 3 | 4 | 5 |
| Epredia WSI | Ventana WSI | |
|---|---|---|
| Slide 1 | 50.85% | 50.15% |
| Slide 2 | 64.98% | 65.05% |
| Slide 3 | 99.35% | 97.47% |
| Slide 4 | 58.62% | 59.14% |
| Slide 5 | 84.77% | 86.26% |
Disclaimer/Publisher’s Note: The statements, opinions and data contained in all publications are solely those of the individual author(s) and contributor(s) and not of MDPI and/or the editor(s). MDPI and/or the editor(s) disclaim responsibility for any injury to people or property resulting from any ideas, methods, instructions or products referred to in the content. |
© 2024 by the authors. Licensee MDPI, Basel, Switzerland. This article is an open access article distributed under the terms and conditions of the Creative Commons Attribution (CC BY) license (https://creativecommons.org/licenses/by/4.0/).
Share and Cite
D’Abbronzo, G.; D’Antonio, A.; De Chiara, A.; Panico, L.; Sparano, L.; Diluvio, A.; Sica, A.; Svanera, G.; Franco, R.; Ronchi, A. Development of an Artificial-Intelligence-Based Tool for Automated Assessment of Cellularity in Bone Marrow Biopsies in Ph-Negative Myeloproliferative Neoplasms. Cancers 2024, 16, 1687. https://0-doi-org.brum.beds.ac.uk/10.3390/cancers16091687
D’Abbronzo G, D’Antonio A, De Chiara A, Panico L, Sparano L, Diluvio A, Sica A, Svanera G, Franco R, Ronchi A. Development of an Artificial-Intelligence-Based Tool for Automated Assessment of Cellularity in Bone Marrow Biopsies in Ph-Negative Myeloproliferative Neoplasms. Cancers. 2024; 16(9):1687. https://0-doi-org.brum.beds.ac.uk/10.3390/cancers16091687
Chicago/Turabian StyleD’Abbronzo, Giuseppe, Antonio D’Antonio, Annarosaria De Chiara, Luigi Panico, Lucianna Sparano, Anna Diluvio, Antonello Sica, Gino Svanera, Renato Franco, and Andrea Ronchi. 2024. "Development of an Artificial-Intelligence-Based Tool for Automated Assessment of Cellularity in Bone Marrow Biopsies in Ph-Negative Myeloproliferative Neoplasms" Cancers 16, no. 9: 1687. https://0-doi-org.brum.beds.ac.uk/10.3390/cancers16091687