
Sex-Dependent Metabolic Effects in Diet-Induced Obese Rats following Intermittent Fasting Compared with Continuous Food Restriction
 , and
, and
Abstract
:1. Introduction
2. Materials and Methods
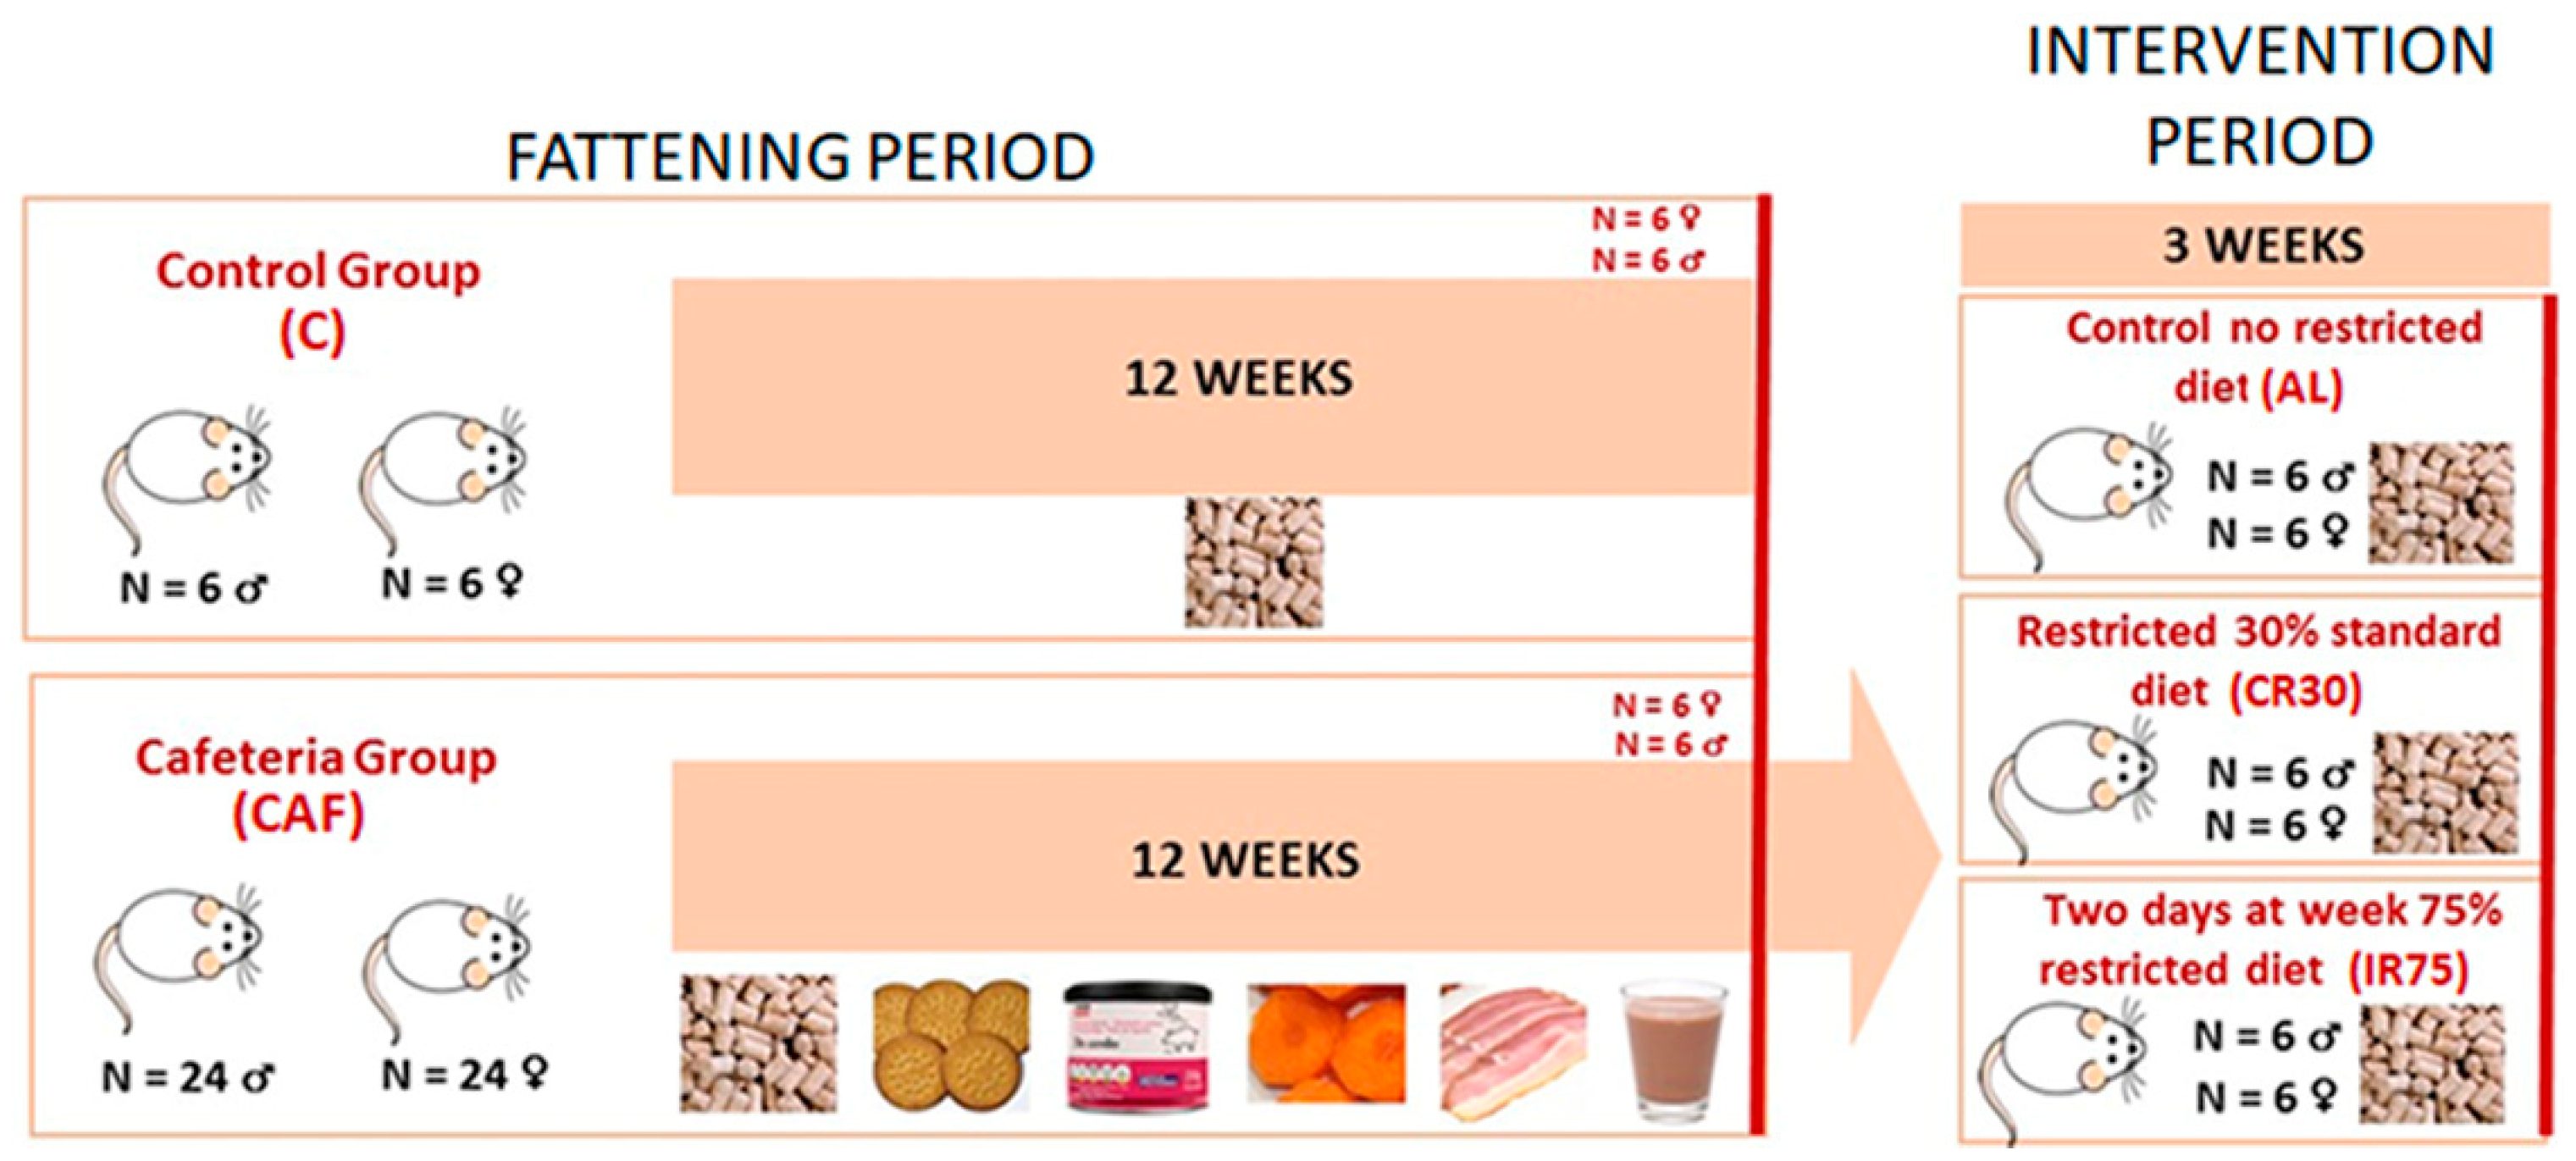
2.1. Animals and Experimental Design
2.2. Estimation of Energy Efficiency and Adiposity Index
2.3. Serum Metabolites, Liver Lipid and Glycogen Determinations
2.4. Gene Expression Analysis
2.5. Statistical Procedures
3. Results
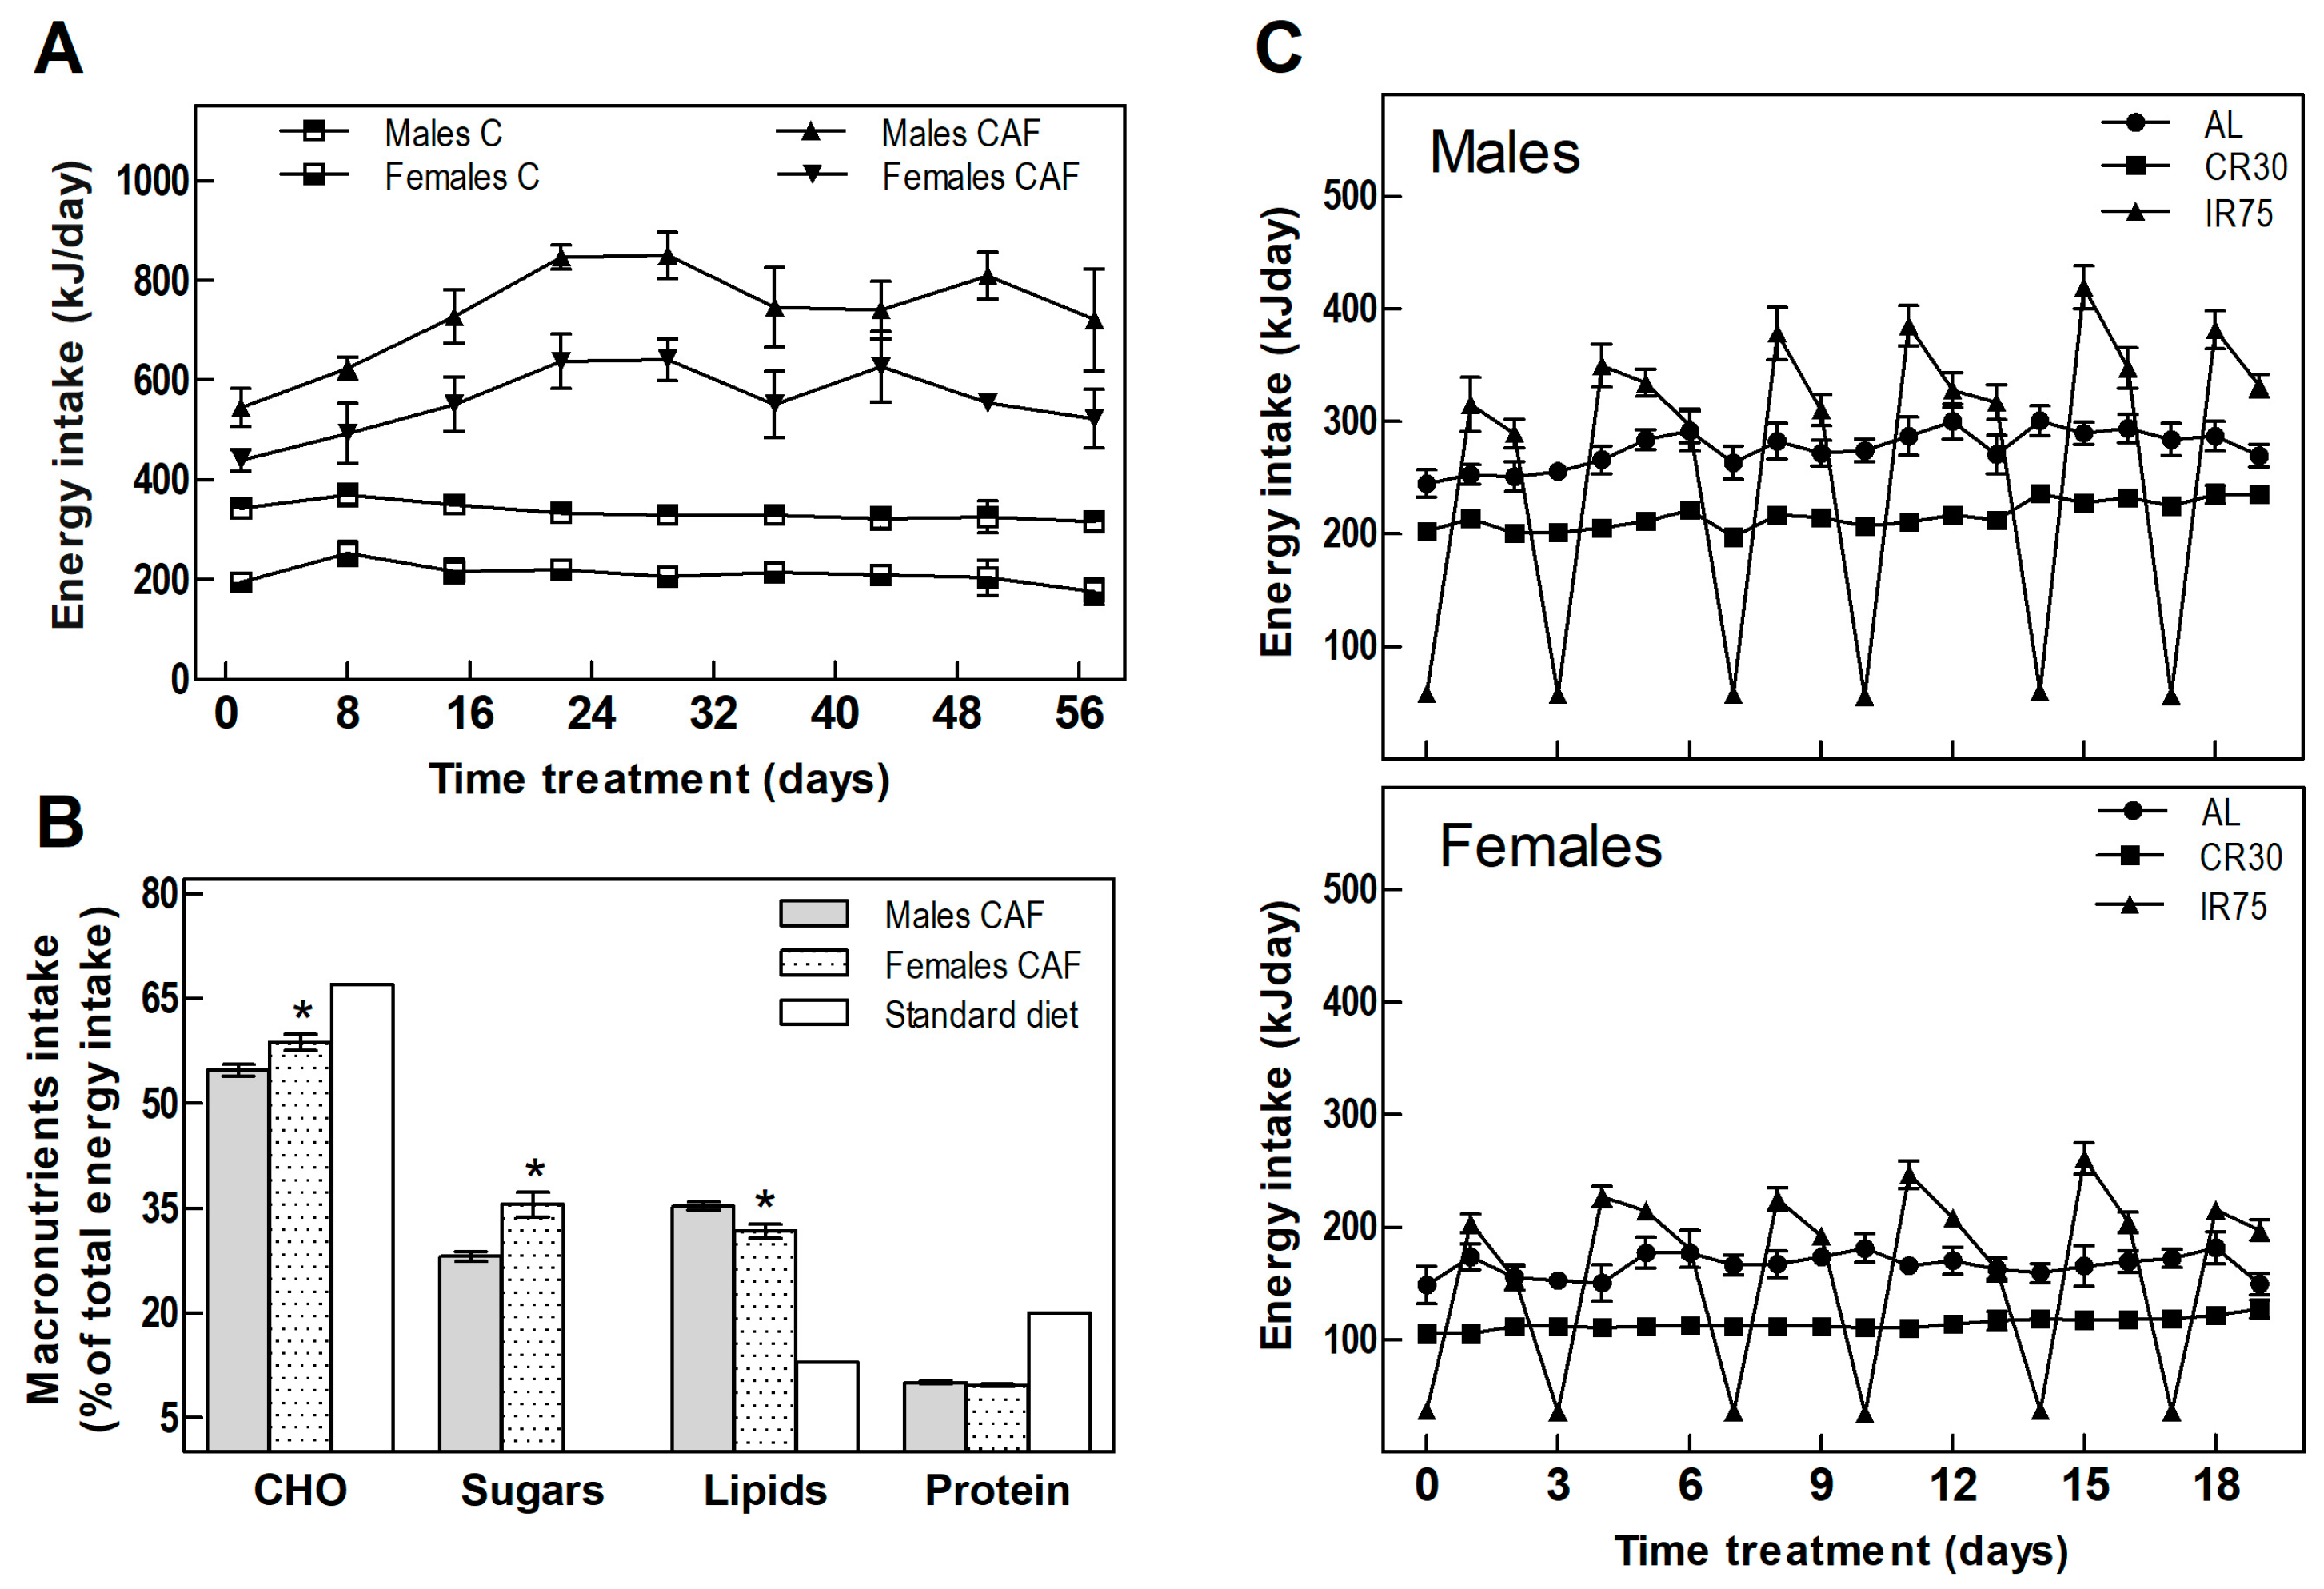
3.1. Food Intake
3.2. Body Weight
3.3. Energy Efficiency
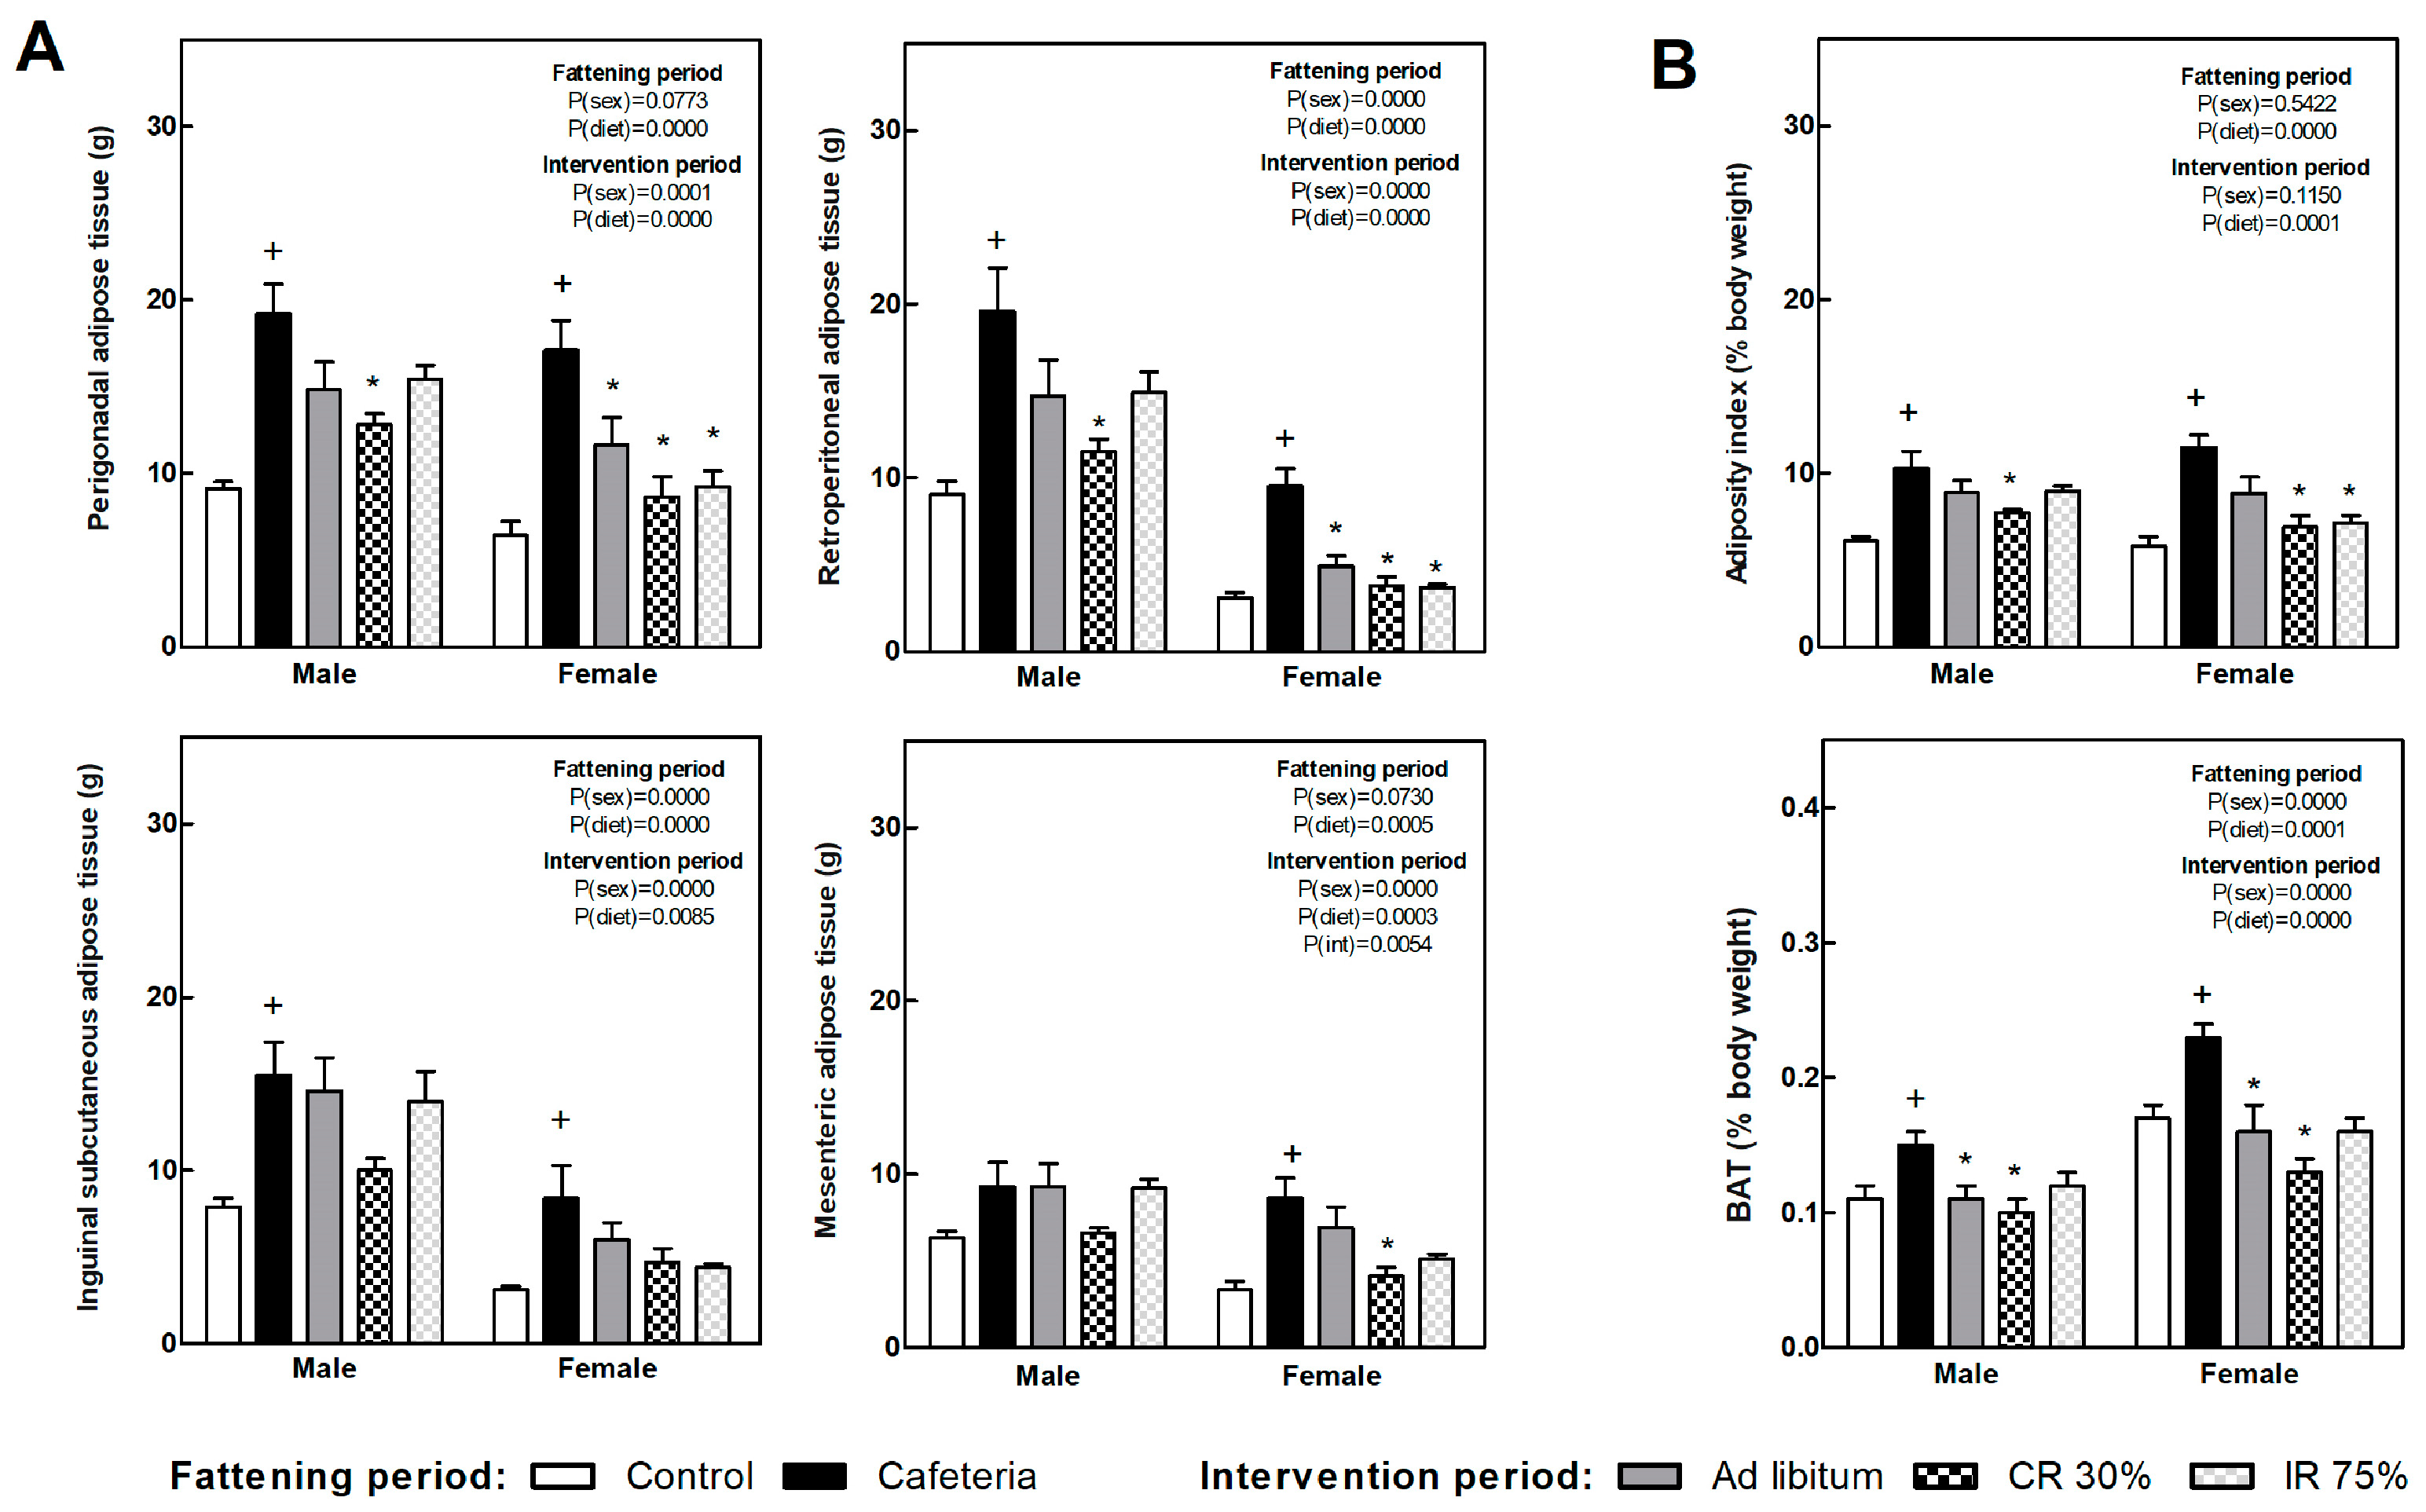
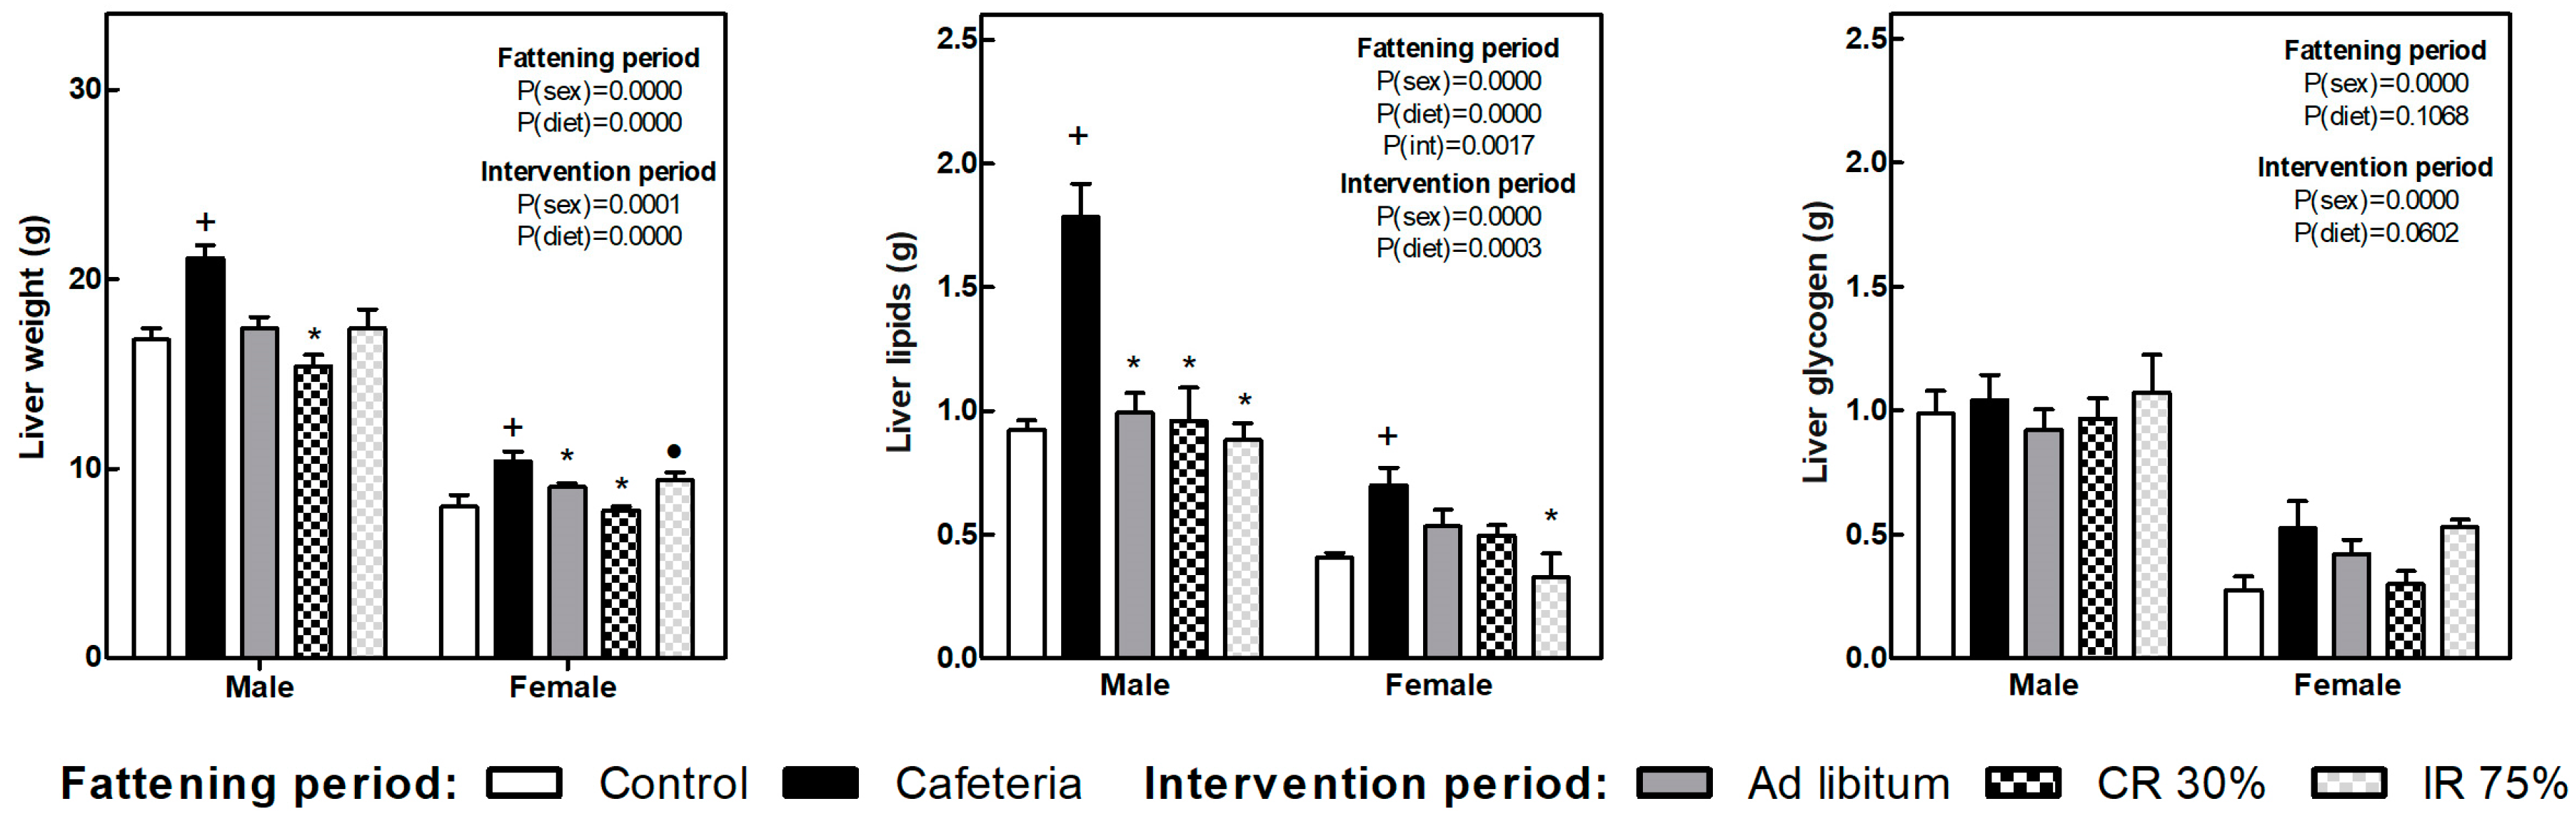
3.4. Fat Depots, Adiposity Index, and Liver Lipid and Glycogen Content
3.5. Serum Parameters
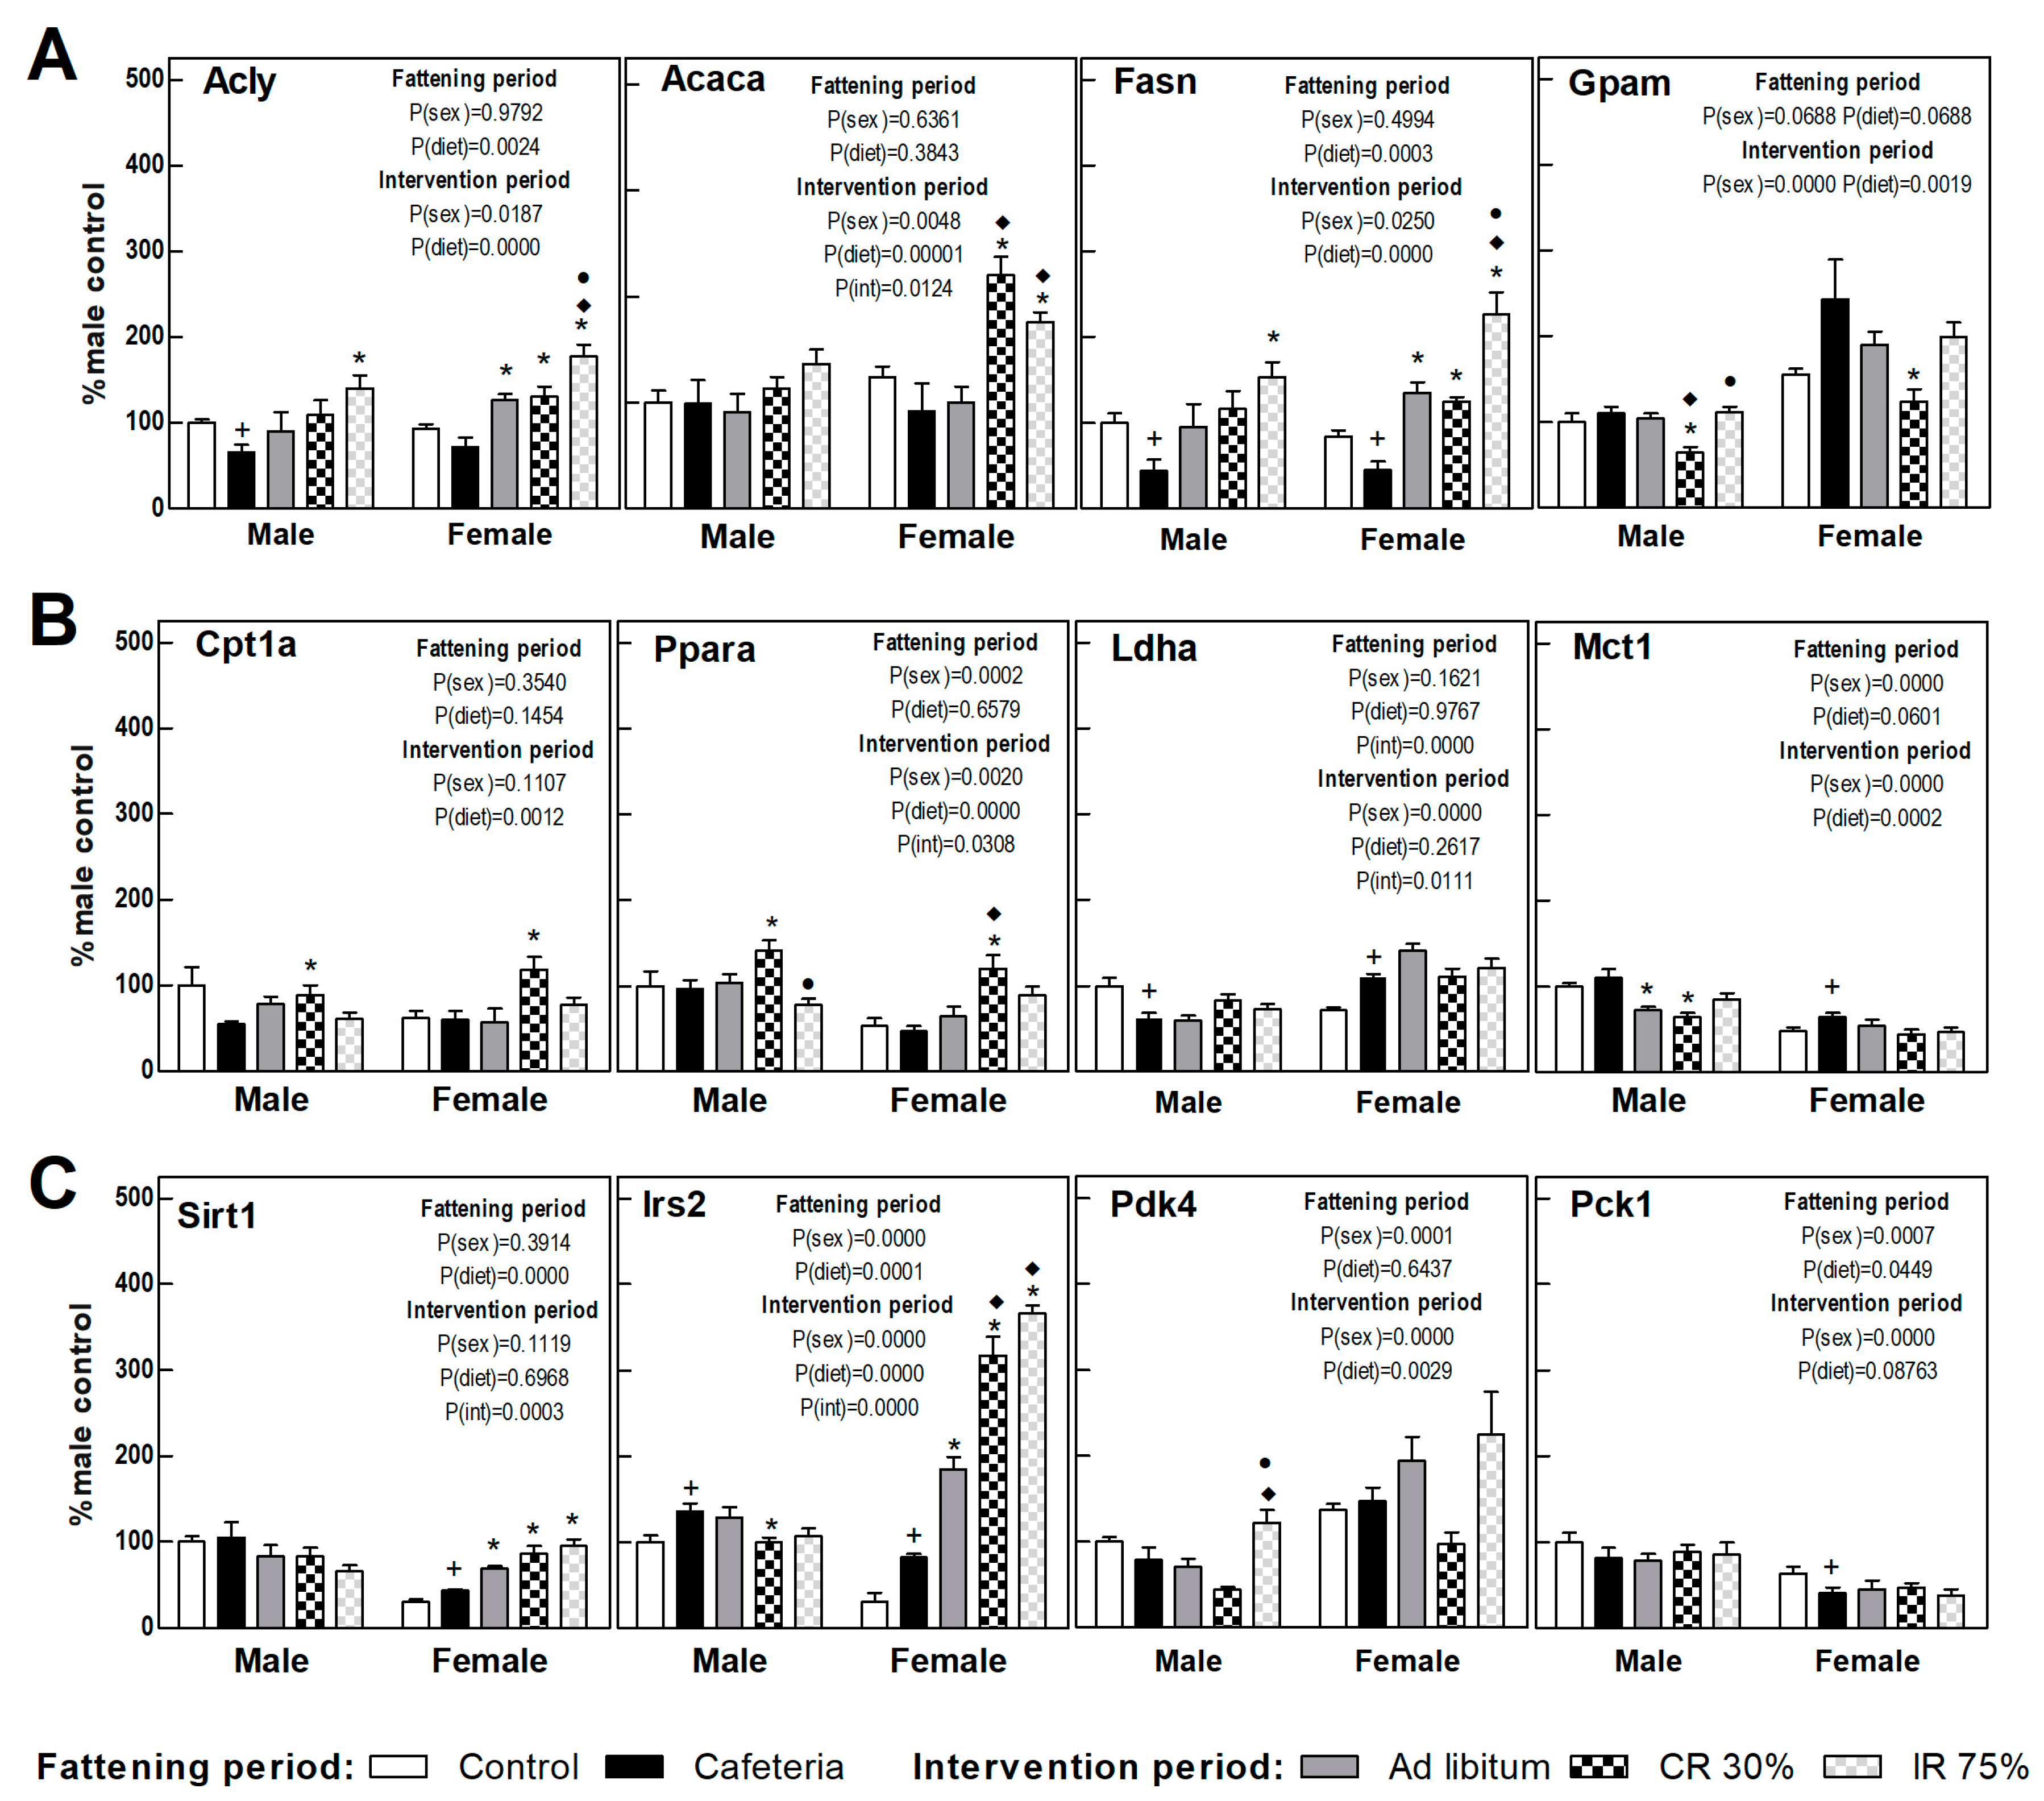
3.6. Liver Gene Expression
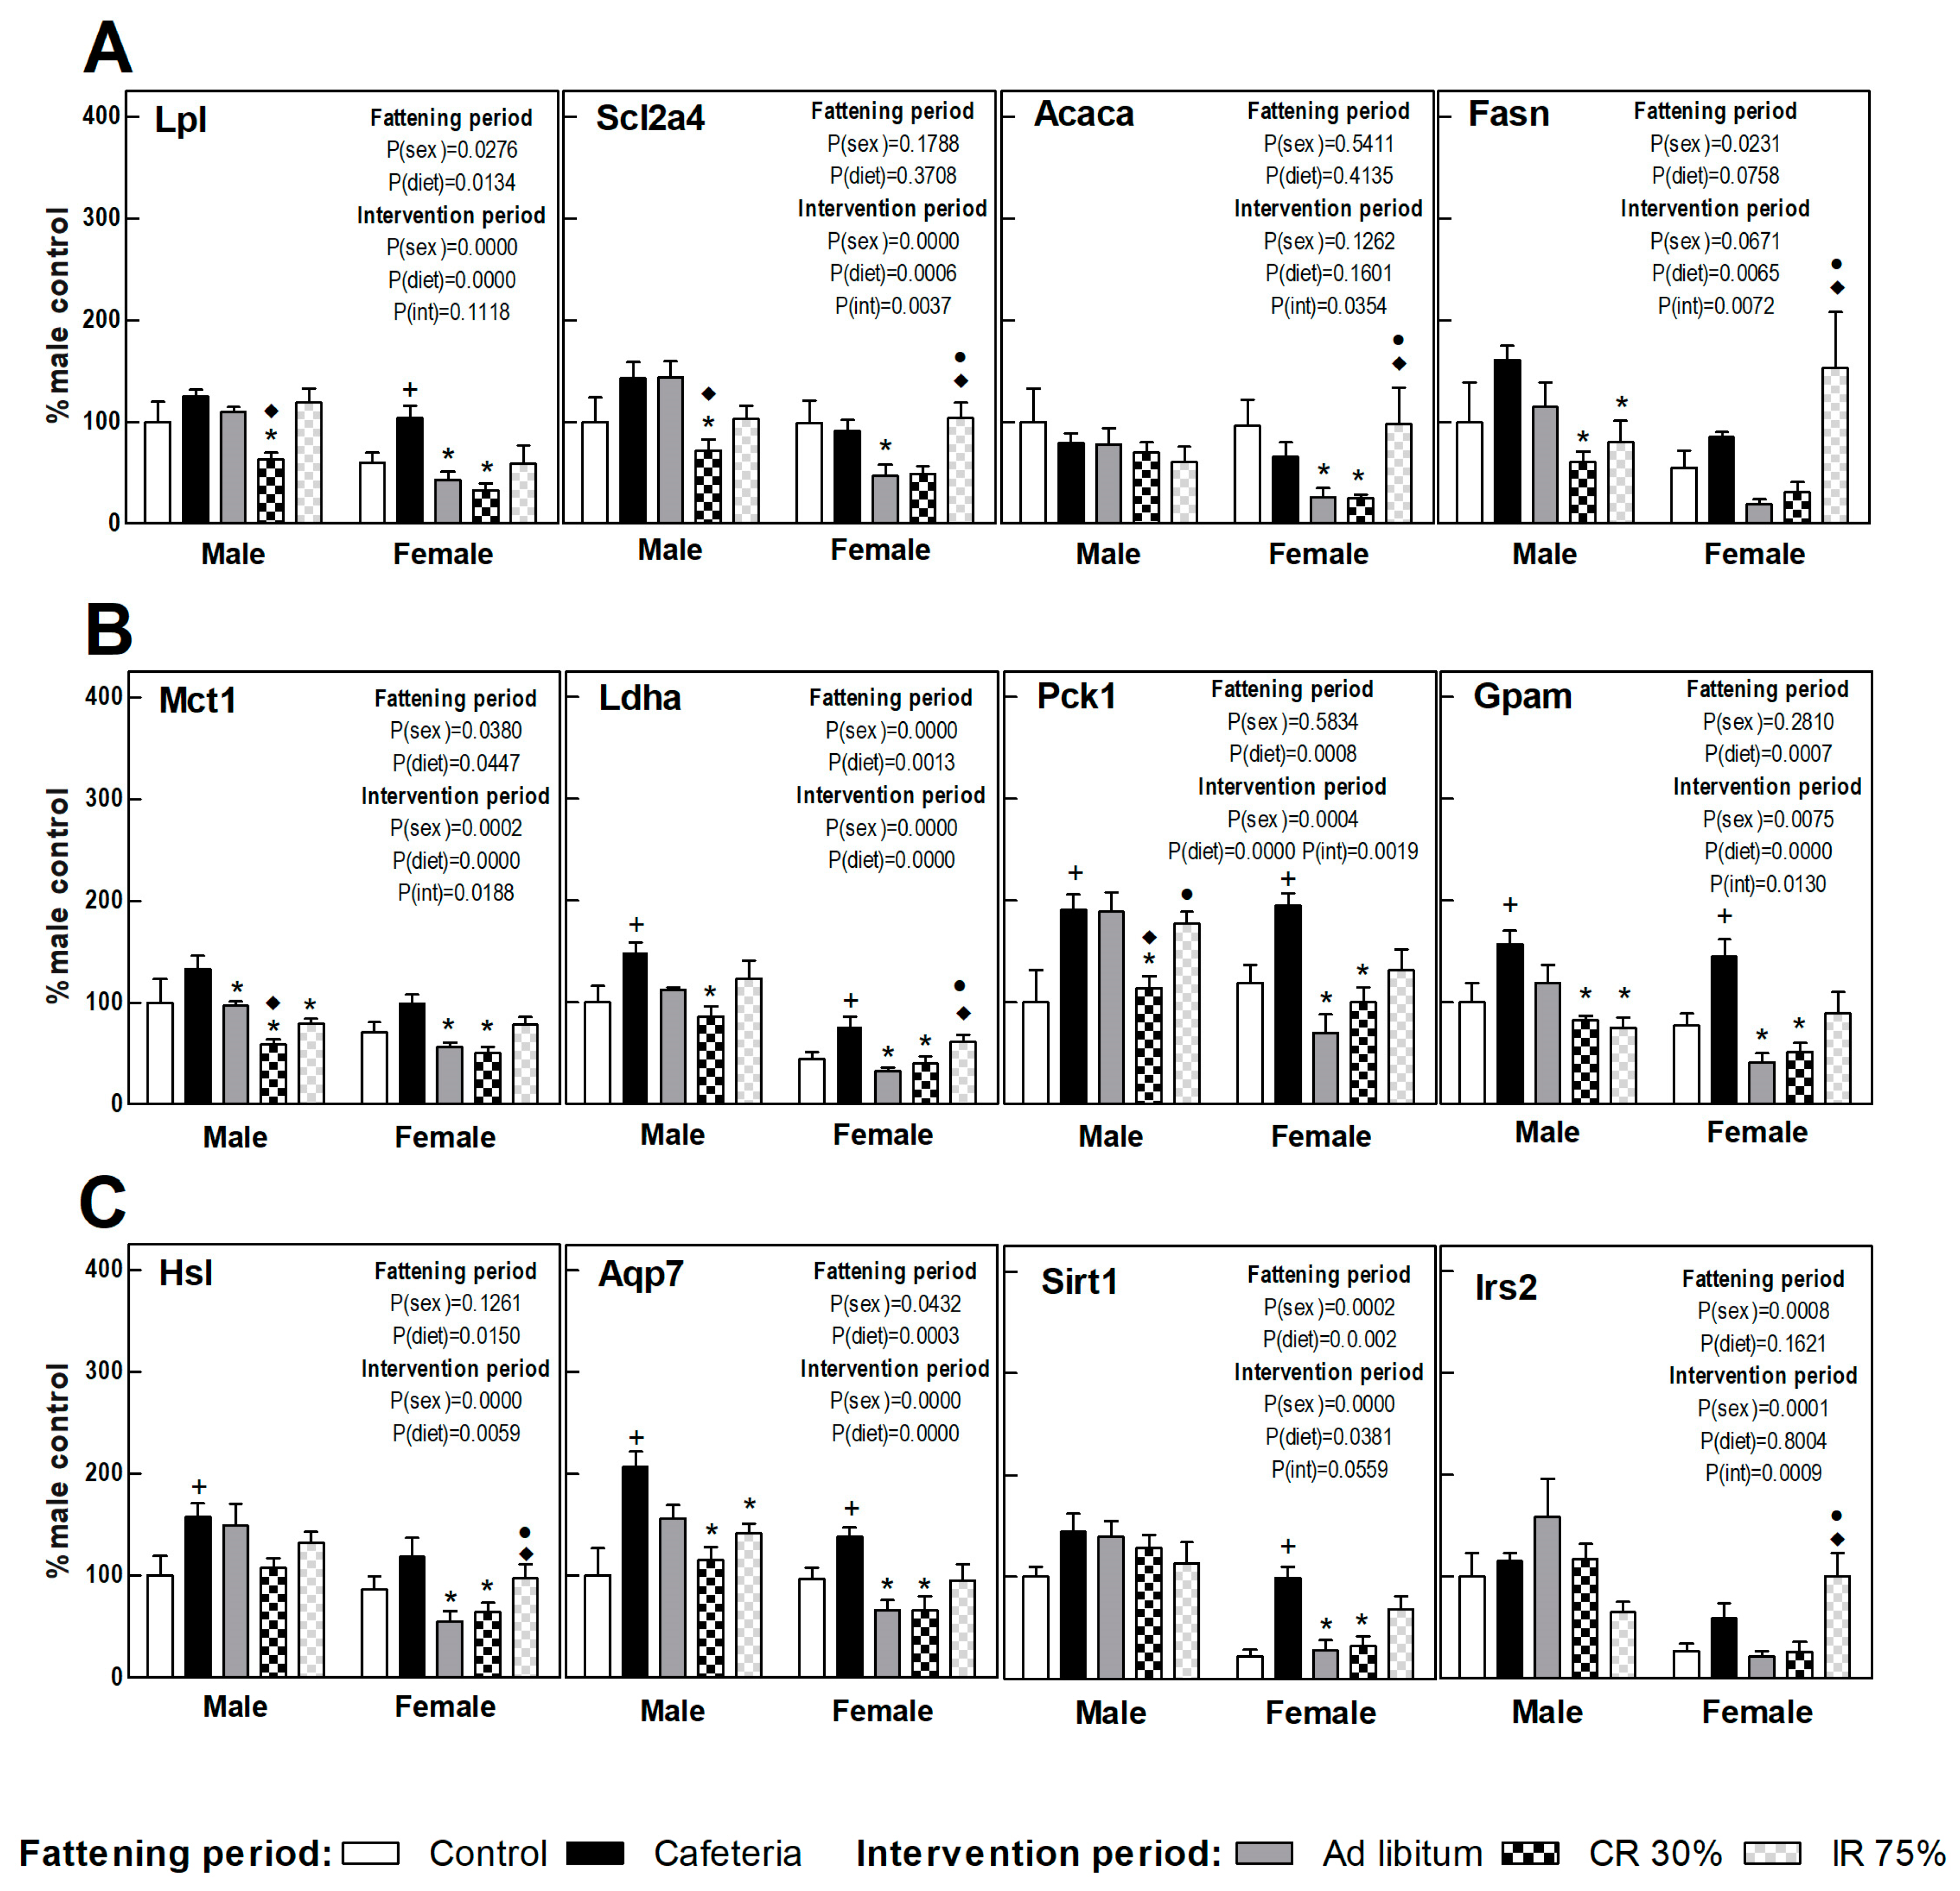
3.7. Perigonadal Adipose Tissue Gene Expressions
4. Discussion
5. Conclusions
Author Contributions
Funding
Institutional Review Board Statement
Informed Consent Statement
Data Availability Statement
Acknowledgments
Conflicts of Interest
References
- Abbasi, F.; Brown, B.W.; Lamendola, C.; McLaughlin, T.; Reaven, G.M. Relationship between Obesity, Insulin Resistance, and Coronary Heart Disease Risk. J. Am. Coll. Cardiol. 2002, 40, 937–943. [Google Scholar] [CrossRef]
- Phelan, S.; Wadden, T.A.; Berkowitz, R.I.; Sarwer, D.B.; Womble, L.G.; Cato, R.K.; Rothman, R. Impact of Weight Loss on the Metabolic Syndrome. Int. J. Obes. 2007, 31, 1442–1448. [Google Scholar] [CrossRef]
- MacLean, P.S.; Bergouignan, A.; Cornier, M.A.; Jackman, M.R. Biology’s Response to Dieting: The Impetus for Weight Regain. Am. J. Physiol. Regul. Integr. Comp. Physiol. 2011, 301, R581–R600. [Google Scholar] [CrossRef]
- Mishra, A.; Sobha, D.; Patel, D.; Suresh, P.S. Intermittent Fasting in Health and Disease. Arch. Physiol. Biochem. 2023, 13, 1–13. [Google Scholar] [CrossRef]
- Vasim, I.; Majeed, C.N.; DeBoer, M.D. Intermittent Fasting and Metabolic Health. Nutrients 2022, 14, 631. [Google Scholar] [CrossRef]
- Cho, Y.; Hong, N.; Kim, K.W.; Cho, S.J.; Lee, M.; Lee, Y.H.; Lee, Y.H.; Kang, E.S.; Cha, B.S.; Lee, B.W. The Effectiveness of Intermittent Fasting to Reduce Body Mass Index and Glucose Metabolism: A Systematic Review and Meta-Analysis. J. Clin. Med. 2019, 8, 1645. [Google Scholar] [CrossRef]
- Cioffi, I.; Evangelista, A.; Ponzo, V.; Ciccone, G.; Soldati, L.; Santarpia, L.; Contaldo, F.; Pasanisi, F.; Ghigo, E.; Bo, S. Intermittent versus Continuous Energy Restriction on Weight Loss and Cardiometabolic Outcomes: A Systematic Review and Meta-Analysis of Randomized Controlled Trials. J. Transl. Med. 2018, 16, 371. [Google Scholar] [CrossRef]
- Varady, K.A.; Hellerstein, M.K. Alternate-Day Fasting and Chronic Disease Prevention: A Review of Human and Animal Trials. Am. J. Clin. Nutr. 2007, 86, 7–13. [Google Scholar] [CrossRef]
- Harvie, M.N.; Pegington, M.; Mattson, M.P.; Frystyk, J.; Dillon, B.; Evans, G.; Cuzick, J.; Jebb, S.A.; Martin, B.; Cutler, R.G.; et al. The Effects of Intermittent or Continuous Energy Restriction on Weight Loss and Metabolic Disease Risk Markers: A Randomized Trial in Young Overweight Women. Int. J. Obes. 2011, 35, 714–727. [Google Scholar] [CrossRef]
- Hatori, M.; Vollmers, C.; Zarrinpar, A.; DiTacchio, L.; Bushong, E.A.; Gill, S.; Leblanc, M.; Chaix, A.; Joens, M.; Fitzpatrick, J.A.J.; et al. Time Restricted Feeding without Reducing Caloric Intake Prevents Metabolic Diseases in Mice Fed a High Fat Diet. Cell Metab. 2012, 15, 848. [Google Scholar] [CrossRef]
- Duregon, E.; Pomatto-Watson, L.C.D.D.; Bernier, M.; Price, N.L.; de Cabo, R. Intermittent Fasting: From Calories to Time Restriction. Geroscience 2021, 43, 1083–1092. [Google Scholar] [CrossRef]
- Chaix, A.; Deota, S.; Bhardwaj, R.; Lin, T.; Panda, S. Sex- and Age-Dependent Outcomes of 9-Hour Time-Restricted Feeding of a Western High-Fat High-Sucrose Diet in C57BL/6J Mice. Cell Rep. 2021, 36, 109543. [Google Scholar] [CrossRef]
- Henderson, Y.O.; Bithi, N.; Yang, J.; Link, C.; Zhang, A.; Baron, B.; Maina, E.; Hine, C. A Long-Term Obesogenic High-Fat Diet in Mice Partially Dampens the Anti-Frailty Benefits of Late-Life Intermittent Fasting. Geroscience 2023, 45, 1247–1262. [Google Scholar] [CrossRef]
- Li, Y.; Liang, J.; Tian, X.; Chen, Q.; Zhu, L.; Wang, H.; Liu, Z.; Dai, X.; Bian, C.; Sun, C. Intermittent Fasting Promotes Adipocyte Mitochondrial Fusion through Sirt3-Mediated Deacetylation of Mdh2. Br. J. Nutr. 2023, 130, 1473–1486. [Google Scholar] [CrossRef]
- Li, G.; Xie, C.; Lu, S.; Nichols, R.G.; Tian, Y.; Li, L.; Patel, D.; Ma, Y.; Brocker, C.N.; Yan, T.; et al. Intermittent Fasting Promotes White Adipose Browning and Decreases Obesity by Shaping the Gut Microbiota. Cell Metab. 2017, 26, 672–685.e4. [Google Scholar] [CrossRef]
- Oliva, L.; Aranda, T.; Caviola, G.; Fernández-Bernal, A.; Alemany, M.; Fernández-López, J.A.; Remesar, X. In Rats Fed High-Energy Diets, Taste, Rather than Fat Content, Is the Key Factor Increasing Food Intake: A Comparison of a Cafeteria and a Lipid-Supplemented Standard Diet. PeerJ 2017, 2017, e3697. [Google Scholar] [CrossRef]
- Martínez-Micaelo, N.; González-Abuín, N.; Ardévol, A.; Pinent, M.; Petretto, E.; Behmoaras, J.; Blay, M. Leptin Signal Transduction Underlies the Differential Metabolic Response of LEW and WKY Rats to Cafeteria Diet. J. Mol. Endocrinol. 2016, 56, 1–10. [Google Scholar] [CrossRef]
- Romero, M.; Esteve, M.; Alemany, M.; Fernández-López, J. Gene Expression Modulation of Rat Liver Cholesterol Metabolism by Oleoyl-Estrone. Obes. Res. Clin. Pract. 2010, 4, e57–e64. [Google Scholar] [CrossRef]
- Serafini, M.T.; Alemany, M. A Micromethod for the Enzymatic Estimation of the Degree of Glycogen Ramification. J. Biochem. Biophys. Methods 1987, 15, 33–39. [Google Scholar] [CrossRef]
- Patterson, R.E.; Sears, D.D. Metabolic Effects of Intermittent Fasting. Annu. Rev. Nutr. 2017, 37, 371–393. [Google Scholar] [CrossRef]
- Esteve, M.; Rafecas, I.; Fernández-López, J.; Remesar, X.; Alemany, M. Effect of a Cafeteria Diet on Energy Intake and Balance in Wistar Rats. Physiol. Behav. 1994, 56, 65–71. [Google Scholar] [CrossRef]
- Romero, M.d.M.; Roy, S.; Pouillot, K.; Feito, M.; Esteve, M.; Grasa, M.; Fernández-López, J.; Alemany, M.; Remesar, X. Treatment of Rats with a Self-Selected Hyperlipidic Diet, Increases the Lipid Content of the Main Adipose Tissue Sites in a Proportion Similar to That of the Lipids in the Rest of Organs and Tissues. PLoS ONE 2014, 9, e90995. [Google Scholar] [CrossRef]
- Rothwell, N.J.; Stock, M.J. A Role for Brown Adipose Tissue in Diet-Induced Thermogenesis. Nature 1979, 281, 31–35. [Google Scholar] [CrossRef]
- Trayhurn, P. Brown Adipose Tissue: A Short Historical Perspective. Methods Mol. Biol. 2022, 2448, 1–18. [Google Scholar] [CrossRef]
- Chen, Y.; Kim, M.; Paye, S.; Benayoun, B.A. Sex as a Biological Variable in Nutrition Research: From Human Studies to Animal Models. Annu. Rev. Nutr. 2022, 42, 227–250. [Google Scholar] [CrossRef]
- Cawthon, C.R.; Spector, A.C. The Nature of Available Choices Affects the Intake and Meal Patterns of Rats Offered a Palatable Cafeteria-Style Diet. Nutrients 2023, 15, 5093. [Google Scholar] [CrossRef]
- Esteve, M.; Rafecas, I.; Fernández-López, J.A.; Remesar, X.; Alemany, M. Fatty Acid Utilization by Young Wistar Rats Fed a Cafeteria Diet. Mol. Cell. Biochem. 1992, 118, 67–74. [Google Scholar] [CrossRef]
- Rafecas, I.; Esteve, M.; Fernández-López, J.; Remesar, X.; Alemany, M. Deposition of Dietary Fatty Acids in Young Zucker Rats Fed a Cafeteria Diet. Int. J. Obes. 1992, 16, 775–787. [Google Scholar]
- Weiner, J.; Dommel, S.; Gebhardt, C.; Hanschkow, M.; Popkova, Y.; Krause, K.; Klöting, N.; Blüher, M.; Schiller, J.; Heiker, J.T. Differential Expression of Immunoregulatory Cytokines in Adipose Tissue and Liver in Response to High Fat and High Sugar Diets in Female Mice. Front. Nutr. 2023, 10, 1275160. [Google Scholar] [CrossRef]
- Parks, B.W.; Sallam, T.; Mehrabian, M.; Psychogios, N.; Hui, S.T.; Norheim, F.; Castellani, L.W.; Rau, C.D.; Pan, C.; Phun, J.; et al. Genetic Architecture of Insulin Resistance in the Mouse. Cell Metab. 2015, 21, 334–347. [Google Scholar] [CrossRef]
- Kersten, S. The Impact of Fasting on Adipose Tissue Metabolism. Biochim. Biophys. Acta Mol. Cell Biol. Lipids 2023, 1868, 159262. [Google Scholar] [CrossRef]
- Nye, C.K.; Hanson, R.W.; Kalhan, S.C. Glyceroneogenesis Is the Dominant Pathway for Triglyceride Glycerol Synthesis in Vivo in the Rat. J. Biol. Chem. 2008, 283, 27565–27574. [Google Scholar] [CrossRef]
- Franckhauser, S.; Muñoz, S.; Pujol, A.; Casellas, A.; Riu, E.; Otaegui, P.; Su, B.; Bosch, F. Increased Fatty Acid Re-Esterification by PEPCK Overexpression in Adipose Tissue Leads to Obesity without Insulin Resistance. Diabetes 2002, 51, 624–630. [Google Scholar] [CrossRef]
- Neuwald, N.V.; Pearce, A.L.; Adise, S.; Rolls, B.J.; Keller, K.L. Switching between Foods: A Potential Behavioral Phenotype of Hedonic Hunger and Increased Obesity Risk in Children. Physiol. Behav. 2023, 270, 114312. [Google Scholar] [CrossRef]
- Berthoud, H.-R. The Neurobiology of Food Intake in an Obesogenic Environment. Proc. Nutr. Soc. 2012, 71, 478–487. [Google Scholar] [CrossRef]
- Most, J.; Redman, L.M. Impact of Calorie Restriction on Energy Metabolism in Humans. Exp. Gerontol. 2020, 133, 110875. [Google Scholar] [CrossRef]
- Olswang, Y.; Cohen, H.; Papo, O.; Cassuto, H.; Croniger, C.M.; Hakimi, P.; Tilghman, S.M.; Hanson, R.W.; Reshef, L. A Mutation in the Peroxisome Proliferator-Activated Receptor γ-Binding Site in the Gene for the Cytosolic Form of Phosphoenolpyruvate Carboxykinase Reduces Adipose Tissue Size and Fat Content in Mice. Proc. Natl. Acad. Sci. USA 2002, 99, 625–630. [Google Scholar] [CrossRef]
- Kane, A.E.; Sinclair, D.A.; Mitchell, J.R.; Mitchell, S.J. Sex Differences in the Response to Dietary Restriction in Rodents. Curr. Opin. Physiol. 2018, 6, 28–34. [Google Scholar] [CrossRef]
- Bartke, A.; Hascup, E.; Hascup, K. Responses to Many Anti-Aging Interventions Are Sexually Dimorphic. World J. Mens. Health 2024, 42, 29–38. [Google Scholar] [CrossRef]
- Shimokawa, I. Mechanisms Underlying Retardation of Aging by Dietary Energy Restriction. Pathol. Int. 2023, 73, 579–592. [Google Scholar] [CrossRef]
- Liu, D.; Huang, Y.; Huang, C.; Yang, S.; Wei, X.; Zhang, P.; Guo, D.; Lin, J.; Xu, B.; Li, C.; et al. Calorie Restriction with or without Time-Restricted Eating in Weight Loss. N. Engl. J. Med. 2022, 386, 1495–1504. [Google Scholar] [CrossRef]
- Speakman, J.R.; Mitchell, S.E. Caloric Restriction. Mol. Aspects Med. 2011, 32, 159–221. [Google Scholar] [CrossRef]
- López-Lluch, G.; Navas, P. Calorie Restriction as an Intervention in Ageing. J. Physiol. 2016, 594, 2043–2060. [Google Scholar] [CrossRef]
- Cantó, C.; Auwerx, J. Targeting Sirtuin 1 to Improve Metabolism: All You Need Is NAD? Pharmacol. Rev. 2012, 64, 166–187. [Google Scholar] [CrossRef]
- Gupta, P.; Taiyab, A.; Hassan, M.I. Emerging Role of Protein Kinases in Diabetes Mellitus: From Mechanism to Therapy. In Advances in Protein Chemistry and Structural Biology; Donev, R., Ed.; Academic Press: Cambridge, MA, USA, 2021; Volume 124, pp. 47–85. [Google Scholar]
- Fernandez, S.; Viola, J.M.; Torres, A.; Wallace, M.; Trefely, S.; Zhao, S.; Affronti, H.C.; Gengatharan, J.M.; Guertin, D.A.; Snyder, N.W.; et al. Adipocyte ACLY Facilitates Dietary Carbohydrate Handling to Maintain Metabolic Homeostasis in Females. Cell Rep. 2019, 27, 2772–2784.e6. [Google Scholar] [CrossRef]
- Zhang, S.; Hulver, M.W.; McMillan, R.P.; Cline, M.A.; Gilbert, E.R. The Pivotal Role of Pyruvate Dehydrogenase Kinases in Metabolic Flexibility. Nutr. Metab. 2014, 11, 10. [Google Scholar] [CrossRef]


| Fattening Period (12 Weeks) | Intervention Period (3 Weeks) | |||||||||||||||
|---|---|---|---|---|---|---|---|---|---|---|---|---|---|---|---|---|
| Parameter | Males | Females | p-Value (ANOVA) | Males | Females | p-Value (ANOVA) | ||||||||||
| Control | Cafeteria | Control | Cafeteria | Sex | Diet | Int | AL | CR30 | IR75 | AL | CR30 | IR75 | Sex | Diet | Int | |
| Type of restriction | Unrestricted | Unrestricted | Unrestricted | Daily | Twice a week | Unrestricted | Daily | Twice a week | ||||||||
| Food type | Standard | Cafeteria | Standard | Cafeteria | Standard | Standard | Standard | Standard | Standard | Standard | ||||||
| Food available | - | - | - | - | - | 70% | 25% | - | 70% | 25% | ||||||
| Initial body weight (g) | 192 ± 2 | 161 ± 2 | 623 ± 75 | 602 ± 30 | 608 ± 50 | 356 ± 30 | 356 ± 32 | 342 ± 13 | ||||||||
| Final body weight (g) | 526 ± 7 | 608 ± 11 + | 283 ± 10 | 368 ± 7 + | 0.0000 | 0.0000 | 0.8911 | 615 ± 73 | 531 ± 25 * | 595 ± 54 | 329 ± 23 * | 304 ± 31 * | 316 ± 8 * | 0.0000 | 0.0001 | 0.1999 |
| BW increase (%) | 154 ± 5 | 223 ± 5 + | 66 ± 3 | 133 ± 4 + | 0.0000 | 0.0000 | 0.8787 | −1.3 ± 0.5 * | −11.7 ± 1.7 *♦ | −2.0 ± 2.2 *● | −7.6 ± 2.3 * | −14.7 ± 2.5 *♦ | −7.7 ± 1.5 *● | 0.0000 | 0.0000 | 0.0000 |
| Food consumption (KJ/day) | 335 ± 6 | 735 ± 15 + | 212 ± 7 | 558 ± 13 + | 0.0000 | 0.0000 | 0.0000 | 261 ± 8 * | 176 ± 5 *♦ | 246 ± 10 *● | 156 ± 4 * | 110 ± 5 *♦ | 149 ± 4 *● | 0.0000 | 0.0000 | 0.0000 |
| Energy efficiency (g/MJ) | 15.2 ± 0.7 | 9.1 ± 0.2 + | 8.8 ± 0.4 | 6.0 ± 0.2 + | 0.0000 | 0.0000 | 0.0001 | −1.5 ± 0.3 * | −20.3 ± 1.9 *♦ | −2.7 ± 1.4 *● | −9.0 ± 1.6 * | −24.1 ± 2.5 *♦ | −7.1 ± 1.6 *● | 0.0000 | 0.0000 | 0.1645 |
| Fattening Period (12 Weeks) | Intervention Period (3 Weeks) | ||||||||||||||||
|---|---|---|---|---|---|---|---|---|---|---|---|---|---|---|---|---|---|
| Parameter | Units | Males | Females | p-Value (ANOVA) | Males | Females | p-Value (ANOVA) | ||||||||||
| Control | Cafeteria | Control | Cafeteria | Sex | Diet | Int | AL | CR30 | IR75 | AL | CR30 | IR75 | Sex | Diet | Int | ||
| Glucose | mM | 5.52 ± 0.14 | 7.07 ± 0.13 + | 6.47 ± 0.14 | 6.99 ± 0.31 | 0.4006 | 0.0356 | 0.4622 | 5.99 ± 0.28 * | 5.77 ± 0.39 * | 4.99 ± 0.06 *♦ | 6.56 ± 0.33 | 5.44 ± 0.22 * | 5.08 ± 0.31 *♦ | 0.7421 | 0.0000 | 0.4197 |
| Insulin | pM | 289 ± 38 | 443 ± 60 | 173 ± 33 | 321 ±75 | 0.0389 | 0.0113 | 0.9601 | 304 ± 35 | 248 ± 37 * | 289 ± 37 | 263 ± 48 | 149 ± 26 | 123 ± 29 * | 0.0022 | 0.0008 | 0.5974 |
| HOMA-IR score | 12.6 ± 1.7 | 20.3 ± 2.7 + | 7.6 ± 1.5 | 15.5 ± 4.0 + | 0.0736 | 0.0079 | 0.9984 | 12.3 ± 1.0 * | 9.3 ± 1.1 * | 9.7 ± 1.3 * | 11.5 ± 2.1 | 5.3 ± 0.8 * | 4.2 ± 1.1 * | 0.0123 | 0.0000 | 0.6806 | |
| Triacylglycerol | mM | 1.01 ± 0.10 | 2.74 ± 0.18 + | 0.64 ± 0.05 | 1.10 ± 0.16 | 0.0000 | 0.0000 | 0.0004 | 1.18 ± 0.18 * | 1.13 ± 0.11 * | 1.15 ± 0.12 * | 0.73 ± 0.14 * | 0.47 ± 0.04 * | 0.86 ± 0.09 * | 0.0000 | 0.0000 | 0.0001 |
| NEFA | mM | 0.24 ± 0.03 | 0.36 ± 0.04 + | 0.27 ± 0.03 | 0.23 ± 0.03 | 0.0428 | 0.0991 | 0.0286 | 0.28 ± 0.05 * | 0.23 ± 0.01 * | 0.24 ± 0.02 * | 0.23 ± 0.03 | 0.25 ± 0.02 | 0.23 ± 0.02 | 0.1763 | 0.5618 | 0.1872 |
| Glycerol | mM | 0.16 ± 0.02 | 0.43 ± 0.08 + | 0.19 ± 0.05 | 0.22 ± 0.02 | 0.1370 | 0.0031 | 0.0297 | 0.17 ± 0.02 * | 0.17 ± 0.02 * | 0.18 ± 0.01 * | 0.17 ± 0.01 | 0.18 ± 0.03 | 0.12 ± 0.01 * | 0.0051 | 0.0000 | 0.0051 |
| Lactate | mM | 2.94 ± 0.19 | 2.98 ± 0.36 | 1.75 ± 0.11 | 2.30 ± 0.24 | 0.0016 | 0.2608 | 0.3172 | 2.51 ± 0.23 | 2.39 ± 0.37 | 2.68 ± 0.20 | 2.05 ± 0.2 | 1.78 ± 0.09 | 2.10 ± 0.18 | 0.0043 | 0.0340 | 0.8563 |
Disclaimer/Publisher’s Note: The statements, opinions and data contained in all publications are solely those of the individual author(s) and contributor(s) and not of MDPI and/or the editor(s). MDPI and/or the editor(s) disclaim responsibility for any injury to people or property resulting from any ideas, methods, instructions or products referred to in the content. |
© 2024 by the authors. Licensee MDPI, Basel, Switzerland. This article is an open access article distributed under the terms and conditions of the Creative Commons Attribution (CC BY) license (https://creativecommons.org/licenses/by/4.0/).
Share and Cite
Bosch de Basea, L.; Boguñà, M.; Sánchez, A.; Esteve, M.; Grasa, M.; Romero, M.d.M. Sex-Dependent Metabolic Effects in Diet-Induced Obese Rats following Intermittent Fasting Compared with Continuous Food Restriction. Nutrients 2024, 16, 1009. https://0-doi-org.brum.beds.ac.uk/10.3390/nu16071009
Bosch de Basea L, Boguñà M, Sánchez A, Esteve M, Grasa M, Romero MdM. Sex-Dependent Metabolic Effects in Diet-Induced Obese Rats following Intermittent Fasting Compared with Continuous Food Restriction. Nutrients. 2024; 16(7):1009. https://0-doi-org.brum.beds.ac.uk/10.3390/nu16071009
Chicago/Turabian StyleBosch de Basea, Laia, Marina Boguñà, Alicia Sánchez, Montserrat Esteve, Mar Grasa, and Maria del Mar Romero. 2024. "Sex-Dependent Metabolic Effects in Diet-Induced Obese Rats following Intermittent Fasting Compared with Continuous Food Restriction" Nutrients 16, no. 7: 1009. https://0-doi-org.brum.beds.ac.uk/10.3390/nu16071009