
TG/HDL Ratio Is an Independent Predictor for Estimating Resting Energy Expenditure in Adults with Normal Weight, Overweight, and Obesity

Abstract
:1. Introduction
2. Methods
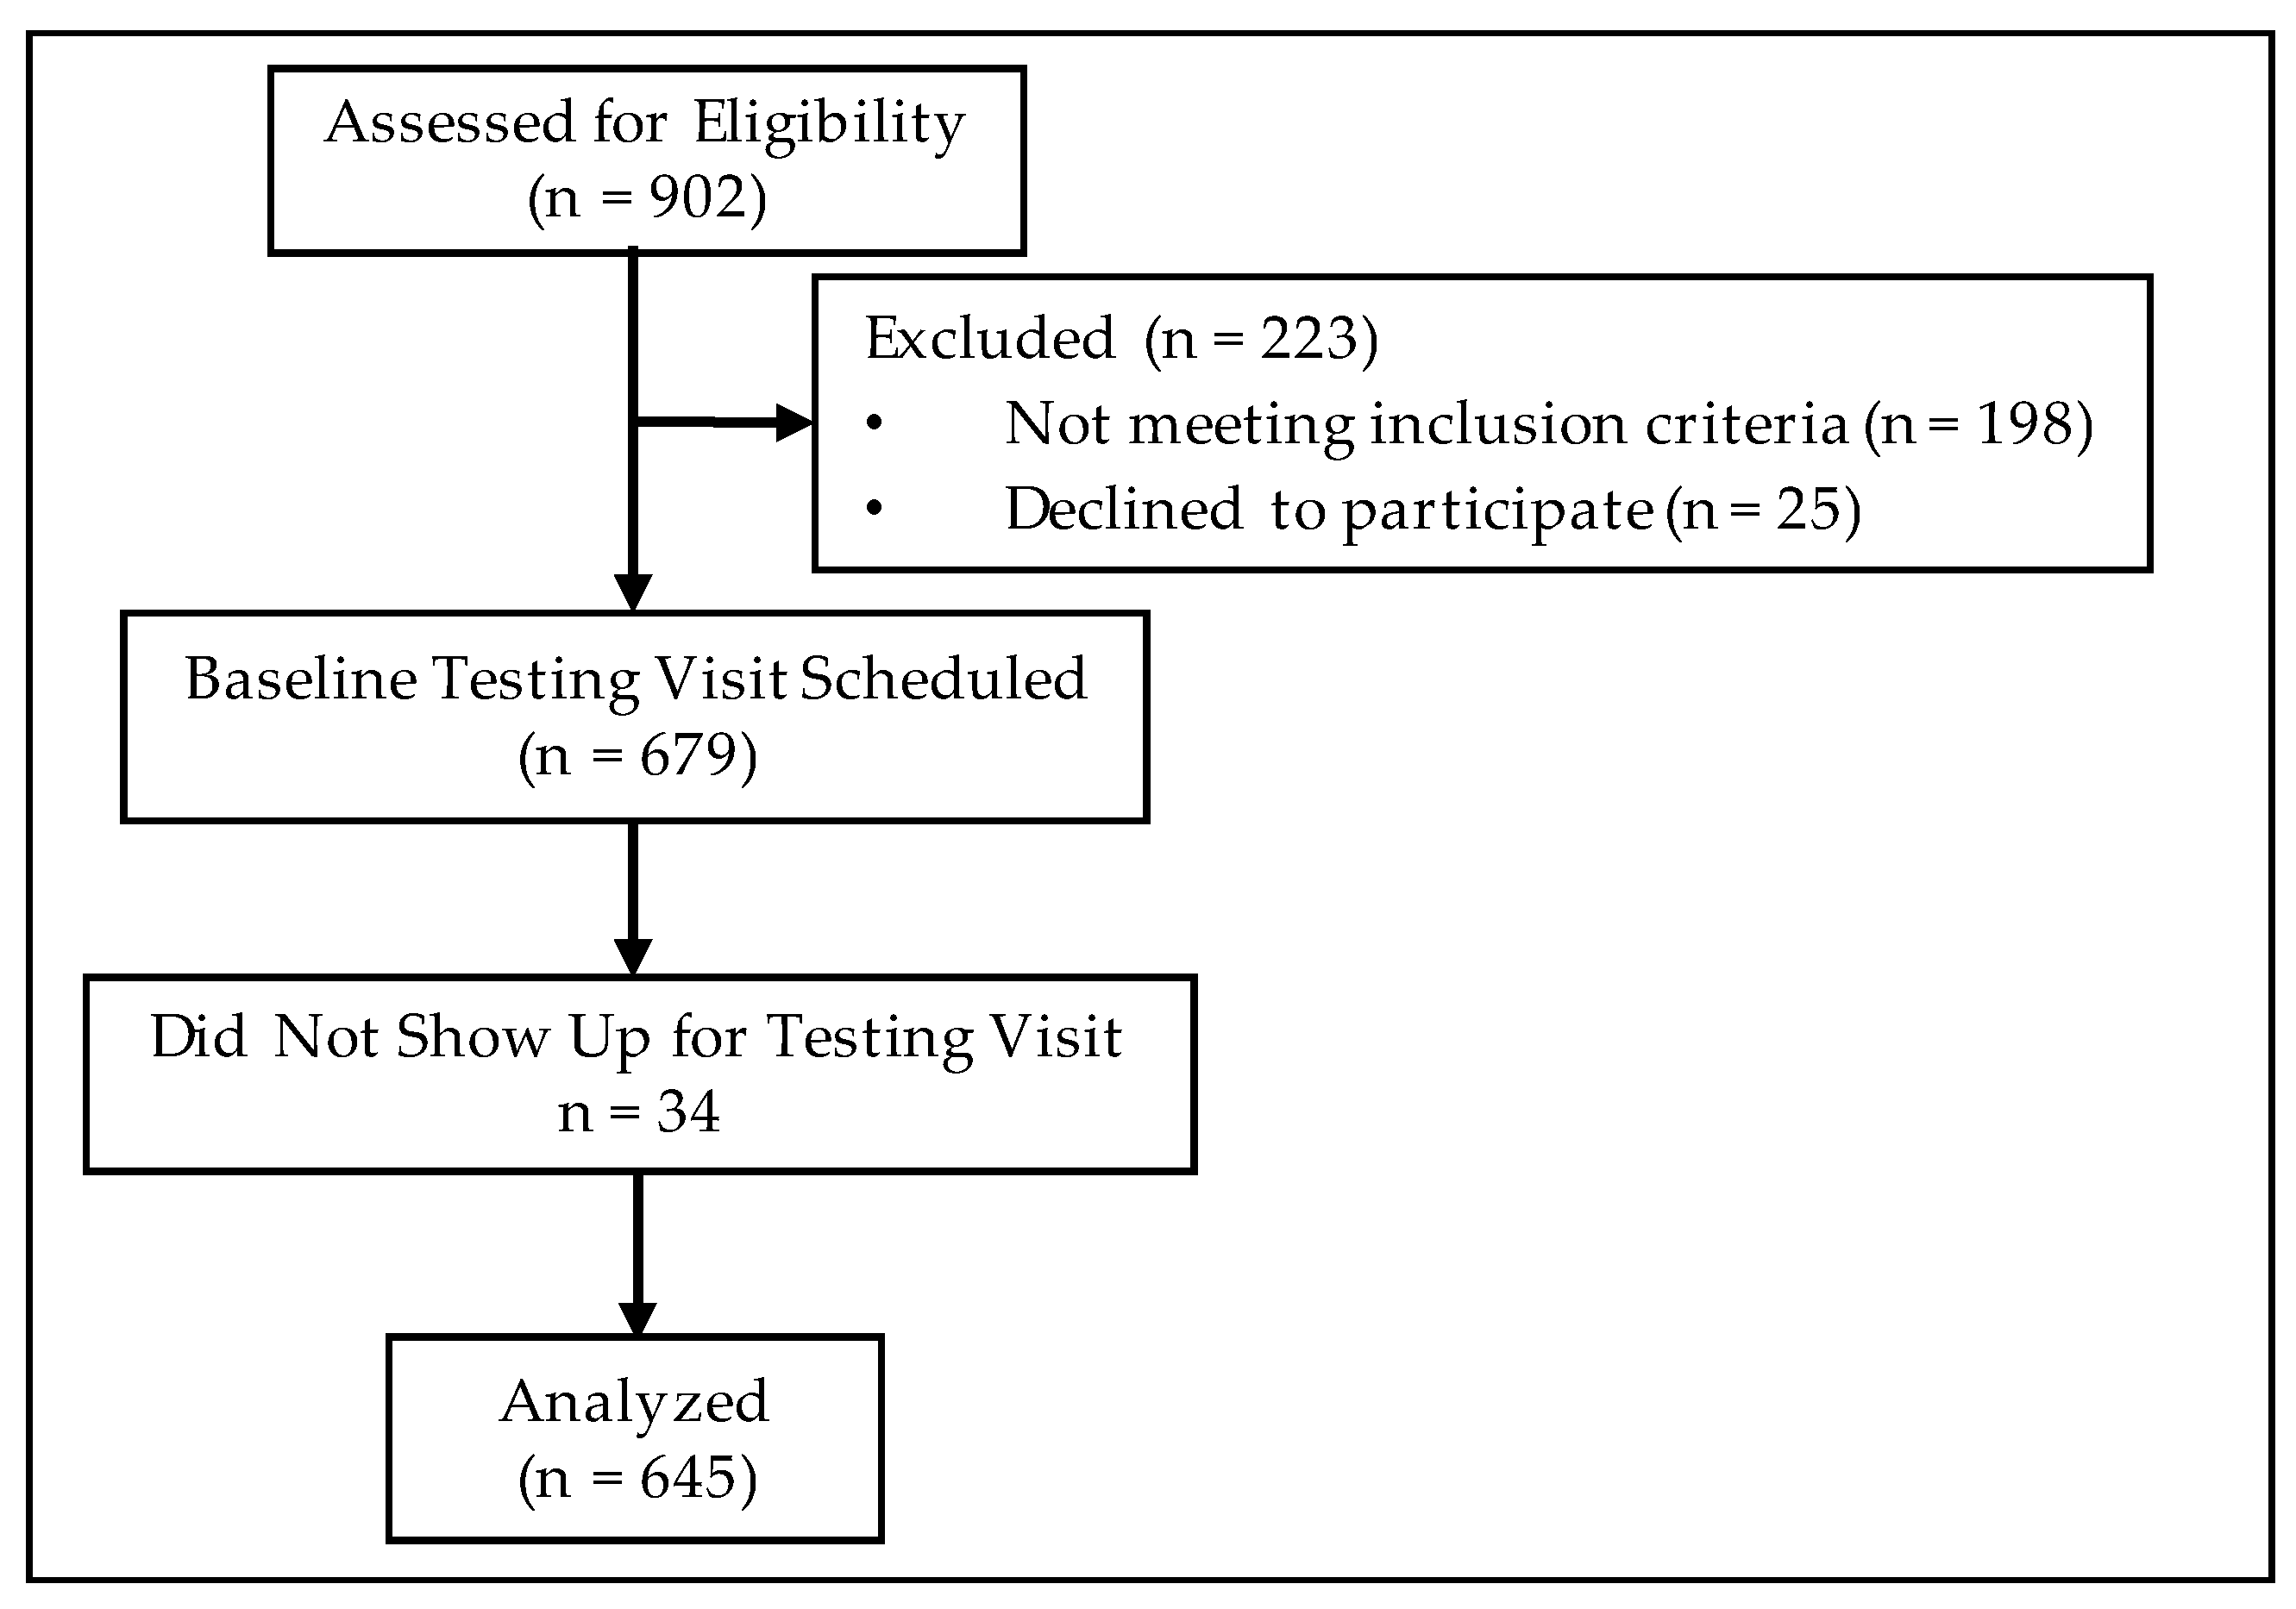
2.1. Subjects
2.2. Clinical Labs
2.3. Anthropometry and Body Composition
2.4. Indirect Calorimetry
2.5. Statistical Analysis
3. Results
3.1. Differences in Linear Regression Models by BMI Category
3.2. Differences in Linear Regression Models by Glycemic and Metabolic Syndrome Status
4. Discussion
Author Contributions
Funding
Institutional Review Board Statement
Informed Consent Statement
Data Availability Statement
Conflicts of Interest
References
- Harris, J.A.; Benedict, F.G. A Biometric Study of Human Basal Metabolism. Proc. Natl. Acad. Sci. USA 1918, 4, 370–373. [Google Scholar] [CrossRef] [PubMed] [Green Version]
- Schofield, W.N. Predicting basal metabolic rate, new standards and review of previous work. Hum. Nutr. Clin. Nutr. 1985, 39 (Suppl. 1), 5–41. [Google Scholar] [PubMed]
- Bosy-Westphal, A.; Wolf, A.; Buhrens, F.; Hitze, B.; Czech, N.; Monig, H.; Selberg, O.; Settler, U.; Pfeuffer, M.; Schrezenmeir, J.; et al. Familial influences and obesity-associated metabolic risk factors contribute to the variation in resting energy expenditure: The Kiel Obesity Prevention Study. Am. J. Clin. Nutr. 2008, 87, 1695–1701. [Google Scholar] [CrossRef] [PubMed] [Green Version]
- Ryan, M.; Salle, A.; Guilloteau, G.; Genaitay, M.; Livingstone, M.B.; Ritz, P. Resting energy expenditure is not increased in mildly hyperglycaemic obese diabetic patients. Br. J. Nutr. 2006, 96, 945–948. [Google Scholar] [CrossRef] [PubMed] [Green Version]
- Gougeon, R.; Lamarche, M.; Yale, J.F.; Venuta, T. The prediction of resting energy expenditure in type 2 diabetes mellitus is improved by factoring for glycemia. Int. J. Obes. Relat. Metab. Disord. 2002, 26, 1547–1552. [Google Scholar] [CrossRef] [PubMed] [Green Version]
- Weyer, C.; Bogardus, C.; Pratley, R.E. Metabolic factors contributing to increased resting metabolic rate and decreased insulin-induced thermogenesis during the development of type 2 diabetes. Diabetes 1999, 48, 1607–1614. [Google Scholar] [CrossRef] [PubMed]
- Drabsch, T.; Holzapfel, C.; Stecher, L.; Petzold, J.; Skurk, T.; Hauner, H. Associations Between C-Reactive Protein, Insulin Sensitivity, and Resting Metabolic Rate in Adults: A Mediator Analysis. Front. Endocrinol. 2018, 9, 556. [Google Scholar] [CrossRef] [PubMed] [Green Version]
- Weyer, C.; Snitker, S.; Rising, R.; Bogardus, C.; Ravussin, E. Determinants of energy expenditure and fuel utilization in man: Effects of body composition, age, sex, ethnicity and glucose tolerance in 916 subjects. Int. J. Obes. Relat. Metab. Disord. 1999, 23, 715–722. [Google Scholar] [CrossRef] [Green Version]
- Soares, M.; Zhao, Y.; Calton, E.; Pathak, K.; Chan She Ping-Delfos, W.; Cummings, N.; Nsatimba, P. The Impact of the Metabolic Syndrome and Its Components on Resting Energy Expenditure. Metabolites 2022, 12, 722. [Google Scholar] [CrossRef]
- DeFronzo, R.A.; Tobin, J.D.; Andres, R. Glucose clamp technique: A method for quantifying insulin secretion and resistance. Am. J. Physiol. 1979, 237, E214–E223. [Google Scholar] [CrossRef]
- Reaven, G. Wanted!: A standardized measurement of plasma insulin concentration. Arterioscler Thromb. Vasc. Biol. 2011, 31, 954–955. [Google Scholar] [CrossRef] [PubMed] [Green Version]
- Laws, A.; Reaven, G.M. Evidence for an independent relationship between insulin resistance and fasting plasma HDL-cholesterol, triglyceride and insulin concentrations. J. Intern. Med. 1992, 231, 25–30. [Google Scholar] [CrossRef] [PubMed]
- Ren, X.; Chen, Z.A.; Zheng, S.; Han, T.; Li, Y.; Liu, W.; Hu, Y. Association between Triglyceride to HDL-C Ratio (TG/HDL-C) and Insulin Resistance in Chinese Patients with Newly Diagnosed Type 2 Diabetes Mellitus. PLoS ONE 2016, 11, e0154345. [Google Scholar] [CrossRef] [PubMed] [Green Version]
- Kimm, H.; Lee, S.W.; Lee, H.S.; Shim, K.W.; Cho, C.Y.; Yun, J.E.; Jee, S.H. Associations between lipid measures and metabolic syndrome, insulin resistance and adiponectin: Usefulness of lipid ratios in Korean men and women. Circ. J. 2010, 74, 931–937. [Google Scholar] [CrossRef] [Green Version]
- Chauhan, A.; Singhal, A.; Goyal, P. TG/HDL Ratio: A marker for insulin resistance and atherosclerosis in prediabetics or not? J. Family Med. Prim. Care 2021, 10, 3700–3705. [Google Scholar] [CrossRef]
- Gong, R.; Luo, G.; Wang, M.; Ma, L.; Sun, S.; Wei, X. Associations between TG/HDL ratio and insulin resistance in the US population: A cross-sectional study. Endocr. Connect 2021, 10, 1502–1512. [Google Scholar] [CrossRef]
- Fan, N.; Peng, L.; Xia, Z.; Zhang, L.; Song, Z.; Wang, Y.; Peng, Y. Triglycerides to high-density lipoprotein cholesterol ratio as a surrogate for nonalcoholic fatty liver disease: A cross-sectional study. Lipids Health Dis. 2019, 18, 39. [Google Scholar] [CrossRef] [Green Version]
- De Fano, M.; Bartolini, D.; Tortoioli, C.; Vermigli, C.; Malara, M.; Galli, F.; Murdolo, G. Adipose Tissue Plasticity in Response to Pathophysiological Cues: A Connecting Link between Obesity and Its Associated Comorbidities. Int. J. Mol. Sci. 2022, 23, 5511. [Google Scholar] [CrossRef]
- Yang, Q.; Vijayakumar, A.; Kahn, B.B. Metabolites as regulators of insulin sensitivity and metabolism. Nat. Rev. Mol. Cell Biol. 2018, 19, 654–672. [Google Scholar] [CrossRef]
- Matthews, D.R.; Hosker, J.P.; Rudenski, A.S.; Naylor, B.A.; Treacher, D.F.; Turner, R.C. Homeostasis model assessment: Insulin resistance and beta-cell function from fasting plasma glucose and insulin concentrations in man. Diabetologia 1985, 28, 412–419. [Google Scholar] [CrossRef]
- Wallace, T.M.; Levy, J.C.; Matthews, D.R. Use and abuse of HOMA modeling. Diabetes Care 2004, 27, 1487–1495. [Google Scholar] [CrossRef] [PubMed] [Green Version]
- Alberti, K.G.; Eckel, R.H.; Grundy, S.M.; Zimmet, P.Z.; Cleeman, J.I.; Donato, K.A.; Fruchart, J.C.; James, W.P.; Loria, C.M.; Smith, S.C., Jr.; et al. Harmonizing the metabolic syndrome: A joint interim statement of the International Diabetes Federation Task Force on Epidemiology and Prevention; National Heart, Lung, and Blood Institute; American Heart Association; World Heart Federation; International Atherosclerosis Society; and International Association for the Study of Obesity. Circulation 2009, 120, 1640–1645. [Google Scholar] [PubMed] [Green Version]
- American Diabetes Association. 6. Glycemic Targets: Standards of Medical Care in Diabetes-2021. Diabetes Care 2021, 44, S73–S84. [Google Scholar] [CrossRef] [PubMed]
- Silver, H.J.; Niswender, K.D.; Kullberg, J.; Berglund, J.; Johansson, L.; Bruvold, M.; Avison, M.J.; Welch, E.B. Comparison of gross body fat-water magnetic resonance imaging at 3 Tesla to dual-energy X-ray absorptiometry in obese women. Obesity 2013, 21, 765–774. [Google Scholar] [CrossRef] [PubMed] [Green Version]
- Compher, C.; Frankenfield, D.; Keim, N.; Roth-Yousey, L.; Evidence Analysis Working, G. Best practice methods to apply to measurement of resting metabolic rate in adults: A systematic review. J. Am. Diet Assoc. 2006, 106, 881–903. [Google Scholar] [CrossRef]
- Ferrannini, E. The theoretical bases of indirect calorimetry: A review. Metabolism 1988, 37, 287–301. [Google Scholar] [CrossRef]
- Weir, J.B. New methods for calculating metabolic rate with special reference to protein metabolism. J. Physiol. 1949, 109, 1–9. [Google Scholar] [CrossRef]
- Frayn, K.N. Calculation of substrate oxidation rates in vivo from gaseous exchange. J. Appl. Physiol. Respir. Environ. Exerc. Physiol. 1983, 55, 628–634. [Google Scholar] [CrossRef] [Green Version]
- Ginsberg, H.N.; Packard, C.J.; Chapman, M.J.; Boren, J.; Aguilar-Salinas, C.A.; Averna, M.; Ference, B.A.; Gaudet, D.; Hegele, R.A.; Kersten, S.; et al. Triglyceride-rich lipoproteins and their remnants: Metabolic insights, role in atherosclerotic cardiovascular disease, and emerging therapeutic strategies-a consensus statement from the European Atherosclerosis Society. Eur. Heart J. 2021, 42, 4791–4806. [Google Scholar] [CrossRef]
- Carey, V.J.; Bishop, L.; Laranjo, N.; Harshfield, B.J.; Kwiat, C.; Sacks, F.M. Contribution of high plasma triglycerides and low high-density lipoprotein cholesterol to residual risk of coronary heart disease after establishment of low-density lipoprotein cholesterol control. Am. J. Cardiol. 2010, 106, 757–763. [Google Scholar] [CrossRef]
- Murguia-Romero, M.; Jimenez-Flores, J.R.; Sigrist-Flores, S.C.; Espinoza-Camacho, M.A.; Jimenez-Morales, M.; Pina, E.; Mendez-Cruz, A.R.; Villalobos-Molina, R.; Reaven, G.M. Plasma triglyceride/HDL-cholesterol ratio, insulin resistance, and cardiometabolic risk in young adults. J. Lipid Res. 2013, 54, 2795–2799. [Google Scholar] [CrossRef] [PubMed] [Green Version]
- Salazar, M.R.; Carbajal, H.A.; Espeche, W.G.; Dulbecco, C.A.; Aizpurua, M.; Marillet, A.G.; Echeverria, R.F.; Reaven, G.M. Relationships among insulin resistance, obesity, diagnosis of the metabolic syndrome and cardio-metabolic risk. Diab. Vasc. Dis. Res. 2011, 8, 109–116. [Google Scholar] [CrossRef] [PubMed]
- Gonzalez-Chavez, A.; Simental-Mendia, L.E.; Elizondo-Argueta, S. Elevated triglycerides/HDL-cholesterol ratio associated with insulin resistance. Cir. Cir. 2011, 79, 126–131. [Google Scholar] [PubMed]
- Iwani, N.A.; Jalaludin, M.Y.; Zin, R.M.; Fuziah, M.Z.; Hong, J.Y.; Abqariyah, Y.; Mokhtar, A.H.; Wan Nazaimoon, W.M. Triglyceride to HDL-C Ratio is Associated with Insulin Resistance in Overweight and Obese Children. Sci. Rep. 2017, 7, 40055. [Google Scholar] [CrossRef] [Green Version]
- Young, K.A.; Maturu, A.; Lorenzo, C.; Langefeld, C.D.; Wagenknecht, L.E.; Chen, Y.I.; Taylor, K.D.; Rotter, J.I.; Norris, J.M.; Rasouli, N. The triglyceride to high-density lipoprotein cholesterol (TG/HDL-C) ratio as a predictor of insulin resistance, beta-cell function, and diabetes in Hispanics and African Americans. J. Diabetes Complicat. 2019, 33, 118–122. [Google Scholar] [CrossRef]
- Lin, D.; Qi, Y.; Huang, C.; Wu, M.; Wang, C.; Li, F.; Yang, C.; Yan, L.; Ren, M.; Sun, K. Associations of lipid parameters with insulin resistance and diabetes: A population-based study. Clin. Nutr. 2018, 37, 1423–1429. [Google Scholar] [CrossRef]
- Li, C.; Ford, E.S.; Meng, Y.X.; Mokdad, A.H.; Reaven, G.M. Does the association of the triglyceride to high-density lipoprotein cholesterol ratio with fasting serum insulin differ by race/ethnicity? Cardiovasc. Diabetol. 2008, 7, 4. [Google Scholar] [CrossRef] [Green Version]
- Korenblat, K.M.; Fabbrini, E.; Mohammed, B.S.; Klein, S. Liver, muscle, and adipose tissue insulin action is directly related to intrahepatic triglyceride content in obese subjects. Gastroenterology 2008, 134, 1369–1375. [Google Scholar] [CrossRef] [Green Version]
- Gormsen, L.C.; Nellemann, B.; Sorensen, L.P.; Jensen, M.D.; Christiansen, J.S.; Nielsen, S. Impact of body composition on very-low-density lipoprotein-triglycerides kinetics. Am. J. Physiol. Endocrinol. Metab. 2009, 296, E165–E173. [Google Scholar] [CrossRef] [Green Version]
- Boren, J.; Taskinen, M.R.; Bjornson, E.; Packard, C.J. Metabolism of triglyceride-rich lipoproteins in health and dyslipidaemia. Nat. Rev. Cardiol. 2022, 19, 577–592. [Google Scholar] [CrossRef]
- Paradies, G.; Paradies, V.; Ruggiero, F.M.; Petrosillo, G. Oxidative stress, cardiolipin and mitochondrial dysfunction in nonalcoholic fatty liver disease. World J. Gastroenterol. 2014, 20, 14205–14218. [Google Scholar] [CrossRef] [PubMed]
- Lockman, K.A.; Baren, J.P.; Pemberton, C.J.; Baghdadi, H.; Burgess, K.E.; Plevris-Papaioannou, N.; Lee, P.; Howie, F.; Beckett, G.; Pryde, A.; et al. Oxidative stress rather than triglyceride accumulation is a determinant of mitochondrial dysfunction in in vitro models of hepatic cellular steatosis. Liver Int. 2012, 32, 1079–1092. [Google Scholar] [CrossRef]
- Manzoni, G.; Oltolini, A.; Perra, S.; Muraca, E.; Ciardullo, S.; Pizzi, M.; Castoldi, G.; Lattuada, G.; Pizzi, P.; Perseghin, G. Resting Whole Body Energy Metabolism in Class 3 Obesity; from Preserved Insulin Sensitivity to Overt Type 2 Diabetes. Diabetes Metab. Syndr. Obes. 2020, 13, 489–497. [Google Scholar] [CrossRef] [Green Version]
- Das, M.; Sauceda, C.; Webster, N.J.G. Mitochondrial Dysfunction in Obesity and Reproduction. Endocrinology 2021, 162, bqaa158. [Google Scholar] [CrossRef] [PubMed]
- Montgomery, M.K.; Turner, N. Mitochondrial dysfunction and insulin resistance: An update. Endocr. Connect 2015, 4, R1–R15. [Google Scholar] [CrossRef] [PubMed] [Green Version]
- Boudina, S.; Graham, T.E. Mitochondrial function/dysfunction in white adipose tissue. Exp. Physiol. 2014, 99, 1168–1178. [Google Scholar] [CrossRef]
- Shook, R.P.; Hand, G.A.; Paluch, A.E.; Wang, X.; Moran, R.; Hebert, J.R.; Lavie, C.J.; Blair, S.N. Moderate cardiorespiratory fitness is positively associated with resting metabolic rate in young adults. Mayo Clin. Proc. 2014, 89, 763–771. [Google Scholar] [CrossRef]


| Normal (BMI 18.5–24.9) n = 38 | Overweight (BMI 25.0–29.9) n = 86 | Class I/II Obese (BMI 30.0–39.9) n = 442 | Class III Obese (BMI ≥ 40.0) n = 79 | p-Value | |
|---|---|---|---|---|---|
| Age (y) | 35.5 ± 13.0 | 39.3 ± 17.9 | 42.8 ± 12.6 | 45.4 ± 11.5 | <0.001 |
| Weight (kg) | 67.3 ± 10.3 | 85.3 ± 11.9 | 98.5 ± 14.4 | 123.0 ± 15.8 | <0.001 |
| BMI (kg/m2) | 23.3 ± 1.5 | 27.9 ± 1.4 | 34.6 ± 2.7 | 43.3 ± 3.4 | <0.001 |
| Glucose (mg/dL) | 84.2 ± 31.9 | 93.9 ± 23.7 | 99.8 ± 28.4 | 114.7 ± 46.3 | <0.001 |
| Insulin (μIU/mL) | 6.1 ± 3.6 | 7.7 ± 8.2 | 10.9 ± 8.6 | 18.9 ± 16.5 | <0.001 |
| HOMA-IR (score) | 1.6 ± 2.3 | 1.9 ± 2.4 | 2.9 ± 3.1 | 7.0 ± 9.3 | <0.001 |
| Triglycerides (mg/dL) | 66.5 ± 29.1 | 81.1 ± 35.3 | 110.4 ± 64.1 | 129.4 ± 59.2 | <0.001 |
| HDL-cholesterol (mg/dL) | 62.3 ± 13.6 | 53.4 ± 13.6 | 47.5 ± 12.5 | 44.3 ± 10.8 | <0.001 |
| TG/HDL (ratio) | 1.1 ± 0.5 | 1.7 ± 1.0 | 2.6 ± 2.0 | 3.3 ± 2.0 | <0.001 |
| REE (kcal) | 1475.4 ± 369.3 | 1742.3 ± 365.5 | 1721.9 ± 338.3 | 1968.2 ± 362.8 | <0.001 |
| % CHO (kcal) | 32.1 ± 14.9 | 32.4 ± 14.7 | 31.6 ± 15.5 | 29.3 ± 14.2 | 0.618 |
| % Fat (kcal) | 50.8 ± 18.2 | 52.8 ± 15.4 | 49.9 ± 15.7 | 52.8 ± 14.6 | 0.276 |
| Metabolic Equivalents (kcal/min) | 0.88 ± 0.11 | 0.82 ± 0.10 | 0.74 ± 0.11 | 0.66 ± 0.08 | <0.001 |
| Respiratory Quotient (VCO2/VO2) | 0.82 ± 0.07 | 0.82 ± 0.05 | 0.82 ± 0.06 | 0.81 ± 0.05 | 0.235 |
| Total Tissue Mass (kg) a | 77.2 ± 13.6 | 89.2 ± 12.8 | 96.9 ± 13.7 | 119.0 ± 15.4 | <0.001 |
| Total Fat Mass (kg) | 18.5 ± 9.0 | 27.1 ± 6.5 | 40.8 ± 7.6 | 58.1 ± 9.5 | <0.001 |
| Total Fat (% tissue) | 28.1 ± 8.4 | 33.1 ± 8.6 | 43.8 ± 7.2 | 49.3 ± 6.2 | <0.001 |
| Trunk Fat (kg) | 9.5 ± 5.7 | 15.6 ± 5.0 | 22.9 ± 5.3 | 35.4 ± 7.1 | <0.001 |
| Trunk Fat (% tissue) | 31.5 ± 16.5 | 37.0 ± 10.4 | 47.1 ± 7.3 | 54.5 ± 5.3 | <0.001 |
| Visceral Adipose Tissue (kg) | 1.1 ± 0.7 | 1.4 ± 0.9 | 1.7 ± 1.1 | 2.5 ± 1.2 | <0.001 |
| Android Fat (kg) | 1.5 ± 1.1 | 2.6 ± 1.0 | 4.0 ± 1.1 | 6.3 ± 1.4 | <0.001 |
| Android Fat (% tissue) | 31.8 ± 13.6 | 40.1 ± 11.2 | 50.9 ± 7.4 | 57.0 ± 5.8 | <0.001 |
| Gynoid Fat (kg) | 3.6 ± 1.5 | 4.0 ± 1.2 | 6.6 ± 1.7 | 9.5 ± 2.1 | <0.001 |
| Gynoid Fat (% tissue) | 35.9 ± 10.7 | 33.4 ± 10.5 | 44.9 ± 9.0 | 49.8 ± 7.5 | <0.001 |
| Total Lean Mass (kg) | 45.5 ± 8.4 | 57.6 ± 14.1 | 53.2 ± 12.6 | 59.9 ± 12.2 | <0.001 |
| Trunk Lean (kg) | 21.9 ± 4.2 | 27.5 ± 7.1 | 25.3 ± 5.9 | 28.8 ± 5.6 | <0.001 |
| Android Lean (kg) | 2.9 ± 0.7 | 3.9 ± 0.9 | 3.8 ± 0.8 | 4.5 ± 0.9 | <0.001 |
| Gynoid Lean (kg) | 6.4 ± 1.4 | 8.9 ± 2.4 | 8.4 ± 2.1 | 9.7 ± 2.2 | <0.001 |
| Variable | rho | 95% CI | p-Value |
|---|---|---|---|
| Sex (f/m) | 0.34 | 0.26, 0.41 | <0.001 |
| Race/Ethnicity (w/b) | −0.17 | −0.24, −0.09 | <0.001 |
| Age (y) | −0.16 | −0.24, −0.08 | <0.001 |
| Height (cm) | 0.64 | 0.58, 0.68 | <0.001 |
| Weight (kg) | 0.66 | 0.61, 0.71 | <0.001 |
| BMI (kg/m2) | 0.28 | 0.21, 0.36 | <0.001 |
| Glucose (mg/dL) | 0.19 | 0.11, 0.27 | <0.001 |
| Insulin (μIU/mL) | 0.18 | 0.09, 0.27 | <0.001 |
| HOMA-IR (score) | 0.19 | 0.10, 0.28 | <0.001 |
| HOMA-%β | 0.05 | −0.04, 0.15 | 0.255 |
| Triglycerides (mg/dL) | 0.27 | 0.16, 0.32 | <0.001 |
| HDL-cholesterol (mg/dL) | −0.37 | −0.42, −0.27 | <0.001 |
| TG/HDL (ratio) | 0.34 | 0.26, 0.42 | <0.001 |
| Visceral Adipose Tissue (g) | −0.09 | −0.85, 0.79 | 0.87 |
| Trunk Fat (g) | 0.40 | −0.07, 0.72 | 0.08 |
| Android Fat (g) | 0.40 | −0.07, 0.72 | 0.08 |
| Gynoid Fat (g) | −0.01 | −0.46, 0.45 | 0.97 |
| Total Fat Mass (g) | 0.33 | −0.15, 0.68 | 0.16 |
| Trunk Lean (g) | 0.77 | 0.48, 0.91 | <0.001 |
| Android Lean (g) | 0.78 | 0.50, 0.91 | <0.001 |
| Gynoid Lean (g) | 0.74 | 0.43, 0.89 | <0.001 |
| Total Fat-Free Mass (g) | 0.76 | 0.46, 0.90 | <0.001 |
| Total Body Mass (g) | 0.82 | 0.74, 0.88 | <0.001 |
| Total Body Fat (%) | 0.07 | −0.39, 0.51 | 0.76 |
| Trunk Fat (%) | −0.09 | −0.85, 0.79 | 0.87 |
| Android Fat (%) | 0.20 | −0.28, 0.60 | 0.39 |
| Gynoid Fat (%) | −0.26 | −0.64, 0.22 | 0.27 |
| Variables | Normal Weight BMI | Overweight BMI | Obese Class I/II BMI | Obese Class III BMI | ||||||||||||
|---|---|---|---|---|---|---|---|---|---|---|---|---|---|---|---|---|
| Model 1 | Adjusted R2 = 0.62, p < 0.001 | Adjusted R2 = 0.63, p < 0.001 | Adjusted R2 = 0.58, p < 0.001 | Adjusted R2 = 0.61, p < 0.001 | ||||||||||||
| Estimate | St Error | t Statistic | p value | Estimate | St Error | t Statistic | p value | Estimate | St Error | t Statistic | p value | Estimate | St Error | t Statistic | p value | |
| Constant | −930.04 | 1263.68 | −0.736 | 0.47 | −854.30 | 707.82 | −1.207 | 0.23 | −1100.58 | 239.24 | −4.600 | <0.001 | −1875.3 | 713.07 | −2.630 | 0.01 |
| Height | 7.85 | 10.73 | 0.731 | 0.47 | 10.45 | 6.32 | 1.654 | 0.10 | 13.05 | 2.02 | 6.454 | <0.001 | 16.72 | 5.70 | 2.935 | 0.005 |
| Weight | 14.71 | 9.74 | 1.511 | 0.14 | 9.71 | 5.49 | 1.766 | 0.08 | 7.35 | 1.40 | 5.248 | <0.001 | 9.92 | 2.90 | 3.424 | 0.001 |
| Sex | 246.02 | 113.41 | 2.169 | 0.04 | 113.92 | 67.12 | 1.696 | 0.09 | 55.20 | 25.73 | 2.146 | 0.03 | −45.46 | 62.31 | −0.730 | 0.47 |
| Age | −7.12 | 3.43 | −2.075 | 0.05 | −6.21 | 1.45 | −4.296 | <0.001 | −4.20 | 0.87 | −4.824 | <0.001 | −2.95 | 2.31 | −1.277 | 0.21 |
| Model 2 | Adjusted R2 = 0.63, p = 0.001 | Adjusted R2 = 0.79, p < 0.001 | Adjusted R2 = 0.65, p < 0.001 | Adjusted R2 = 0.68, p < 0.001 | ||||||||||||
| Estimate | St Error | t Statistic | p value | Estimate | St Error | t Statistic | p value | Estimate | St Error | t Statistic | p value | Estimate | St Error | t Statistic | p value | |
| Constant | 1894.29 | 1358.7 | 1.394 | 0.19 | −1291.30 | 1087.25 | −1.188 | 0.24 | 363.55 | 277.06 | 1.312 | 0.19 | −38.13 | 849.88 | −0.045 | 0.96 |
| Height | −14.42 | 11.51 | −1.252 | 0.23 | 13.50 | 9.92 | 1.362 | 0.18 | 2.19 | 2.27 | 0.963 | 0.34 | 3.21 | 6.77 | 0.474 | 0.64 |
| Weight | 10.68 | 9.73 | 1.097 | 0.29 | 2.92 | 7.37 | 0.396 | 0.69 | 1.51 | 1.45 | 1.044 | 0.30 | 5.29 | 3.12 | 1.702 | 0.09 |
| Sex | −60.21 | 118.61 | −0.508 | 0.62 | −10.82 | 88.21 | −0.123 | 0.90 | 4.84 | 24.21 | 0.200 | 0.84 | −151.22 | 64.56 | −2.342 | 0.02 |
| Age | −1.91 | 3.68 | −0.519 | 0.61 | −3.53 | 2.07 | −1.704 | 0.10 | −2.51 | 0.82 | −3.039 | 0.003 | −2.34 | 2.26 | −1.033 | 0.31 |
| Fat-Free Mass | 0.03 | 0.01 | 2.953 | 0.01 | 0.01 | 0.01 | 1.618 | 0.10 | 0.02 | 0.002 | 9.501 | <0.001 | 0.02 | 0.01 | 3.831 | <0.001 |
| Model 3 | Adjusted R2 = 0.79, p = 0.01 | Adjusted R2 = 0.87, p < 0.001 | Adjusted R2 = 0.71, p < 0.001 | Adjusted R2 = 0.74, p < 0.001 | ||||||||||||
| Estimate | St Error | t Statistic | p value | Estimate | St Error | t Statistic | p value | Estimate | St Error | t Statistic | p value | Estimate | St Error | t Statistic | p value | |
| Constant | 2354.36 | 1360.47 | 1.731 | 0.13 | 1335.92 | 2110.63 | 0.633 | 0.54 | 387.33 | 292.48 | 1.324 | 0.19 | 284.93 | 884.85 | 0.322 | 0.75 |
| Height | −19.05 | 12.70 | −1.500 | 0.18 | −6.24 | 18.25 | −0.342 | 0.74 | 2.02 | 2.38 | 0.848 | 0.40 | −0.18 | 6.90 | −0.027 | 0.98 |
| Weight | 1.12 | 8.00 | 0.140 | 0.89 | 4.74 | 14.54 | 0.326 | 0.75 | 1.24 | 1.49 | 0.837 | 0.40 | 6.62 | 3.21 | 2.062 | 0.05 |
| Sex | −167.42 | 114.91 | −1.457 | 0.19 | −153.94 | 147.25 | −1.045 | 0.31 | 1.62 | 24.22 | 0.067 | 0.95 | −131.12 | 69.25 | −1.893 | 0.06 |
| Age | −5.45 | 4.00 | −1.363 | 0.22 | −5.71 | 6.94 | −0.823 | 0.42 | −2.61 | 1.01 | −2.587 | 0.01 | −2.52 | 2.63 | −0.959 | 0.34 |
| Fat-Free Mass | 0.06 | 0.02 | 2.410 | 0.05 | 0.02 | 0.01 | 1.715 | 0.11 | 0.02 | 0.002 | 9.210 | <0.001 | 0.02 | 0.01 | 3.518 | <0.001 |
| TG/HDL ratio | 173.48 | 91.09 | 1.904 | 0.09 | 86.18 | 71.10 | 2.212 | 0.02 | 21.68 | 5.77 | 3.759 | <0.001 | 30.22 | 14.62 | 2.068 | 0.04 |
| Model 4 | Adjusted R2 = 0.75, p < 0.001 | Adjusted R2 = 0.84, p = 0.01 | Adjusted R2 = 0.73, p < 0.001 | Adjusted R2 = 0.75, p < 0.001 | ||||||||||||
| Estimate | St Error | t Statistic | p value | Estimate | St Error | t Statistic | p value | Estimate | St Error | t Statistic | p value | Estimate | St Error | t Statistic | p value | |
| Constant | 1294.20 | 1473.54 | 0.878 | 0.40 | 2317.58 | 4406.44 | 0.526 | 0.62 | 219.82 | 323.78 | 0.679 | 0.49 | 1294.2 | 1473.54 | 0.878 | 0.40 |
| Height | −7.48 | 12.95 | −0.577 | 0.57 | −3.28 | 37.70 | −0.087 | 0.93 | 3.68 | 2.6 | 1.418 | 0.16 | −7.48 | 12.90 | −0.577 | 0.57 |
| Weight | 5.85 | 10.37 | 0.564 | 0.58 | −13.67 | 27.76 | −0.493 | 0.64 | 0.49 | 1.67 | 0.292 | 0.77 | 5.85 | 10.37 | 0.564 | 0.58 |
| Sex | −129.40 | 107.59 | −1.203 | 0.25 | −225.14 | 251.89 | −0.894 | 0.41 | −7.18 | 25.08 | −0.286 | 0.78 | −129.39 | 107.59 | −1.203 | 0.25 |
| Age | −1.33 | 5.13 | −0.260 | 0.80 | −10.47 | 12.08 | −0.866 | 0.43 | −2.76 | 1.42 | −1.949 | 0.05 | −1.33 | 5.13 | −0.260 | 0.80 |
| Fat-Free Mass | 20.77 | 7.96 | 2.610 | 0.02 | 29.38 | 15.59 | 1.89 | 0.12 | 16.44 | 2.08 | 7.900 | <0.001 | 20.77 | 7.96 | 2.610 | 0.02 |
| TG/HDL ratio | 67.78 | 27.58 | 2.457 | 0.03 | 162.37 | 114.72 | 1.42 | 0.22 | 23.41 | 6.49 | 3.61 | <0.001 | 67.78 | 27.58 | 2.46 | 0.03 |
| HOMA-IR | −2.46 | 5.52 | −0.446 | 0.66 | 11.69 | 23.12 | 0.505 | 0.64 | 8.03 | 3.78 | 2.12 | 0.04 | −2.64 | 5.52 | −0.446 | 0.66 |
| Normoglycemic n = 384 | Prediabetic n = 159 | Diabetic n = 102 | p-Value | |
|---|---|---|---|---|
| Age (y) | 36.9 ± 12.1 | 49.2 ±12.5 | 51.1 ± 9.6 | <0.001 |
| Weight (kg) | 93.7 ± 17.9 | 102.7 ± 18.3 | 106.2 ± 17.9 | <0.001 |
| BMI (kg/m2) | 32.6 ± 5.0 | 36.4 ± 5.6 | 36.2 ± 4.8 | <0.001 |
| Glucose (mg/dL) | 87.9 ± 9.6 | 100.6 ± 15.7 | 143.9 ± 55.4 | <0.001 |
| Insulin (μIU/mL) | 9.1 ± 7.0 | 9.6 ± 8.1 | 20.0 ± 15.3 | <0.001 |
| HOMA-IR (score) | 2.0 ± 1.7 | 2.6 ± 2.3 | 7.9 ± 7.9 | <0.001 |
| Triglycerides (mg/dL) | 90.1 ± 49.2 | 116.8 ± 54.9 | 162.2 ± 79.0 | <0.001 |
| HDL-cholesterol (mg/dL) | 50.7 ± 13.5 | 47.2 ± 10.9 | 41.9 ± 12.1 | <0.001 |
| TG/HDL (ratio) | 2.0 ± 1.5 | 2.7 ± 1.8 | 4.3 ± 2.7 | <0.001 |
| REE (kcal) | 1717.3 ± 367.9 | 1701.1 ± 350.1 | 1879.8 ± 318.0 | <0.001 |
| % CHO (kcal) | 32.9 ± 15.8 | 31.0 ± 14.9 | 26.7 ± 12.1 | 0.002 |
| % Fat (kcal) | 50.3 ± 16.2 | 48.4 ± 15.2 | 55.9 ± 13.2 | 0.001 |
| Metabolic Equivalents (kcal/min) | 0.77 ± 0.11 | 0.73 ± 0.18 | 0.74 ± 0.08 | 0.003 |
| Respiratory Quotient (VCO2/VO2) | 0.82 ± 0.06 | 0.82 ± 0.06 | 0.80 ± 0.05 | 0.068 |
| Total Tissue Mass (kg) a | 96.3 ± 14.7 | 94.7 ± 13.8 | 104.5 ± 17.7 | <0.001 |
| Total Fat Mass (kg) | 38.2 ± 10.9 | 44.7 ± 12.1 | 44.2 ± 10.7 | <0.001 |
| Total Fat (% tissue) | 41.8 ± 9.6 | 45.3 ± 6.9 | 43.4 ± 6.5 | <0.001 |
| Trunk Fat (kg) | 19.9 ± 7.1 | 25.9 ± 7.8 | 27.0 ± 6.8 | <0.001 |
| Trunk Fat (% tissue) | 44.3 ± 10.3 | 49.7 ± 6.6 | 48.5 ± 5.6 | <0.001 |
| Android Fat (kg) | 3.4 ± 1.4 | 4.6 ± 1.5 | 4.8 ± 1.4 | <0.001 |
| Android Fat (% tissue) | 47.7 ± 10.9 | 53.2 ± 6.6 | 52.3 ± 5.9 | <0.001 |
| Visceral Adipose Tissue (kg) | 1.3 ± 0.9 | 2.0 ± 1.1 | 2.4 ± 1.3 | <0.001 |
| Gynoid Fat (kg) | 6.2 ± 2.1 | 7.2 ± 2.4 | 6.6 ± 2.1 | <0.001 |
| Gynoid Fat (% tissue) | 44.1 ± 10.8 | 45.4 ± 8.7 | 42.6 ± 8.7 | 0.098 |
| Total Lean Mass (kg) | 53.6 ± 14.1 | 53.4 ± 10.8 | 57.3 ± 11.1 | 0.049 |
| Trunk Lean Mass (kg) | 25.2 ± 6.9 | 25.6 ± 5.2 | 27.8 ± 4.9 | 0.007 |
| Android Lean Mass (kg) | 3.7 ± 0.9 | 3.9 ± 0.8 | 4.3 ± 0.9 | <0.001 |
| Gynoid Lean Mass (kg) | 8.5 ± 2.5 | 8.5 ± 1.8 | 8.7 ± 1.9 | 0.686 |
| Metabolic Syndrome n = 254 | No Metabolic Syndrome n = 391 | p-Value | |
|---|---|---|---|
| Age (y) | 46.8 ± 12.8 | 39.3 ± 13.1 | <0.001 |
| Weight (kg) | 93.0 ± 17.3 | 105.4 ± 18.4 | <0.001 |
| BMI (kg/m2) | 36.5 ± 4.9 | 32.5 ± 5.2 | <0.001 |
| Glucose (mg/dL) | 111.4 ± 40.9 | 92.5 ± 20.3 | <0.001 |
| Insulin (μIU/mL) | 16.9 ± 13.0 | 8.7 ± 7.0 | <0.001 |
| HOMA-IR (score) | 5.5 ± 6.2 | 2.1 ± 2.4 | <0.001 |
| Triglycerides (mg/dL) | 143.7 ± 70.9 | 81.0 ± 35.0 | <0.001 |
| HDL-cholesterol (mg/dL) | 42.9 ± 10.8 | 52.7 ± 13.1 | <0.001 |
| TG/HDL (ratio) | 3.7 ± 2.4 | 1.7 ± 0.9 | <0.001 |
| REE (kcal) | 1813.0 ± 374.3 | 1689.9 ± 344.5 | <0.001 |
| % CHO (kcal) | 30.6 ± 14.7 | 32.0 ± 15.5 | 0.267 |
| % Fat (kcal) | 50.0 ± 14.7 | 51.2 ± 16.3 | 0.374 |
| Metabolic Equivalents (kcal/min) | 0.74 ± 0.13 | 0.77 ± 0.12 | 0.029 |
| Respiratory Quotient (VCO2/VO2) | 0.82 ± 0.05 | 0.82 ± 0.06 | 0.828 |
| Total Tissue Mass (kg) a | 104.9 ± 16.2 | 95.0 ± 14.5 | 0.938 |
| Total Fat Mass (kg) | 45.1 ± 10.8 | 37.9 ± 11.2 | <0.001 |
| Total Fat (% tissue) | 44.4 ± 6.9 | 41.9 ± 9.5 | <0.001 |
| Trunk Fat (kg) | 26.8 ± 7.2 | 20.0 ± 7.2 | <0.001 |
| Trunk Fat (% tissue) | 49.5 ± 6.3 | 44.3 ± 9.9 | <0.001 |
| Visceral Adipose Tissue (kg) | 2.1 ± 1.2 | 1.4 ± 1.0 | <0.001 |
| Android Fat (kg) | 4.7 ± 1.4 | 3.4 ± 1.4 | <0.001 |
| Android Fat (% tissue) | 52.9 ± 6.5 | 47.9 ± 10.8 | <0.001* |
| Gynoid Fat (kg) | 7.1 ± 2.1 | 6.1 ± 2.2 | <0.001 |
| Gynoid Fat (% tissue) | 44.2 ± 8.5 | 44.2 ± 10.9 | 0.945 |
| Total Lean Mass (kg) | 56.6 ± 12.9 | 52.4 ± 12.5 | <0.001 |
| Trunk Lean Mass (kg) | 26.7 ± 5.9 | 25.0 ± 6.1 | 0.004 |
| Android Lean Mass (kg) | 4.1 ± 0.9 | 3.7 ± 0.9 | <0.001 |
| Gynoid Lean Mass (kg) | 8.8 ± 2.2 | 8.3 ± 2.2 | 0.010 |
| Variables | Normoglycemia | Prediabetes | Diabetes Type 2 | |||||||||
|---|---|---|---|---|---|---|---|---|---|---|---|---|
| Model 1 | Adjusted R2 = 0.65, p < 0.001 | Adjusted R2 = 0.55, p < 0.001 | Adjusted R2 = 0.62, p < 0.001 | |||||||||
| Estimate | St Error | t Statistic | p value | Estimate | St Error | t Statistic | p value | Estimate | St Error | t Statistic | p value | |
| Constant | −1372.58 | 214.23 | −6.407 | <0.001 | −613.78 | 420.35 | −1.460 | 0.15 | 588.92 | 570.80 | 1.032 | 0.31 |
| Age | −5.39 | 0.98 | −5.521 | <0.001 | −3.69 | 1.59 | −2.325 | 0.02 | −8.50 | 2.24 | −3.800 | <0.001 |
| Sex | 62.24 | 25.82 | 2.410 | 0.02 | 68.98 | 53.08 | 1.299 | 0.20 | 174.89 | 67.12 | 2.606 | 0.01 |
| Height | 14.31 | 1.45 | 9.862 | <0.001 | 8.52 | 2.97 | 2.867 | 0.01 | 2.49 | 4.06 | 0.613 | 0.54 |
| Weight | 8.21 | 0.78 | 10.548 | <0.001 | 9.55 | 1.26 | 7.577 | <0.001 | 9.90 | 1.54 | 6.449 | <0.001 |
| Model 2 | Adjusted R2 = 0.75, p < 0.001 | Adjusted R2 = 0.60, p < 0.001 | Adjusted R2 = 0.63, p < 0.001 | |||||||||
| Estimate | St Error | t Statistic | p value | Estimate | St Error | t Statistic | p value | Estimate | St Error | t Statistic | p value | |
| Constant | 205.00 | 276.14 | 0.742 | 0.46 | 787.46 | 495.81 | 1.588 | 0.12 | 852.83 | 594.70 | 1.434 | 0.16 |
| Age | −2.67 | 0.94 | −2.829 | 0.01 | −3.39 | 1.54 | −2.201 | 0.03 | −6.86 | 2.38 | −2.881 | 0.01 |
| Sex | 1.15 | 24.03 | 0.048 | 0.96 | −64.98 | 57.92 | −1.122 | 0.26 | 2.63 | 94.96 | 0.028 | 0.98 |
| Height | 2.24 | 2.04 | 1.098 | 0.27 | −2.26 | 3.60 | −0.628 | 0.53 | 0.19 | 4.24 | 0.045 | 0.96 |
| Weight | 3.79 | 0.95 | 3.975 | <0.001 | 3.22 | 1.81 | 1.781 | 0.08 | 4.38 | 2.66 | 1.646 | 0.10 |
| Fat-Free Mass | 0.02 | 0.00 | 8.604 | <0.001 | 0.02 | 0.01 | 4.869 | <0.001 | 0.02 | 0.01 | 2.585 | 0.01 |
| Model 3 | Adjusted R2 = 0.78, p < 0.001 | Adjusted R2 = 0.66, p < 0.001 | Adjusted R2 = 0.73, p < 0.001 | |||||||||
| Estimate | St Error | t Statistic | p value | Estimate | St Error | t Statistic | p value | Estimate | St Error | t Statistic | p value | |
| Constant | 453.32 | 299.07 | 1.516 | 0.13 | 1086.18 | 550.69 | 1.972 | 0.05 | 434.26 | 594.02 | 0.731 | 0.47 |
| Age | −3.60 | 1.32 | −2.729 | 0.01 | −4.12 | 1.93 | −2.137 | 0.04 | 0.28 | 2.78 | 0.099 | 0.92 |
| Sex | 2.85 | 23.98 | 0.119 | 0.91 | −172.80 | 66.44 | −2.601 | 0.01 | −51.52 | 89.51 | −0.576 | 0.57 |
| Height | 0.99 | 2.18 | 0.455 | 0.65 | −4.76 | 4.00 | −1.188 | 0.24 | 0.01 | 4.31 | 0.001 | 1.00 |
| Weight | 2.96 | 1.02 | 2.916 | 0.004 | 3.78 | 1.98 | 1.912 | 0.06 | 3.27 | 2.48 | 1.317 | 0.19 |
| Fat-Free Mass | 0.02 | 0.00 | 8.321 | <0.001 | 0.03 | 0.01 | 5.220 | <0.001 | 0.02 | 0.01 | 3.654 | <0.001 |
| TG/HDL ratio | 31.57 | 7.50 | 4.212 | <0.001 | −5.79 | 11.98 | −0.483 | 0.63 | 16.11 | 9.41 | 1.712 | 0.09 |
| Model 4 | Adjusted R2 = 0.77, p < 0.001 | Adjusted R2 = 0.67, p < 0.001 | Adjusted R2 = 0.72, p < 0.001 | |||||||||
| Estimate | St Error | t Statistic | p value | Estimate | St Error | t Statistic | p value | Estimate | St Error | t Statistic | p value | |
| Constant | 179.75 | 342.41 | 0.525 | 0.60 | 224.97 | 1178.83 | 0.191 | 0.85 | 566.34 | 723.76 | 0.782 | 0.44 |
| Age | −3.27 | 1.62 | −2.021 | 0.04 | −1.19 | 6.88 | −0.173 | 0.87 | −2.84 | 3.83 | −0.743 | 0.46 |
| Sex | −2.62 | 24.99 | −0.105 | 0.92 | −403.43 | 101.27 | −3.984 | 0.001 | −7.68 | 122.29 | −0.063 | 0.95 |
| Height | 4.18 | 2.56 | 1.634 | 0.10 | 9.21 | 8.79 | 1.049 | 0.31 | −0.11 | 5.14 | −0.021 | 0.98 |
| Weight | 0.33 | 1.44 | 0.227 | 0.82 | −2.53 | 7.88 | −0.322 | 0.75 | 4.56 | 3.31 | 1.378 | 0.18 |
| Fat-Free Mass | 0.02 | 0.00 | 7.344 | <0.001 | 0.02 | 0.01 | 2.056 | 0.05 | 0.02 | 0.01 | 2.624 | 0.01 |
| TG/HDL ratio | 25.57 | 8.12 | 3.150 | 0.002 | 22.57 | 8.61 | 2.980 | 0.004 | 12.61 | 5.84 | 2.374 | 0.01 |
| HOMA-IR | 18.70 | 7.83 | 2.388 | 0.02 | −12.73 | 20.54 | −0.620 | 0.55 | −2.58 | 3.39 | −0.761 | 0.45 |
| Variables | No Metabolic Syndrome | Metabolic Syndrome | ||||||
|---|---|---|---|---|---|---|---|---|
| Model 1 | Adjusted R2 = 0.60, p < 0.001 | Adjusted R2 = 0.66, p < 0.001 | ||||||
| Estimate | St Error | t Statistic | p value | Estimate | St Error | t Statistic | p value | |
| Constant | −1563.30 | 215.27 | −7.262 | <0.001 | −50.71 | 316.33 | −0.16 | 0.87 |
| Age | −3.90 | 0.90 | −4.325 | <0.001 | −6.77 | 1.14 | −5.912 | <0.001 |
| Sex | 55.25 | 26.20 | 2.109 | 0.04 | 130.68 | 40.16 | 3.254 | 0.001 |
| Height | 15.70 | 1.45 | 10.796 | <0.001 | 5.14 | 2.23 | 2.306 | 0.02 |
| Weight | 7.17 | 0.78 | 9.235 | <0.001 | 10.78 | 1.02 | 10.564 | <0.001 |
| Model 2 | Adjusted R2 = 0.69, p < 0.001 | Adjusted R2 = 0.70, p < 0.001 | ||||||
| Estimate | St Error | t Statistic | p value | Estimate | St Error | t Statistic | p value | |
| Constant | −65.64 | 272.16 | −0.241 | 0.81 | 1196.72 | 373.86 | 3.201 | 0.002 |
| Age | −1.34 | 0.87 | −1.545 | 0.12 | −5.23 | 1.24 | −4.210 | <0.001 |
| Sex | −12.02 | 24.34 | −0.494 | 0.62 | 24.97 | 46.70 | 0.535 | 0.59 |
| Height | 4.21 | 2.00 | 2.103 | 0.04 | −4.65 | 2.77 | −1.682 | 0.09 |
| Weight | 2.81 | 0.92 | 3.052 | 0.00 | 6.09 | 1.37 | 4.443 | <0.001 |
| Fat-Free Mass | 0.02 | 0.00 | 8.451 | <0.001 | 0.02 | 0.00 | 5.471 | <0.001 |
| Model 3 | Adjusted R2 = 0.72, p < 0.001 | Adjusted R2 = 0.75, p < 0.001 | ||||||
| Estimate | St Error | t Statistic | p value | Estimate | St Error | t Statistic | p value | |
| Constant | 202.97 | 315.17 | 0.644 | 0.52 | 1062.65 | 386.41 | 2.75 | 0.01 |
| Age | −2.38 | 1.42 | −1.680 | 0.09 | −4.05 | 1.38 | −2.945 | 0.004 |
| Sex | −39.82 | 25.20 | −1.580 | 0.12 | 35.77 | 47.01 | 0.761 | 0.45 |
| Height | 2.78 | 2.28 | 1.221 | 0.22 | −4.34 | 2.85 | −1.523 | 0.13 |
| Weight | 2.52 | 1.07 | 2.351 | 0.02 | 5.87 | 1.39 | 4.227 | <0.001 |
| Fat-Free Mass | 0.02 | 0.00 | 7.883 | <0.001 | 0.02 | 0.00 | 5.225 | <0.001 |
| TG/HDL ratio | 31.35 | 13.16 | 2.382 | 0.02 | 16.59 | 6.66 | 2.492 | 0.01 |
| Model 4 | Adjusted R2 = 0.70, p < 0.001 | Adjusted R2 = 0.78, p < 0.001 | ||||||
| Estimate | St Error | t Statistic | p value | Estimate | St Error | t Statistic | p value | |
| Constant | −87.01 | 348.05 | −0.250 | 0.80 | 1082.45 | 514.49 | 2.104 | 0.04 |
| Age | −1.46 | 1.57 | −0.928 | 0.36 | −2.26 | 2.22 | −1.017 | 0.31 |
| Sex | −37.23 | 25.73 | −1.447 | 0.15 | 77.96 | 59.67 | 1.307 | 0.20 |
| Height | 6.27 | 2.59 | 2.419 | 0.02 | −5.61 | 3.98 | −1.408 | 0.16 |
| Weight | −0.81 | 1.45 | −0.562 | 0.58 | 8.32 | 2.91 | 2.86 | 0.006 |
| Fat-Free Mass | 15.95 | 2.17 | 7.34 | <0.001 | 14.47 | 4.20 | 3.447 | <0.001 |
| TG/HDL ratio | 24.86 | 13.78 | 1.855 | 0.05 | 19.28 | 8.04 | 2.399 | 0.01 |
| HOMA-IR | 9.45 | 4.59 | 2.061 | 0.04 | −2.73 | 3.28 | −0.830 | 0.41 |
Publisher’s Note: MDPI stays neutral with regard to jurisdictional claims in published maps and institutional affiliations. |
© 2022 by the authors. Licensee MDPI, Basel, Switzerland. This article is an open access article distributed under the terms and conditions of the Creative Commons Attribution (CC BY) license (https://creativecommons.org/licenses/by/4.0/).
Share and Cite
Widmer, A.; Mercante, M.G.; Silver, H.J. TG/HDL Ratio Is an Independent Predictor for Estimating Resting Energy Expenditure in Adults with Normal Weight, Overweight, and Obesity. Nutrients 2022, 14, 5106. https://0-doi-org.brum.beds.ac.uk/10.3390/nu14235106
Widmer A, Mercante MG, Silver HJ. TG/HDL Ratio Is an Independent Predictor for Estimating Resting Energy Expenditure in Adults with Normal Weight, Overweight, and Obesity. Nutrients. 2022; 14(23):5106. https://0-doi-org.brum.beds.ac.uk/10.3390/nu14235106
Chicago/Turabian StyleWidmer, Annaliese, Margaret G. Mercante, and Heidi J. Silver. 2022. "TG/HDL Ratio Is an Independent Predictor for Estimating Resting Energy Expenditure in Adults with Normal Weight, Overweight, and Obesity" Nutrients 14, no. 23: 5106. https://0-doi-org.brum.beds.ac.uk/10.3390/nu14235106