


Understanding the Spatiotemporal Dynamics and Influencing Factors of the Rice–Crayfish Field in Jianghan Plain, China

School of Resource and Environmental Science, Wuhan University, Wuhan 430079, China
*
Author to whom correspondence should be addressed.
Remote Sens. 2024, 16(9), 1541; https://0-doi-org.brum.beds.ac.uk/10.3390/rs16091541
Submission received: 13 March 2024
/
Revised: 22 April 2024
/
Accepted: 24 April 2024
/
Published: 26 April 2024
(This article belongs to the Topic Remote Sensing and Geoinformatics in Agriculture and Environment Volume II)
Abstract
:The rice–crayfish co-culture system, a representative of Agri-aqua food systems, has emerged worldwide as an effective strategy for enhancing agricultural land use efficiency and boosting sustainability, particularly in China and Southeast Asia. Despite its widespread adoption in China’s Jianghan Plain, the exact spatiotemporal dynamics and factors influencing this practice in this region are yet to be clarified. Therefore, understanding the spatiotemporal dynamics and influencing factors of the rice–crayfish fields (RCFs) is crucial for promoting the rice–crayfish co-culture system, and optimizing land use policies. In this study, we identified the spatial distribution of RCF using Sentinel-2 images and land use spatiotemporal data to analyze its spatiotemporal dynamics during the period of 2016–2020. Additionally, we used the Multiscale Geographically Weighted Regression model to explore the key factors influencing RCF’s spatiotemporal changes. Our findings reveal that (1). the RCF area in Jianghan Plain expanded from 1216.04 km2 to 2429.76 km2 between 2016 and 2020, marking a 99.81% increase. (2). RCF in Jianghan Plain evolved toward a more contiguous and clustered spatial pattern, suggesting a clear industrial agglomeration in this area. (3). The expansion of the RCFs was majorly influenced by its landscape and local agricultural conditions. Significantly, the Aggregation and Landscape Shape Indexes positively impacted this expansion, whereas proximity to rural areas and towns had a negative impact. This study provides a solid foundation for promoting the rice–crayfish co-culture system and sustainably developing related industries. To ensure the sustainable development of rice–crayfish co-culture industries in Jianghan Plain, we recommend that local governments optimize the spatial layout of rural settlements, improve transportation infrastructure, and enhance regional agricultural water sources and irrigation system construction, all in line with the national strategy of rural revitalization and village planning. Additionally, promoting the concentration and contiguity of RCF through land consolidation can achieve efficient development of these industries.
1. Introduction
In recent decades, the rapidly growing global population has posed significant challenges to food supplies [1]. The escalating demand for food has intensified pressure on cultivated land. Meanwhile, in many regions, inefficient economic output from farming has led to excessive encroachment on, and depletion of, cultivated land due to urbanization [2,3]. In this context, rice–aquatic animal co-culture systems have emerged as a potential solution. These systems, which can produce multiple types of food per unit area of land, are increasingly recognized as significantly increasing farmland output efficiency [4,5]. As such, they are increasingly seen as an effective way to transition Agri-aquatic food systems towards sustainability [6,7]. Among these, the rice–crayfish co-culture system is an emerging and rapidly growing agricultural production model in several Asian countries, including China [8]. Currently, China’s Ministry of Agriculture recognizes the rice–crayfish co-culture model as a key practice for promoting green and ecological agriculture. It has been incorporated into the country’s future agricultural development plan [9].
The rice–crayfish co-culture system represents an innovative ecological model for rice cultivation, combining rice farming and crayfish aquaculture within the same ecosystem. This system can effectively stimulate agricultural growth, boost farmers’ income, and achieve a balance between agricultural production and environmental protection [10,11,12]. The system’s rapid development and promotion across southern China and Southeast Asia in recent years can be attributed to its suitability for the climate, substantial profitability, and systemic nutritional sustainability [13,14]. For instance, China’s Crayfish Industry Development Report (2021) reveals that, in 2020, over 80% of China’s crayfish production was achieved through the rice–crayfish co-culture system in Rice–Crayfish Fields (RCF). Additionally, nine out of the top thirty crayfish production counties in China were located within the Jianghan Plain region of Hubei Province.
Consequently, accurately capturing the spatiotemporal distribution of RCFs is critical for advancing the rice–crayfish co-culture agricultural production model and refining associated industrial development policies. Currently, data on the spatial and temporal distribution of RCF are mainly obtained through field surveys or statistical sampling methods, which estimate its cultivation area. However, these methods often fail to accurately portray the spatial distribution and changes in RCF over a larger area and at a finer spatial scale. Remote sensing technology, with its capacity for continuous spatiotemporal monitoring, accurately depicts the spatial distribution of features and has become an indispensable tool for acquiring land cover information [15], such as farmland, urban areas, and forests [16,17,18].
Several researchers have already investigated the extraction of information about the spatial and temporal distribution of RCF. For example, Wei et al. utilized RCF phenology, seasonal water body variations, and Landsat images to map the spatial distribution of RCF with a 30 m spatial resolution in Qianjiang County of the Jianghan Plain region from 2013 to 2018 [19]. Xia et al. employed a decision tree model and Sentinel-2 imagery to map the high-resolution spatial distribution of RCFs in Qianjiang County in 2019. Their study was grounded in the typical phenological, spectral, and textural features of RCFs [20]. Chen et al. used Landsat images and the Automated Water Extraction Index (AWEI) to extract the spatiotemporal dynamic changes in RCFs in Jianli County in Jianghan Plain from 2010 to 2019 [21].
While the aforementioned studies have made advancements in mapping the spatial distribution of RCF in Jianghan Plain, two significant challenges persist. Firstly, current research has primarily focused on individual counties, which leaves a noticeable gap in the study of the spatiotemporal dynamics of RCFs across the entire Jianghan Plain. As a result, accurate depictions of the distribution of and quantitative data on RCFs in this region are still lacking. This gap hinders the provision of a reliable basis for decision making regarding the sustainable development of rice–crayfish co-culture industries and policy formulation in the region. Secondly, existing extraction methods often depend on the phenological traits of RCFs. However, ponds used for lotus root cultivation in the Jianghan Plain region of China may exhibit similar characteristics to RCFs in terms of their phenology, spectra, and texture. Consequently, relying solely on remote sensing images and RCFs’ phenological feature information to extract RCF data could introduce significant uncertainties.
Moreover, understanding the factors that influence the spatiotemporal dynamics of RCFs is vital for gaining a deeper insight into the spatiotemporal evolution of RCFs. Such knowledge is indispensable for effective farmland management and for promoting the sustainable development of the rice–crayfish co-culture-related industries. Various factors, including topography, climate, transportation, demographics, and socioeconomics, all influence the spatial and temporal evolution of RCF, which is a unique type of cultivated land use [8,22]. For instance, Chen et al. found that the spatial expansion of RCFs is negatively affected by labor force loss, while it is positively correlated with villagers’ per capita income [21]. However, their study only analyzed the factors influencing the spatiotemporal changes in RCFs in Jianli County on the Jianghan Plain, considering the proportion of migrant workers and villagers’ per capita income. In general, a comprehensive understanding of the factors influencing the spatiotemporal dynamics of RCF in Jianghan Plain is still lacking.
Given the limitations identified in previous studies regarding the extraction of spatiotemporal distribution data and the analysis of the evolutionary mechanisms of RCFs in the Jianghan Plain region, this study has two primary objectives. The first is to use Sentinel-2 imagery, the phenological characteristics of RCFs, and spatiotemporal land-use data to accurately map the spatiotemporal distribution of RCFs in Jianghan Plain from 2016 to 2020. The second objective is to examine the factors influencing the spatiotemporal evolution of RCFs in the Jianghan Plain. To achieve this, we plan to establish a comprehensive framework that considers multiple dimensions such as socio-economic development status, locational factors, agricultural development conditions, and landscape patterns. This framework will encompass various potential factors influencing the spatiotemporal dynamics of RCF in the Jianghan Plain. Following this, we will analyze the key factors influencing the spatiotemporal dynamics in RCF in Jianghan Plain using the Multiscale Geographically Weighted Regression (MGWR) model. The findings of our research aim to provide a reliable foundation for informed decision making relevant to advancing the rice–crayfish co-culture industries in the Jianghan Plain.
2. Materials and Methods
2.1. Study Area
The Jianghan Plain (29°26′–31°37′N, 111°14′–114°36′E) is situated in the south-central region of Hubei Province, China (Figure 1) and is a significant part of the middle reaches of the Yangtze River Plain. It was formed by the alluvial deposits of the Yangtze River and its largest tributary, the Han River. The Plain stretches from Yichang in the west to Wuhan in the east, encompassing 18 county-level administrative districts and 295 township-level administrative units, covering a total area of approximately 31,000 square kilometers.
The region falls within the continental subtropical monsoon climate, characterized by simultaneous rain and heat, with an annual precipitation exceeding 1000 mm and abundant sunlight. Known as the ‘land of fish and rice’ in China, the Jianghan Plain, with its flat terrain, fertile soil, and well-developed agricultural irrigation system, provides superior conditions for agricultural production. It serves as an important production base for grain, cotton, oil, and fishery products in China.
The Jianghan Plain is a pioneer region in China for promoting the rice–crayfish co-culture agricultural production model. For this study, we divided the region into three areas based on the timing and location of rice–crayfish co-culture promotion, water distribution, and administrative differences: the core area in the south-central part, the area near the Wuhan metropolitan area in the northeast, and the peripheral areas in the west and north.
The south-central core area, which includes Qianjiang, Xiantao, and most counties of Jingzhou such as Jianli, Honghu, Shishou, Jiangling, and Gong’an, boasts densely distributed lakes and rivers, abundant water resources, rich agricultural land resources, and convenient transportation. These factors provide superior conditions for promoting the rice–crayfish co-culture model, making this region the earliest to do so in Jianghan Plain.
The northeastern region, primarily consisting of Hanchuan and Yunmeng in Xiaogan prefecture, as well as Caidian, a suburb of Wuhan, serves as a significant vegetable supply base for the Wuhan metropolitan area due to its productive agriculture. However, it also faces multiple challenges in protecting arable land due to rapid urbanization and industrialization influenced by the Wuhan metropolitan area.
The peripheral regions, such as the western and northern parts of the Jianghan Plain, experienced late adoption of the rice–crayfish co-culture model. These regions specifically include Songzi and Zhijiang in the Yichang prefecture to the west and Tianmen and Shayang in the northern part of the Jingzhou prefecture. Although this region has abundant lakes, pits, and other water sources, their distribution is significantly less balanced compared to the south-central core area.
In recent years, local governments in Jianghan Plain have implemented numerous policies to support the promotion of the rice–crayfish co-culture model. This has significantly improved the economic efficiency of cultivated land in the region, increased farmers’ income, and effectively protected the cultivated land. Therefore, it is crucial to accurately obtain information on the distribution of RCF and its spatiotemporal change characteristics and evolution patterns on Jianghan Plain for optimizing agricultural and land use policies in the region. Since Wuhan, located in the eastern part of the Jianghan Plain, is a focal area for urbanization and industrial development in Hubei Province, the urban area of Wuhan is excluded from the study region in this research. This study will analyze the spatiotemporal distribution and evolution of RCF in 295 township-level administrative regions in Jianghan Plain from 2016 to 2020.
2.2. Data Sources
In this study, we used the spatiotemporal land use data to map the spatial distribution of RCF, leveraging Sentinel-2 images provided by the Google Earth Engine (GEE) platform (https://earthengine.google.com/ accessed on 15 November 2022). Due to the limited availability of winter 2016 imagery data in the study area, we specifically used data from December 2016. More precisely, we obtained 42 Sentinel-2 images from 1 December 2016 to 28 February 2017, and 68 images from 1 January to 28 February 2021. These images, which had less than 5% cloud cover, were used to extract the water body areas in the winter months (January–February) of 2016 and 2020 in the Jianghan Plain. Additionally, we used data such as night-light remote sensing images, population statistics, and road information to analyze factors influencing the spatiotemporal evolution of RCF. Details of these data sources are provided in Table 1.
The land use data for this study, as shown in Table 1, were sourced from the Land Use Survey Database of the Department of Natural Resources of Hubei Province. We converted the vector land use data into raster images with a 10 m spatial resolution to aid in the extraction of RCF information. To evaluate the impact of macro socioeconomic factors on the spatiotemporal evolution of RCFs, we also collected statistical yearbooks from the prefectural and municipal statistical bureaus in the study area. As acquiring accurate demographic and socioeconomic data at the township scale is challenging, we used remote sensing and other methods to indirectly measure these variables at the township level. Due to the strong correlation between human activities and nighttime light intensity [23], NPP VIIRS nighttime lighting data were used as an indicator to measure township socio-economic development status in this study. These NTL data were obtained from the Payne Institute for Public Policy Research at the Colorado School of Mines (https://payneinstitute.mines.edu/eog/ accessed on 11 April 2023). Global population distribution data, sourced from the U.S. Department of Energy’s Oak Ridge National Laboratory (https://landscan.ornl.gov/ accessed on 20 April 2023) at a 1 km resolution, were adjusted using the seventh census data at the county level to accurately depict the population distribution in Hubei Province. Lastly, we used road data from OpenStreetMap (https://www.openstreetmap.org/ accessed on 11 April 2023) to examine the influence of factors such as roads on the spatiotemporal changes in RCFs.
2.3. Methods
2.3.1. Extraction of RCF
The cultivation process of a typical RCF is divided into two main phenological stages (Figure 2): (1) The Middle Rice Planting Period (June–October): This period begins with the transplanting of rice seedlings throughout the field in June and ends with the harvesting of the middle rice in October. During this period, crayfish are cultured in ditches around the rice fields. (2) The Paddy Field Fallow Period (November–May): After the rice harvesting season, the fields are left fallow and are irrigated to a depth of over 50 cm. This coincides with the growth and development of crayfish.
In the Jianghan Plain region, the RCF cultivation process also involves two seasons of crayfish harvesting. The first season begins in mid-April and concludes in early June, followed by the placement of juvenile crayfish for the second season of production. The second catching period runs from the first half of August to the end of September. After catching, parental crayfish are released to provide for subsequent reproduction of juvenile crayfish. As a result, the RCF area is used for rice cultivation and crayfish harvesting from June to October and for water distribution and crayfish development from November to the following May.
However, it is important to note that ponds used for cultivating lotus roots in Jianghan Plain exhibit phenological characteristics that are similar to those of RCFs. The lotus planting period typically begins in late March to early April, with the harvest period starting in September as the lotus leaves become yellow and withered. From late October to the following March, the lotus root is in its dormant stage.
During the growing period of lotus, from May to September, the lotus ponds exhibit a vegetated state, while from October to April, they are unvegetated. This is similar to the RCF cultivation cycle, where the RCF area is used for rice cultivation and crayfish harvesting from June to October, and for water distribution and crayfish development from November to the following May. Therefore, relying solely on phenological features for RCF information extraction may result in misidentifying lotus ponds as RCFs, which can negatively impact the accuracy of RCF information extraction.
Since 2009, the Chinese Government has initiated nationwide land use surveys using remote sensing images with a spatial resolution better than 1 m. To ensure accuracy, numerous field investigations and validations have been conducted. Notably, these surveys classify lotus ponds as water bodies and RCFs as paddy fields. More specifically, RCF refers to those paddy field areas that exhibit water coverage features during January to February. Conversely, in the Jianghan Plain area, the typical planting system involves growing rape or wheat in the paddy fields during winter. This leads to regular paddy fields exhibiting spectral characteristics of vegetation cover during winter, resulting in completely different spectral characteristics compared to RCFs in the same season. This distinction allows for successful differentiation of RCFs from regular paddy fields, which typically appear as vegetation-covered areas with no water during this period.
To address the limitations of existing methods such as those proposed by Wei et al. [19] and Chen et al. [21], which struggle to distinguish between RCFs and lotus ponds, we employ land use data to enhance the RCF extraction process. This process includes two primary steps: First, we gather the distribution data of paddy fields from the 2016 and 2020 land use data of the Jianghan Plain. Second, we use the Automated Water Extraction Index for Shadow Areas () to identify the paddy fields that present as water bodies during winter. This technique allows us to determine the spatial distribution of RCF. Figure 3 illustrates the extraction process. The employs a band combination technique for water extraction, which minimizes the impact of non-water pixels and reduces uncertainties caused by shadows. This method enhances the distinction between water bodies and dark surface land cover types [24]. The calculation formula is presented in Equation (1).
where , , , , and represent the object’s reflectance in the Sentinel-2 Blue, Green, NIR, SWIR1, and SWIR2 bands, respectively. To accurately extract information about water bodies, it is crucial to determine a reasonable threshold to distinguish them from non-water bodies. In this study, the Otsu method was utilized to identify the optimal threshold for extracting water body information using . This method differentiates between the background and foreground in an image by setting a binary threshold function that maximizes the inter-class variance, as detailed in [25].
2.3.2. Landscape Pattern Analysis
We utilized landscape indices to quantify the landscape patterns of RCFs in Jianghan Plain. Based on previous research and the specific insights provided by landscape pattern indices [26,27,28], we selected the Patch Density Index (PD), Landscape Shape Index (LSI), and Aggregation Index (AI). These indices, respectively, represent the patch shape, patch density, and patch aggregation of RCFs in Jianghan Plain (Table 2).
Among these indices, Patch Density can reflect the complexity of an RCF’s landscape spatial structure; a higher value indicates a greater degree of landscape fragmentation [29]. Landscape Shape Index measures the complexity of RCF patch shapes, with a higher value pointing to more complex forms [26]. Aggregation Index characterizes the spatial connectivity of patches, with values ranging from 0 to 100. A higher Aggregation Index value indicates a more concentrated spatial distribution and better connectivity of an RCF, which can make these industries more susceptible to scale effects. The specific calculation methods for these indices are detailed in reference [30]. We used FRAGSTATS 4.2 to compute the Patch Density, Landscape Shape Index, and Aggregation Index of RCF in Jianghan Plain for the years 2016 and 2020. This allowed us to analyze the spatiotemporal characteristics of RCF landscape patterns.
2.3.3. Spatial Autocorrelation Analysis
We employed spatial autocorrelation analysis to investigate whether RCFs demonstrate significant aggregation characteristics in their spatial distribution. Spatial autocorrelation is frequently used in geographical research due to its unique advantages in revealing spatial clustering of geographical variables and examining the variation in spatial characteristics of geographical variables across regions [31].
In this study, we used townships as analytical units and applied global Moran’s I to assess the correlation degree in the expansion areas of RCF. We also used the local Moran’s I index to analyze the local spatial clustering of each spatial unit and its neighboring units within the RCF expansion areas. The calculation method for the global Moran’s I index is as follows [32]:
where and are the RCF area in the ith and jth township, respectively. n denotes the number of spatial units (townships), is the average area of RCF across all townships, and is the spatial weight matrix. The global Moran’s I index ranges from [26 to 28], where a value greater than 0 indicates positive spatial correlation. The closer the value is to 1, the stronger the correlation, and vice versa. The local Moran’s I index is calculated by the following formula [32]:
where and represent the standardized values of the RCF area for units i and j, respectively. n denotes the number of spatial units (townships) and is the spatial weight matrix. represents the RCF area in the ith township, is the average area of RCF across all townships, and is the standard deviation of the RCF area across all units. The local Moran’s I index effectively characterizes the autocorrelation features of RCF area within neighboring units.
2.3.4. Multi-Scale Geographically Weighted Regression
The investigation of influencing factors and the analysis of driving mechanisms in the spatiotemporal evolution of geographical phenomena or processes has long been a central research focus in the field of geography [33,34]. The Geographically Weighted Regression (GWR) model, a method for handling spatial variables, is particularly useful in reflecting the spatial heterogeneity caused by geographical environmental variations, also known as spatial non-stationarity, in model parameters [22]. As such, GWR is extensively used to tackle a range of geographical issues, including land use change, disease spread analysis, and environmental management [35]. However, the GWR model’s limitation of confining all variables to the same optimal bandwidth may lead to oversimplified spatial relationships and inaccurate estimates [36]. To address this, Fotheringham introduced the Multi-scale Geographically Weighted Regression (MGWR) model [37]. This model incorporates different bandwidths for various independent variables, thereby reflecting their diverse effect scales. This adaptation makes spatial process simulation more accurate and meaningful [38]. The expression for MGWR is as follows:
where is the dependent variable, k is the total number of independent variables, represents the regression coefficient for the jth independent variable at point i, is the bandwidth used for the regression coefficient of the jth variable, represents the spatial coordinates of sample point i, is the jth explanatory variable at sample point i, and is the random disturbance term.
In this study, to investigate the influencing factors, driving mechanisms, and spatial heterogeneity of the spatiotemporal dynamics in RCF, we used the MGWR model to quantify the relationships between the spatiotemporal dynamics in RCF and the explanatory variables. We will conduct both modeling and parameter fitting using ArcGIS Pro 3.0. For model evaluation, we will use the Akaike Information Criterion corrected (AICc), the adjusted R-Square, and the residual Moran’s I. A well-fitted model will have low AICc and residual Moran’s I values, along with a high adjusted R-Square value.
2.3.5. Potential Influencing Factors
The spatiotemporal change in RCF, a typical process in land use change, is influenced by a combination of natural and socio-economic factors. Given the flat terrain, plentiful arable land, and water resources in the Jianghan Plain region, natural conditions such as topography, precipitation, temperature, sunlight, and soil present homogeneity in this area. These conditions do not pose restrictions on the expansion of RCFs in Jianghan Plain. Accordingly, based on existing studies [32,39,40] and considering the accessibility of data required for large-scale regional analysis, we selected 16 potential influencing factors (Table 3) from four dimensions: agricultural production conditions, locational conditions, socio-economic development, and the landscape pattern of RCF [41].
As indicated in Table 3, agricultural production conditions form the foundation of agricultural development, and both a sufficient water supply and abundant arable land resources are essential for the development of rice–crayfish co-culture system. To comprehensively assess the influence of agricultural production conditions factors on the spatial distribution of RCF within the region, we selected four variables: Distance to Rural Settlements (DRS), Proportion of Cropland (PC), Per Capita Cropland Area (PCCA), and Proportion of Water Area (PWA). Distance to Rural Settlements measures the proximity of the RCF to rural settlements, while Proportion of Cropland and Per Capita Cropland Area account for the rational allocation and utilization of land resources. Proportion of Water Area, on the other hand, pertains to the availability of water resources.
A favorable geographical location, accessible transportation, and proximity to water sources can all enhance the expansion of an RCF. Thus, in terms of locational conditions, we focus on factors such as Distance to Water Sources (DWS), Road Network Density (RND), Distance to County Town (DCT), and Distance to Road (DR) to examine their impact on the expansion of RCFs. Distance to Water Sources demonstrates the closeness of an RCF to water sources, which is directly tied to the accessibility of water resources. Road Network Density indicates the density of the regional transportation network, and convenient transportation can facilitate the cultivation of RCFs, as well as the processing and transport of products. Furthermore, examining Distance to County Town and Distance to Road can provide a deeper understanding of how the distribution of RCF is influenced by locational factors like county towns and roads.
The level of regional economic development, population size, and other socio-economic conditions are also crucial factors influencing the expansion of RCFs. In this study, a range of indicators reflecting these socio-economic conditions were selected. These include the Gross Domestic Product (GDP), Rural Population Density (RPD), Average Nighttime Light Intensity (ANLI), and Proportion of Construction Land (PCL).
In the process of land utilization, farmers are influenced by the surrounding land use conditions [42]. As such, the landscape pattern and spatial distribution characteristics of regional RCF also impact the neighboring arable land use. For example, the spatial continuity and aggregated distribution of RCFs often lead to the clustering and economies of scale in the crayfish–rice co-cultivation industries. This facilitates the innovation and promotion of rice–crayfish co-cultivation agricultural production model, reduces costs, and enhances the profitability of the industry. Therefore, in this study, we use landscape pattern indices of RCFs such as Patch Density (PD), Landscape Shape Index (LSI), and Aggregation Index (AI) to reflect the spatial distribution morphology, aggregation degree, and connectivity of RCFs in an analysis unit.
3. Results
3.1. RCF Extraction Results in Jianghan Plain
We collected Sentinel-2 images for the winter (January–February) of 2016 and 2020 in the Jianghan Plain via the GEE platform. Specifically, we obtained 42 images from 1 December 2016 to 28 February 2017, and 68 images from 1 January to 28 February 2021. All of these images had less than 5% cloud cover. Considering the limited availability of winter 2016 imagery data for the study area, we specifically used the data from December 2016 as a supplement. The Median Value Composite (MedVC) was used due to its proven effectiveness in reducing clouds, shadows, and noise, while also generating relatively clear images with a high computational efficiency [43,44]. Using the ‘imageCollection.median()’ function in GEE [45], we procured composite images for the complete study area during the winter months of 2016 and 2020. Based on this, we employed the RCF extraction method outlined in Section 2.3.1 to map the distribution of RCF in Jianghan Plain for the years 2016 and 2020.
To assess the accuracy of the RCF extraction results for the Jianghan Plain, we obtained validation samples through visual interpretation, using land use survey data supplied by the Natural Resources Management Department of Hubei Province and high-resolution historical images from Google Earth. As depicted in Figure 4, we randomly gathered both RCF and non-RCF samples within the study area, with 150 samples for each category in 2016 and 200 in 2020, summing up to 700 samples. These samples were uniformly distributed across the study area. We built a confusion matrix based on these 700 samples for accuracy evaluation. According to the results shown in Table 4, the overall accuracy of our RCF extraction results from Jianghan Plain for 2016 and 2020 was 90.00% and 93.25%, respectively, indicating that the accuracy was generally reliable and satisfactory.
Table 5 presents a comparison between our study’s findings, data from the Statistical Yearbooks, and existing research results. The RCF area in Jianghan Plain, as extracted in this study for 2016, measures 1216.04 km2, while the data in the Statistical Yearbook represent 1534.91 km2. This results in a discrepancy of 20.77% between these two datasets. When considering the RCF extraction results for 2020, the discrepancy lowers to only 3.32%. This discrepancy can be explained by the inherent characteristics of the different data collection methods used. The remote sensing technology we used guarantees consistency and objectivity in data collection, while the reference data, obtained through statistical surveys and sampling methods, could be subject to biases, sampling errors, or variations in data collection. As a result, the observed 20.77% difference between the datasets could likely be due to these factors. Despite the discrepancies between our study’s results derived from remote sensing interpretation and the statistical data, both show a consistent trend in the RCF area changes in the Jianghan Plain, confirming the reliability of our research findings to some extent. Notably, the study by Chen et al. highlights a significant and extensive expansion of the RCFs in Jianli County from 2010 to 2019, recording the RCF area in Jianli as being 724.45 km2 in 2019 [21]. This aligns well with our results, thereby confirming the reliability of our study’s findings.
Figure 5 demonstrates the spatial distribution of RCFs in Jianghan Plain in 2016 and 2020. It can be observed from Figure 5 that by 2020, RCFs had a broad distribution across almost all counties of the Jianghan Plain, indicating a significant expansion trend in recent years. For instance, in 2016, RCF was primarily concentrated in specific areas of Qianjiang County, as well as in parts of counties under the Jingzhou Prefecture City, including Jianli, Honghu, Shishou, and Gong’an. However, by 2020, the RCFs had significantly expanded throughout the entire Jianghan Plain, particularly in the central and southern regions, which are characterized by abundant water resources from lakes and rivers and fertile agricultural land. Yet, Figure 5 also reveals that RCFs are still sporadically distributed in the western and northern regions of the Jianghan Plain, in areas such as Songzi, Zhijiang, Dangyang, Shayang, and Tianmen.
3.2. Spatiotemporal Dynamics of RCF in Jianghan Plain
3.2.1. Quantity and Spatial Distribution of RCF in Jianghan Plain
According to our results on RCF distribution, the area of RCFs in Jianghan Plain grew from 1216.04 km2 in 2016 to 2429.76 km2 in 2020, a 99.81% increase. The proportion of RCF area to the total paddy field area in Jianghan Plain also rose from 12.10% to 23.32%.
Figure 6 shows that, as of 2020, Jianli had the largest RCF area at 714.51 km2, accounting for 29.41% of the total RCF area in Jianghan Plain. This was followed by Qianjiang (401.22 km2), Gong’an (293.05 km2), Honghu (176.9 km2), and Shishou (170.67 km2). Regarding RCF area dynamics from 2016 to 2020, significant growth occurred in regions like Jianli, Qianjiang, Gong’an, Honghu, Shishou, and Jiangling. In Jianli, the RCF area surged from 381.33 km2 in 2016 to 714.51 km2, a 0.87-fold increase. In Qianjiang, the RCF area increased from 211.31 km2 in 2016 to 449.66 km2 in 2020, a 1.20-fold increase. Nevertheless, RCF areas shrank in Hanchuan and Zhijiang, with Hanchuan experiencing the largest decrease, from 92.74 km2 in 2016 to 50.32 km2, a reduction of 42.42 km2.
Figure 7 depicts the hot spots and cold spots of RCF loss and expansion in Jianghan Plain from 2016 to 2020, highlighting significant spatial heterogeneity. The central and southern regions, including Jianli, Qianjiang, Gong’an, Honghu, Shishou, and Jiangling, saw the most prominent RCF expansion. In contrast, areas like Hanchuan, Yunmeng, Caidian, and Xiantao in the northeastern part experienced reductions, particularly in Hanchuan. Notably, the central and southern regions, including Qianjiang, Jianli, and Honghu, were both expansion hotspots and areas of significant reduction. Overall, the spatial pattern of the RCFs is characterized by expansion from the central and southern core areas, such as Jianli, Qianjiang, Shishou, Gong’an, moving outward. For example, in Songzi county in the west, RCF initially expanded in the eastern part adjacent to Gong’an County.
3.2.2. RCF Landscape Pattern in Jianghan Plain
We utilized three landscape metrics—Patch Density Landscape Shape Index, and Aggregation Index—to analyze the patch size, shape, and distribution characteristics of the RCFs in Jianghan Plain. From 2016 to 2020, the landscape pattern of the RCFs in the region underwent significant dynamic changes, including patch fragmentation and increased shape complexity. Nonetheless, the pattern generally demonstrated characteristics of relative concentration and high connectivity. Figure 8 illustrates the evolution of the RCF landscape pattern in Jianghan Plain from 2016 to 2020.
As shown in Figure 8, between 2016 and 2020, the Patch Density and Landscape Shape Index of RCF in Jianghan Plain generally increased, while the Aggregation Index remained high. This suggests that the RCF patches in the Jianghan Plain became more fragmented and complex in shape but remained relatively concentrated in their spatial distribution, indicating a high level of cohesion and connectivity. This trend is primarily due to the rapid spatial expansion of RCFs in this region.
The landscape pattern of the RCFs in the Jianghan Plain also demonstrates significant spatial heterogeneity. For example, in central and southern regions like Qianjiang, Jianli, Shashi, Gong’an, Jiangling, and Xiantao, where the rice–crayfish co-culture model was implemented earlier, the RCFs display higher Patch Density and Landscape Shape Index values and elevated Aggregation Index values, indicating more fragmented patches with irregular shapes but good connectivity. In contrast, in the western regions like Dangyang, Zhijiang, and Songzi, and northeastern areas of Yunmeng and Yingcheng, where the rice–crayfish co-culture was implemented later, these areas show higher Patch Density and Landscape Shape Index values but lower Aggregation Index values, suggesting fragmented and irregular-shaped RCF patches with poorer connectivity. In eastern regions, such as Hanchuan, Caidian, and Honghu, where the rice–crayfish co-culture was implemented relatively later, RCF exhibits lower Patch Density and Landscape Shape Index values but higher Aggregation Index values, indicating larger, more regular-shaped RCF patches with better connectivity.
3.3. Factors Influencing the Spatiotemporal Evolution of RCF in Jianghan Plain
3.3.1. Model Construction
County- and township-level governments are the primary policy makers for economic and industrial development at the local scale in China. To better support the development of the crayfish-rice co-culture related industries and aid government decision-making in Jianghan Plain, we analyzed the factors influencing the spatiotemporal evolution of RCF across 295 township units, with the township as the basic unit of analysis. We used the change in RCF area as the dependent variable, and the 15 potential influencing factors listed in Table 3 as independent variables. These independent variable values were derived using remote sensing and GIS technology. This analysis provided insights into the spatiotemporal influencing factors of RCF in Jianghan Plain.
Initially, we examined the spatial autocorrelation using the Global Moran’s I index. The calculations showed that the Moran’s I values for RCF distribution in Jianghan Plain in 2016 and 2020 were 0.456 and 0.551, respectively. The z-scores were both higher than 2.58, and p-values were less than 0.01, indicating that they both passed the significance test at a 99% confidence level. This suggests a significant clustering effect and positive spatial autocorrelation in RCF spatial distribution across the Jianghan Plain, indicating that areas with similar RCF distributions tend to cluster together.
To investigate the spatial variation and significance of RCFs between individual township units and their neighbors, we used Local Moran’s I to characterize the local spatial correlation of RCF. LISA cluster maps were also employed to visually illustrate the local spatial clustering patterns of RCF [46,47]. In this context, ‘High–High’ suggests high values surrounded by high values, ‘Low–Low’ represents low values surrounded by low values, ‘Low–High’ signifies low values surrounded by high values, and ‘High-Low’ indicates high values surrounded by low values [48].
Figure 9 illustrates the local spatial autocorrelation characteristics of RCF in Jianghan Plain for the years 2016 and 2020. From 2016 to 2020, the spatial distribution pattern of the RCFs in Jianghan Plain remained consistent, exhibiting two distinct clustering features: High-High and Low–Low, with an increasing trend in the spatial clustering distribution. The High–High clustering areas are primarily located in the central and southern regions of the Jianghan Plain, where the rice–crayfish co-culture model was initially promoted. Areas such as Qianjiang and Jianli are particularly prominent. The number of townships exhibiting High–High clustering increased from 20 (6.78%) in 2016 to 30 (10.17%) in 2020. Conversely, the Low–Low cluster areas are mainly dispersed in the western and northeastern regions on the outskirts of Jianghan Plain. The number of townships with a notable Low–Low cluster that gradually increased from 2016 to 2020, predominantly concentrated in locations such as Zhijiang, Tianmen, and Hanchuan.
The spatial autocorrelation analysis results indicate that the spatiotemporal evolution of the RCFs across the 295 townships in Jianghan Plain exhibits significant spatial autocorrelation. This provides a foundation for interpreting the spatiotemporal patterns using the GWR and MGWR models. The multicollinearity test results also reveal no global multicollinearity among all the explanatory variables. To optimize the model’s fitting effect, we selected the explanatory variables that passed the significance test of the OLS model for GWR and MGWR analysis. These variables include Distance to Rural Settlements, Distance to Water Sources, Distance to County Towns, Distance to Roads, Proportion of Construction Land, Population Density, Landscape Shape Index, and Aggregation Index, totaling eight explanatory variables. We employed the OLS, GWR, and MGWR methods to analyze the potential influencing factors of the spatiotemporal evolution of RCF. The results are presented in Table 6.
As presented in Table 6, the regression results derived from different models suggest the superior quality of the MGWR model over the GWR and OLS models. This superiority is evident in the AICc, adjusted R-Square, and residual Moran’s I metrics obtained from each of these models. Specifically, with regard to the adjusted R-Square metric, the MGWR model achieves a score of 0.865, marking a substantial improvement in comparison to the GWR model and surpassing the OLS model by a significant margin. Additionally, the MGWR model significantly reduces the spatial autocorrelation of residuals when compared to both the OLS and GWR models, as indicated by Moran’s I.
As illustrated in Figure 10, the local R-Square results, derived from the MGWR model, capture 53.80% to 93.35% of the total variance across the Jianghan Plain. The local R-Square exhibits an increase from the northeast to the southwest. This trend suggests a higher overall model fit for township units in the central and southern regions, while a lower fit is observed in the northeastern areas. The observed lower fit in the northeastern region could potentially be attributed to its proximity to the Wuhan metropolitan area. The spatiotemporal dynamics of the RCFs in this region might have been significantly shaped by factors like population density, industrial expansion, and land use patterns inherent to the Wuhan metropolitan area.
3.3.2. Scale Analysis of Influencing Factors
The MGWR model allows each variable to have an optimal bandwidth, effectively reflecting the spatial scale variations in the impact of different factors on the distribution characteristics of the RCFs in Jianghan Plain. A larger bandwidth indicates a smaller spatial difference among the variables, with relatively stable coefficients across space. While spatial heterogeneity exists, it is not significant. Conversely, a smaller bandwidth suggests a smaller scale of the variable and greater spatial heterogeneity.
Table 7 reveals that each variable has a bandwidth of 55 in the GWR model, while in the MGWR model, each variable’s optimal bandwidth differs. Notably, the bandwidths of Distance to County Town and Distance to Road are both 295, equating to the total number of townships. These are considered global variables, and their regression coefficients are relatively spatially stable.
The bandwidth of Proportion of Construction Land is 218, indicating minimal spatial variations in its regression coefficients. Distance to Rural Settlements, Distance to Water Sources, Patch Density, Landscape Shape Index, and Aggregation Index have smaller bandwidths, suggesting that the spatial distribution of RCFs in Jianghan Plain is sensitive to these influencing factors. Moreover, the regression coefficients of these five factors are spatially non-stationary, suggesting that they may display different trends in various geographical locations. This finding underscores the significance of spatial heterogeneity and geographical factors.
3.3.3. Spatial Heterogeneity of Influencing Factors
The statistical results from the MGWR model (Figure 11) reveal notable variations in the influence of different factors across various township units. This speaks to the significant and diverse trends in the magnitude of these influences. The absolute mean values of the regression coefficients showed that Aggregation Index was the most influential factor on the spatiotemporal evolution of RCF. Landscape Shape Index, Distance to Water Sources, and Patch Density also had significant impacts. However, Distance to Rural Settlements, Distance to County Town, Distance to Road, and Proportion of Construction Land had relatively smaller impacts. In summary, the landscape pattern of RCF considerably affects its expansion across the Jianghan Plain. We delved deeper into the spatial heterogeneity of these influences on the distribution of RCF across the Jianghan Plain. We visualized the regression results for each influential factor, which yielded the spatial distribution of coefficients (see Figure 12).
Among the landscape pattern indices, Aggregation Index and Landscape Shape Index exert the most significant influence on the expansion of RCFs in Jianghan Plain. They exhibit a clear positive effect, except in areas close to Wuhan’s urban region, such as Hanchuan (see Figure 12a,b). Conversely, Patch Density negatively impacts the expansion of RCF in Jianghan Plain. Overall, the patterns indicated by the Aggregation Index, Landscape Shape Index, and Patch Density indices are consistent. This suggests that across most of the Jianghan Plain, RCFs tend to expand more readily in areas with higher aggregation, more complex shapes, and lower landscape fragmentation.
Distance to Water Sources, Distance to County Town, and Distance to Road are key locational factors that influence the spatiotemporal variation of RCF in the Jianghan Plain (see Figure 12d–f). Specifically, Distance to Water Sources has a marked positive effect in core regions where the rice–crayfish co-culture model promotion was early, such as the southeast, and in the northeastern city of Hanchuan. However, along the north–south axis of Shishou–Shayang, it has a significant negative impact. Distance to County Town generally negatively influences the expansion of RCF, and this effect gradually intensifies from south to north. The impact of Distance to Road on the spatiotemporal evolution of RCF in Jianghan Plain is generally positive, although it gradually diminishes from southeast to northwest.
In the context of agricultural production conditions, Distance to Rural Settlements notably negatively impacts the expansion of RCF in Jianghan Plain, and this impact varies across different regions (see Figure 12g). For example, in western areas such as Dangyang, Zhijiang, and Songzi, the negative effect of Distance to Rural Settlements on RCF expansion is more pronounced. Spatially, the influence of Distance to Rural Settlements on RCF expansion gradually weakens from west to east.
Among socio-economic conditions, Proportion of Construction Land displays a strong positive correlation with the expansion of RCF in Jianghan Plain (see Figure 12h). This influence is approximately centered around the north–south axis of Shishou–Shayang and gradually diminishes towards both sides of the aforementioned areas.
4. Discussion
4.1. Expansion of RCF in Jianghan Plain
During the period from 2016 to 2020, RCFs in the Jianghan Plain exhibited a significant expansion trend, with the cultivation area doubling. This finding aligns with the results of Si et al. [11]. Overall, our findings are generally consistent with existing datasets and research. Notably, five counties—Qianjiang, Jianli, Honghu, Shishou, and Gong’an—located in the central-south core area of the Jianghan Plain, accounted for nearly 80% of the total RCF increase in the region. However, a noticeable loss of RCFs in this region is observed (Figure 7). This phenomenon could be attributed to human activities such as urbanization and industrialization encroaching on RCFs. Alternatively, it could be a result of initiatives by local governments and farmers to optimize the spatial pattern of RCFs through land consolidation and other engineering measures. Specifically, over the past five years, there has been a significant increase in the spatial clustering of RCFs in the region, along with a pronounced agglomeration effect and trend in the RCCS industry. This suggests that the land management strategies and industrial reforms implemented by the local government in this region have been markedly successful in promoting RCFs.
RCFs in the northeastern region, particularly in Hanchuan, have been experiencing a clear decreasing trend. This is largely due to the rapid economic and industrial development in this area, driven by the Wuhan metropolitan area. The expansion of urban areas and industrial growth have led to the loss of arable land. This is evident in increased landscape fragmentation, heightened shape complexity, and diminished connectivity between patches of RCF in this region. These areas need to bolster cropland protection and strictly regulate the transition of cropland to limit construction activities. Moreover, they should ensure that there is no net loss of cropland to ultimately promote sustainable development.
Conversely, the western and northern peripheral regions are areas where RCCS has been actively promoted in recent years. The RCFs in these regions have shown characteristics of multi-point sporadic distribution, as evidenced by increased landscape fragmentation, heightened shape complexity, and reduced connectivity between patches. While promoting RCCS in these regions, it is crucial to stress the implementation of intensive land use practices to minimize land fragmentation and enhance land connectivity.
4.2. Factors Influencing the Spatiotemporal Dynamics of RCF in Jianghan Plain
Based on the analysis presented in Section 3.3, the expansion of RCFs in the Jianghan Plain is influenced by a mixture of factors such as the RCF landscape pattern, geographical conditions, agricultural production circumstances, and socio-economic aspects. Among these, the RCF landscape pattern and location conditions play a particularly significant role in the expansion of RCFs, incorporating elements like the Aggregation Index, Landscape Shape Index, Patch Density, and Distance to Water Sources. Conversely, the impact of Distance to Rural Settlements and Proportion of Construction Land is relatively less significant.
Our study underscores the crucial role of the RCF landscape pattern in its expansion. For example, Patch Density has a negative effect on RCF expansion, while the Aggregation Index generally exhibits a strong positive influence. This implies that areas with larger and more contiguous RCF patches are more prone to RCF expansion. This can be attributed to the fact that a concentrated distribution of RCF can generate economies of scale and agglomeration effects, thereby reducing the cost of industrial development, enhancing RCF output efficiency, and fostering further expansion of the rice–crayfish co-culture related industries. Furthermore, the Landscape Shape Index significantly positively impacts RCF expansion. This is because the more complex the patch is, the more patches it interacts with, thereby better facilitating the promotion of rice–crayfish co-culture related industries and the expansion of RCFs.
When it comes to geographical conditions, Distance to Water Sources plays an integral role in RCF expansion and exhibits significant spatial heterogeneity. Along the north–south axis of Shishou–Shayang, paddy fields closest to water sources are prioritized for the introduction of the rice–crayfish co-culture model due to their higher water requirements. In the southeast core area, where the rice–crayfish co-culture model was initiated earlier, patches in close proximity to water sources have already been converted to RCFs. As a result, the newly expanded RCFs tend to be located in paddy field areas that are relatively distant from water sources.
In the context of agricultural production conditions, Distance to Rural Settlements negatively impacts the expansion of RCF, indicating that being closer to residential areas is advantageous for RCF expansion. This is because RCF cultivation requires substantial labor input and being in proximity to residential areas eases daily field care and management for farmers.
With regard to socio-economic conditions, the Proportion of Construction Land has a positive impact on the expansion of RCFs. This can be understood in three ways. First, it can be viewed as a result of China’s farmland protection policy. In areas with a larger proportion of construction land, the economy is typically more advanced, which leads to increased pressure to protect arable land. In such circumstances, implementing co-culture systems like the rice–crayfish model can effectively increase the value of cultivable land, thereby alleviating the pressure on arable land protection. Second, regions with high Proportion of Construction Land often correspond with more developed economic conditions, implying a relatively higher demand for crayfish consumption. Third, these regions often provide the necessary financial support, labor resources, and infrastructure required for the expansion of the RCFs. Consequently, in these regions, farmers are more motivated to adopt the rice–crayfish co-culture model to satisfy market demands and achieve better economic returns.
4.3. Policy Implications
The growth of RCFs in the Jianghan Plain, as well as the factors influencing it, exhibits significant spatial diversity. Consequently, we suggest that local governments in the region formulate differentiated regulation policies to promote rice–crayfish co-culture related industries in the Jianghan Plain. These policies should take into account local agricultural conditions, location, socio-economic growth, and the landscape pattern of the RCFs. Below are some specific recommendations:
Firstly, the impact of the RCF landscape pattern on its expansion suggests that in Jianghan Plain, RCF growth is more likely in areas with larger and more contiguous RCF patches. For future promotion of the rice–crayfish co-culture model, the continuity of RCFs should be taken into consideration. Local governments can promote the spatial clustering of RCF through land consolidation and other engineering projects. They can also enhance the infrastructure for crayfish farming and processing to drive the scale and aggregation development of the rice–crayfish co-culture related industries.
Secondly, the availability of water is a crucial factor that restricts the expansion of RCFs. As depicted in Figure 12g, the factor “Distance to Water Sources” exhibits a significant negative relationship with the expansion of RCFs in most areas of the Jianghan Plain. This underscores the vital role of water sources in the expansion of RCFs. Consequently, local governments should increase investment in agricultural water conservation, ensure the efficiency and optimization of irrigation systems in farmland, and provide ample water resources to support the advancement of the rice–crayfish co-culture agricultural production model.
Thirdly, the expansion of RCFs is also impacted by the ‘Distance to Rural Settlements’. Local governments, particularly those in Songzi, Dangyang, and Zhijiang counties in the western part of the Jianghan Plain, should optimize the spatial layout of rural settlements and enhance rural infrastructure through rural planning and land consolidation projects. This will facilitate the daily management and care of RCFs by farmers.
Lastly, we recommend that local governments prioritize the promotion of RCF-related industries in regions abundant in labor and with a solid economic development foundation. As depicted in Figure 12h, the Proportion of Construction Land positively affects RCF expansion. A higher proportion of construction land indicates superior infrastructure, more developed markets, and a concentration of human resources. These elements can provide the necessary labor, capital, technology, and consumer markets for the expansion of RCF and the development of related industries. Therefore, directing focus to such regions could lead to a more efficient use of resources and increase the likelihood of successful RCF expansion.
The rapid expansion of the rice–crayfish co-culture model in the Jianghan Plain area over the past five years is indeed noteworthy due to its significant economic and ecological benefits, providing a sustainable and profitable approach to farming. The implications of our findings in this study are profound for land resource management and the sustainable development of rice–crayfish co-culture industries in Jianghan Plain. The spatial heterogeneity in the growth of RCFs and influencing factors demands tailored regulatory policies, which must consider the unique agricultural circumstance, location, socio-economic growth, water resources, and the RCF landscape patterns of different regions.
The expansion of RCFs is not just about increasing production; it is also about creating a sustainable model that bolsters economic development, environmental conservation, and social progress. This is particularly significant in a country like China, which places a special emphasis on the protection of cultivated land. The expansion of RCF can also help protect and sustainably utilize China’s limited cultivated land resources, thereby alleviating concerns about a potential food crisis. These findings offer a roadmap to achieve this balance, offering an actionable guide for local governments in the Jianghan Plain and potentially serving as a reference for other regions worldwide considering similar agricultural models.
4.4. Limitations and Future Works
This study has some limitations that should be acknowledged. Firstly, our research methodology depends on land-use survey data. However, China’s first nationwide high-precision land survey was not conducted until 2009, which may impact the general applicability of our research method. Consequently, our future aim is to refine the RCF extraction method and investigate more universally applicable methods. Secondly, as an RCF is a kind of agricultural co-culture system, its spatiotemporal evolution is strongly affected by macroeconomic and social factors like agricultural product prices and government land-use policies. The influence these aspects have on RCFs, and how they exert their impact, requires further investigation. For example, while current crayfish prices are on a steady rise, the effect of future price fluctuations on RCF expansion remains an open question. Thus, we hope that future research can comprehensively explore the potential factors and mechanisms influencing RCF expansion. This will not only deepen our understanding of the factors driving RCF expansion but also provide valuable insights for relevant decision-making.
5. Conclusions
In recent years, the RCFs in the Jianghan Plain region of China have rapidly expanded, spurred by local government policies and active participation from farmers. However, the current lack of data on the spatiotemporal distribution of RCFs in the area, as well as the insufficient comprehension of the influencing factors and spatiotemporal evolution mechanisms, stand as obstacles to the sustainable development of rice–crayfish co-culture related industries in the region.
In this study, we used Sentinel-2 imagery and land use survey data to extract information on RCF distribution in Jianghan Plain from 2016 to 2020. Based on this, we applied spatial autocorrelation and MGWR models with townships as the research units, to explore the spatial heterogeneity of the spatiotemporal variation and influencing factors of RCFs in Jianghan Plain. The findings of our research indicate the following:
(1) From 2016 to 2020, the overall trend of RCFs in Jianghan Plain demonstrated a significant expansion, with the RCF area expanding by 99.81% (rising from 1216.04 km2 in 2016 to 2429.76 km2 in 2020). The expansion of RCFs primarily exhibited a pattern of spreading outwards from the central-southern core area of the Jianghan Plain.
(2) RCFs in the Jianghan Plain exhibit significant spatial aggregation features, with High–High clusters predominantly found in the Qianjiang and Jianli areas located in the central-southern part of the Plain. Conversely, Low–Low clusters are primarily situated on the western and northern peripheries of the Jianghan Plain.
(3) The spatiotemporal dynamics of the RCFs in the Jianghan Plain during 2016 and 2020 were influenced by factors such as RCF landscape patterns, agricultural production conditions, locational factors, and socio-economic conditions, with each influencing factor exhibiting distinct spatial heterogeneity. Among these, the RCF landscape pattern played the most significant role in the expansion of RCFs. The analysis of factors affecting the spatiotemporal evolution of RCF suggests that RCF expansion is more likely to take place in paddy field areas with larger and more contiguous existing RCF patches, favorable water source conditions, and closer proximity to roads and rural settlements.
Agri-aqua-food systems have proven to be an effective strategy for promoting sustainable agricultural development, enhancing land productivity, and are significantly important in increasing farmers’ income and protecting arable land. In order to promote the sustainable development of Agri-aqua food systems, specifically the rice–crayfish co-culture system in Jianghan Plain, the following recommendations are proposed: (1). Local governments, supported by the national rural revitalization strategy and village planning, should optimize the spatial layout of rural settlements and improve infrastructure, including enhancing agricultural irrigation systems and rural road networks. These measures would create a conducive environment and provide the necessary infrastructure for the successful promotion and growth of rice–crayfish co-culture related industries in the Jianghan Plain. (2). The concentration and contiguity of RCF should be promoted through engineering measures like land consolidation. It is also essential to establish agricultural facilities pertinent to the rice–crayfish co-culture industries, including the processing, storage, and transportation of rice and crayfish products. These measures would result in the clustering and efficient development of rice–crayfish co-culture related industries. (3). Local governments should also optimize the spatial layout of urban development zones, ecological protection zones, and farmland protection zones. This would help to mitigate the conflicts between urbanization, ecological protection, and cultivated land protection, and better protect cultivated land, thereby providing a guarantee for the growth of farmers’ income and the sustainable development of agriculture in the region.
Author Contributions
Conceptualization, X.Z.; Methodology, F.L., Y.Z. and X.Z.; Validation, F.L.; Formal analysis, F.L.; Investigation, Y.Z.; Data curation, F.L. and Y.Z.; Writing—original draft preparation, F.L.; Writing—review and editing, X.Z.; Visualization, F.L.; Supervision, X.Z.; Funding acquisition, X.Z. All authors have read and agreed to the published version of the manuscript.
Funding
This work was supported by the National Natural Science Foundation of China (Grant number: No. 42293271, No. 41971336, No. 42230107).
Data Availability Statement
The raw data supporting the conclusions of this article will be made available by the authors on request.
Conflicts of Interest
The authors declare that they have no known competing financial interests or personal relationships that could have appeared to influence the work reported in this paper.
References
- Daszkiewicz, T. Food Production in the Context of Global Developmental Challenges. Agriculture 2022, 12, 832. [Google Scholar] [CrossRef]
- Chen, H.; Tan, Y.; Xiao, W.; He, T.; Xu, S.; Meng, F.; Li, X.; Xiong, W. Assessment of continuity and efficiency of complemented cropland use in China for the past 20 years: A perspective of cropland abandonment. J. Clean. Prod. 2023, 388, 135987. [Google Scholar] [CrossRef]
- Qiu, B.; Li, H.; Tang, Z.; Chen, C.; Berry, J. How cropland losses shaped by unbalanced urbanization process? Land Use Pol. 2020, 96, 104715. [Google Scholar] [CrossRef]
- Li, Y.; Wu, T.; Wang, S.; Ku, X.; Zhong, Z.; Liu, H.; Li, J. Developing integrated rice-animal farming based on climate and farmers choices. Agric. Syst. 2023, 204, 103554. [Google Scholar]
- Guo, L.; Zhao, L.; Ye, J.; Ji, Z.; Tang, J.-J.; Bai, K.; Zheng, S.; Hu, L.; Chen, X. Using aquatic animals as partners to increase yield and maintain soil nitrogen in the paddy ecosystems. Elife 2022, 11, e73869. [Google Scholar] [CrossRef]
- Harrison, M.T.; Cullen, B.R.; Mayberry, D.E.; Cowie, A.L.; Bilotto, F.; Badgery, W.B.; Liu, K.; Davison, T.; Christie, K.M.; Muleke, A.; et al. Carbon myopia: The urgent need for integrated social, economic and environmental action in the livestock sector. Glob. Chang. Biol. 2021, 27, 5726–5761. [Google Scholar] [CrossRef]
- Snow, V.; Rodriguez, D.; Dynes, R.; Kaye-Blake, W.; Mallawaarachchi, T.; Zydenbos, S.; Cong, L.; Obadovic, I.; Agnew, R.; Amery, N.; et al. Resilience achieved via multiple compensating subsystems: The immediate impacts of COVID-19 control measures on the agri-food systems of Australia and New Zealand. Agric. Syst. 2021, 187, 103025. [Google Scholar] [CrossRef]
- Zhou, Y.; Li, X.; Liu, Y. Land use change and driving factors in rural China during the period 1995-2015. Land Use Pol. 2020, 99, 105048. [Google Scholar] [CrossRef]
- Jiang, Y.; Cao, C. Crayfish–rice integrated system of production: An agriculture success story in China. A review. Agron. Sustain. Dev. 2021, 41, 68. [Google Scholar] [CrossRef]
- Li, Q.; Xu, L.; Xu, L.; Qian, Y.; Jiao, Y.; Bi, Y.; Zhang, T.; Zhang, W.; Liu, Y. Influence of consecutive integrated rice–crayfish culture on phosphorus fertility of paddy soils. Land Degrad. Dev. 2018, 29, 3413–3422. [Google Scholar] [CrossRef]
- Si, G.; Peng, C.; Xu, X.; Xu, D.; Yuan, J.; Li, J. Effect of integrated rice-crayfish farming system on soil physico-chemical properties in waterlogged paddy soils. Chin. J. Eco-Agric. 2017, 25, 61–68. [Google Scholar]
- Sun, Z.; Guo, Y.; Li, C.; Cao, C.; Yuan, P.; Zou, F.; Wang, J.; Jia, P.; Wang, J. Effects of straw returning and feeding on greenhouse gas emissions from integrated rice-crayfish farming in Jianghan Plain, China. Environ. Sci. Pollut. Res. 2019, 26, 11710–11718. [Google Scholar] [CrossRef] [PubMed]
- Hou, J.; Styles, D.; Cao, Y.; Ye, X. The sustainability of rice-crayfish coculture systems: A mini review of evidence from Jianghan plain in China. J. Sci. Food Agric. 2021, 101, 3843–3853. [Google Scholar] [CrossRef]
- Kruse, J.; Koch, M.; Khoi, C.M.; Braun, G.; Sebesvari, Z.; Amelung, W. Land use change from permanent rice to alternating rice-shrimp or permanent shrimp in the coastal Mekong Delta, Vietnam: Changes in the nutrient status and binding forms. Sci. Total Environ. 2020, 703, 134758. [Google Scholar] [CrossRef]
- Koehler, J.; Kuenzer, C. Forecasting spatio-temporal dynamics on the land surface using earth observation data—A review. Remote Sens. 2020, 12, 3513. [Google Scholar] [CrossRef]
- Kuras, A.; Brell, M.; Rizzi, J.; Burud, I. Hyperspectral and lidar data applied to the urban land cover machine learning and neural-network-based classification: A review. Remote Sens. 2021, 13, 3393. [Google Scholar] [CrossRef]
- Oliphant, A.J.; Thenkabail, P.S.; Teluguntla, P.; Xiong, J.; Gumma, M.K.; Congalton, R.G.; Yadav, K. Mapping cropland extent of Southeast and Northeast Asia using multi-year time-series Landsat 30-m data using a random forest classifier on the Google Earth Engine Cloud. Int. J. Appl. Earth Obs. 2019, 81, 110–124. [Google Scholar] [CrossRef]
- Yang, X.; Xiao, X.; Qin, Y.; Wang, J.; Neal, K. Mapping forest in the southern Great Plains with ALOS-2 PALSAR-2 and Landsat 7/8 data. Int. J. Appl. Earth Obs. 2021, 104, 102578. [Google Scholar] [CrossRef]
- Wei, Y.; Lu, M.; Yu, Q.; Xie, A.; Hu, Q.; Wu, W. Understanding the dynamics of integrated rice–crawfish farming in Qianjiang county, China using Landsat time series images. Agric. Syst. 2021, 191, 103167. [Google Scholar] [CrossRef]
- Xia, T.; Ji, W.; Li, W.; Zhang, C.; Wu, W. Phenology-based decision tree classification of rice-crayfish fields from Sentinel-2 imagery in Qianjiang, China. Int. J. Remote Sens. 2021, 42, 8124–8144. [Google Scholar] [CrossRef]
- Chen, Y.; Yu, P.; Chen, Y.; Chen, Z. Spatiotemporal dynamics of rice–crayfish field in Mid-China and its socioeconomic benefits on rural revitalisation. Appl. Geogr. 2022, 139, 102636. [Google Scholar] [CrossRef]
- Liu, C.; Wu, X.; Wang, L. Analysis on land ecological security change and affect factors using RS and GWR in the Danjiangkou Reservoir area. China. Appl. Geogr. 2019, 105, 1–14. [Google Scholar] [CrossRef]
- Chen, X.; Nordhaus, W.D. VIIRS nighttime lights in the estimation of cross-sectional and time-series GDP. Remote Sens. 2019, 11, 1057. [Google Scholar] [CrossRef]
- Feyisa, G.L.; Meilby, H.; Fensholt, R.; Proud, S.R. Automated Water Extraction Index: A new technique for surface water mapping using Landsat imagery. Remote Sens. Environ. 2014, 140, 23–35. [Google Scholar] [CrossRef]
- Otsu, N. A Threshold Selection Method from Gray-Level Histograms. IEEE Trans. Syst. Man Cybern. 1979, 9, 62–66. [Google Scholar] [CrossRef]
- Hou, L.; Wu, F.; Xie, X. The spatial characteristics and relationships between landscape pattern and ecosystem service value along an urban-rural gradient in Xi’an city, China. Ecol. Indic. 2020, 108, 105720. [Google Scholar] [CrossRef]
- Liu, C.; Zhang, F.; Carl Johnson, V.; Duan, P.; Kung, H. Spatio-temporal variation of oasis landscape pattern in arid area: Human or natural driving? Ecol. Indic. 2021, 125, 107495. [Google Scholar] [CrossRef]
- Plexida, S.G.; Sfougaris, A.I.; Ispikoudis, I.P.; Papanastasis, V.P. Selecting landscape metrics as indicators of spatial heterogeneity—A comparison among Greek landscapes. Int. J. Appl. Earth Obs. 2014, 26, 26–35. [Google Scholar] [CrossRef]
- He, S.; Yu, S.; Li, G.; Zhang, J. Exploring the influence of urban form on land-use efficiency from a spatiotemporal heterogeneity perspective: Evidence from 336 Chinese cities. Land Use Pol. 2020, 95, 104576. [Google Scholar] [CrossRef]
- McGarigal, K.; Marks, B.J. FRAGSTATS: Spatial Pattern Analysis Program for Quantifying Landscape Structure; U.S. Department of Agriculture, Forest Service, Pacific Northwest Research Station: Portland, OR, USA, 1995. [Google Scholar]
- Anselin, L. Quantile local spatial autocorrelation. Lett. Spat. Resour. Sci. 2019, 12, 155–166. [Google Scholar] [CrossRef]
- Wang, L.; Zhang, S.; Xiong, Q.; Liu, Y.; Liu, Y.; Liu, Y. Spatiotemporal dynamics of cropland expansion and its driving factors in the Yangtze River Economic Belt: A nuanced analysis at the county scale. Land Use Pol. 2022, 119, 106168. [Google Scholar] [CrossRef]
- Ariti, A.T.; van Vliet, J.; Verburg, P.H. Land-use and land-cover changes in the Central Rift Valley of Ethiopia: Assessment of perception and adaptation of stakeholders. Appl. Geogr. 2015, 65, 28–37. [Google Scholar] [CrossRef]
- Zelaya, K.; van Vliet, J.; Verburg, P.H. Characterization and analysis of farm system changes in the Mar Chiquita basin, Argentina. Appl. Geogr. 2016, 68, 95–103. [Google Scholar] [CrossRef]
- Zhang, P.; Yang, D.; Qin, M.; Jing, W. Spatial heterogeneity analysis and driving forces exploring of built-up land development intensity in Chinese prefecture-level cities and implications for future Urban Land intensive use. Land Use Pol. 2020, 99, 104958. [Google Scholar] [CrossRef]
- Gao, J.; Li, S. Detecting spatially non-stationary and scale-dependent relationships between urban landscape fragmentation and related factors using Geographically Weighted Regression. Appl. Geogr. 2011, 31, 292–302. [Google Scholar] [CrossRef]
- Fotheringham, A.S.; Yang, W.; Kang, W. Multiscale Geographically Weighted Regression (MGWR). Ann. Am. Assoc. Geogr. 2017, 107, 1247–1265. [Google Scholar] [CrossRef]
- Yu, H.; Fotheringham, A.S.; Li, Z.; Oshan, T.; Kang, W.; Wolf, L.J. Inference in Multiscale Geographically Weighted Regression. Geogr. Anal. 2020, 52, 87–106. [Google Scholar] [CrossRef]
- Siagian, D.R.; Shrestha, R.P.; Shrestha, S.; Kuwornu, J.K.M. Factors driving rice land change 1989-2018 in the deli serdang regency, Indonesia. Agriculture 2019, 9, 186. [Google Scholar] [CrossRef]
- Zhou, Y.; Zhong, Z.; Cheng, G. Cultivated land loss and construction land expansion in China: Evidence from national land surveys in 1996, 2009 and 2019. Land Use Pol. 2023, 125, 106496. [Google Scholar] [CrossRef]
- Eagle, A.J.; Eagle, D.E.; Stobbe, T.E.; van Kooten, G.C. Farmland Protection and Agricultural Land Values at the Urban-Rural Fringe: British Columbia’s Agricultural Land Reserve. Am. J. Agric. Econ. 2015, 97, 282–298. [Google Scholar] [CrossRef]
- Li, F.; Feng, S.; Lu, H.; Qu, F.; D’Haese, M. How do non-farm employment and agricultural mechanization impact on large-scale farming? A spatial panel data analysis from Jiangsu Province, China. Land Use Pol. 2021, 107, 105517. [Google Scholar] [CrossRef]
- Roy, D.P.; Wulder, M.A.; Loveland, T.R.; Woodcock, C.E.; Allen, R.G.; Anderson, M.C.; Helder, D.; Irons, J.R.; Johnson, D.M.; Kennedy, R.; et al. Landsat-8: Science and product vision for terrestrial global change research. Remote Sens. Environ. 2014, 145, 154–172. [Google Scholar] [CrossRef]
- Teluguntla, P.; Thenkabail, P.S.; Oliphant, A.; Xiong, J.; Gumma, M.K.; Congalton, R.G.; Yadav, K.; Huete, A. A 30-m landsat-derived cropland extent product of Australia and China using random forest machine learning algorithm on Google Earth Engine cloud computing platform. ISPRS J. Photogramm. Remote Sens. 2018, 144, 325–340. [Google Scholar] [CrossRef]
- Rudiyanto; Minasny, B.; Shah, R.M.; Che Soh, N.; Arif, C.; Indra Setiawan, B. Automated Near-Real-Time Mapping and Monitoring of Rice Extent, Cropping Patterns, and Growth Stages in Southeast Asia Using Sentinel-1 Time Series on a Google Earth Engine Platform. Remote Sens. 2019, 11, 1666. [Google Scholar] [CrossRef]
- Anselin, L. Local Indicators of Spatial Association—LISA. Geogr. Anal. 1995, 27, 93–115. [Google Scholar] [CrossRef]
- Anselin, L.; Syabri, I.; Kho, Y. GeoDa: An introduction to spatial data analysis. Geogr. Anal. 2006, 38, 5–22. [Google Scholar] [CrossRef]
- Yu, P.; Zhang, S.; Yung, E.H.K.; Chan, E.H.W.; Luan, B.; Chen, Y. On the urban compactness to ecosystem services in a rapidly urbanising metropolitan area: Highlighting scale effects and spatial non–stationary. Environ. Impact Assess. Rev. 2023, 98, 106975. [Google Scholar] [CrossRef]
Figure 1.
Location of the study area.

Figure 2.
Cultivation process of RCF system and lotus root.

Figure 3.
Flowchart of the extraction of RCF.

Figure 4.
Distribution of validation samples for RCF extraction results in Jianghan Plain: (a) samples from 2016; (b) samples from 2020.
Figure 4.
Distribution of validation samples for RCF extraction results in Jianghan Plain: (a) samples from 2016; (b) samples from 2020.

Figure 5.
Spatial distribution of RCFs in Jianghan Plain in 2016 (a) and 2020 (b).

Figure 6.
Regional distribution and changes of RCF area in Jianghan Plain (2016–2020).

Figure 7.
Changes in the spatial distribution of RCF in Jianghan Plain from 2016 to 2020: (a) the loss of RCF; (b) the expansion of RCF.
Figure 7.
Changes in the spatial distribution of RCF in Jianghan Plain from 2016 to 2020: (a) the loss of RCF; (b) the expansion of RCF.

Figure 8.
Spatial distribution and statistical probability density of landscape indices for RCFs in Jianghan Plain: (a) PD in 2016, (b) LSI in 2016, (c) AI in 2016, (d) PD in 2020, (e) LSI in 2020, (f) AI in 2020, (g) PD, (h) LSI and (i) AI.
Figure 8.
Spatial distribution and statistical probability density of landscape indices for RCFs in Jianghan Plain: (a) PD in 2016, (b) LSI in 2016, (c) AI in 2016, (d) PD in 2020, (e) LSI in 2020, (f) AI in 2020, (g) PD, (h) LSI and (i) AI.

Figure 9.
The LISA map of RCF in Jianghan Plain in 2016 (a) and 2020 (b).

Figure 10.
Spatial distribution of local R-Square for the MGWR model.

Figure 11.
Statistical distribution of the regression coefficients of influential factors.

Figure 12.
Spatial distribution of the regression coefficients of influential factors: (a) AI, (b) LSI, (c) PD, (d) DWS, (e) DCT, (f) DR, (g) DRS, and (h) PCL.
Figure 12.
Spatial distribution of the regression coefficients of influential factors: (a) AI, (b) LSI, (c) PD, (d) DWS, (e) DCT, (f) DR, (g) DRS, and (h) PCL.


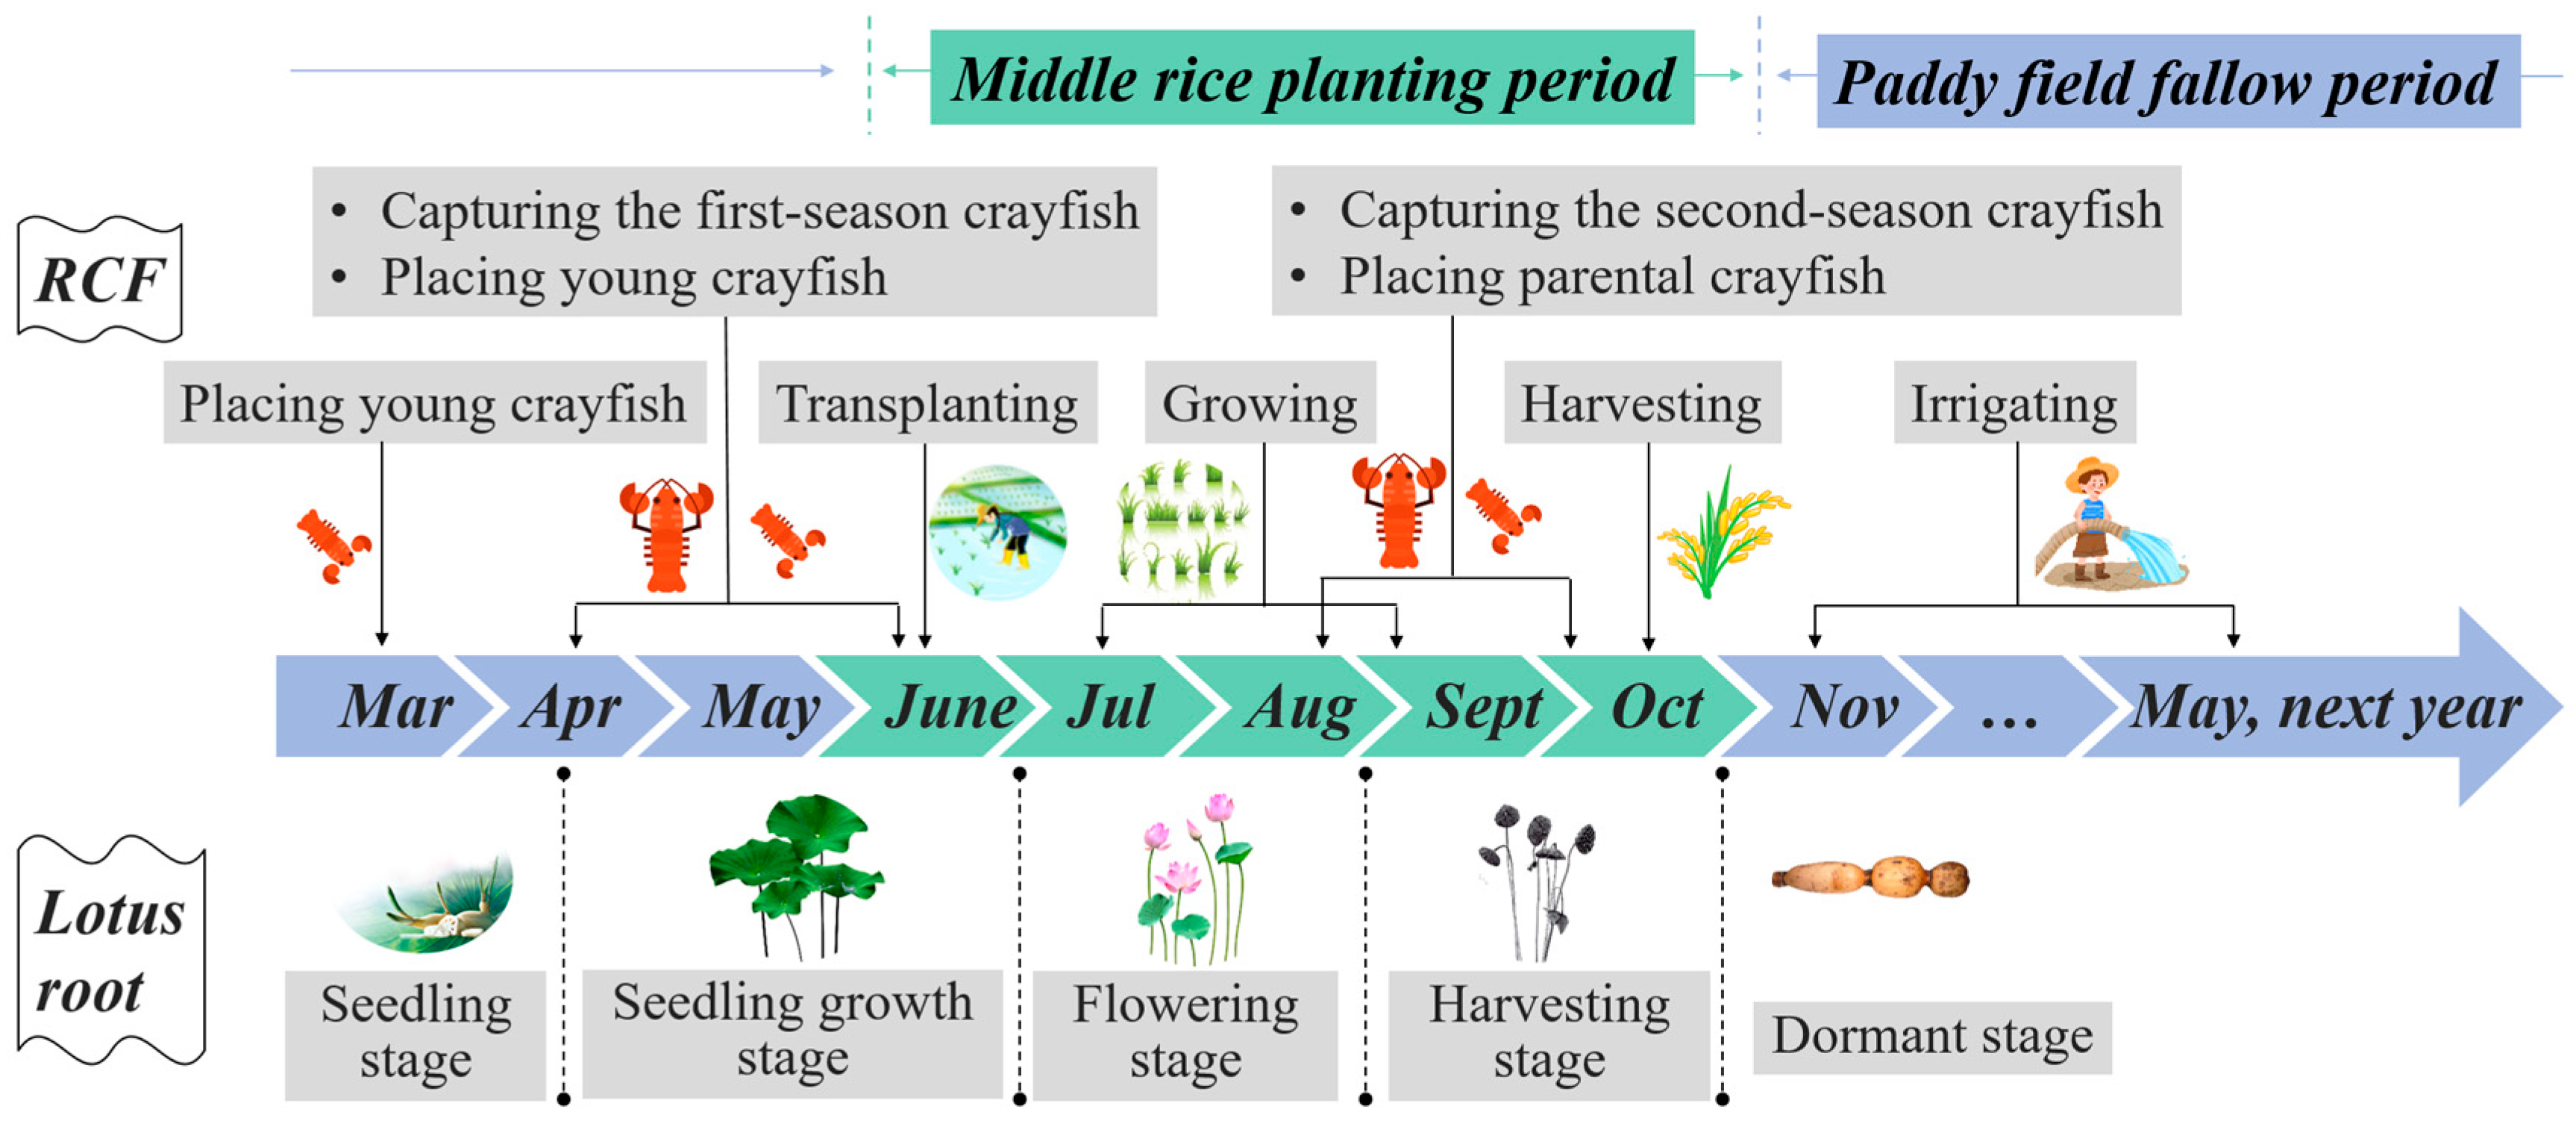
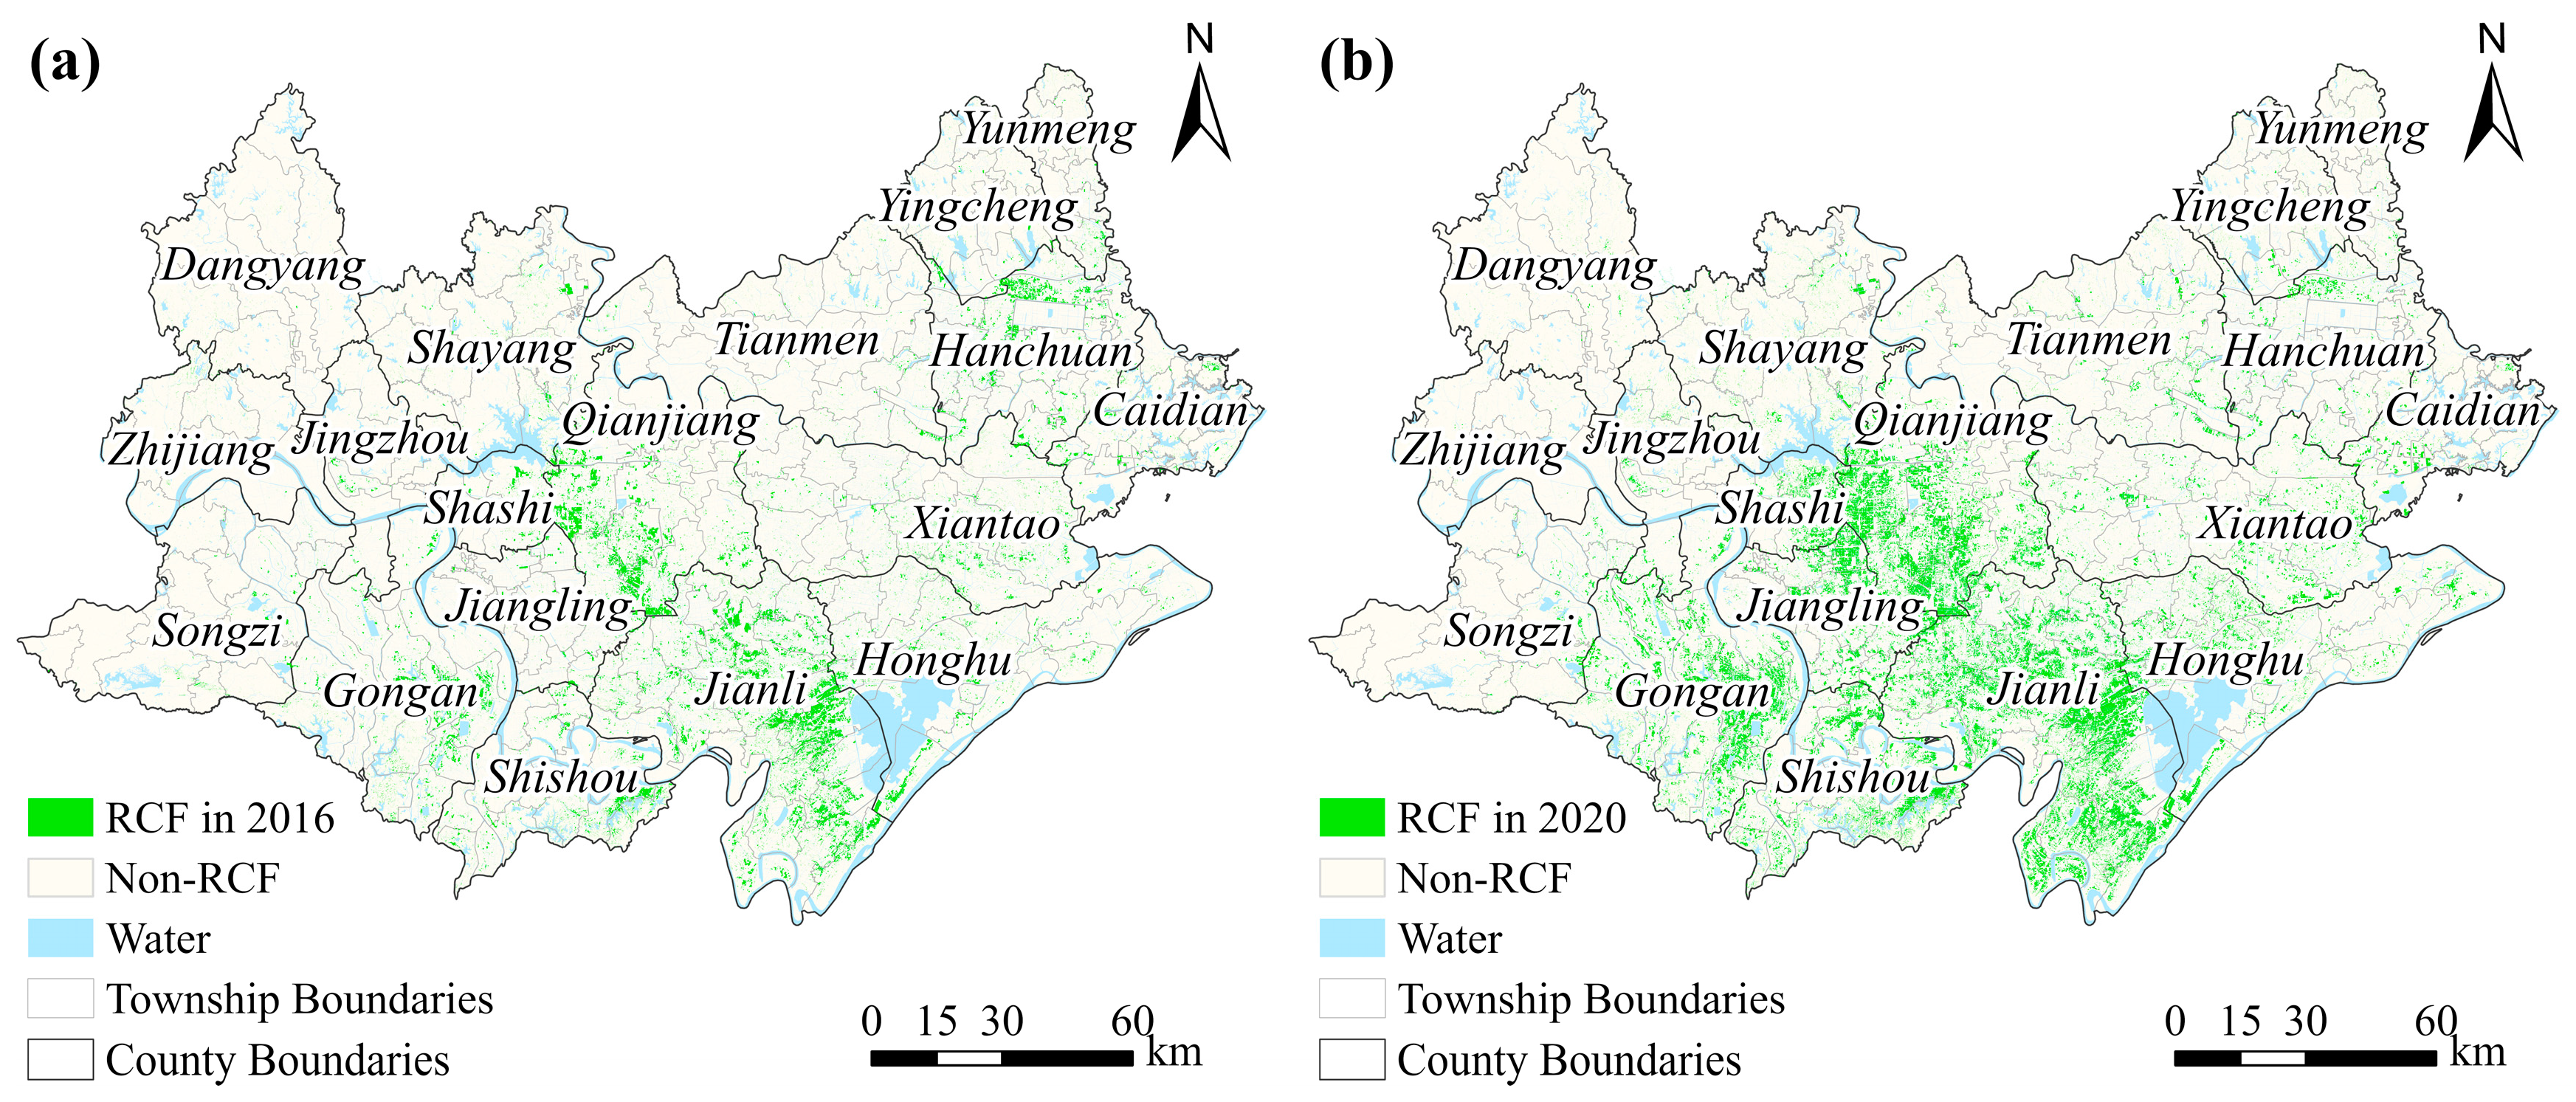
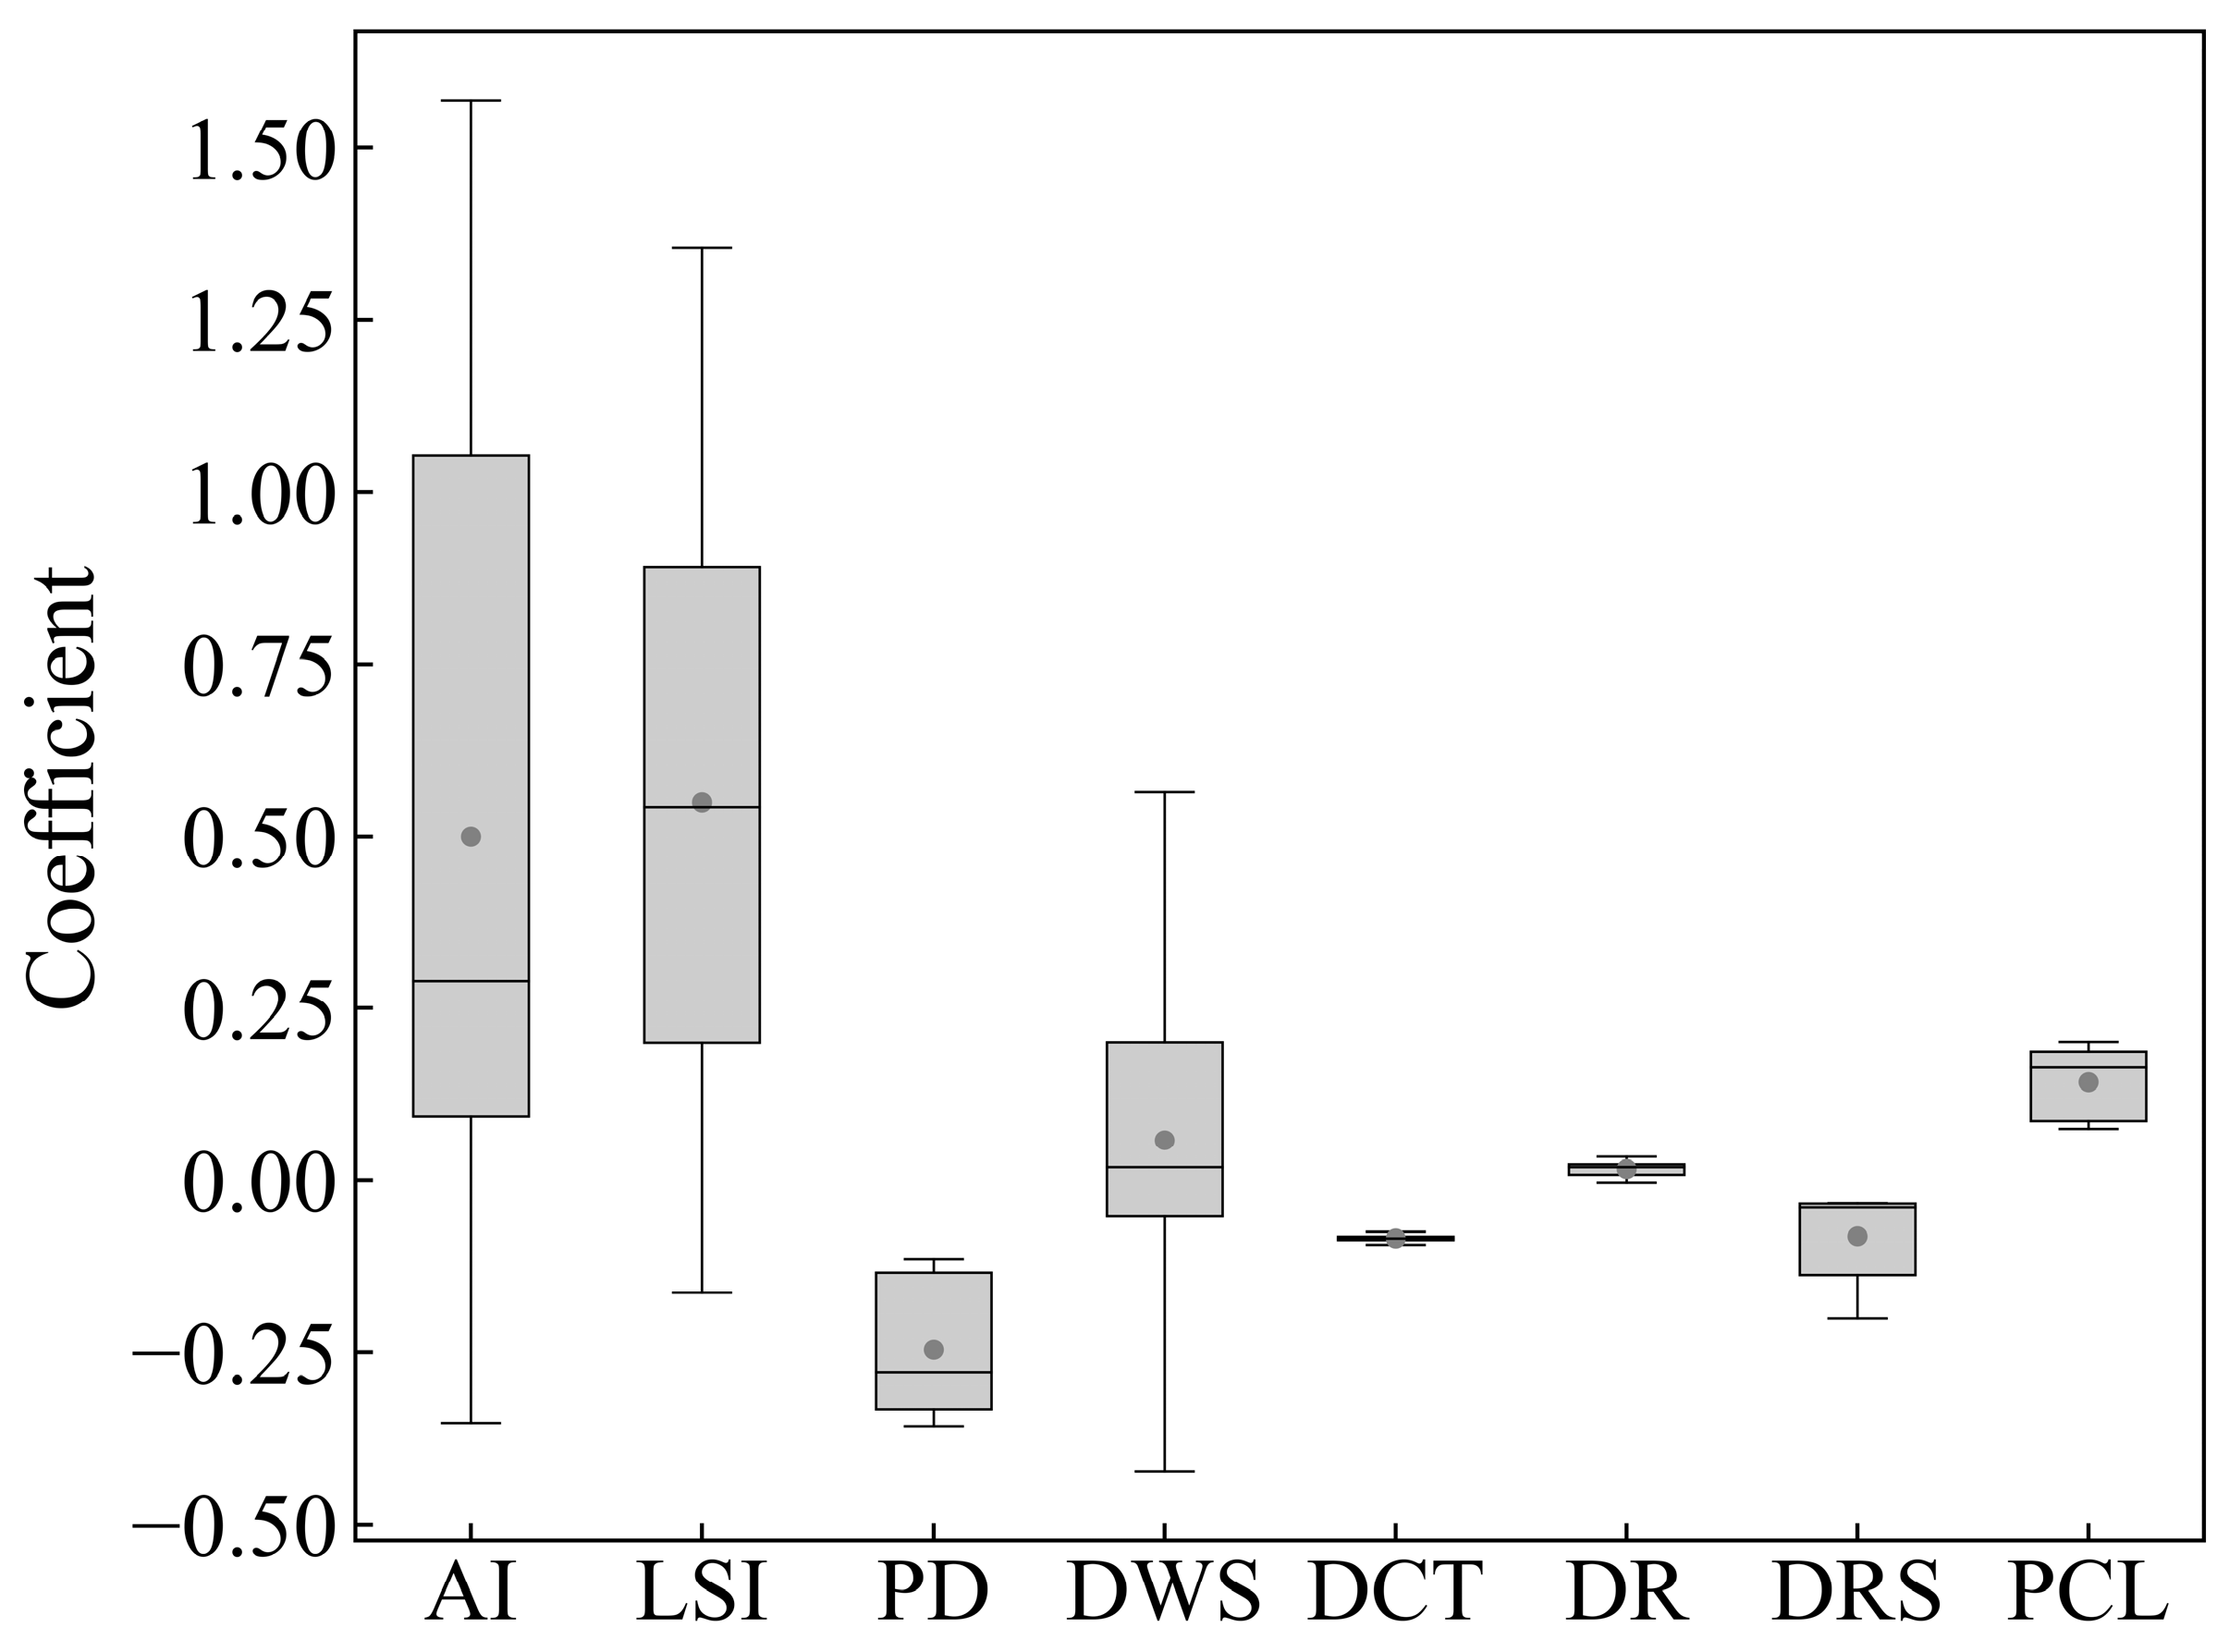
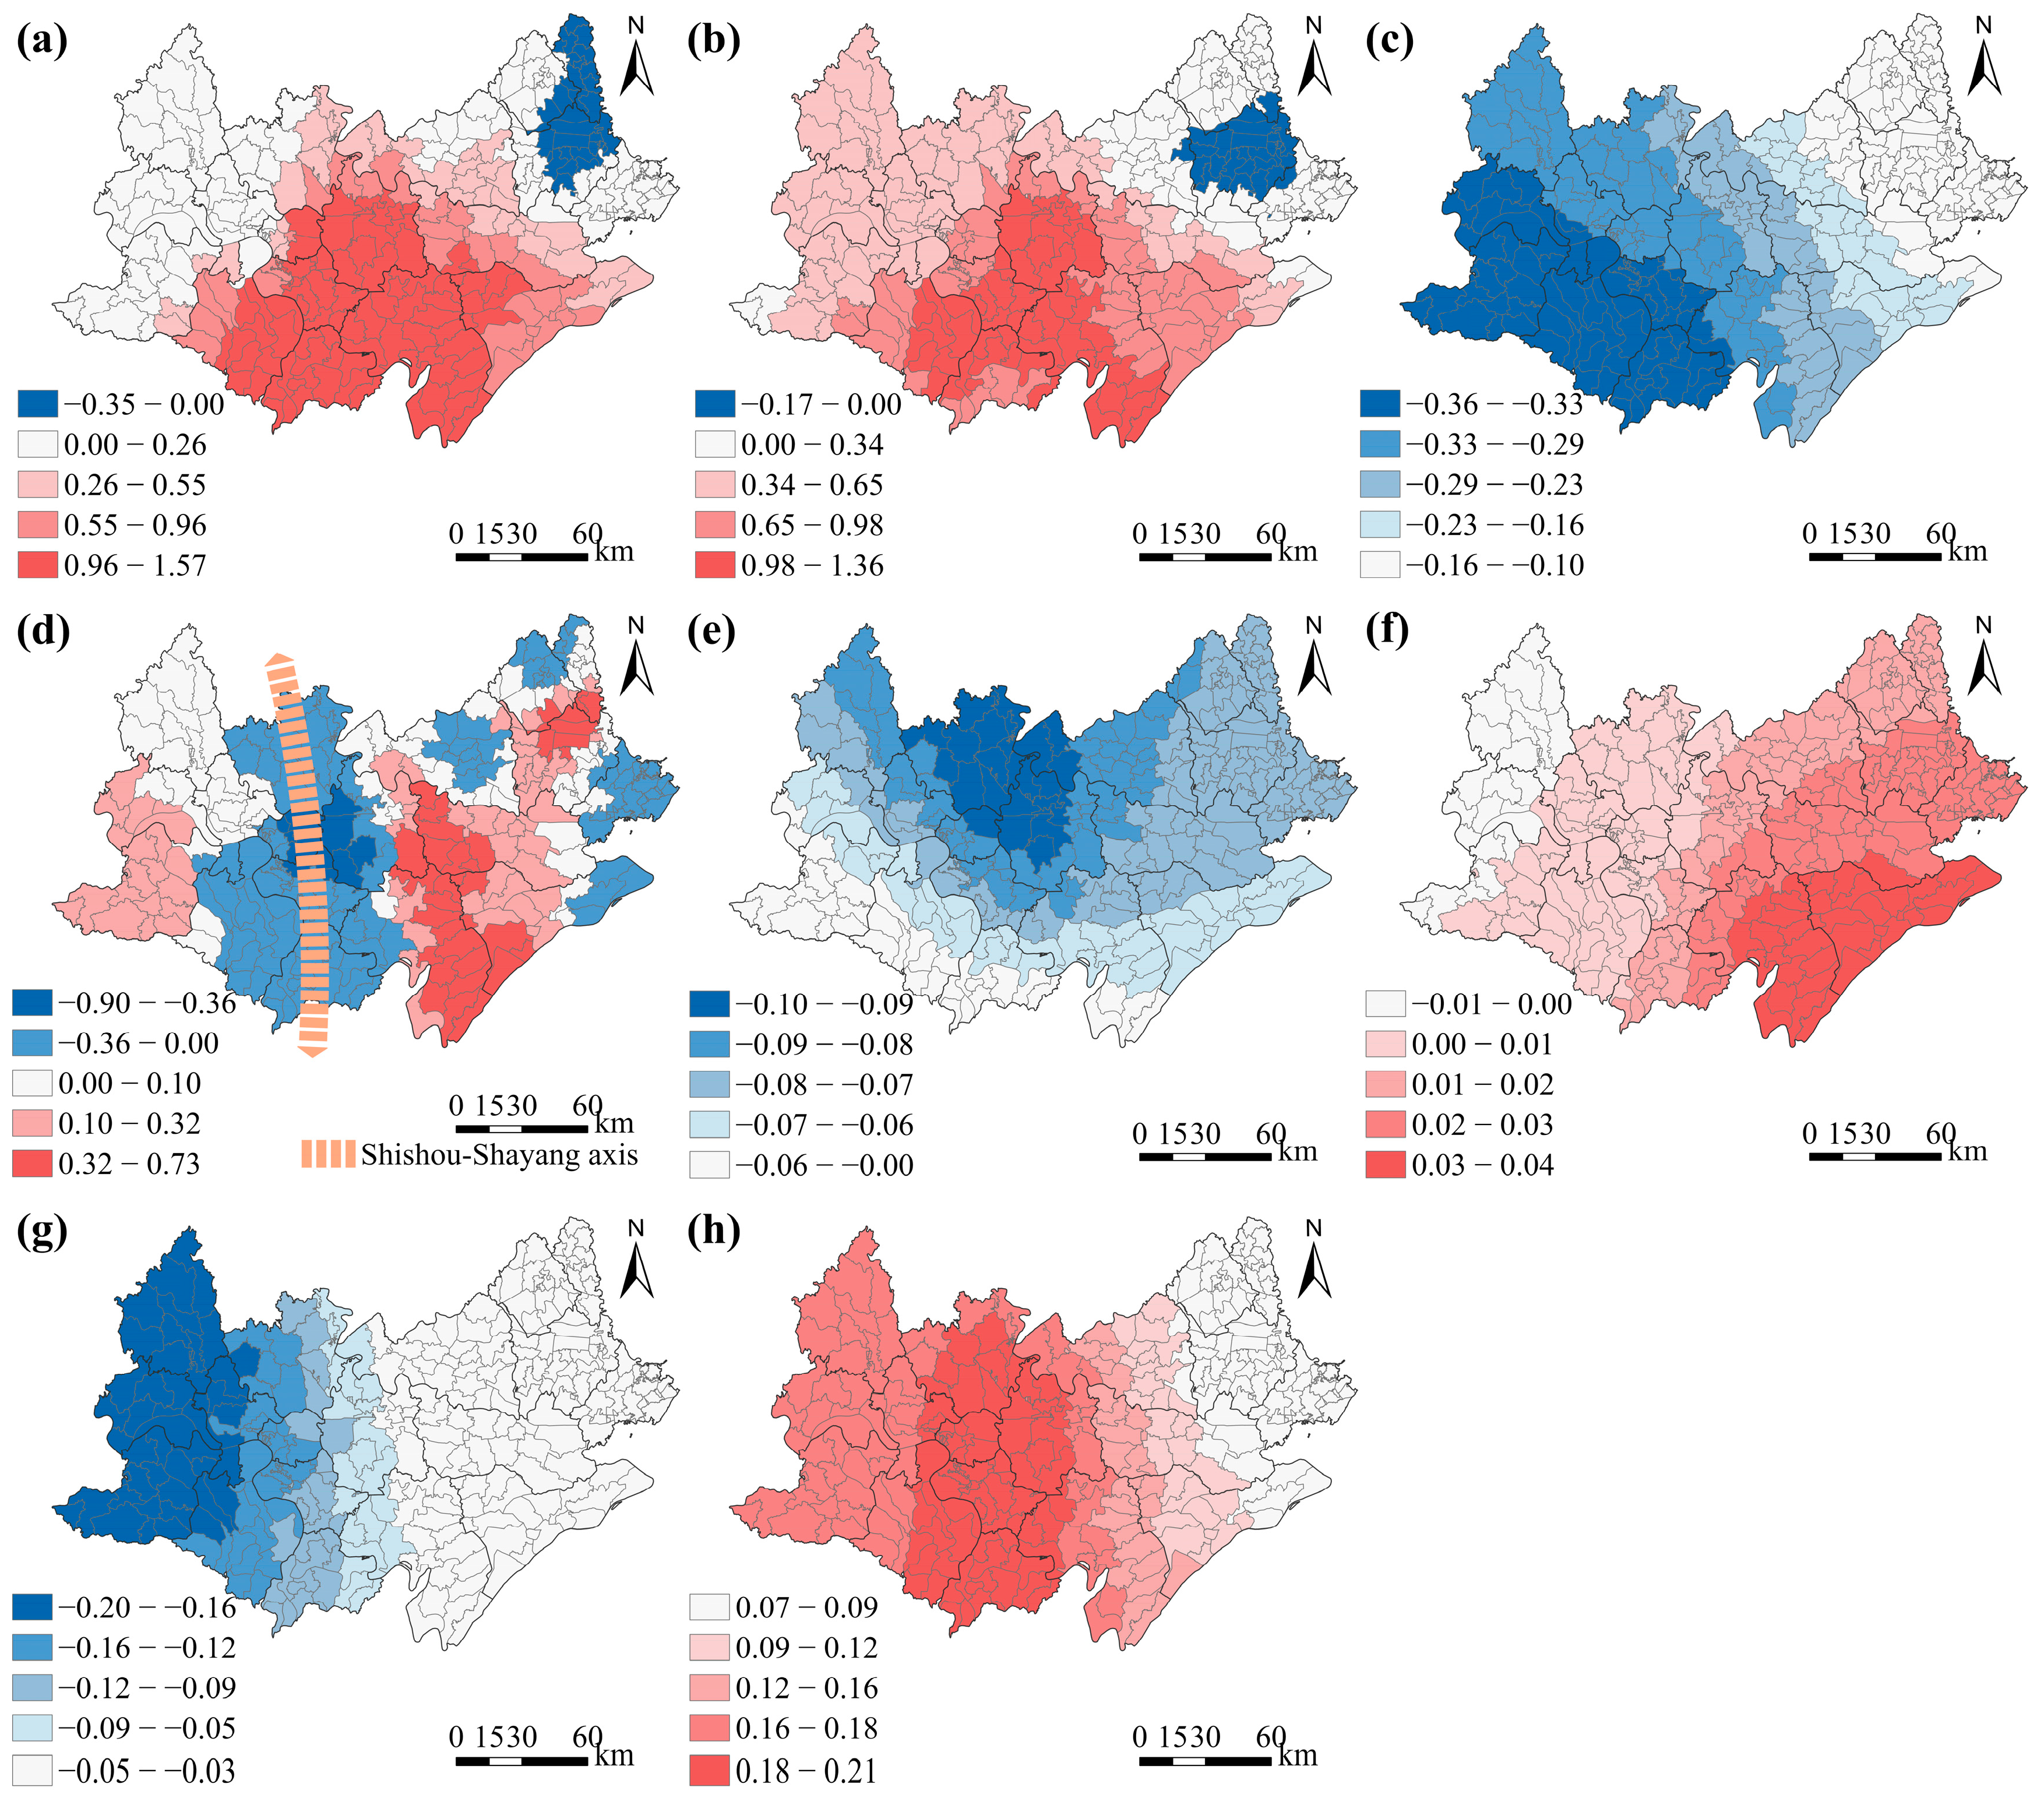
Table 1.
Data sources used in this study.
| Datasets | Type | Resolution | Year | Sources |
|---|---|---|---|---|
| Sentinel-2 a | Raster | 10 m | 2016, 2020 | https://earthengine.google.com/ accessed on 15 November 2022 |
| Land Use | Raster | 10 m | 2016, 2020 | Department of Natural Resources of Hubei Province |
| NPP VIIRS | Raster | 1 km | 2016, 2020 | https://payneinstitute.mines.edu/eog/ accessed on 11 April 2023 |
| Population | Raster | 1 km | 2016, 2020 | https://landscan.ornl.gov/ accessed on 20 April 2023 |
| Roads | Vector | -- | 2016, 2020 | https://www.openstreetmap.org/ accessed on 11 April 2023 |
| Statistical Yearbooks | CSV | -- | 2016, 2020 | Local governments of Hubei Province |
a This study primarily utilized the blue, green, NIR, SWIR1, and SWIR2 bands. Both SWIR bands were resampled to a 10 m resolution.
Table 2.
Landscape indices and their ecological significance.
| Indicator | Abbreviation | Range | Description |
|---|---|---|---|
| Patch Density | PD | ≥0 | A measure of the number of patches per unit area, indicating the degree of fragmentation in a landscape. |
| Landscape Shape Index | LSI | ≥1 | A metric that quantifies the complexity of shape and arrangement of patches within a landscape. |
| Aggregation Index | AI | (0, 100] | A concise measure of the degree to which patches of the same type are physically grouped together in a landscape. |
Table 3.
Potential influencing factors of the spatiotemporal change of RCF.
| Type | Factor | Code | Definition | Unit |
|---|---|---|---|---|
| Agricultural Factors | Distance to Rural Settlements | DRS | The average distance from RCF to its nearest rural village. | m |
| Proportion of Cropland | PC | The proportion of cropland in each township unit. | % | |
| Per Capita Cropland Area | PCCA | The cropland area per person in a specific region. | m2 | |
| Proportion of Water Area | PWA | The percentage of a region’s total area that is covered by water. | % | |
| Location Factors | Distance to Water Sources | DWS | The average distance from an RCF to its nearest water source. | m |
| Road Network Density | RND | The total length of roads in a particular area relative to the size of that area. | km/km2 | |
| Distance to County Town | DCT | The distance from each township to its county town. | km | |
| Distance to Road | DR | The average distance from RCF to its nearest road. | m | |
| Socioeconomic Factors | Gross Domestic Product | GDP | GDP of each township. | Billion Yuan |
| Rural Population Density | RPD | The number of rural people per unit of land area. | people/km2 | |
| Average Nighttime Light Intensity | ANLI | The average brightness of nighttime lights in each township. | nW/(cm2·sr) | |
| Proportion of Construction Land | PCL | The proportion of construction land in each township. | % | |
| Patch Density | PD | Number of RCF patches per unit area. | - | |
| Landscape Pattern of RCF | Landscape Shape Index | LSI | Reflects the complexity and regularity of RCF’s landscape configuration. | - |
| Aggregation Index | AI | Spatial aggregation degree of RCF in an area. | - |
Table 4.
Accuracy assessment of RCF extraction results in Jianghan Plain.
| Year | Overall Accuracy (%) | User’s Accuracy (%) | Producer’s Accuracy (%) | ||
|---|---|---|---|---|---|
| RCF | Non-RCF | RCF | Non-RCF | ||
| 2016 | 90.00 | 95.45 | 85.71 | 84.00 | 96.00 |
| 2020 | 93.25 | 94.82 | 91.79 | 91.50 | 95.00 |
Table 5.
Comparison of RCF area results with Statistical Yearbook Data and existing research findings.
Table 5.
Comparison of RCF area results with Statistical Yearbook Data and existing research findings.
| Comparative Items | This Study (km2) | Reference (km2) | Source |
|---|---|---|---|
| The total area of RCF in Jianghan Plain in 2016 | 1216.04 | 1534.91 | The County Statistical Yearbooks of China |
| The total area of RCF in Jianghan Plain in 2020 | 2429.76 | 2513.21 | The County Statistical Yearbooks of China |
| The total area of RCF in Jianli County | 714.51 (2020) | 724.45 (2019) | Chen et al. [21] |
Table 6.
Model evaluation results.
| Model | AICc | Adjusted R-Square | Moran’s I of Residual |
|---|---|---|---|
| OLS | 1812.500 | 0.583 | 0.329 (p < 0.01) |
| GWR | 466.798 | 0.815 | 0.139 (p < 0.01) |
| MGWR | 380.718 | 0.865 | 0.030 (p > 0.05) |
Table 7.
Comparing the bandwidths between GWR and MGWR.
| Explanatory Variable | Bandwidth in GWR Model | Bandwidth in MGWR Model |
|---|---|---|
| Intercept | 55 | 30 |
| Distance to Rural Settlements (DRS) | 55 | 89 |
| Distance to Water Sources (DWS) | 55 | 30 |
| Distance to County Town (DCT) | 55 | 295 |
| Distance to Road (DR) | 55 | 295 |
| Proportion of Construction Land (PCL) | 55 | 218 |
| Patch Density (PD) | 55 | 50 |
| Landscape Shape Index (LSI) | 55 | 30 |
| Aggregation Index (AI) | 55 | 30 |
Disclaimer/Publisher’s Note: The statements, opinions and data contained in all publications are solely those of the individual author(s) and contributor(s) and not of MDPI and/or the editor(s). MDPI and/or the editor(s) disclaim responsibility for any injury to people or property resulting from any ideas, methods, instructions or products referred to in the content. |
© 2024 by the authors. Licensee MDPI, Basel, Switzerland. This article is an open access article distributed under the terms and conditions of the Creative Commons Attribution (CC BY) license (https://creativecommons.org/licenses/by/4.0/).
Share and Cite
MDPI and ACS Style
Luo, F.; Zhang, Y.; Zhao, X. Understanding the Spatiotemporal Dynamics and Influencing Factors of the Rice–Crayfish Field in Jianghan Plain, China. Remote Sens. 2024, 16, 1541. https://0-doi-org.brum.beds.ac.uk/10.3390/rs16091541
AMA Style
Luo F, Zhang Y, Zhao X. Understanding the Spatiotemporal Dynamics and Influencing Factors of the Rice–Crayfish Field in Jianghan Plain, China. Remote Sensing. 2024; 16(9):1541. https://0-doi-org.brum.beds.ac.uk/10.3390/rs16091541
Chicago/Turabian StyleLuo, Fang, Yiqing Zhang, and Xiang Zhao. 2024. "Understanding the Spatiotemporal Dynamics and Influencing Factors of the Rice–Crayfish Field in Jianghan Plain, China" Remote Sensing 16, no. 9: 1541. https://0-doi-org.brum.beds.ac.uk/10.3390/rs16091541
Note that from the first issue of 2016, this journal uses article numbers instead of page numbers. See further details here.