Article

Quantitative Research on the Morphological Characteristics of Lunar Impact Craters of Different Stratigraphic Ages since the Imbrian Period

1
Center for Lunar and Planetary Science, Institute of Geochemistry, Chinese Academy of Sciences, Guiyang 550081, China
2
University of Chinese Academy of Sciences, Beijing 100049, China
3
Institute of Geology and Geophysics, Chinese Academy of Sciences, Beijing 10049, China
*
Author to whom correspondence should be addressed.
Submission received: 7 March 2024 / Revised: 22 April 2024 / Accepted: 24 April 2024 / Published: 26 April 2024
(This article belongs to the Section Satellite Missions for Earth and Planetary Exploration)

Abstract

:
Impact craters serve as recorders of lunar evolutionary history, and determining the stratigraphic ages of craters is crucial. However, the age of many craters on the Moon remains undetermined. The morphology of craters is closely related to their stratigraphic ages. In the study, we systematically and quantitatively analyzed seven morphological parameters of 432 impact craters with known stratigraphic ages (Copernican, Eratosthenian, Imbrian), including crater depth, wall width, wall height, rim height, irregularity, volume, and roughness, as well as rock abundance. The study provided a range of morphological parameters for craters from the Copernican, Eratosthenian, and Imbrian. Additionally, we derived power law relationships between five morphological parameters and crater diameter, excluding irregularity and roughness. Furthermore, the transitional crater diameters from simple to complex crater morphology were determined for the Copernican and Eratosthenian, approximately 13 km and 15 km, respectively. These results suggest systematic differences in the lunar regolith in different stratigraphic ages. For impact craters of the same diameter, as crater age increases, irregularity tends to be greater, while crater depth, wall width, wall height, rim height, volume, roughness, and rock abundance tend to be smaller. Therefore, in cases where the diameter is determined, the actual values of morphological parameters and rock abundance can be used to constrain the stratigraphic age information of craters of an unknown age.

1. Introduction

Impact craters are the most typical geomorphic units and fundamental landform features on the Moon. Impact craters document the exogenic dynamic evolutionary history of the Moon, since the lunar surface has been continuously exposed since the formation of the Moon’s crust. Previous studies have established the relationship between crater-size frequency distribution and absolute model age [1,2,3,4,5]. Additionally, it has been observed that impact craters undergo degradation over time, with older craters experiencing more significant degradation and morphological changes [6,7,8,9,10]. The absolute model age and degradation complement each other, providing better constraints on lunar geological evolution. Therefore, studying the morphology of impact craters can offer insights into their morphological changes over time.
In stratigraphic studies, Wilhelms et al. (1987) [11] divided the moon time scale into five periods based on the principle of stratigraphic system using impact ejecta and volcanic deposits: Pre-Nectarian period, Nectarian period, Imbrian period, Eratosthenian period, and Copernican period. Guo et al. (2023) [12] divided the moon time scale into six periods based on changes in both endogenic and exogenic dynamic forces and impact events: Magma-Oceanian period, Aitkenian period, Nectarian period, Imbrian period, Eratosthenian period, and Copernican period. Regardless of the classification scheme used, the stratigraphic age divisions after the Nectarian period are consistent. The age boundaries for these periods are as follows: Nectarian period (3.92–3.85 Ga), Imbrian period (3.85–3.16 Ga), Eratosthenian period (3.16–0.8 Ga), and Copernican period (0.8 Ga–present). The Imbrian period is further subdivided into the Early Imbrian epoch (3.85–3.8 Ga) and Late Imbrian epoch (3.8–3.16 Ga). The impact flux rate was high in approximately 3.85–3.95 Ga, leading to rapid obliteration and severe degradation of impact craters [7]. The impact flux after ~3.85 Ga seems to have drastically decreased [6,13]. Impact craters are more likely to be well-preserved thereafter [7]. Therefore, impact craters formed since around 3.85 Ga, including those from the Imbrian period and onward, may have a better correlation between their morphology and stratigraphic age.
The morphology of impact craters changes over time due to subsequent geological activities, such as subsequent impact events [7,10,14,15,16], moonquakes [10,15,17], and space weathering [10]. The effects of subsequent impact events on impact craters manifest in three aspects. Firstly, subsequent impacts can directly impact existing craters, leading to their disappearance or degradation [14]. Secondly, the seismic shaking from nearby impacts can induce mass wasting of existing craters [10,14,15]. The downslope movement of material can directly cause the degradation of crater terrace, wall collapse, and infilling of the impact crater. Thirdly, ejecta from subsequent impacts can directly overlay or infill craters, causing degradation in their morphology [7,10]. Moonquakes also affect impact craters by inducing fragmentation and slope failure through their seismic shaking [10,15]. Previous studies suggest that the impact of a single moonquake on crater morphology might be limited, but the cumulative effects of multiple moonquakes can result in various forms of mass wasting, leading to crater degradation [16]. Space weathering affects impact craters through impact by meteorites and micrometeorites and irradiation by solar wind and cosmic rays, causing changes in the surficial regolith layer of the craters [10,18]. This process is known as maturation. If the surficial regolith layer experienced longer space weathering, it would be more mature. [18]. These combined effects manifest in changes to the crater rim, depth, walls, and floor. Figure 1 shows the morphological features of impact craters at different ages (Copernican, Eratosthenian, Early Imbrian, Late Imbrian) and different diameters (~8 km, ~17 km, ~30 km, ~45 km, ~95 km). The transition of impact craters from simple to complex morphology can be observed.
Qualitative studies classified impact craters into grades according to their degradation features (such as ray, radial ejecta, rim-crest, terracing and interior radial channels, rim texture, etc.) and inferred the relative stratigraphic age of impact craters [6,8,9,10]. Trang et al. (2015) [10] categorized 15 craters with diameters ranging from 4.7 to 22.1 km based on their degraded morphologies grade and established relationships with crater ages. However, such judgments require advanced experience. Hence, quantitative research is necessary.
Previous crater quantitative studies primarily focused on morphological parameters. Croft (1985) [19] studied 86 fresh craters with diameters ranging from 2.85 km to 150 km and identified power law relationships between crater depth, interior volume, and diameter. Kalynn et al. (2013) [20] analyzed 80 fresh craters with diameters of between 15 km and 167 km, investigating the power law relationships between crater depth, central peak height, and diameter. Scott (2013) [21] examined 174 well-preserved craters with diameters of from 3 km to 21 km, exploring power law relationships between crater depth, rim height, volume, and diameter. Sharpton (2014) [22] studied 21 fresh craters with diameters ranging from 2.2 km to 45 km, focusing on the power law relationship between rim height and diameter. Osinski et al. (2018) [23] analyzed 20 well-preserved craters with diameters ranging from 15 km to 42 km and found power law relationships between depth, crater floor diameter, wall width, rim height, and diameter. Agarwal et al. (2019) [24] investigated 245 craters with diameters ranging from 180 m to 20 km, studying the relationships between crater diameter, wall slope, and diameter. Wang et al. (2022) [25] studied 52 fresh complex craters with diameters of between 21 km and 316 km, researching the power law relationships between interior volume, central peak height, and diameter. Sun et al. (2023) [26] conducted a study on 15,135 craters with diameters ranging from 5 km to 20 km, examining depth, rim height, bidirectional slope, and rock abundance. To summarize, crater depth and diameter are the two most commonly used morphological parameters. Additionally, previous studies have utilized other parameters such as volume, rim height, floor diameter, wall width, wall slope, and rock abundance, and so on. However, many previous studies have primarily focused on fresh craters, mainly from the Copernican and Eratosthenian periods, without distinguishing between these two periods.
Previous qualitative studies on crater morphology required a high level of expertise to assess the crater degradation and integrate it with stratigraphic ages. Quantitative studies have not combined crater morphological parameters with stratigraphic ages, and most of these studies have focused on fresh or well-preserved craters. To better understand the morphological evolution of impact craters and to investigate the relationship between lunar crater morphological parameters and different stratigraphic ages, 432 impact craters were analyzed from the Lunar and Planetary Institute lunar crater database [27] dating back to the Early Imbrian epoch. Using high-resolution imagery data, quantitative analyses were conducted on seven morphological parameters (crater depth, irregularity, wall width, wall height, rim height, volume, roughness) and rock abundance. We compared the morphological differences of impact craters at different stratigraphic ages, aiming to provide scientific references for determining the relative stratigraphic ages of the impact craters of unknown age and enhance our understanding of crater degradation process.

2. Data and Methods

2.1. Data

2.1.1. Impact Crater Data

The Lunar Impact Crater Database [27] (2015 version; https://www.lpi.usra.edu/lunar/surface/, accessed on 1 April 2023) from LPI contains 497 impact craters with stratigraphic ages since the Imbrian period. In this study, we first examined the morphology of each crater in the database, and craters heavily affected by subsequent impacts (e.g., craters extending beyond the rim edge, overlapping craters) were excluded. Ultimately, 432 impact craters distributed across the lunar surface were analyzed. Among them, 76 craters were classified as Copernican, 124 craters as Eratosthenian, 144 craters as Late Imbrian, and 88 craters as Early Imbrian, distributed across the lunar surface. Figure 2 shows the distribution and stratigraphic ages of the impact craters employed in this study.

2.1.2. Topographic Data

The Global Lunar LOLA DEM was used in this study, and it was downloaded from the USGS Astrogeology Science Center Node. The LOLA DEM covers latitudes within 90°N/S and has a spatial resolution of ~118 m/pixel [28]. Additionally, the study utilized the global maximum slope map generated by SELENE and LOLA merged DEM (SLDEM2015), which has a spatial resolution of approximately 59 m/pixel [29].
Based on the binned Diviner channel 6–8 radiance data, Bandfield et al. (2011) [30] obtained global rock abundance (RA) data by calculating the thermophysical properties of rocks (≥1 m). Bandfield et al. (2016) [31] improved the algorithms with local slopes considered. Rock abundance data cover latitudes between 80°N/S with a spatial resolution of 128 pixels/degree.

2.2. Method

Accurately identifying the boundary between the impact crater rim and floor is of great significance in the quantitative analysis of impact craters. In our study, we employed a manual visual identification method using WAC images, LOLA DEM, and SLDEM slope data.
Single or a few parameters are insufficient to comprehensively describe the morphology of impact craters, and each parameter may vary to different extents at different stratigraphic ages. In this study, 7 morphological parameters including crater depth, irregularity, wall width, wall height, rim height, volume, roughness, as well as rock abundance were utilized to constrain the crater morphology, aiming to determine their relationships with the stratigraphic ages.
Due to the significant variations in crater sizes at different stratigraphic ages, the five morphological parameters including crater depth, wall width, wall height, rim height, and volume were normalized.

2.2.1. Determining the Boundaries of Impact Craters

When interpreting the boundaries of impact crater rim and floor, especially for complex craters, the identification of crater floor boundaries can be challenging due to collapse effects [7]. The manual visual identification method relies on a detailed analysis of the morphological features of impact craters to identify the crater rim and floor. WAC images provide high-resolution surface features of the impact craters, enabling observations of both the overall morphology and finer details. DEM data offer precise elevation information for the crater region, while Slope data provide topographic variations across the crater area.
The crater rim is defined as the highest edge of the impact crater. By combining WAC images with DEM, the crater rim can be accurately identified. The crater floor typically manifests as a relatively flat area, further validated by the slope data. Analyzing the slope map allows us to identify the transition from the flat area of the crater floor to the steep area of the crater wall, marking the boundary of the crater floor. Therefore, by integrating WAC images, DEM data, and SLDEM slope data, the position of the crater floor was determined accurately and precisely.

2.2.2. Crater Diameter and Depth

Previous researchers often used the radius of an equi-areal circle at the crater rim as the radius of the impact crater [32,33], which is reasonable for nearly circular craters. However, this estimation method is not suitable for irregular craters, such as elliptical impact craters. In this study, using WAC image data, we plotted the distances from each point on the crater rim to the centroid of the crater and used these distances as radii for the points. Figure 3 illustrates a circular crater and an elliptical impact crater with radial lines emitted from the centroid of each crater to each point on each crater rim. Finally, we calculated the mean of all radii to define the radius of the impact crater. Depending on the morphological characteristics of the impact craters, the minimum number of lines measured was over 80, while the maximum exceeded 4000.
To improve the accuracy of measuring the impact crater depth, this study excluded elevation data affected by later impacts or crater floor fractures when calculating the difference between the average elevation of the excluded crater floor region, and the average elevation of the crater rim was then calculated as the impact crater depth (Figure 4).

2.2.3. Crater Wall Width and Wall Height

Similarly, previous studies commonly used an equidistant circle to determine the diameter of the impact crater floor and then subtracted this from the rim diameter to calculate the crater wall width [23]. However, the crater floor shape is often irregular and polygonal. Therefore, we employed a method similar to calculating the diameter to determine the crater wall width. The boundaries of the crater rim and floor were manually delineated through visual interpretation. These two boundaries collectively define the upper and lower limits of the crater wall. Using DEM data, the elevation values of these boundaries were extracted, and their average elevations were calculated. The difference between the average elevation of the rim boundary and that of the floor boundary represents the crater wall height.

2.2.4. Crater Rim Height

The crater rim height refers to the elevation difference between the crater rim and the pre-impact surface. For the calculation of rim height, the four-, six- and eight-profile methods are mostly adopted [23,33,34,35]. Elevation values within a certain range of the impact crater (e.g., 2.5 crater radius and 3 crater radius) are viewed as trends from the pre-impact surface to rim height [22,36].
Due to the complexity of the terrain, the crater rim height varies in different directions. Therefore, the rim height obtained using the above methods may not be very accurate. In this study, the “Trend” tool was utilized to simulate the pre-impact surface and obtain the rim height by fitting a trend surface.
Taking the Sharonov crater in the Eratosthenian period (173.10°E, 12.34°N, D = 76.01 km) as an example (see Figure 5), the following steps were followed: First, a distance range of 4R from the center of the crater was taken as the buffer zone. Secondly, an outer rectangle was created to clip the required data. Thirdly, the “Trend” tool was used to fit the pre-impact surface. Fourth, the elevation of the crater rim was subtracted from the corresponding elevation of the fitted surface, and the average difference was taken as the rim height.

2.2.5. Crater Irregularity Index

Irregularity is used to calculate the degree of irregularity of a crater rim and is obtained from the ratio of the crater perimeter to the area of the crater rim. The irregular index was calculated by Agarwal et al. (2019) [24]:
I r = p / ( 2 π A )
where p is the perimeter, and A is the area of the crater rim. The larger the value of Ir, the more irregular the impact crater becomes.

2.2.6. Crater Volume

Crop every crater from the LOLA DEM 118 m gridded topography. Volume can be directly calculated using image processing tools. This study employed the piling method to calculate the volume of impact craters [25].

2.2.7. Crater Roughness

Bidirectional slope is widely used in geological and geomorphological research to describe the variations in terrain relative to a specific horizontal scale, also known as a baseline [37]. It is a quantitative method for characterizing both the rate of change of roughness with spatial scale and the amplitude of roughness [38]. The calculation of roughness typically depends on the selected baseline and the spatial resolution of the terrain elevation data. This method is applied across various terrain scales, from submillimeter to kilometer scales [26,37,38,39,40]. The detailed calculation method can be found in Cai and Fa (2020) [38].
The choice of different baseline has an impact on capturing the different features of the terrain. A shorter baseline is beneficial for capturing the details and local characteristics of the terrain but is also more susceptible to noise and local variations in the terrain. Conversely, a longer baseline can better smooth out the terrain, reducing the impact of local variations, but may lead to a loss of some detailed information in the terrain. Therefore, in this study based on 118 m/pixel LOLA DEM data, we employed a baseline ranging from 168 m to 5340 m for calculating the bidirectional slope.

2.2.8. Mean Slope and Rock Abundance of the Crater Wall

The crater wall is defined as the transitional area between the crater rim and the crater floor. This region is described by a circular area bounded by the identified crater rim and crater floor. In our study, we used this identified crater wall area to extract data from the SLDEM slope [29] and Rock Abundance (RA) [30] image datasets. Consequently, we obtained slope and rock abundance image data for the crater wall. By calculating the average values from these datasets, the average slope and average rock abundance of the crater wall was obtained.

3. Results

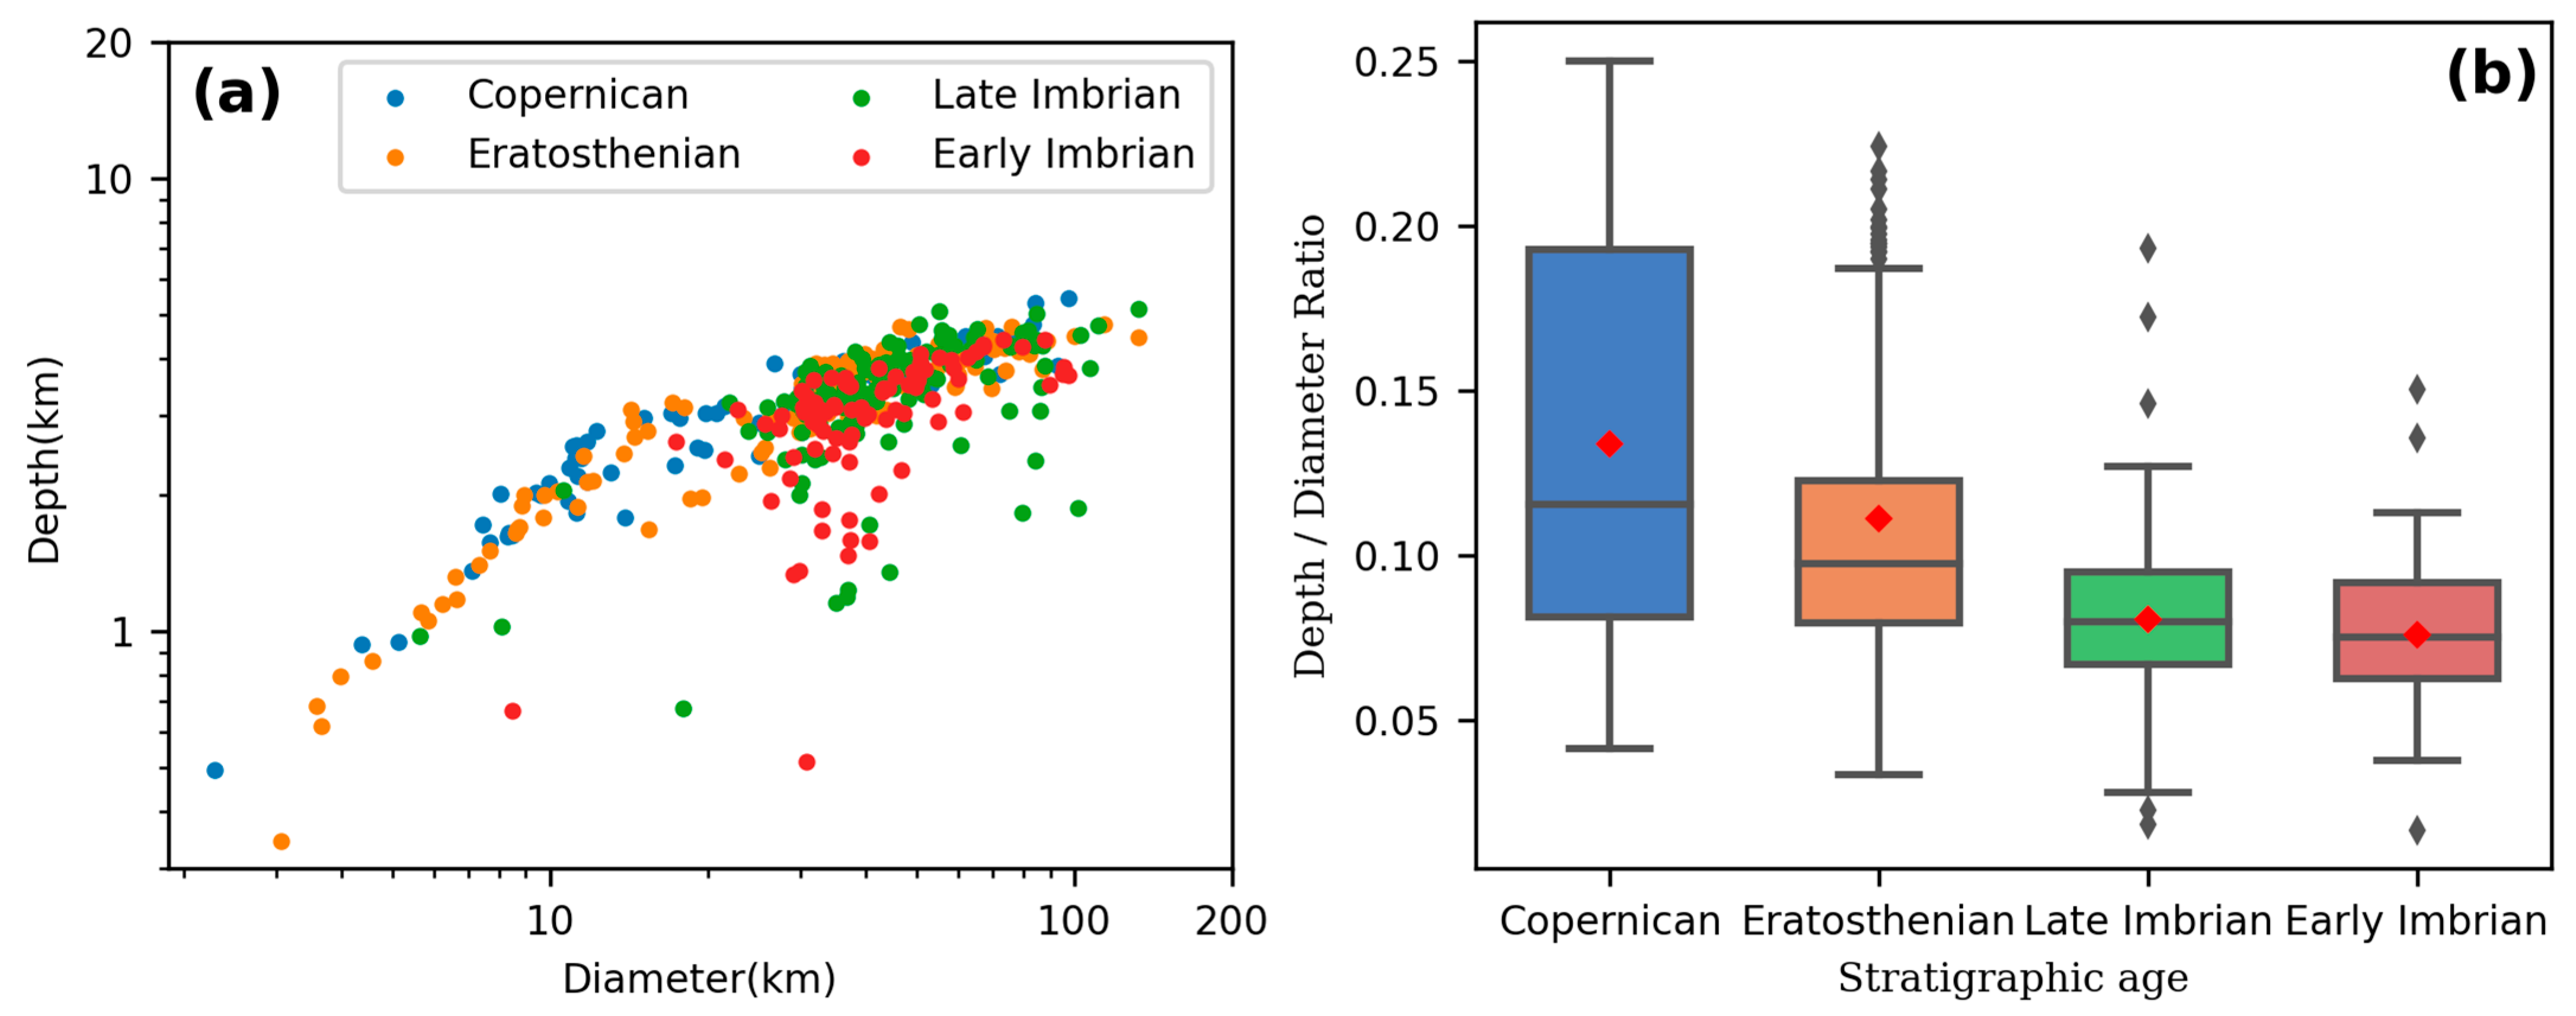
3.1. Crater Diameter and Depth

Figure 6 shows that the crater depth increases with diameter, but the trend is uneven. There is a rapid increase followed by a slower trend, with a turning point. A power law equation was used to fit the relationship between crater depth and diameter, and by searching for the optimal fit, the turning point values were obtained, which were ~13 km for the Copernican period and ~15 km for the Eratosthenian period. Table 1 summarizes the power law fitting relationships between crater depth and diameter for impact craters of different stratigraphic ages.
From Figure 6 and Table 1, it can be concluded that: (1) With the increase in the age of impact craters, the correlation between depth and diameter decreases. (2) As the stratigraphic age increases, the ratio of depth to diameter (d/D) tends to decrease.

3.2. Crater Wall Width and Wall Height

The crater wall width increases with increasing diameter (Figure 7a), showing a high correlation (Table 2). The crater wall height also increases with diameter, with significant differences in slopes at different intervals, showing a higher slope followed by a lower one with increasing diameter. By fitting the relationship between wall height and diameter using a power law equation, the turning points for Copernican and Eratosthenian are found to be ~13 km and ~15 km, respectively (Figure 7b).
Figure 7c,d displays the ratio of crater wall width to crater radius and the ratio of crater wall height to crater depth. For craters without a floor (i.e., bowl-shaped craters), both the ratio of crater wall width to radius and the ratio of crater wall height to depth are equal to 1. Table 2 lists the ratios of crater wall width to radius and crater wall height to depth. The ratio of crater wall width to crater radius shows a decreasing trend from the Copernican to the Early Imbrian period. The ratio of crater wall height to crater depth decreases from the Copernican to the Late Imbrian, with a slight increase in the Early Imbrian compared to the Late Imbrian (Figure 7d, Table 2).

3.3. Crater Rim Height

The crater rim height increases with the crater diameter, with noticeable variations in slope, showing an initial increase followed by a decrease in slope (Figure 8). Using a power law equation to fit the relationship between rim height and diameter, the turning points for the Copernican and Eratosthenian were determined to be ~13 km and ~15 km, respectively.
The power law relationships for rim height are listed in Table 3. As the diameter of the impact crater increases, the crater rim height also increases. By calculating the ratio of crater rim height to diameter for 21 fresh impact craters provided by Sharpton (2014) [22], a range of 0.0193 to 0.0477 was obtained.

3.4. Crater Irregularity Index

Figure 9 illustrates the density distribution and kernel density estimate of irregularities for the impact craters of different stratigraphic ages. The peak irregularity density is 1.0093 for the Copernican craters, 1.0124 for the Eratosthenian craters, 1.0209 for the Late Imbrian craters, and 1.0243 for the Early Imbrian craters. This suggests that its irregularity tends to increase as the stratigraphic age of the crater increases.

3.5. Crater Volume

The volume of impact craters increases with diameter, showing a positive correlation with size (Figure 10a, Table 4). Table 4 provides the best-fitting equations for the relationship between crater volume and diameter. Figure 10b illustrates that as the age of the impact crater increases, its volume tends to decrease.

3.6. Crater Roughness

Based on the 118 m/pixel LOLA DEM, we calculated the bidirectional slopes at baseline distances ranging from 167 m to 5340 m for different geological ages. Figure 11a shows the median bidirectional slope at different baselines across different stratigraphic ages. As the baseline increases, the rate of decrease in the bidirectional slope for a younger stratigraphic age is greater than for older ones [37]. At the 167 m baseline, the median bidirectional slope of the Copernican craters is 21.15 ± 7.52, for the Eratosthenian is 17.66 ± 5.99, for the Late Imbrian is 14.09 ± 4.44, and for the Early Imbrian is 13.33 ± 3.89. This indicates that the impact craters of a younger stratigraphic age have a rougher morphology [42,43]. Figure 11b calculates the relationship of the crater diameter and median bidirectional slope of impact craters at a 167 m baseline. For the Copernican and Eratosthenian, the bidirectional slope of simple impact craters shows an increasing trend [26]. For the Copernican, it rises from 25.26 to 33.15, and for the Eratosthenian, it increases from 22 to 30.33. The bidirectional slope of complex impact craters shows a decreasing trend across different stratigraphic ages.

3.7. Mean Slope and Rock Abundance of the Crater Wall

We calculated the average slopes and rock abundance of the impact crater walls. Figure 12a,b show the distribution of the impact crater diameter, slope, and rock abundance for different stratigraphic ages, respectively. For Copernican, Eratosthenian, Late Imbrian, and Early Imbrian, the rock abundance values for these ages are 0.0303 ± 0.0398, 0.0165 ± 0.0254, 0.0043 ± 0.0030, and 0.0034 ± 0.0021, respectively. This indicates a decrease in rock abundance with increasing stratigraphic age.
Correlation analysis of rock abundance with diameter and crater wall slope reveals significant negative correlations with diameter and positive correlations with wall slope for younger stratigraphic ages. The correlation coefficients for Copernican-aged craters are −0.393 ** and 0.477 ** respectively, while for Eratosthenian-aged craters, they are −0.568 ** and 0.533 **. No significant correlations were found for Imbrian-aged craters.

4. Discussion

4.1. Transition Diameter of Simple-to-Complex Crater Morphology

We conducted power law fitting for the relationships between depth, wall height, rim height, and diameter, respectively (Figure 6, Figure 7 and Figure 8), and found turning points in all cases. These turning points represent the transition of the impact crater morphology from simple to complex, and the corresponding diameter is the transitional diameter [23,34]. Previous studies obtained the transitional diameters through a single morphological parameter. Pike (1974) [44] identified the transitional diameter range in the depth-to-diameter ratio based on the impact craters with diameters of between 10 km and 15 km. Wu et al. (2022) [45] identified the transitional diameter at approximately 11 km in diameter based on craters with a depth-to-diameter ratio of ~0.2. Croft (1978) [19] found the transitional diameter to be 13 km through the relationship between volume and diameter. Sharpton (2014) [22] obtained a transition diameter of 17 km by calculating the rim height vs. diameter relationship. Other researchers have provided transitional diameter ranges based on visual interpretation and numerical simulations. Chandnani et al. (2019) [34] investigated changes in crater morphology and obtained transitional diameters ranging from 15 km to 20 km. Wünnemann and Ivanov (2003) [46] determined the transitional diameter to be around 15 km using 2D numerical modeling of impact cratering. In summary, the transitional diameter range of impact craters is estimated to be between 10 km and 20 km. We found a transitional diameter of approximately 13 km to 15 km for craters of Copernican and Eratosthenian, consistent with previous research findings. However, the transitional diameter of impact craters in the Imbrian period could not be determined due to the limited number of preserved simple craters, since it is challenging to obtain accurate values through data fitting methods using a few craters.
To further investigate the relationship between the transitional diameters and stratigraphic ages, this study regarded the transitional diameter for each period as an approximate value. Through multi-parameter fitting, it was discovered that transitional diameters vary among different periods, with an approximate value of ~13 km for the Copernican period and ~15 km for the Eratosthenian period.
Previous studies have found that the transitional diameter is mainly influenced by gravity and target properties [23,32,34,47]. For the Moon, the gravity acceleration during the Copernican and Eratosthenian periods was consistent. Therefore, the difference in the transitional diameters of impact craters between the Copernican and Eratosthenian should be attributed to differences in target properties. The Copernican and Eratosthenian periods represent the later stages of lunar evolution, characterized by a prolonged history of impacting. These impacts occurred on the megaregolith that formed during the Late Heavy Bombardment (LHB) [48]. In the process of lithification on Earth, compaction occurs when layers of materials accumulate due to gravity, reducing the porosity between particles in the lower layers, which is a process referred to as compaction. This compaction is a physical process solely influenced by gravity. Similarly, we believe that on the Moon, the lunar material at the base of the megaregolith also undergoes compaction due to gravity. The deeper the depth, the higher the degree of consolidation. Compared to the transition diameters of lunar maria and highlands, previous studies found that the transition diameter of lunar maria is smaller than that of highlands [23,26,32]. They ascribed it to the overlapping of multiple phases of basaltic lava flows in the lunar maria, resulting in the formation of layered basalts. The layered structure leads to faster cavity collapse in the form of terraces [23,34]. Similarly, we suggest that layering may have contributed to the transitional diameter of Copernican impact craters being smaller than that of the Eratosthenian. The reasons are as follows. The Copernican period is approximately 2.36 Ga younger than the Eratosthenian period. During this time gap, new ejecta continuously accumulated on impact craters, increasing the thickness of the regolith layer. Additionally, the cumulative effect over time allowed for sufficient consolidation of the underlying regolith layers, resulting in the formation of multiple layers of regolith. And the layering may account for the smaller transitional diameter of the Copernican period.

4.2. The Evolution of Impact Crater Morphology over Time

4.2.1. Different Thermal States at Different Stratigraphic Ages

The Imbrian period was characterized by active endogenic processes, during which extensive basaltic lavas erupted onto the lunar surface through magma channels [49]. Basaltic magma intruded upward into the lunar crust. Some of the magma formed magma reservoirs beneath the crust, some intruded into the crust along fractures but did not erupt, while a small portion of it erupted onto the lunar surface through ascending channels, resulting in the formation of lunar mare basalts. The influence of molten magma extends far beyond the actual eruption area. Within the range affected by magma, the lunar crust experiences elevated thermal stress. According to the 1:2,500,000-scale geological map of the global Moon [50], it is calculated that the area covered by mare basalts in the Imbrian period constitutes approximately 9.34% of the total lunar surface. This indicates that at least 9.34% of the lunar surface during the Imbrian period remained under relatively high thermal stress.
The relatively higher thermal stress results in higher viscosity of the lunar crust material compared with the cold one. Hotter thermal states weaken target materials by reducing their yield strength and promoting the formation of impact melt, leading to a decrease in viscosity [46,51,52,53,54]. Wünnemann and Ivanov (2003) [46] demonstrated through numerical simulations of the relationship between crater depth and diameter that increased temperature reduces the shear strength, making material flow more easily and leading to deposition within the crater. Hall et al. (1981) [52] found that in regions with abnormally high near-surface temperatures, low effective viscosity, and a thin lithosphere, crater relaxation is significantly accelerated. Wichman and Schultz (1995) [53] noted that elevated temperatures result in increased rock temperatures, decreased viscosity, and lower viscosity of the impact melt, which could lead to relaxation and consequently accelerate shallowing due to laccolith injection. Jozwiak et al. (2012) [54] suggested that shallow crater floors may result from viscous relaxation. Ding et al. (2021) [51] found, through studying craters with diameters ranging from 100 km to 650 km, that the thermal contraction of the lithosphere affects crater morphology, with colder targets freezing the crustal structure of impact basins in the lithosphere more quickly. Therefore, it could reasonably be inferred that when an impactor hits a relatively hot, plastic surface, the same amount of impact energy results in a shallower excavation depth and a smaller volume of excavated crater compared to the situation of hitting a colder, more rigid surface [51]. When an impactor hits a relatively hot, plastic surface, the same amount of impact energy results in a shallower excavation depth and a smaller volume of excavated crater compared to the situation of hitting a colder, more rigid surface [51].
The interior of the Moon gradually cooled down over time. During the Eratosthenian period, only a small amount of basaltic lava erupted, while in the Copernican period, which represents the latest stage of lunar evolution, there are no evident indications of internal geological processes (no Copernican lunar mare or cryptomare has been found on the lunar surface). The lunar surface mainly undergoes exogenic processes, primarily impacting. At these stages, the lunar surface had completely cooled down and was completely solidified. Compared with the hot surface, with the same energy, the impactor excavated more deeply and more materials when hitting a cooled, solidified surface.

4.2.2. Different Target Properties at Different Stratigraphic Ages

With the accumulation of impact craters, the target characteristics (porosity) also change continuously, which affects the sizes of subsequent impact craters [55]. Impacting is a major contributor to the generation of porosity. Impacting is thought to raise the porosity of the near-surface area by causing brecciation [56]. The tensile and shear stresses generated by impacting can cause fracturing, shattering, and faulting of the crust around the crater, extending several crater radii beyond the crater rim and to a depth greater than 10 km into the lunar crust [55,57,58]. The Moon has been continuously subjected to external impacts. The older the surface is, the more impacts that it may have suffered. Therefore, we can infer that the porosity of the lunar crust increased from the Imbrian period to the Copernican period. Additionally, through simulation experiments, many researchers have found that impacting high-porosity targets can result in unusually deep craters, as most of the impact energy is used to break up the porous spaces, leading to compaction of the target materials and the formation of deeper craters [19,58,59,60]. This may be one of the reasons why craters in the Imbrian period are shallower and smaller in crater depth and volume compared to those in the Eratosthenian and Copernican periods.

4.2.3. The Crater Degradation at Different Stratigraphic Ages

Impact craters are affected by subsequent impact events, causing varying degrees of inward and outward collapse at different parts of the crater rim, leading to increased irregularity of the crater and reduced rim height [35,61] (Figure 8 and Figure 9).
According to previous studies, the degradation of impact craters is mainly influenced by processes such as self-material slumping and infilling by ejecta from subsequent impact events. During weathering processes, material from the crater wall collapses and slides toward the crater floor, spreading over a larger area [7,62]. The infilling of material leads to a decrease in crater depth, wall width, wall height, and volume (Figure 6, Figure 7 and Figure 10).
We found that the ratio of wall height to crater depth decreased from the Copernican to the Late Imbrian (Figure 7). However, compared to the Late Imbrian, the ratio of rim height to crater depth increased in the Early Imbrian. We believe that it is caused by the different contributions of collapsed rim material to wall height and crater depth. After the formation of the impact crater, the rim material is affected by gravity and undergoes collapse, sliding down to the crater floor. This process is known as mass wasting [15,63].
In the early stages after the formation of an impact crater, the relatively steep slope causes the rim material to slide down at a relatively fast rate, accumulating at the edge of the crater floor. The distribution of the slide rim materials on the crater floor is uneven, with more accumulation towards the edges, leading to a greater reduction in wall height compared to crater depth. Xiao et al. (2013) [15] observed that mass wasting occurs within a slope range of approximately 25–35°, with weaker mass wasting associated with smaller slope angles. The data in this study indicate that the slope gradually increases from the Early Imbrian to the Copernican, implying a gradual enhancement of the mass wasting process from the Early Imbrian to the Copernican (Table 5). In other words, the impact craters from the Imbrian period have undergone a longer period of evolution compared to those from the Copernican period. As a result, the current morphology (crater wall slope) of Imbrian craters is smaller than that of Copernican craters. Therefore, Copernican craters are more susceptible to mass wasting than Imbrian craters. With the accumulation of time, the cumulative decrease in wall height exceeds that of crater depth, explaining the gradual decrease in the ratio of wall height to crater depth from the Copernican to the Late Imbrian.
Furthermore, during the Early Imbrian, the maximum value of the crater wall slope is 25.36° (mean value is 17.52°), indicating that mass wasting may have ceased during this epoch. Therefore, mass wasting is not the primary factor driving the increase in the ratio of crater wall height to depth during this epoch. Instead, external ejecta become the main factor. The rate of change in crater depth is greater than that of crater wall height, leading to an increase in the ratio of crater wall height to depth.
From the Imbrian period to the Copernican period, the roughness of impact craters and the rock abundance of crater walls gradually increased (Figure 11 and Figure 12). This indicates that the crater walls during the Imbrian period had lower rock abundance compared to those in the Copernican period. The reasons are as follows: (1) Subsequent impact events’ ejecta cover rugged terrains, resulting in reduced roughness [7,43]. (2) Exposed boulders on the surface undergo rapid destruction due to thermal fatigue from diurnal temperature cycling and micrometeorite impacts, leading to gradual smoothing of the terrain [64,65,66,67]. Basilevsky et al. (2013) [66] estimated a half-life of 40–80 Myr for rocks with a diameter ≥ 2 m, while Vanga et al. (2022) [67] demonstrated that the half-life of meter-scale surface rocks is 80 ± 20 Myr. This implies that rock fragments with a diameter of 1 m disappear approximately 150 Myr. (3) Mass wasting of crater walls covers rugged terrains.

5. Conclusions

The study systematically and quantitatively analyzed seven morphological parameters of 432 known impact craters from the Copernican, Eratosthenian, and Imbrian periods, including crater depth, rim height, volume, wall width, wall height, irregularity, and roughness, as well as rock abundance. The following conclusions were drawn:
(1)
Based on power law fitting for the relationships between depth, wall height, rim height, and diameter, transition diameters were determined for craters from the Copernican and Eratosthenian periods. Specifically, the craters from the Copernican period had an approximate transition diameter of 13 km, while those from the Eratosthenian period had a diameter of around 15 km. These systematic differences are attributed to the stratification of the target regolith.
(2)
Impact craters of the same diameter tend to have greater irregularity with older age, while crater depth, rim height, volume, wall width, wall height, roughness, and rock abundance decrease. Therefore, using the real values of crater morphological parameters and rock abundance may better constrain the stratigraphic ages of impact craters of unknown age.

Author Contributions

Conceptualization, K.Z. and J.L. (Jianzhong Liu); methodology, K.Z.; formal analysis, K.Z., J.L. (Jianzhong Liu), L.Z., Y.G. and J.Z.; investigation, K.Z.; data curation, K.Z., S.Z. and H.Q.; writing—original draft preparation, K.Z.; writing—review and editing, K.Z., L.Z., Z.Y., J.Z. and J.L. (Jingwen Liu); funding acquisition, J.L. (Jianzhong Liu). All authors have read and agreed to the published version of the manuscript.

Funding

This work was supported by the National Key Research and Development Program of China (Grant No. 2022YFF0503100), the Strategic Priority Research Program of the Chinese Academy of Sciences (Grant No. XDB 41020000), the Key Research Program of the Chinese Academy of Sciences (Grant No. KGFZD-145-23-15), Compilation of Chinese Regional Geological Chronicles and Series of Maps (Grant No. DD20221645). Guizhou Provincial Science and Technology Projects [QKHJC-ZK(2023)-478].

Data Availability Statement

The LOLA DEM, LROC WAC SLDEM2015, and Diviner rock abundance data can be accessed through the Planetary Data System Geosciences Node (https://pds-geosciences.wustl.edu/dataserv/moon.html, accessed on 1 June 2023). The stratigraphic ages of craters used in this work can be accessed via the 2015 lunar crater database (https://www.lpi.usra.edu/lunar/surface/, accessed on 1 June 2023). The crater morphology parameter data in this study are available upon request from the corresponding author.

Acknowledgments

We express our gratitude to Kai Zhu and Caihong Gao for their invaluable reviews and insightful disicussions on the manuscript. We also appreciate Dijun Guo for his assistance with calculating roughness.

Conflicts of Interest

The authors declare no conflicts of interest.

References

  1. Neukum, G. Meteorite Bombardment and Dating of Planetary Surfaces. Habilitation Thesis, University München, Munich, Germany, 1984; 186p. [Google Scholar]
  2. Neukum, G.; Ivanov, B.A.; Hartmann, W.K. Cratering Records in the Inner Solar System in Relation to the Lunar Reference System. Space Sci. Rev. 2001, 96, 55–86. [Google Scholar] [CrossRef]
  3. Marchi, S.; Mottola, S.; Cremonese, G.; Massironi, M.; Martellato, E. A new chronology for the moon and mercury. Astron. J. 2009, 137, 4936. [Google Scholar] [CrossRef]
  4. Robbins, S.J. New crater calibrations for the lunar crater-age chronology. Earth Planet. Sci. Lett. 2014, 403, 188–198. [Google Scholar] [CrossRef]
  5. Yue, Z.; Di, K.; Wan, W.; Liu, Z.; Gou, S.; Liu, B.; Peng, M.; Wang, Y.; Jia, M.; Liu, J.; et al. Updated lunar cratering chronology model with the radiometric age of Chang’e-5 samples. Nat. Astron. 2022, 6, 541–545. [Google Scholar] [CrossRef]
  6. Pohn, H.A.; Offield, T.W. Lunar Crater Morphology and Relative Age Determination of Lunar Geologic Units—Part 1, Classification; Part 2, Applications; U.S. Geological Survey: Reston, VA, USA, 1969.
  7. Head, J.W. Processes of lunar crater degradation: Changes in style with geologic time. Moon 1975, 12, 299–329. [Google Scholar] [CrossRef]
  8. McGill, G.E. Morphology of lunar craters: A test of lunar erosional models. Icarus 1974, 21, 437–447. [Google Scholar] [CrossRef]
  9. Wood, C.A.; Head, J.W.; Cintala, M.J. Crater degradation on Mercury and the moon-Clues to surface evolution. Lunar Planet. Sci. Conf. Proc. 1977, 8, 3503–3520. [Google Scholar]
  10. Trang, D.; Gillis-Davis, J.J.; Boyce, J.M. Absolute model ages from lunar crater morphology. J. Geophys. Res. Planets 2015, 120, 725–738. [Google Scholar] [CrossRef]
  11. Wilhelms, D.E.; McCauley, J.F.; Trask, N.J. The Geologic History of the Moon; U.S. Government Printing Office: Washington, DC, USA, 1987.
  12. Guo, D.; Liu, J.; Head, J.W.; Zhang, F.; Ling, Z.; Chen, S.; Chen, J.; Ding, X.; Ji, J.; Ouyang, Z. A lunar time scale from the perspective of the Moon’s dynamic evolution. Sci. China Earth Sci. 2023, 67, 234–251. [Google Scholar] [CrossRef]
  13. Zellner, N.E.B. Lunar Impact Glasses: Probing the Moon’s Surface and Constraining its Impact History. J. Geophys. Res. Planets 2019, 124, 2686–2702. [Google Scholar] [CrossRef]
  14. Riedel, C.; Minton, D.A.; Michael, G.; Orgel, C.; van der Bogert, C.H.; Hiesinger, H. Degradation of small simple and large complex lunar craters: Not a simple scale dependence. J. Geophys. Res. Planets 2020, 125, e2019JE006273. [Google Scholar] [CrossRef]
  15. Xiao, Z.; Zeng, Z.; Ding, N.; Molaro, J. Mass wasting features on the Moon—how active is the lunar surface? Earth Planet. Sci. Lett. 2013, 376, 1–11. [Google Scholar] [CrossRef]
  16. Ikeda, A.; Kumagai, H.; Morota, T. Topographic degradation processes of lunar crater walls inferred from boulder falls. J. Geophys. Res. Planets 2000, 127, e2021JE007176. [Google Scholar] [CrossRef]
  17. Titley, S.R. Seismic Energy as an Agent of Morphologic Modification on the Moon; Astrogeologic Studies Annual Progress Report; U.S. Geological Survey: Reston, VA, USA, 1966; pp. 87–103.
  18. Denevi, B.W.; Noble, S.K.; Christoffersen, R.; Thompson, M.S.; Glotch, T.D.; Blewett, D.T.; Garrick-Bethell, I.; Gillis-Davis, J.J.; Greenhagen, B.T.; Hendrix, A.R.; et al. Space Weathering at The Moon. Rev. Mineral. Geochem. 2023, 89, 611–650. [Google Scholar] [CrossRef]
  19. Croft, S.K. Lunar crater volumes: Interpretation by model of impact cratering and upper crustal structure. In Proceedings of the Lunar and Planetary Science Conference 9th, Houston, TX, USA, 13–17 March 1978; pp. 3711–3733. [Google Scholar]
  20. Kalynn, J.; Johnson, C.L.; Osinski, G.R.; Barnouin, O. Topographic characterization of lunar complex craters. Geophys. Res. Lett. 2013, 40, 38–42. [Google Scholar] [CrossRef]
  21. Scott, R. Determining the volume of material excavated during a cratering event. Phys. Educ. 2013, 48, 512–519. [Google Scholar] [CrossRef]
  22. Sharpton, V.L. Outcrops on lunar crater rims: Implications for rim construction mechanisms, ejecta volumes and excavation depths. J. Geophys. Res. Planets 2014, 119, 154–168. [Google Scholar] [CrossRef]
  23. Osinski, G.R.; Silber, E.A.; Clayton, J.; Grieve, R.A.F.; Hansen, K.; Johnson, C.L.; Kalynn, J.; Tornabene, L.L. Transitional impact craters on the Moon: Insight into the effect of target lithology on the impact cratering process. Meteorit. Planet. Sci. 2018, 54, 573–591. [Google Scholar] [CrossRef]
  24. Agarwal, N.; Haridas, A.; Khanna, N.; Srivastava, P.; Jain, V. Study of morphology and degradation of lunar craters using Chandrayaan–1 data. Planet. Space Sci. 2019, 167, 42–53. [Google Scholar] [CrossRef]
  25. Wang, N.; Zhou, J.; Guo, L.; Somerville, I.; Li, S.; Wang, G.; Wang, P.; Liu, B. The transition from lunar complex crater to peak-ring basin: Constraints on the morphology and volume of central features. Geosystems Geoenvironment 2022, 1, 100014. [Google Scholar] [CrossRef]
  26. Sun, Q.; Fa, W.; Zhu, M.; Du, J. Morphological characteristics of impact craters with diameters of 5–20 km on the Moon. Icarus 2023, 404, 115688. [Google Scholar] [CrossRef]
  27. Losiak, A.; Wilhelms, D.E.; Byrne, C.J.; Thaisen, K.; Weider, S.Z.; Kohout, T.; O’Sulllivan, K.; Kring, D.A. A new lunar impact crater database. In Proceedings of the 40th Lunar and Planetary Science Conference, Houston, TX, USA, 23–27 March 2009; p. 1532. [Google Scholar]
  28. Smith, D.E.; Zuber, M.T.; Neumann, G.A.; Lemoine, F.G.; Mazarico, E.; Torrence, M.H.; McGarry, J.F.; Rowlands, D.D.; Head III, J.W.; Duxbury, T.H.; et al. Initial observations from the Lunar Orbiter Laser Altimeter (LOLA). Geophys. Res. Lett. 2010, 37, L18204. [Google Scholar] [CrossRef]
  29. Barker, M.K.; Mazarico, E.; Neumann, G.A.; Zuber, M.T.; Haruyama, J.; Smith, D.E. A new lunar digital elevation model from the lunar orbiter laser altimeter and SELENE terrain camera. Icarus 2016, 273, 346–355. [Google Scholar] [CrossRef]
  30. Bandfield, J.L.; Ghent, R.R.; Vasavada, A.R.; Paige, D.A.; Lawrence, S.J.; Robinson, M.S. Lunar surface rock abundance and regolith fines temperatures derived from LRO Diviner Radiometer data. J. Geophys. Res. 2011, 116, E00H02. [Google Scholar] [CrossRef]
  31. Bandfield, J.L.; Edwards, C.S.; Poston, M.J.; Klima, R.L. Lunar H2O/OH Distributions: Revised Infrared Spectra from Improved Thermal Corrections. In Proceedings of the 47th Lunar and Planetary Science Conference, Houston, TX, USA, 21–25 March 2016; p. 1594. [Google Scholar]
  32. Krüger, T.; Hergarten, S.; Kenkmann, T. Deriving Morphometric Parameters and the Simple-to-Complex Transition Diameter From a High-Resolution, Global Database of Fresh Lunar Impact Craters (D ≥ ~3 km). J. Geophys. Res. Planets 2018, 123, 2667–2690. [Google Scholar] [CrossRef]
  33. Hoover, R.; Robbins, S.; Hynek, B.; Hayne, P. Depth-to-diameter Ratios of Fresh Craters on the Moon and Implications for Surface Age Estimates. Planet. Sci. J. 2024, 5, 26. [Google Scholar] [CrossRef]
  34. Chandnani, M.; Herrick, R.R.; Kramer, G.Y. Geologic investigation of deep simple craters in the lunar simple-to-complex transition. J. Geophys. Res. Planets 2019, 124, 2482–2504. [Google Scholar] [CrossRef]
  35. Du, J.; Fa, W.; Wieczorek, M.A.; Xie, M.; Cai, Y.; Zhu, M.-H. Thickness of lunar mare basalts: New results based on modeling the degradation of partially buried craters. J. Geophys. Res. Planets 2019, 124, 2430–2459. [Google Scholar] [CrossRef]
  36. Sturm, S.; Kenkmann, T.; Hergarten, S. Ejecta thickness and structural rim uplift measurements of Martian impact craters: Implications for the rim formation of complex impact craters. J. Geophys. Res. Planets 2016, 121, 1026–1053. [Google Scholar] [CrossRef]
  37. Guo, D.; Fa, W.; Wu, B.; Li, Y.; Liu, Y. Millimeter- to decimeter-scale surface roughness of the Moon at the Chang’e-4 exploration region. Geophys. Res. Lett. 2021, 48, e2021GL094931. [Google Scholar] [CrossRef]
  38. Cai, Y.; Fa, W. Meter-scale topographic roughness of the Moon: The effect of small impact craters. J. Geophys. Res. Planets 2020, 125, e2020JE006429. [Google Scholar] [CrossRef]
  39. Helfenstein, P.; Shepard, M.K. Submillimeter-scale topography of the lunar regolith. Icarus 2019, 141, 107–131. [Google Scholar] [CrossRef]
  40. Rubanenko, L.; Schorghofer, N.; Greenhagen, B.T.; Paige, D.A. Equilibrium temperatures and directional emissivity of sunlit airless surfaces with applications to the Moon. J. Geophys. Res. Planets 2020, 125, e2020JE006377. [Google Scholar] [CrossRef]
  41. Hale, W.S.; Grieve, R.A.F. Volumetric analysis of complex lunar craters: Implications for basin ring formation. J. Geophys. Res. Solid Earth 1982, 87, A65–A76. [Google Scholar] [CrossRef]
  42. Wang, J.; Kreslavsky, M.A.; Liu, J.; Head, J.W.; Zhang, K.; Kolenkina, M.M.; Zhang, L. Quantitative characterization of impact crater materials on the Moon: Changes in topographic roughness and thermophysical properties with age. J. Geophys. Res. Planets 2020, 125, e2019JE006091. [Google Scholar] [CrossRef]
  43. Deutsch, A.N.; Head, J.W.; Neumann, G.A.; Kreslavsky, M.A.; Barker, M.K. Assessing the roughness properties of circumpolar Lunar craters: Implications for the timing of water-ice delivery to the Moon. Geophys. Res. Lett. 2020, 47, e2020GL087782. [Google Scholar] [CrossRef]
  44. Pike, R.J. Depth/diameter relations of fresh lunar craters: Revision from spacecraft data. Geophys. Res. Lett. 1974, 1, 291–294. [Google Scholar] [CrossRef]
  45. Wu, B.; Wang, Y.; Werner, S.C.; Prieur, N.C.; Xiao, Z. A global analysis of crater depth/diameter ratios on the Moon. Geophys. Res. Lett. 2022, 49, e2022GL100886. [Google Scholar] [CrossRef]
  46. Wünnemann, K.; Ivanov, B.A. Numerical modelling of the impact crater depth–diameter dependence in an acoustically fluidized target. Planet. Space Sci. 2003, 51, 831–845. [Google Scholar] [CrossRef]
  47. Pike, R.J. Control of crater morphology by gravity and target type: Mars, Earth, Moon. In Proceedings of the Lunar and Planetary Science Conference, 11th, Houston, TX, USA, 17–21 March 1980; pp. 2159–2189. [Google Scholar]
  48. Hartmann, W.K. Ancient lunar mega-regolith and subsurface structure. Icarus 1973, 18, 634–636. [Google Scholar] [CrossRef]
  49. Hiesinger, H.; Jaumann, R.; Neukum, G.; Head, J.W., III. Ages of mare basalts on the lunar nearside. J. Geophys. Res. 2000, 105, 29239–29275. [Google Scholar] [CrossRef]
  50. Ji, J.; Guo, D.; Liu, J.; Chen, S.; Ling, Z.; Ding, X.; Han, K.; Chen, J.; Chen, W.; Zhu, K.; et al. The 1:2,500,000-scale geologic map of the global Moon. Sci. Bull. 2022, 67, 1544–1548. [Google Scholar] [CrossRef]
  51. Ding, M.; Soderblom, J.M.; Bierson, C.J.; Zuber, M.T. Investigating the Influences of Crustal Thickness and Temperature on the Uplift of Mantle Materials Beneath Large Impact Craters on the Moon. J. Geophys. Res. Planets 2021, 126, e2020JE006533. [Google Scholar] [CrossRef]
  52. Hall, J.L.; Solomon, S.C.; Head, J.W. Lunar floor-fractured craters: Evidence for viscous relaxation of crater topography. J. Geophys. Res. 1981, 86, 9537–9552. [Google Scholar] [CrossRef]
  53. Wichman, R.W.; Schultz, P.H. Floor-fractured craters in Mare Smythii and west of Oceanus Procellarum: Implications of crater modification by viscous relaxation and igneous intrusion models. J. Geophys. Res. 1995, 100, 21201–21218. [Google Scholar] [CrossRef]
  54. Jozwiak, L.M.; Head, J.W.; Zuber, M.T.; Smith, D.E.; Neumann, G.A. Lunar floor-fractured craters: Classification, distribution, origin and implications for magmatism and shallow crustal structure. J. Geophys. Res. 2012, 117, E11005. [Google Scholar] [CrossRef]
  55. Huang, Y.H.; Soderblom, J.M.; Minton, D.A.; Hirabayashi, M.; Melosh, H.J. Bombardment history of the Moon constrained by crustal porosity. Nat. Geosci. 2022, 15, 531–535. [Google Scholar] [CrossRef]
  56. Soderblom, J.M.; Evans, A.J.; Johnson, B.C.; Melosh, H.J.; Miljković, K.; Phillips, R.J.; Andrews-Hanna, J.C.; Bierson, C.J.; Head Iii, J.W.; Milbury, C.; et al. The fractured Moon: Production and saturation of porosity in the lunar highlands from impact cratering. Geophys. Res. Lett. 2015, 42, 6939–6944. [Google Scholar] [CrossRef]
  57. Wiggins, S.E.; Johnson, B.C.; Bowling, T.J.; Melosh, H.J.; Silber, E.A. Impact Fragmentation and the Development of the Deep Lunar Megaregolith. J. Geophys. Res. Planets 2019, 124, 941–957. [Google Scholar] [CrossRef]
  58. Young, R.A. A Stratigraphic Model for Bessel Crater and Southern Mare Serenitatis; Impact and Explosion Cratering; Pergamon Press: New York, NY, USA, 1977; pp. 527–538. [Google Scholar]
  59. Wünnemann, K.; Collins, G.S.; Melosh, H.J. A Strain-Based Porosity Model for Use in Hydrocode Simulations of Impacts and Implications for Transient Crater Growth in Porous Targets. Icarus 2006, 180, 514–527. [Google Scholar] [CrossRef]
  60. Wünnemann, K.; Collins, G.S.; Osinski, G.R. Numerical modelling of impact melt production in porous rocks. Earth Planet. Sci. Lett. 2008, 269, 530–539. [Google Scholar] [CrossRef]
  61. Tomka, R.; Steinmann, V.; Warren, T.; Kereszturi, A. Morphological analysis of polar landing regions for a solar powered ice drilling mission. Icarus 2024, 411, 115927. [Google Scholar] [CrossRef]
  62. Scaioni, M.; Yordanov, V.; Brunetti, M.T.; Melis, M.T.; Zinzi, A.; Kang, Z.; Giommi, P. Recognition of landslides in lunar impact craters. Eur. J. Remote Sens. 2018, 51, 47–61. [Google Scholar] [CrossRef]
  63. Kokelaar, B.P.; Bahia, R.S.; Joy, K.H.; Viroulet, S.; Gray, J.M.N.T. Granular avalanches on the Moon: Mass-wasting conditions, processes, and features. J. Geophys. Res. Planets 2017, 122, 1893–1925. [Google Scholar] [CrossRef]
  64. Patzek, M.; Rüsch, O. Experimentally induced thermal fatigue on lunar and eucrite meteorites—Influence of the mineralogy on rock breakdown. J. Geophys. Res. Planets 2022, 127, e2022JE007306. [Google Scholar] [CrossRef]
  65. Basilevsky, A.T.; Head, J.W.; Horz, F. Survival times of meter-sized boulders on the surface of the Moon. Planet. Space Sci. 2013, 89, 118–126. [Google Scholar] [CrossRef]
  66. Basilevsky, A.T.; Head, J.W.; Horz, F.; Ramsley, K. Survival times of meter-sized rock boulders on the surface of airless bodies. Planet. Space Sci. 2015, 117, 312–328. [Google Scholar] [CrossRef]
  67. Vanga, S.; Fassett, C.I.; Zanetti, M.; Nypaver, C.; Thomson, B.J.; Hirabayashi, M. Rock abundance on the lunar mare on surfaces of different age: Implications for regolith evolution and thickness. Geophys. Res. Lett. 2022, 49, e2021GL096710. [Google Scholar] [CrossRef]
Figure 1. Morphology characteristics of lunar impact craters at different stratigraphic ages and diameters. (a) Lansberg A (31.15°W, 0.17°N, D = 8.36 km). (b) Maestlin H (43.57°W, 4.64°N, D = 7.31 km). (c) Ariadaeus B (15.06°E, 4.89°N, D = 8.07 km). (d) Dubyago W (69.75°E, 6.50°N, D = 8.48 km). (e) Tharp (145.63°E, 30.61°S, D = 13.07 km). (f) Sharp A (42. 68°W, 47.62°N, D = 17.16 km). (g) Daedalus S (172.88°E, 6.68°S, D = 21.96 km). (h) Ukert (1.37°E, 7.72°N, D = 22.80 km). (i) Madler (29.74°E, 11.03°S, D = 27.15 km). (j) Izsak (117.58°E, 23.32°S, D = 31.16 km). (k) Siedentopf M (135.13°E, 18.98°N, D = 33.10 km). (l) St. John X (147.35°E, 13.73°N, D = 30.46 km). (m) Harpalus (42. 48°W, 52.72°N, D = 40.13 km). (n) Perrine E (125.26°W, 42.53°N, D = 40.52 km). (o) Nikolaev (151.28°E, 35.07°N, D = 43.59 km). (p) Vander Waals W (117.95°E, 41.71°S, D = 45.54 km). (q) Copernicus (9.63°E, 20.07°S, D = 92.91 km). (r) Theophilus (26.29°E, 11.48°S, D = 100.03 km). (s) Fizeau (134.00°W, 58.17°S, D = 107.00 km). (t) Arzachel (1.91°W, 18.26°S, D = 97.68 km). The base map uniformly adopts the LROC (Lunar Reconnaissance Orbiter Camera) WAC (Wide Angle Camera) image mosaic; 100 m/pixel. It is orthographically projected with the center at the crater’s centroid.
Remotesensing 16 01540 g001
Figure 2. The map illustrates the distribution of impact crater data in this study. Dots represent craters that were categorized: Copernican craters are depicted in blue, Eratosthenian craters in orange, Late Imbrian craters in green, and Early Imbrian craters in red. The base map is based on LOLA (Lunar Orbiter Laser Altimeter), DEM (digital elevation model), and LROC (Lunar Reconnaissance Orbiter Camera) WAC (Wide Angle Camera) image mosaic. This representation employed Mollweide projection.
Remotesensing 16 01540 g002
Figure 3. Schematic diagrams of impact crater shapes and segments used for diameter calculations: (a) Circular Milichius A crater (32.07°W, 9.25°N, D = 8.32 km); (b) Radial lines emitted from the centroid of Milichius A crater to various points on its rim; lines are colored in MediumVioletRed; (c) Elliptical Messier_crater (47.65°E, 1.90°S, D = 11.52 km); (d) Radial lines emitted from the centroid of Messier crater to various points on its rim; lines are colored in MediumVioletRed. Green dots in (b,d) indicate the centroid of the crater rim, while black dots mark various points on the crater rim.
Remotesensing 16 01540 g003
Figure 4. The Ritter impact crater in the Late Imbrian (1.96°N, 19.17°E, D = 29.19 km). The yellow line represents new impact craters formed by subsequent impacts. The blue line represents the crater floor, the green line represents the crater rim, and the red line represents crater floor fractures. The base map is the global LROC WAC image mosaic, orthographically projected with the center at the crater’s centroid.
Remotesensing 16 01540 g004
Figure 5. The main process of calculating the rim height of the Sharonov crater (173.10°E, 12.34°N, D = 76.01 km). (a) Elevation map of the outer rectangular extent of 4R from the crater center. The area formed by the red line is the fitted area after removing the effects. (b) Fitted pre-impact surface. (c) Pre-impact surface. (d) Morphology of the Sharonov crater below the pre-impact surface.
Remotesensing 16 01540 g005
Figure 6. The relationship between impact crater depth and diameter at different stratigraphic ages. (a) The distribution map of crater depths at different diameters. (b) The ratio of crater depth to diameter value. The red diamond represents the mean value of crater depth to diameter ratio. The gray diamonds represent abnormal values.
Remotesensing 16 01540 g006
Figure 7. Different stratigraphic ages of (a) The distribution map of crater wall width at different diameters; (b) The distribution map of crater wall height at different diameters. The red diamond represents the mean value of crater wall width to radius ratio; (c) The ratio of crater wall width to radius value; (d) The ratio of crater wall height to depth value. The red diamond represents the mean value of crater wall height to depth ratio. The gray diamonds represent abnormal values.
Remotesensing 16 01540 g007
Figure 8. The relationship between impact crater rim height and diameter at different stratigraphic ages. (a) The distribution map of crater rim height at different diameters. (b) The ratio of crater rim height to diameter value. The red diamond represents the mean value of crater rim height to diameter ratio.
Remotesensing 16 01540 g008
Figure 9. Irregularities for impact craters of different stratigraphic ages. Different colored lines represent the kernel density lines of impact craters.
Remotesensing 16 01540 g009
Figure 10. The relationship between impact crater volume and diameter at different stratigraphic ages. (a) The distribution map of crater volume and diameter at different diameters. (b) The ratio of crater volume to diameter value. The red diamond represents the mean value of crater volume to diameter ratio. The gray diamonds represent abnormal values.
Remotesensing 16 01540 g010
Figure 11. (a) The relationship between median bidirectional slope and baseline at different stratigraphic ages. (b) The relationship between median bidirectional slope and diameter at the 167 m baseline at different stratigraphic ages.
Remotesensing 16 01540 g011
Figure 12. The distribution relationships between impact crater diameter, slope, and rock abundance at different stratigraphic ages. Average values for the slope and rock abundance of the crater walls were calculated. (a) Relationship between impact crater diameter and rock abundance. (b) Relationship between mean value of wall slope and rock abundance.
Remotesensing 16 01540 g012
Table 1. The summary of power law ( Y = a X b ) coefficients and ratio range for the depth and diameter in different stratigraphic ages.
Stratigraphic AgeDiameter Range (km)abR2d/D Range
Copernican2.30–~130.2076 ± 0.05090.9993 ± 0.10530.87960.0414–0.2502
~13–97.360.9920 ± 0.10880.3482 ± 0.02870.7526
Eratosthenian3.07–~150.1985 ± 0.05360.9908 ± 0.11600.85540.0337–0.2243
~15–132.441.1161 ± 0.11650.3093 ± 0.02700.5848
Late Imbrian5.67–133.421.0293 ± 0.16380.3142 ± 0.04090.31740.0184–0.1933
Early Imbrian8.49–97.640.6313 ± 0.13850.4233 ± 0.05720.39440.0167–0.1506
The sample size of both Late Imbrian and Early Imbrian impact crater diameter was less than 20 km too small; hence, segment fitting was not applied for these two ages to find the turning points. Y, X, a, and b represent crater depth, crater diameter, constant, and power exponent, respectively.
Table 2. The summary of power law ( Y = a X b ) coefficients for the crater wall width, crater wall height, and diameter in different stratigraphic ages.
Stratigraphic Age Diameter Range (km)abR2Wall Width
/Radius Ratio
Wall Height
/Depth Ratio
Copernicanwall width2.30–97.360.7485 ± 0.04870.7167 ± 0.01650.97220.3871–1-
wall height2.30–~130.1985 ± 0.05360.9908 ± 0.11600.8554-0.8092–1
~13–97.360.85 ± 0.06210.35 ± 0.01990.8356
Eratosthenianwall width3.07–132.440.7393 ± 0.03790.7152 ± 0.01280.97220.3587–1-
wall height3.07–~150.1565 ± 0.02551.0537 ± 0.06830.9278-0.7596–1
~15–132.440.9536 ± 0.09890.3160 ± 0.02680.5962
Late Imbrianwall width5.67–133.430.7546 ± 0.12050.6935 ± 0.03970.67910.1362–0.8204
wall height5.67–133.430.9024 ± 0.14760.3149 ± 0.04200.3063-0.7347–0.9591
Early Imbrianwall width8.49–97.640.5878 ± 0.12060.7526 ± 0.05210.69630.1298–0.6888-
wall height8.49–97.640.5437 ± 0.12810.4333 ± 0.06130.3745-0.5975–0.9604
For the relationship of crater wall height and diameter, the sample size of both Late Imbrian and Early Imbrian impact crater diameters was less than 20 km too small; hence, segment fitting was not applied for these two ages to find the turning points. Y, X, a, and b represented crater depth, crater diameter, constant, and power exponent, respectively.
Table 3. The summary of power law ( Y = a X b ) coefficients and ratio range for the rim height and diameter in different stratigraphic ages.
Diameter Range (km)NumberabR2Rim Height
/Diameter Ratio
16–4553.860.560.9318-Krüger et al., 2017 [32]
Highlands15–42120.053 ± 0.1440.958 ± 0.7790.169-Osinski et al., 2018 [23]
Mare21–38130.180 ± 0.0560.456 ± 0.0970.634-
Copernican2.30–~13210.1985 ± 0.05360.9908 ± 0.11600.85540.0118–0.0571This study
~13–97.36520.85 ± 0.06210.35 ± 0.01990.8356
Eratosthenian3.07–~15280.0158 ± 0.00521.3213 ± 0.13550.85450.0090–0.0515
~15–132.44940.1553 ± 0.03030.5169 ± 0.04930.5468
Late Imbrian10.62–133.431240.1312 ± 0.02800.5161 ± 0.05370.41020.0084–0.0455
Early Imbrian8.49–97.64850.0592 ± 0.02040.6431 ± 0.08790.38720.0072–0.0467
The sample size of both Late Imbrian and Early Imbrian impact crater diameter was less than 20 km too small; hence, segment fitting was not applied for these two ages to find the turning points. Y, X, a, and b represented crater depth, crater diameter, constant, and power exponent, respectively.
Table 4. The summary of power law ( Y = a X b ) coefficients for the crater volume and diameter in different stratigraphic ages.
Diameter Range (km)NumberabR2
17–136200.292.37 Hale and Grieve, 1982 [41]
Copernican4.37–97.36730.35 ± 0.07142.40 ± 0.04680.9884This study
Eratosthenian3.07–132.381220.48 ± 0.03672.31 ± 0.01680.9947
Late Imbrian10.62–132.741240.32 ± 0.07152.40 ± 0.05130.9568
Early Imbrian8.48–97.68850.33 ± 0.06532.38 ± 0.04590.9912
Table 5. The crater wall slope value at different Stratigraphic ages.
Stratigraphic AgeMean MinMaxStandard Deviation
Copernican23.1415.4633.015.3004
Eratosthenian20.5413.6629.744.3250
Late Imbrian18.1911.0626.822.6780
Early Imbrian17.5210.8625.362.5004
Disclaimer/Publisher’s Note: The statements, opinions and data contained in all publications are solely those of the individual author(s) and contributor(s) and not of MDPI and/or the editor(s). MDPI and/or the editor(s) disclaim responsibility for any injury to people or property resulting from any ideas, methods, instructions or products referred to in the content.

