Article

Single-Image Super-Resolution Method for Rotating Synthetic Aperture System Using Masking Mechanism

1
Research Center for Space Optical Engineering, Harbin Institute of Technology, Harbin 150001, China
2
Division of System Engineering, Boston University, Boston, MA 02215, USA
*
Author to whom correspondence should be addressed.
Submission received: 13 March 2024 / Revised: 22 April 2024 / Accepted: 23 April 2024 / Published: 25 April 2024

Abstract

:
The emerging technology of rotating synthetic aperture (RSA) presents a promising solution for the development of lightweight, large-aperture, and high-resolution optical remote sensing systems in geostationary orbit. However, the rectangular shape of the primary mirror and the distinctive imaging mechanism involving the continuous rotation of the mirror lead to a pronounced decline in image resolution along the shorter side of the rectangle compared to the longer side. The resolution also exhibits periodic time-varying characteristics. To address these limitations and enhance image quality, we begin by analyzing the imaging mechanism of the RSA system. Subsequently, we propose a single-image super-resolution method that utilizes a rotated varied-size window attention mechanism instead of full attention, based on the Vision Transformer architecture. We employ a two-stage training methodology for the network, where we pre-train it on images masked with stripe-shaped masks along the shorter side of the rectangular pupil. Following that, we fine-tune the network using unmasked images. Through the strip-wise mask sampling strategy, this two-stage training approach effectively circumvents the interference of lower confidence (clarity) information and outperforms training the network from scratch using the unmasked degraded images. Our digital simulation and semi-physical imaging experiments demonstrate that the proposed method achieves satisfactory performance. This work establishes a valuable reference for future space applications of the RSA system.

1. Introduction

Optical remote sensing satellites in geostationary orbit offer the ability for high spatial and temporal resolution, making them a crucial part of space-based observation technology [1,2,3,4,5,6]. Compared to low-Earth-orbit optical remote sensing satellites, they provide several advantages: (1) they remain stationary relative to the observed area, allowing for observations of target regions over extended periods with higher temporal resolution; (2) by adjusting their direction, they can quickly acquire observational images for the corresponding area, making them particularly suitable for emergency response tasks; (3) flexible satellite mission planning enables repeated observations of multiple hotspots and large areas; and (4) compared to line-scan satellites, the array camera has the advantage of a long integration time, resulting in the acquisition of high-quality images.
Due to the high orbit altitude and the fact that the imaging object distance is tens of times greater than that of a low Earth orbit, high-orbit remote sensing satellites require a larger aperture to ensure imaging quality. Various techniques have been developed to overcome the aperture limitations, such as segmented mirror technology, membrane diffraction imaging technology, optical synthetic aperture technology, and rotating synthetic aperture (RSA) technology. The segmented mirror technology employs segmented sub-mirrors to assemble into a large aperture primary mirror. The sub-mirrors are folded during launch and expanded after entering orbit. During the imaging process, it is imperative to guarantee that each sub-mirror is accurately assembled. The primary mirror expansion and support structure’s complexity result in elevated expenses [7,8]. The membrane diffraction imaging technology utilizes thin-film materials to create imaging devices. Under the precondition of achieving the same resolution ability, the system mass is only one-seventh of that of a traditional large-aperture single-reflection mirror system, considerably decreasing the rocket-carrying capacity requirements. The membrane mirror’s surface necessitates lower precision than a traditional reflection mirror, which reduces manufacturing difficulty and enables mass production, with potential for significantly lower costs. However, this system has the disadvantage of color dispersion, with a narrow spectral response range of only approximately 40 nm, and lower diffraction efficiency, which limits the system’s practical application to some extent [9,10,11]. The optical synthetic aperture imaging technology is based on interferometric imaging principles, employing small-aperture systems to synthesize a large-aperture system. Similar to the segmented mirror technology, its advantage is avoiding the processing of large-aperture lenses and reducing launch costs by using small-aperture systems. However, the synthesis of the large-aperture must come at the expense of reducing light flux, resulting in a reduced signal-to-noise ratio. This system must satisfy the co-phasing condition to attain ideal imaging, and therefore error monitoring and precise phase adjustment make the engineering implementation of the system extremely challenging [12,13,14]. Compared to the methods mentioned above, the RSA system presents a more advanced alternative. It employs a primary mirror that is rotatable and possesses a large aspect ratio, as illustrated in Figure 1. Through the rotation of the primary mirror, a sequence of images is generated, capturing high-resolution information from various directions. However, this also results in significantly higher resolution along the long edge compared to the short edge [15,16,17,18]. Furthermore, the rotation generates periodic fluctuations in image quality, making it essential to employ image enhancement techniques to improve the quality of the imaging system.
The task of single-image super-resolution (SISR) is to reconstruct a high-resolution image (HR) from a corresponding low-resolution image (LR). The relationship between these two quantities is described by the classical degradation model, LR = ( HR * k ) + n , where k represents a blur kernel, and ∗, n, and ↓ denote the convolution operator, additive noise, and down-sampling operator, respectively. Deep learning-based SISR methods have demonstrated remarkable performance compared to traditional methods, and have become the prevailing approach in recent years [19,20,21,22]. These methods can be broadly classified into two categories: explicit methods based on the classical degradation model or its variants, and implicit methods that leverage the data distribution within the training dataset [23,24,25]. Explicit methods aim to directly learn the blur kernel k and additive noise n in the classical degradation model from the training data. Representative approaches include SRGAN [26], EDSR [27], SRMD [28], and Real-ESRGAN [29]. Another group of explicit methods, such as KernelGAN [30], DualSR [31], and DBPI [32], rely on the internal statistics of patch recurrence. However, the RSA system’s point spread function (PSF) continuously changes during the imaging process due to the rotation of the primary mirror, resulting in images with temporal periodicity and spatial asymmetry. Existing explicit methods do not account for this special characteristic of the blur kernel, leading to suboptimal performance. On the other hand, implicit methods do not rely on any explicit parameterization and instead typically learn the underlying super-resolution (SR) model implicitly through the data distribution within training datasets. Representative approaches include CinCGAN [33] and FSSR [34]. The general meanings and types of the methods mentioned above are depicted in Table 1. However, the RSA system presents a challenge for implicit methods due to the existence of multiple degraded images of the same target scene resulting from different rotation angles, which makes the data distribution more complex. Furthermore, the methods mentioned above mostly rely on convolutional neural networks (CNNs), but the strong long-range dependency of remote sensing images makes it difficult for CNNs with local inductive bias to meet application requirements. In summary, the RSA system possesses unique imaging characteristics that make it difficult to apply existing SISR methods directly. Therefore, it is crucial to conduct research on targeted remote sensing image SR methods based on the degradation characteristics of the system.
To address this challenge, we begin by examining the non-circular symmetry spatial distribution and temporal variability of the PSF in relation to the imaging mechanism of the RSA system. Subsequently, we propose an SISR method based on Vision Transformer (ViT) [35], which is trained in a two-stage process. In the first stage, we pre-train the network on degraded images masked along the short edge direction of the rectangular primary mirror. Then, in the second stage, we perform fine-tuning using unmasked images. This approach proves to be superior to directly training the network on the original degraded images without masking. Given the reduced resolution along the shorter edge direction caused by the non-circular symmetry of the pupil, our primary objective is to compensate for the substantial loss of information along the shorter side direction, thereby enhancing the resolution in that direction. Building upon this, the proposed method can further achieve an increase in resolution across all directions. Additionally, considering the specific characteristics of remote sensing images, we replace the original Vision Transformer blocks with rotated varied-size window-based attention blocks [36]. These blocks introduce local windows with different locations, sizes, shapes, and angles to calculate window-based attention. Finally, we validate the effectiveness of our proposed method through digital simulations experiments as well as semi-physical imaging experiments.

2. Materials and Methods

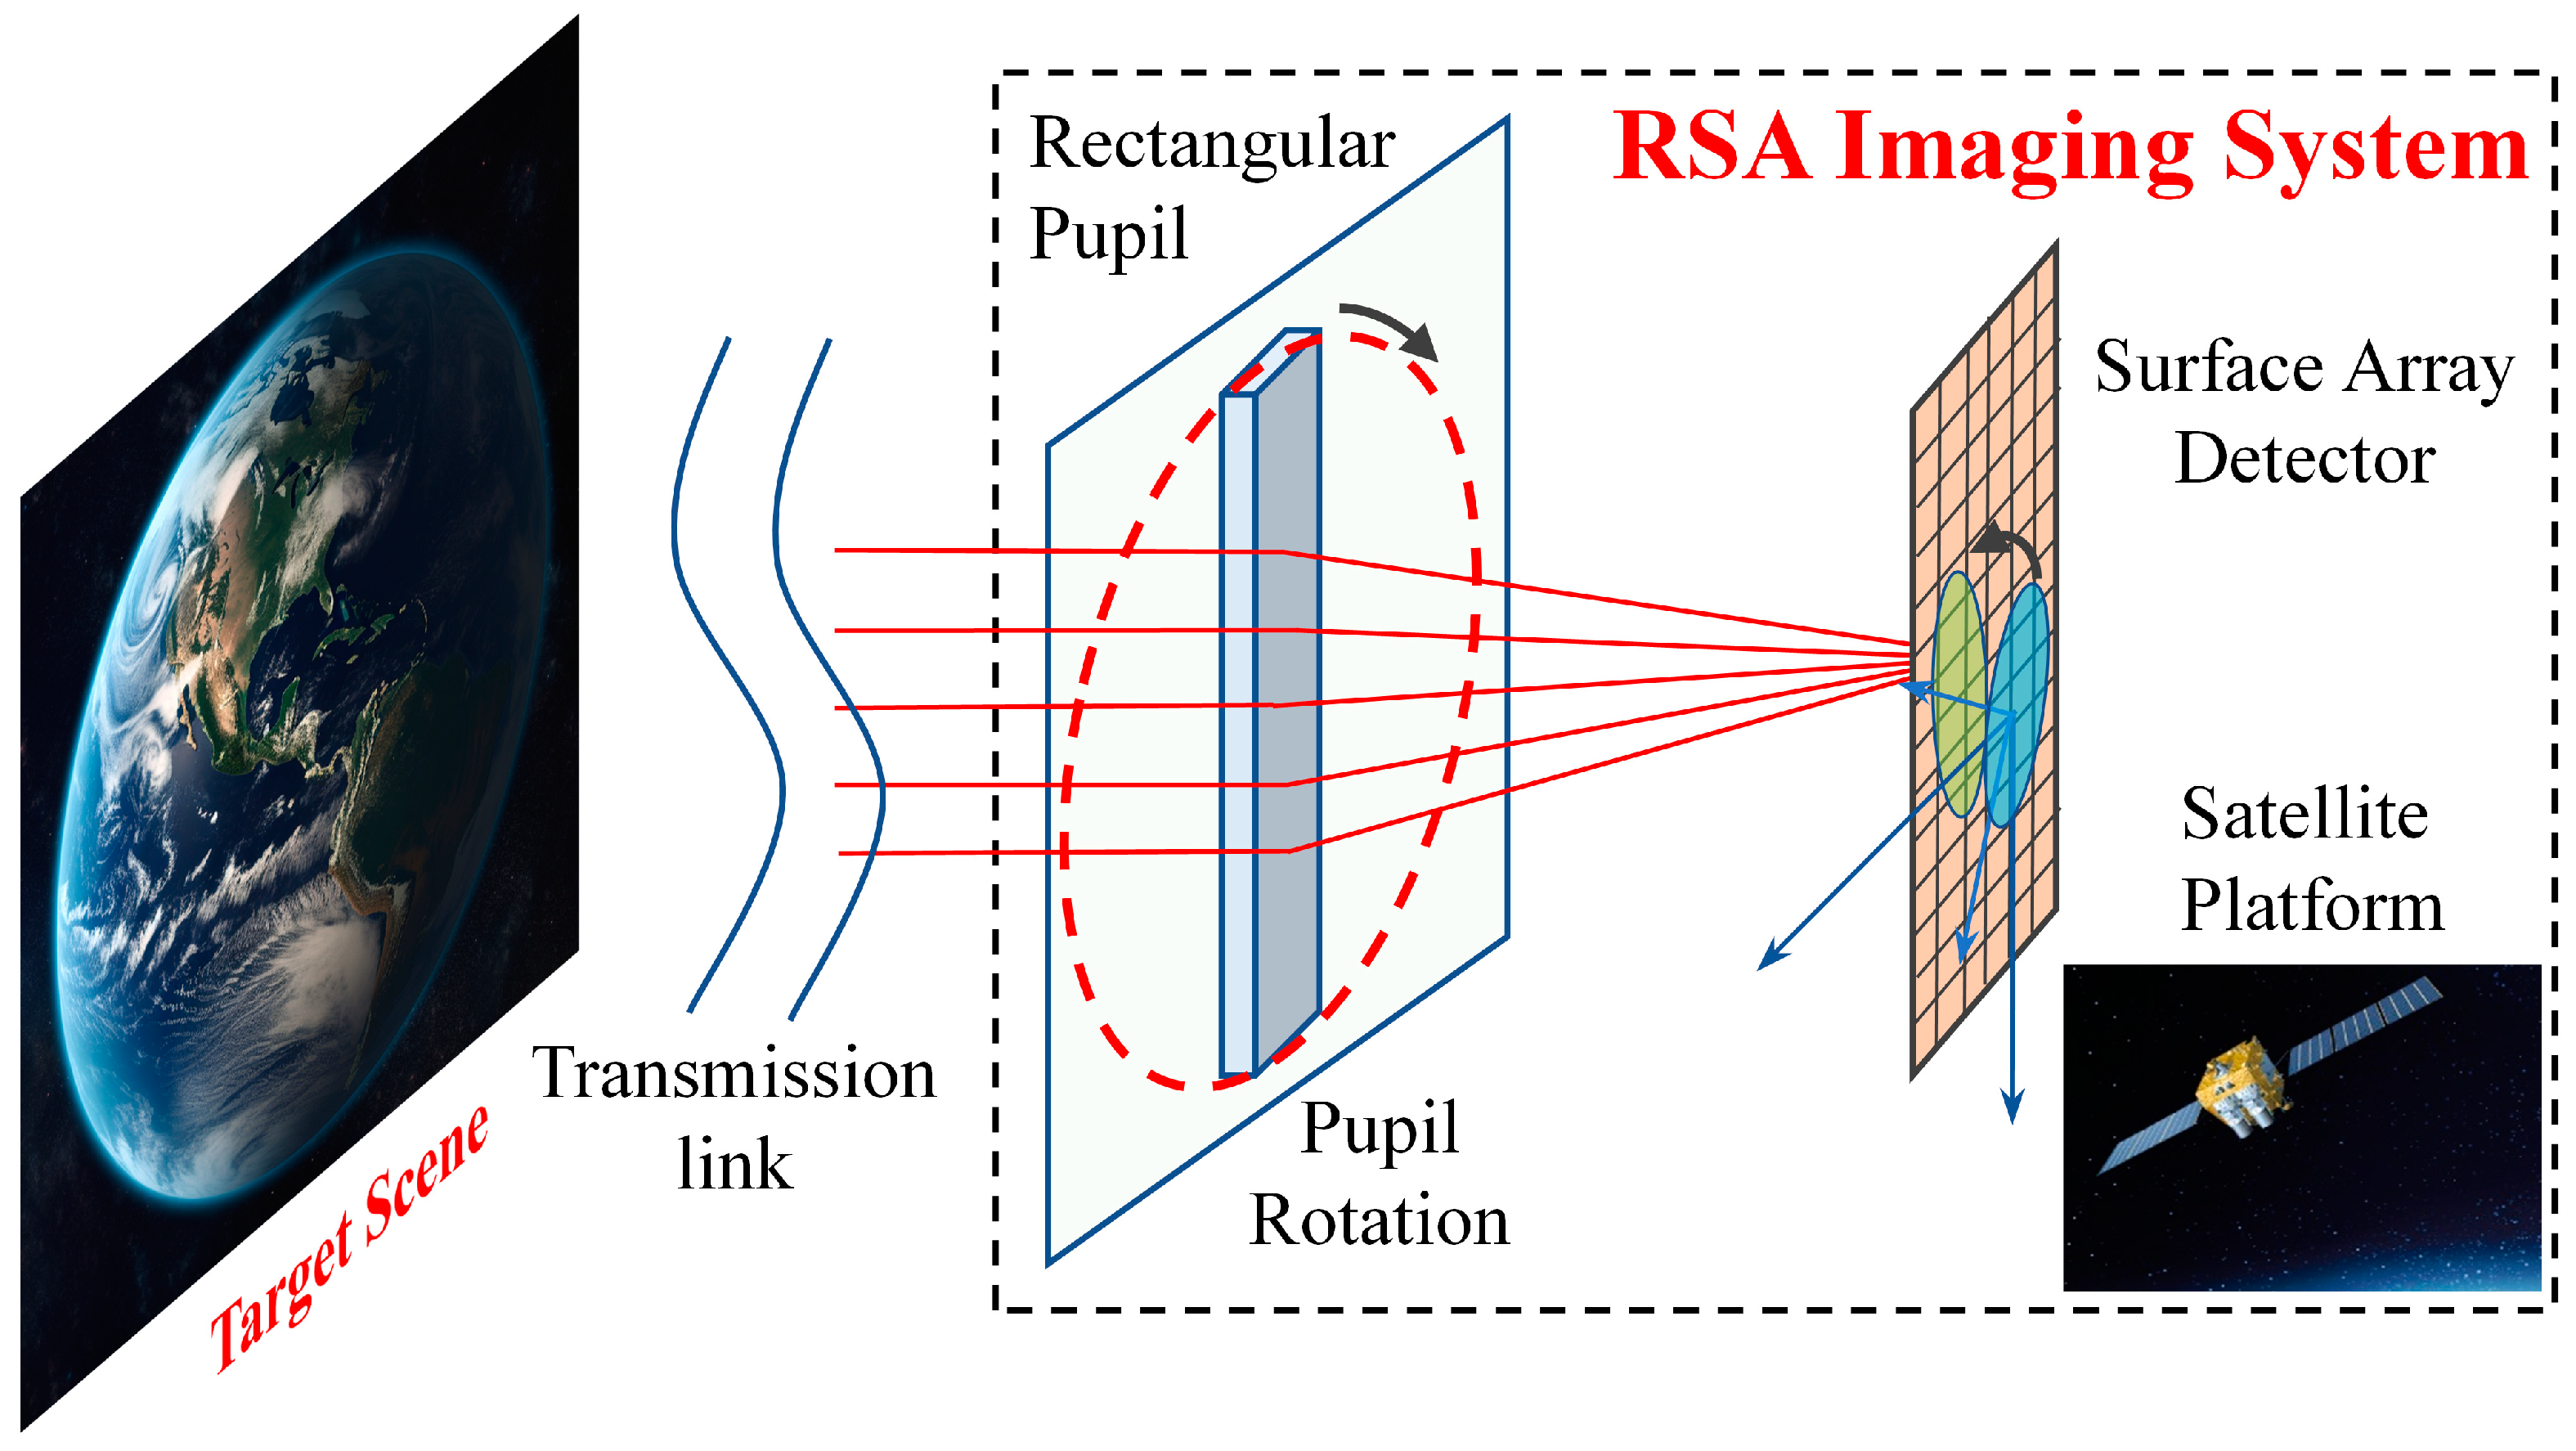
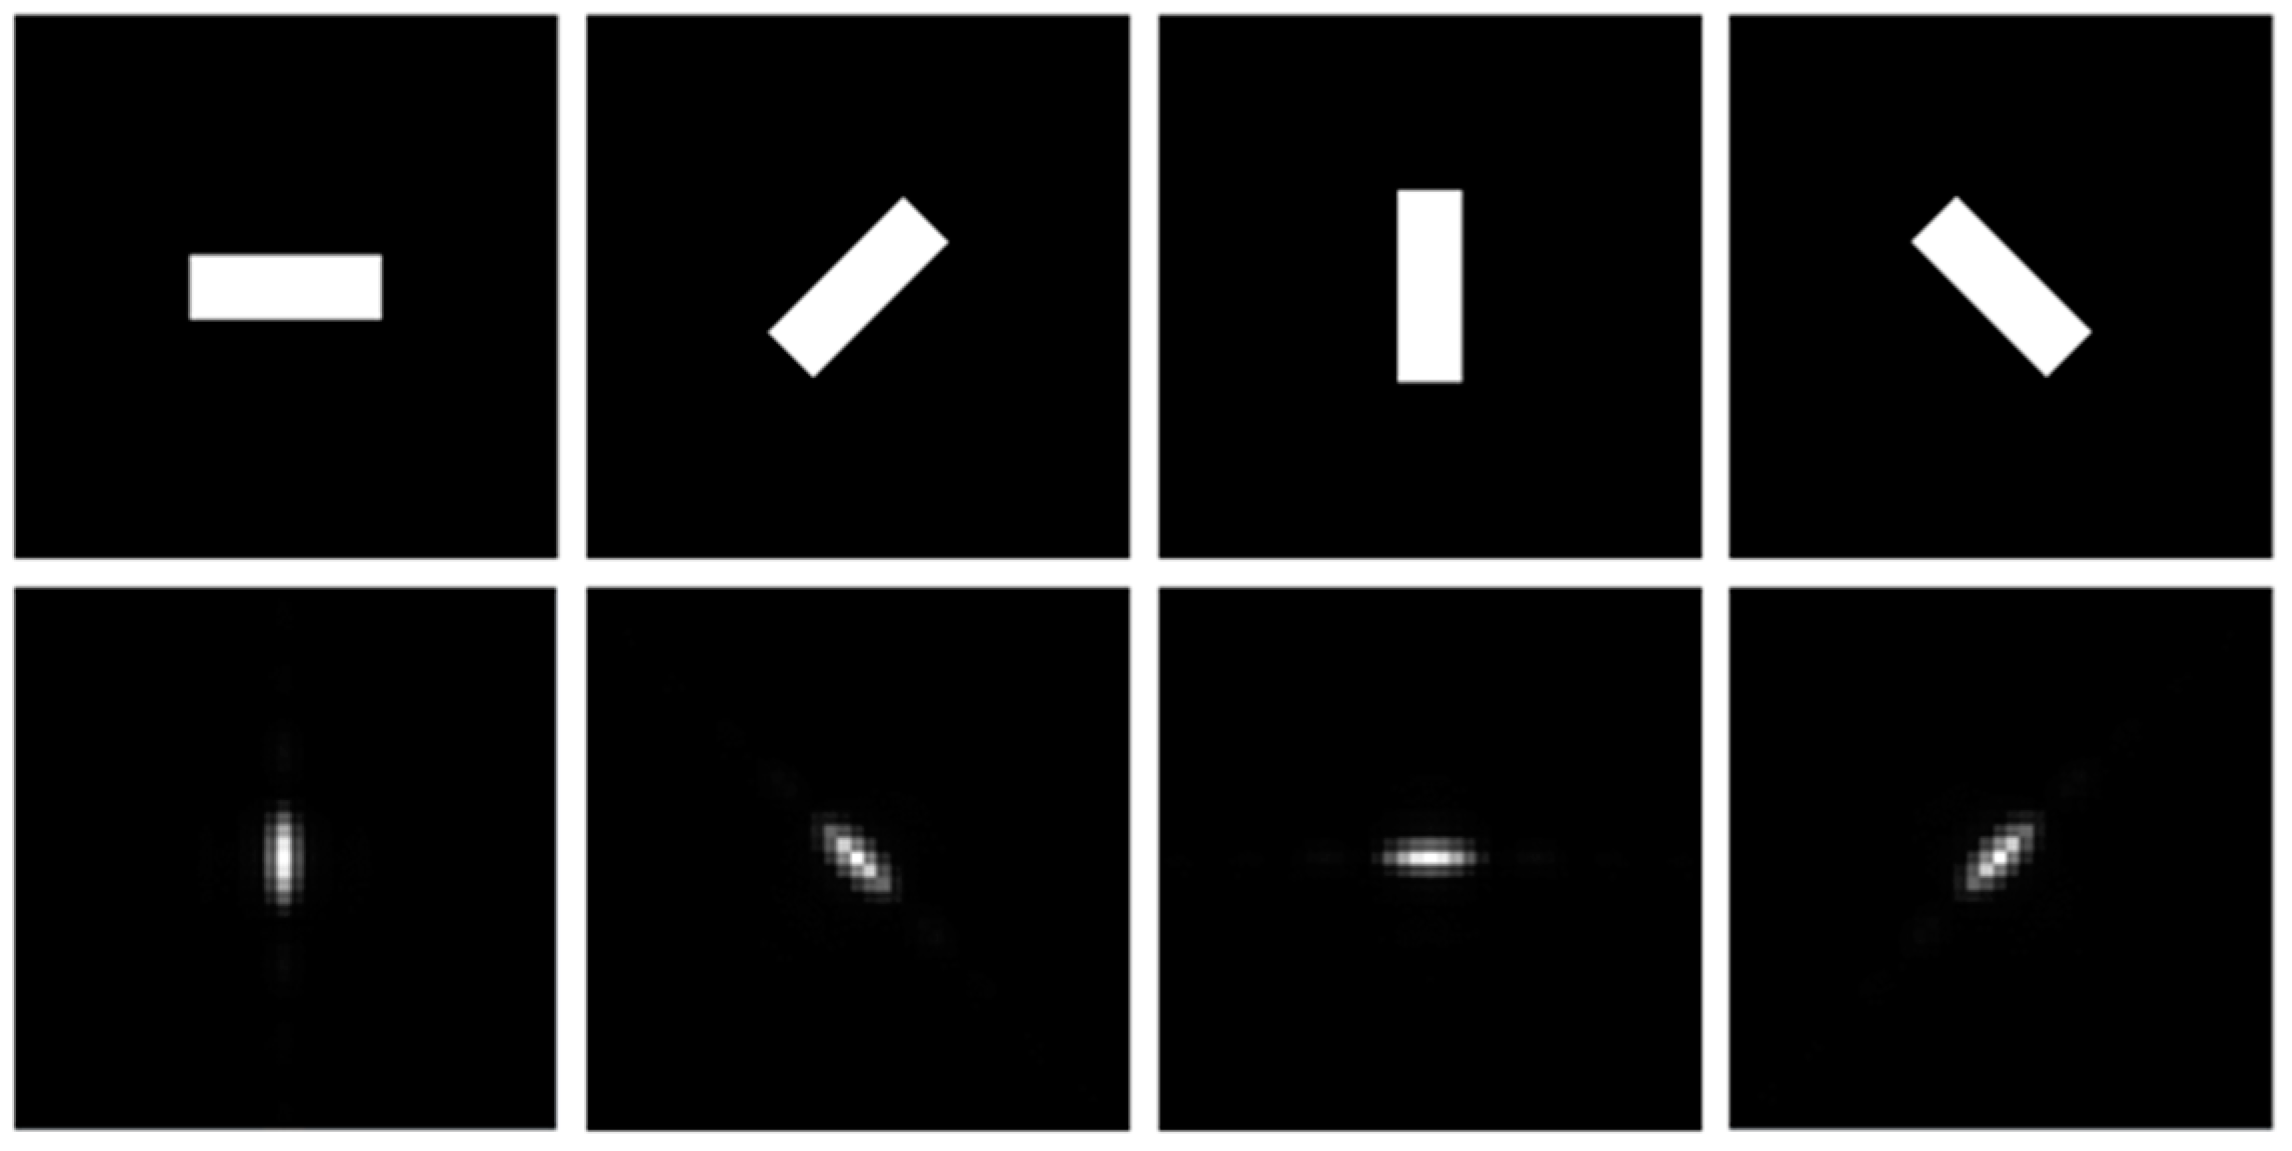
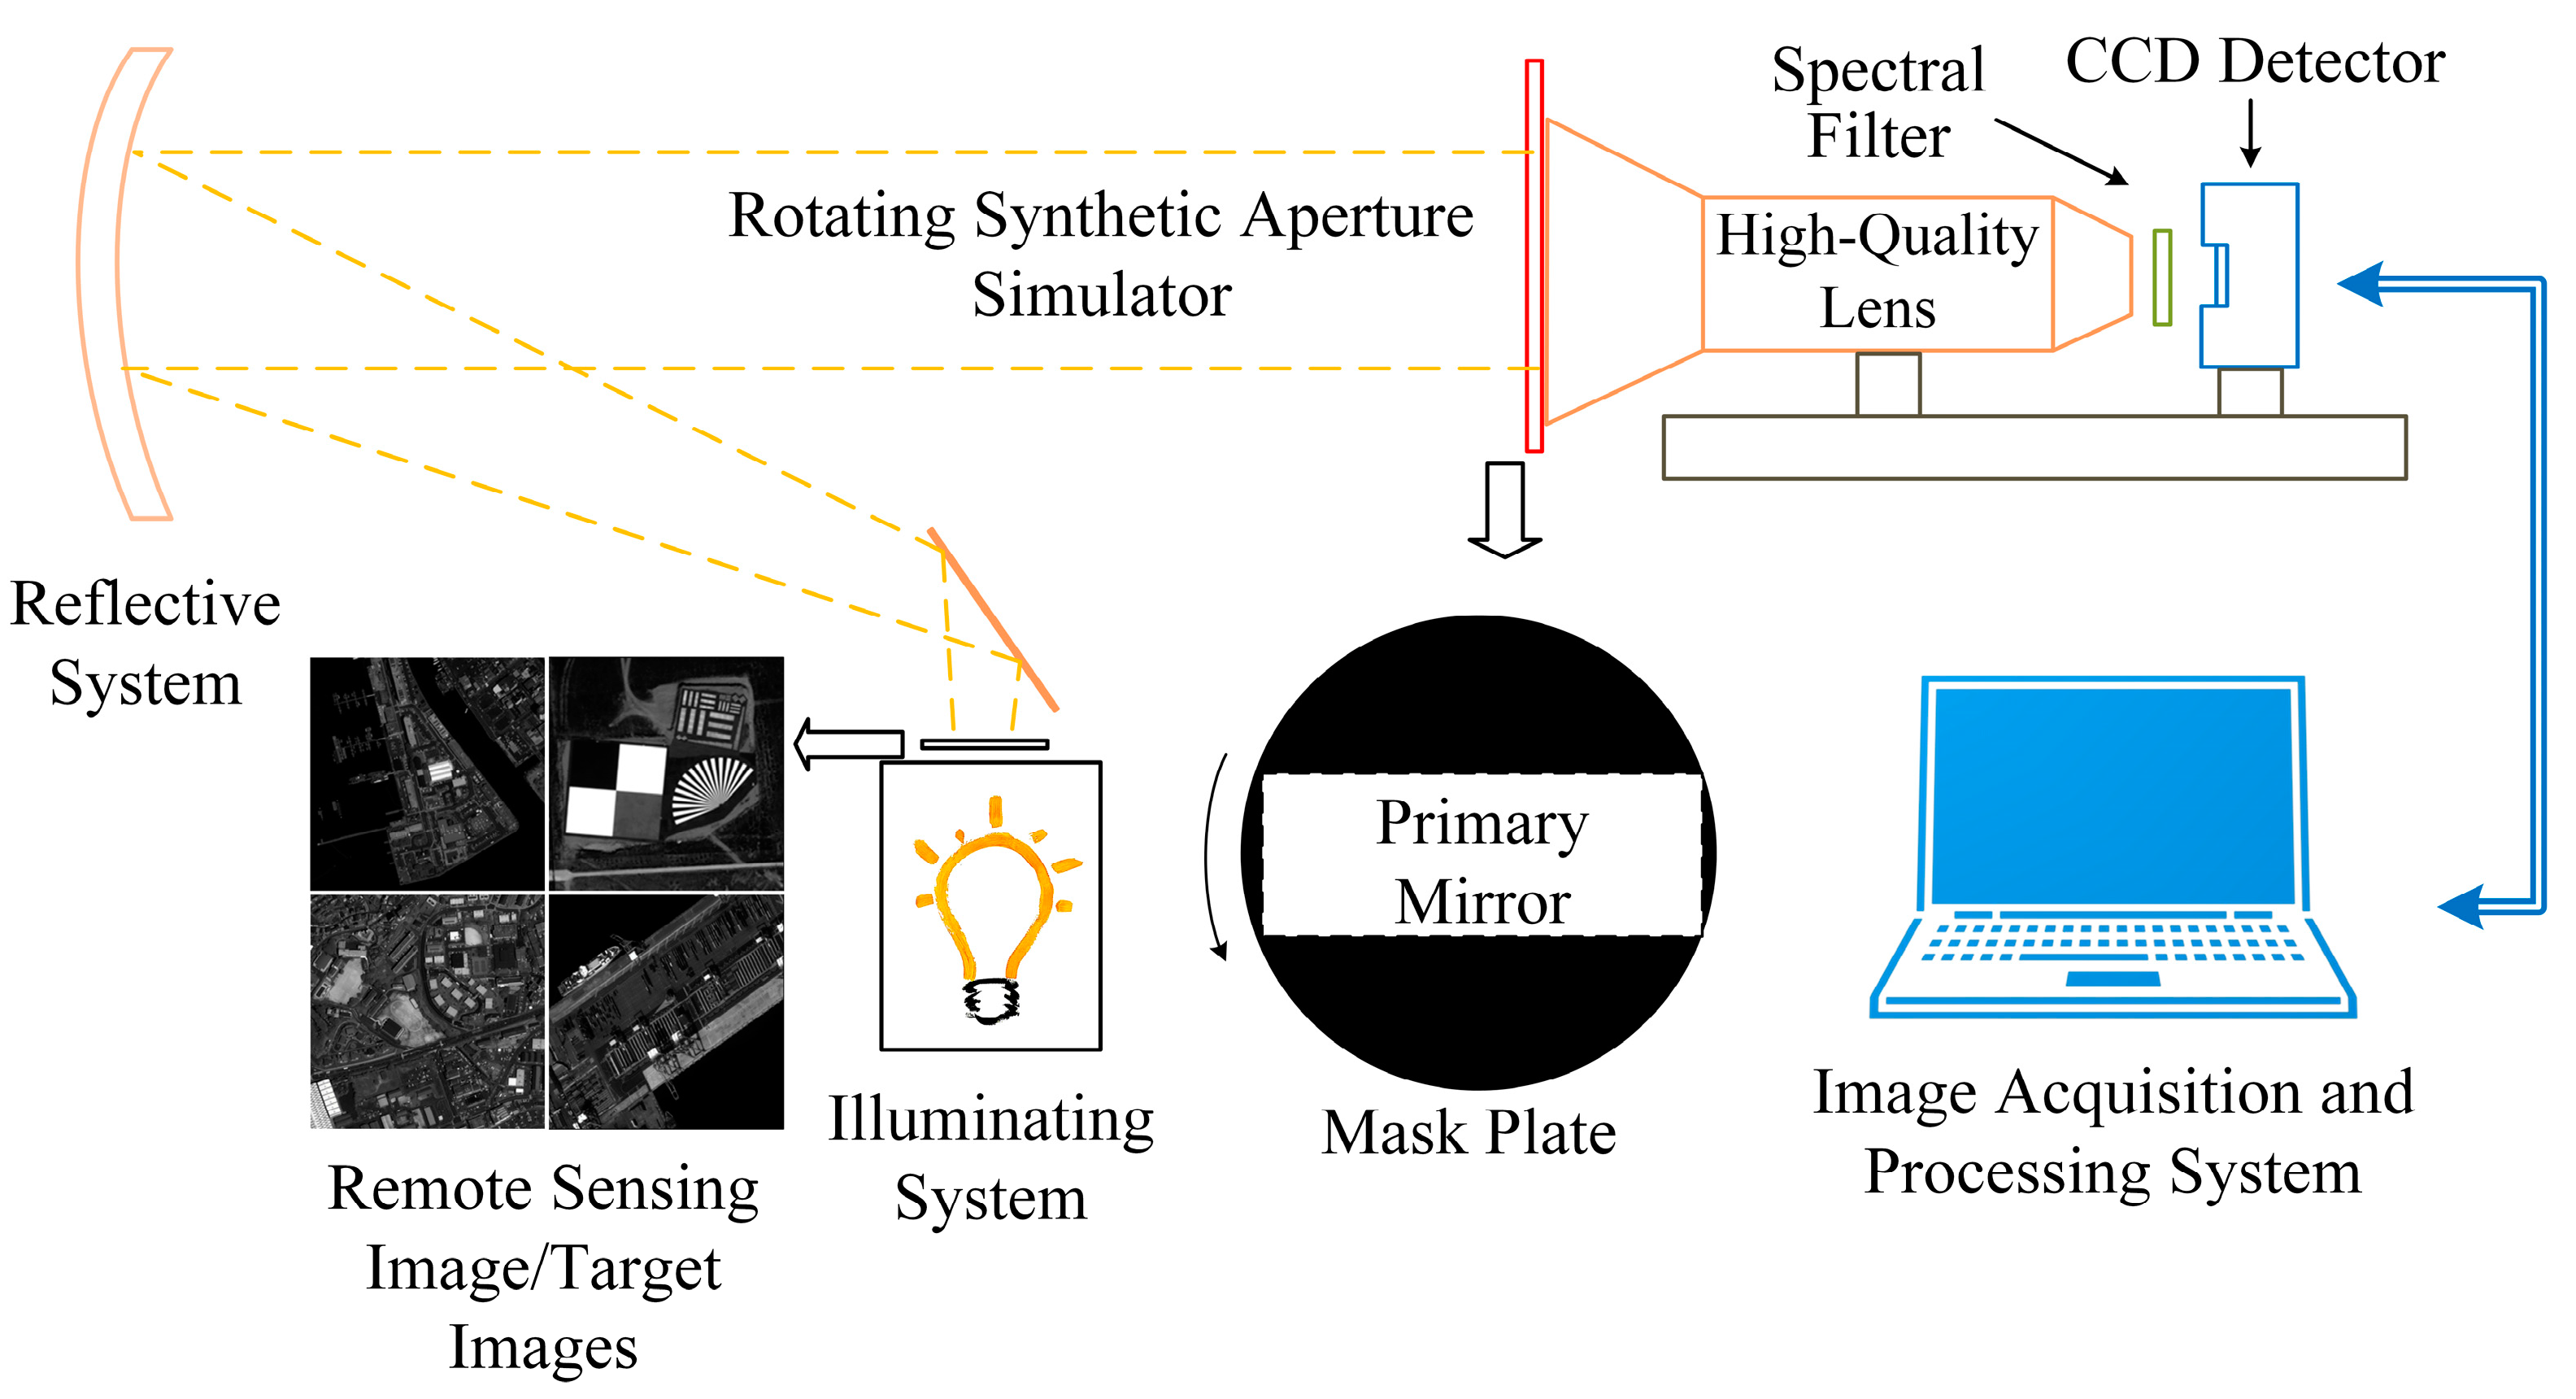
2.1. Analysis of Imaging Mechanism of the RSA System

The RSA system can be regarded as a diffraction-limited system, in which any point source x 0 , y 0 on the object plane emits a diverging spherical wave that projects onto the entrance pupil. This wave is then transformed by the system into a converging spherical wave on the exit pupil, which projects onto the image plane at position x i , y i . In the case of polychromatic illumination, the diffraction-limited incoherent imaging system is a linear space-invariant system of intensity transformation. The object–image relationship can be expressed as (ignoring the constant coefficient):
I i x i , y i = I g x 0 , y 0 h I x i x 0 , y i y 0 d x 0 d y 0
where I i represents the intensity distribution of the image plane, I g represents the intensity distribution of the geometrical optics ideal image, and h I represents the intensity impulse response, i.e., the PSF, which denotes the intensity distribution of diffraction spots produced by point objects.
The equation above demonstrates that when a point source is used as the input elemental object, it generates an image spot on the image plane with the ideal image point of geometrical optics at its center. The intensity distribution of the image plane results from the superposition of the image spots produced by all point sources on the object plane. The shape of the image spot is described by the PSF. According to Fresnel–Kirchhoff’s diffraction formula, the PSF is obtained by subjecting the pupil function to Fourier transform and squaring the resulting modulus. For the RSA system, more specifically, its pupil function at time t can be expressed as:
P x , y , t = rect x cos w t + φ 0 y sin w t + φ 0 a rect x sin w t + φ 0 + y cos w t + φ 0 b
where a and b are the length and width of the rectangle, respectively, w is the angular velocity of the rectangular primary mirror rotation, φ 0 is the initial phase, and rect represents the rectangle function, which is defined as:
rect s = 1   if s < 0.5 0   otherwise
The PSF can be obtained according to the pupil function as follows:
PSF x , y , t = a b sin c a x cos w t + φ 0 y sin w t + φ 0 × sin c b x sin w t + φ 0 + y cos w t + φ 0
Figure 2 reveals that the PSF takes on an elliptical shape if the secondary diffraction effect is not considered. The length-to-width ratio of the primary mirror’s rectangular shape determines the form of this ellipse, with the orientation of the longer axis aligned with the shorter side of the rectangle [15].

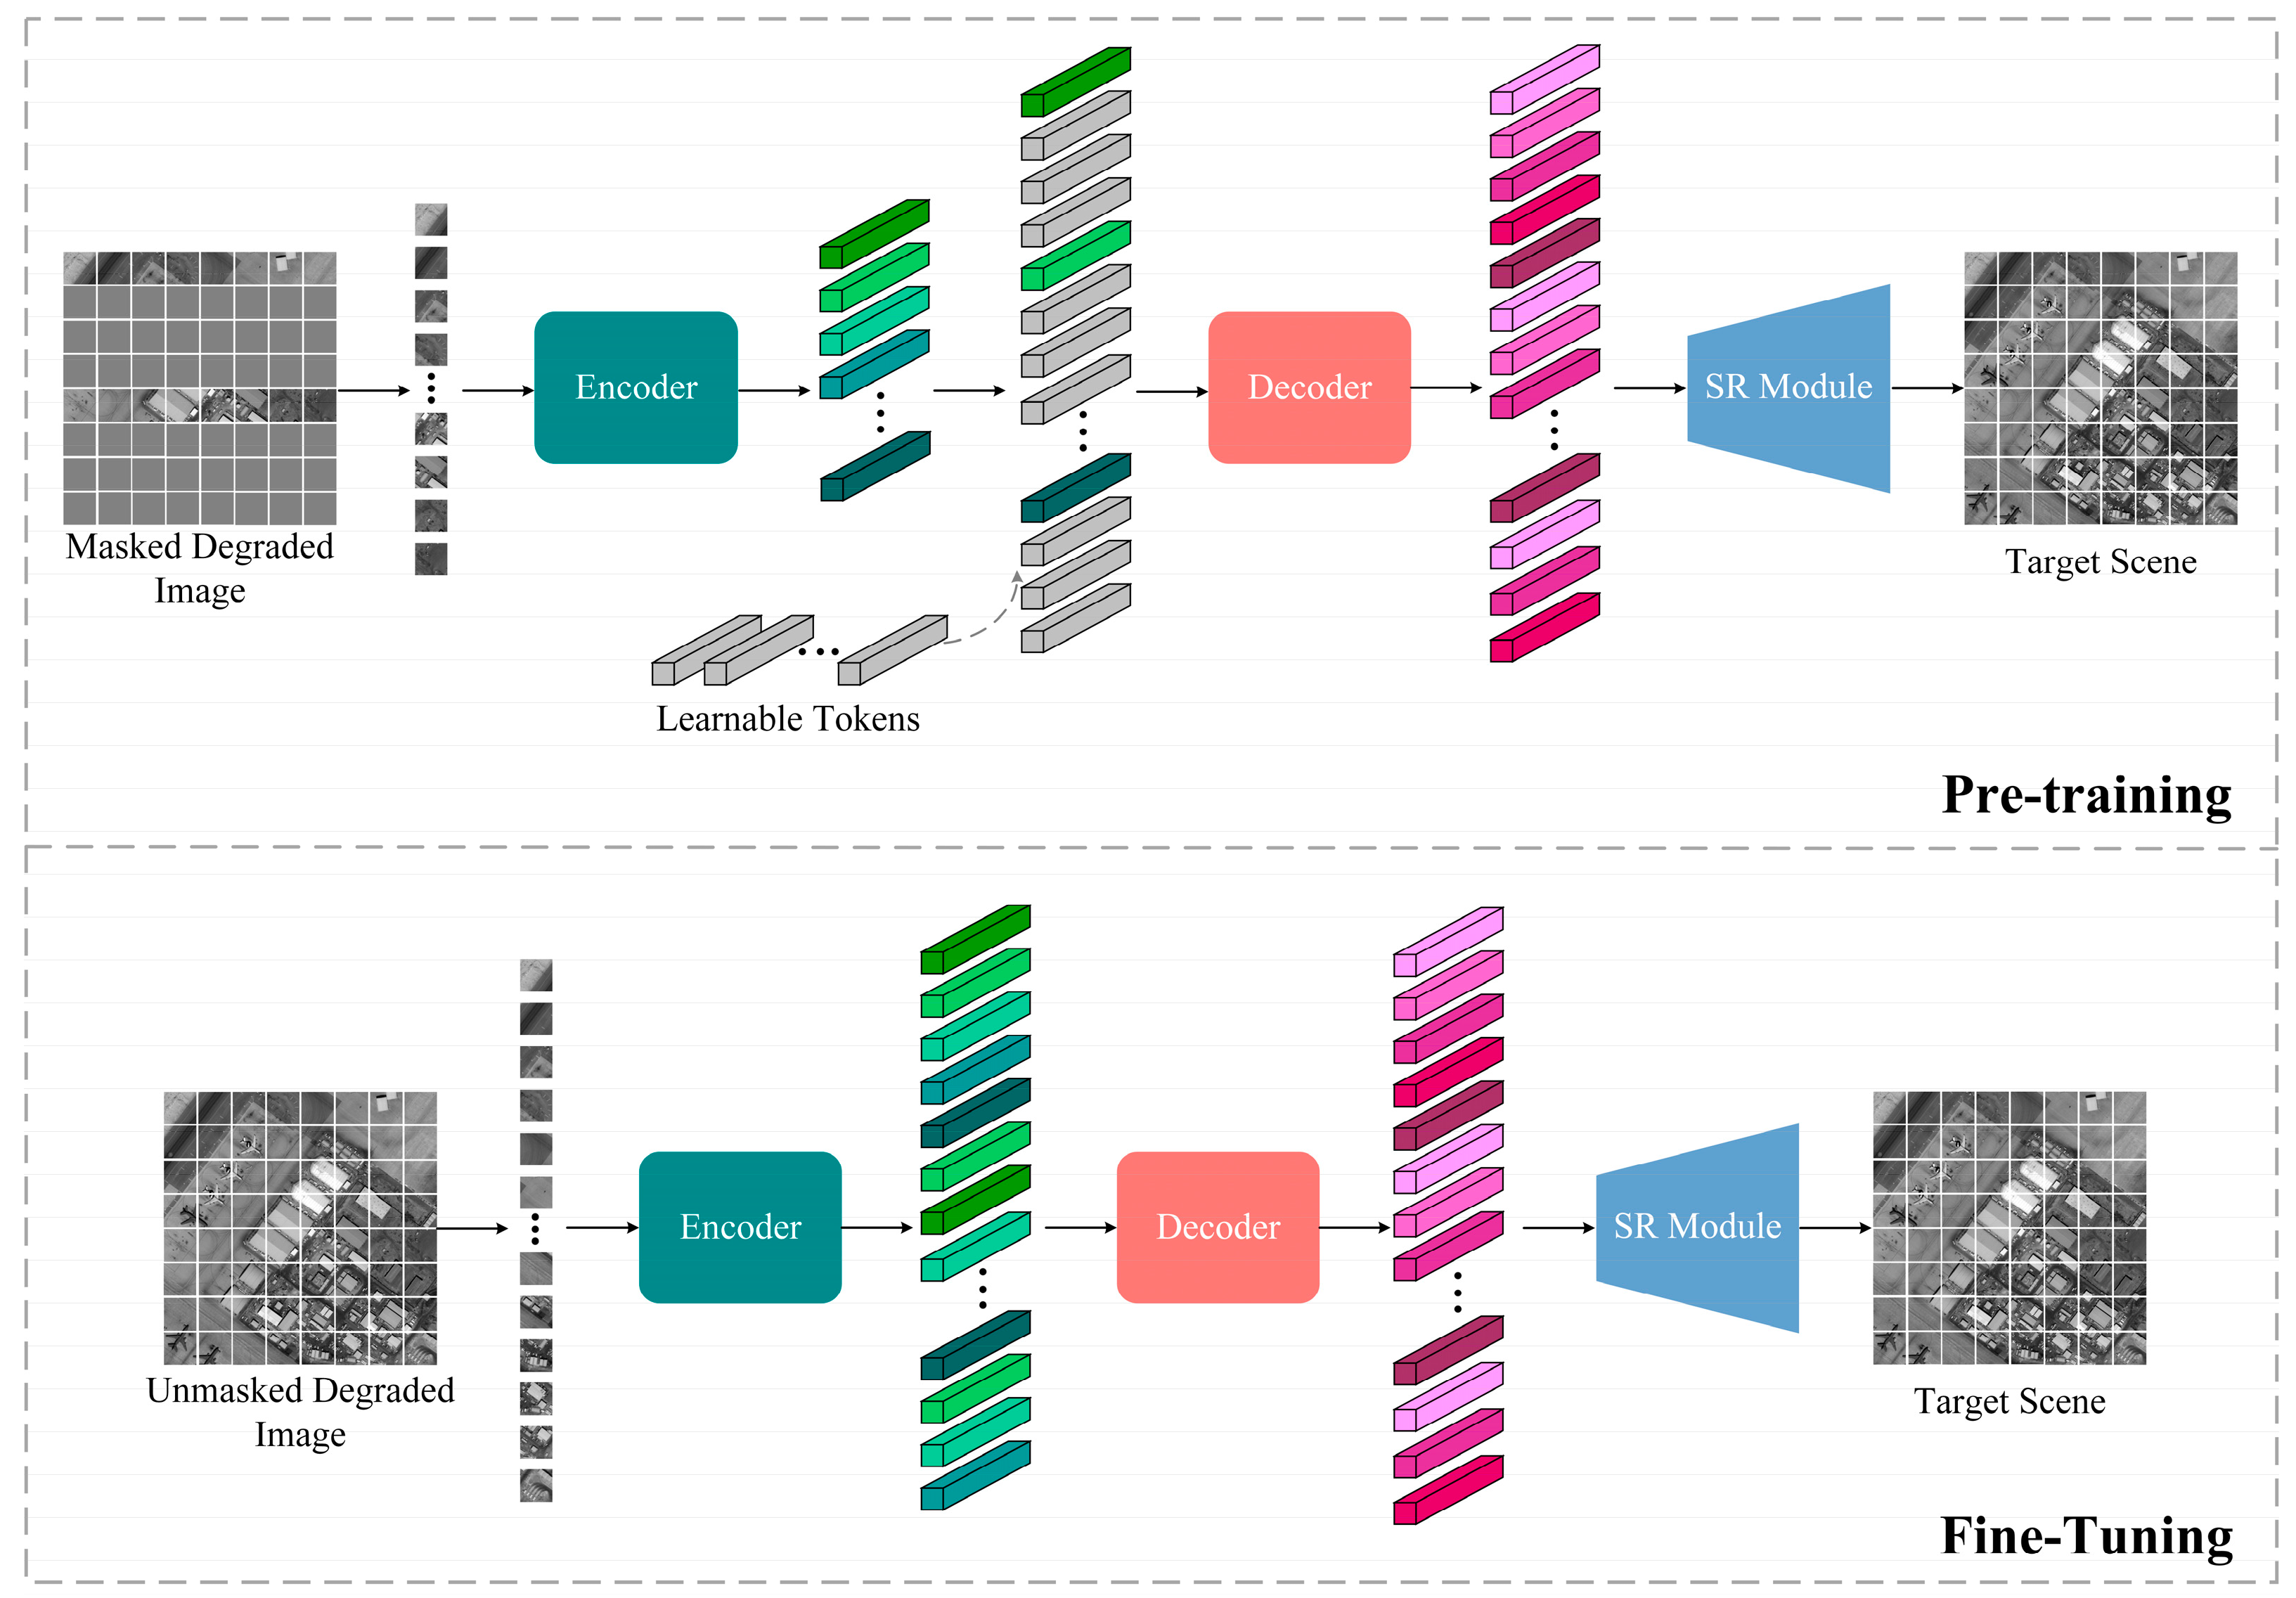
2.2. Overview of the Image Super-Resolution Approach

As stated in Section 1, the rotation of the rectangular pupil introduces temporal variation in the blur kernel, posing a challenge for accurately estimating the blur kernel by the model. Additionally, the many-to-one relationship between LR and HR images increases the difficulty of learning the data distribution for implicit methods. In other words, the unique imaging mechanism of the RSA system presents obstacles for the deep neural network to acquire the desired ability, which involves leveraging the high-resolution information preserved in the image itself in specific directions for super-resolution reconstruction in lower-resolution directions to significantly enhance the image resolution in the short side direction of the rectangle. Consequently, these challenges often result in the phenomenon of uneven resolution in the output reconstructed image, which is not significantly improved. Nevertheless, the time-sequential imaging method employed in the RSA system offers a benefit: the images captured within one rotation cycle of the rectangular pupil contain high-resolution information from various directions. Motivated by the work of [37], our training methodology involves initially masking the pixels along the shorter side direction of the rectangle and using a ViT-based super-resolution network to reconstruct them. This approach aims to effectively leverage the complementary information available across images captured at various rotation angles of the pupil. Subsequently, we fine-tune the model using the unmasked images. For the SR reconstruction module implementation, we employ the sub-pixel convolution layer [38] to upsample the features outputted by the decoder. The overall process is depicted in Figure 3. We have observed that this two-stage training approach significantly improves performance. Based on this observation, we believe that masking the pixels along the lower resolution direction can guide the network to focus more on the high-resolution information preserved along the longer edge of the rectangle. Furthermore, considering the presence of objects with varying orientations and scales in the remote sensing images obtained by the RSA system, we replace global self-attention with rotated varied-size window-based attention. This modified attention mechanism introduces shift, scale, and rotation parameters to the original window-based attention, enabling diversified windows of different locations, sizes, shapes, and angles to better handle objects with varying orientations and scales.

2.3. Encoder

The encoder in our model comprises a stack of rotated varied-size window-based attention blocks, as illustrated in Figure 4. The feed-forward network is a 2-layer multilayer perceptron with nonlinear activation functions in between. And the rotated varied-size multi-head attention will be detailed in Section 2.3.2.

2.3.1. Masked Autoencoder

The masked autoencoder (MAE) was proposed by He et al. with the aim of recovering masked parts of an image in the pixel space through an encoder–decoder structure, given the visible parts of the image [37]. This process involves partitioning the input image into non-overlapping patches, followed by masking some patches according to a predetermined ratio. These masked patches are then treated as regions to be reconstructed. The original MAE utilizes random sampling to select masked patches, whereas we employ a corresponding mask sampling strategy that accounts for the unique pupil shape of the RSA system. Our mask sampling strategy involves masking pixels in a striped pattern along the direction of lower resolution, which is the shorter side of the rectangular pupil. This strategy serves to remove some of the lower confidence (clarity) priors by masking more low-resolution information. It can guide the model to focus more on and utilize high-resolution information along other directions, thereby avoiding interference caused by the specific degradation process resulting from the asymmetric characteristic of the PSF. As a simple example, let us consider the two perpendicular directions of edges shown in Figure 5. By masking along the lower-resolution direction, blurred edges are masked while preserving more pixels on the sharper edges along the longer side of the rectangle. This can mitigate the interference of partially blurred pixels, helping the model to reconstruct sharper super-resolution results and reduce the uneven resolution phenomenon more effectively. Additionally, ViT has a class token for classification, but since our task is image enhancement rather than classification, we do not use this token. This is another difference between our method and the original MAE. According to [37], even without the class token (with average pooling), the encoder can still work well.

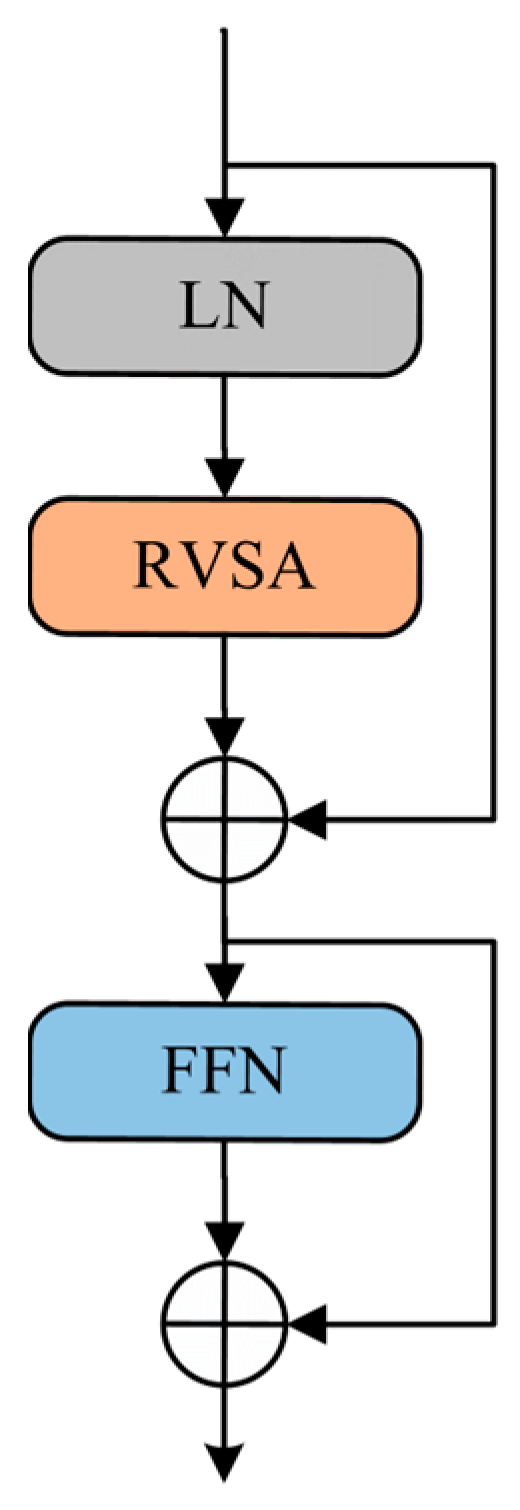
2.3.2. Rotated Varied-Size Window-Based Attention

Unlike convolution, which possesses a local inductive bias, Transformer can adopt a more global perspective and exploit correlations between pixels of images through the attention mechanism. This not only inherently resonates with the goal of leveraging high-resolution information in specific directions to enhance resolution along the shorter side of the rectangle but also facilitates the utilization of long-range dependencies in images captured by the RSA system. In order to reduce computational complexity, ViT mostly uses window-based attention that differs from standard global self-attention by employing both a local attention mechanism and a window transfer mechanism [40]. In window-based attention, the fundamental processing unit is the patch. The network first conducts a patch partition operation on the input image, which involves partitioning the input image into non-overlapping patches. Specifically, given an input X H × W × C of size H × W × C (where H, W, and C represent the width, height, and number of channels of the feature map, respectively), window-based attention first reshapes the input by partitioning it into M×M non-overlapping local windows, denoted as Χ H M × W M × M 2 × C , where H W M 2 is the total number of windows. For each window, the input features are denoted as Χ w M 2 × C , and thus, all input features can be represented as Χ w i i = 1 , , H W M 2 . Following this, standard multi-head self-attention is computed for each window. Let h denote the number of heads; the query, key and value matrices are represented by Q w , K w and V w , respectively:
Q w i ( j ) i = 1 , , H W M 2 , j = 1 , , h
K w i ( j ) i = 1 , , H W M 2 , j = 1 , , h
V w i ( j ) i = 1 , , H W M 2 , j = 1 , , h
where i indexes the window and j indexes the head.
The attention calculations are performed within each non-overlapping local window:
Z w i ( j ) = Attention Q w i ( j ) , K w i ( j ) , V w i ( j ) = softmax Q w i ( j ) K w i ( j ) C V w i ( j )
where Q w i ( j ) , K w i ( j ) , V w i ( j ) , Z w i ( j ) M 2 × C and C = C h .
Finally, the features are concatenated to restore the original input shape.
The original window-based attention operation employs a fixed window size that is always horizontal and vertical. Using the coordinates (xc, yc), (xl, yl), and (xr, yr) to represent the center, upper left, and lower right pixels of the window, respectively, we have:
x l y l x r y r = x c y c x c y c + x l r y l r x r r y r r
where x l r , y l r , x r r , and y r r denote the distance between the coordinates of the corner points and the coordinates of the center point, respectively.
It is well known that remote sensing images often contain various target objects with arbitrary orientations and different scales. Therefore, a fixed and unchangeable window is not an optimal design. Unlike the original window-based attention operations, RVSA (as shown in Figure 6) does not rely on fixed-size window partitions at a fixed orientation. Instead, it produces windows with different positions, sizes, shapes, and angles by adjusting learnable shift, scale, and rotation parameters (Ow, Sw, and Θ w , respectively). Specifically, distinct prediction layers can be employed for each window to estimate the shift, scale, and rotation parameters for key and value tokens, relying on the input features:
O w K , S w K , Θ w K = Linear K LeakyReLU GAP X w
O w V , S w V , Θ w V = Linear V LeakyReLU GAP X w
where GAP is the global average pooling operation.
Afterward, following the parameters mentioned earlier, the initial window undergoes transformation. The transformed coordinates of the corner points x l / r , y l / r are then calculated using the following formulas:
x l / r y l / r = x c y c + o x o y + cos θ sin θ sin θ cos θ x l / r r s x y l / r r s y
where ox, oy, sx, sy, and θ denote the shift, scale and rotation parameters. Namely, O w = o x , o y 1 , S w = s x , s y 1 , and Θ w = θ 1 .
Then, the key and value features are sampled from the transformed windows, which are then utilized to compute multi-head self-attention. As each head can generate windows with different positions, sizes, and shapes, RVSA is especially effective in extracting information from multiple target objects with diverse scales and orientations. In addition, RVSA not only reduces computational complexity linearly with respect to the image size, but also seamlessly integrates with the existing framework since the difference lies in the manner of attention calculation, which is parameter-free. Therefore, it is highly suitable for the image super-resolution of the RSA system.

2.4. Decoder

The decoder is also composed of rotated varied-size window-based attention blocks. Its input consists of the extracted features of visible tokens and mask tokens, where each mask token is a shared, learned vector that indicates the presence of a missing patch to be predicted. To enhance its suitability for the image super-resolution task, our decoder matches the depth (number of Transformer blocks) and width (number of channels) of the encoder.

2.5. Implementation and Training Details

We employ the “base” version of the ViT as both the encoder and decoder. Specifically, the encoder and decoder have a depth of 12 and a width of 1024 d, respectively. The head number, patch size, embedding dimension, and multilayer perceptron ratio are set to 12, 16, 768, and 4, respectively. Following the strategy proposed by [36,41], we use the original Vision Transformer blocks at the 3rd, 6th, 9th, and 12th layers, while utilizing the rotated varied-size window-based attention blocks with a window size of 7 for the remaining layers.
During pre-training, we set the masking ratio to 75%, which is the same as the original MAE. To facilitate masking the image, for each image taken at different rotation angles of the rectangular pupil, we rotate it to the direction of the short side of the rectangle, which is horizontal or vertical, and perform center cropping. Following the guidelines provided in [37], the default settings for both pre-training and fine-tuning can be found in Table 2. To calculate the loss, we use the Charbonnier loss function L = R G 2 + ε 2 , with G representing the ground-truth high-quality image and R representing the SR result. The value of ε is set at 1 × 10⁻³. All experiments were conducted on a workstation equipped with an Intel i9-12900K CPU and an NVIDIA RTX 4080 GPU, each with a memory size of 16GB. The model underwent training for a total of 400 epochs, with each epoch requiring approximately 97 min.

3. Results

3.1. Experimental Setup

To validate the effectiveness of the proposed method, two types of experiments were conducted: digital simulation and semi-physical imaging simulation. The digital simulation experiment utilized high-resolution remote sensing images as inputs. These images were downsampled, and a full-link digital approach was employed to simulate the degradation of imaging quality in the RSA system [44]. This simulation generated degraded images, which were then used for constructing datasets. Specifically, we obtained a total of 210 original scene images from the WorldView-3 satellite data. For each scene, we conducted 24 sets of image simulations, encompassing six aspect ratios ranging from 3 to 8, and four primary mirror rotation angles: 0°, 45°, 90°, and 135°. As a result, the dataset consisted of a total of 5040 images. Of these, 90% were allocated for the training set, totaling 4536 images. Figure 7 illustrates some of the target scenes and their degraded images obtained through the digital simulation method. These images demonstrate that the resolution of the images acquired by the RSA system varies significantly in different directions, as evidenced by the markings on the decks of naval vessels, the edges of shipping containers, airplanes, and square buildings.
In the semi-physical imaging simulation experiment, an imaging platform was utilized to simulate the RSA system’s imaging process for imaging target scenes or resolution targets [17]. The captured real images were used for testing purposes. Figure 8 displays the design scheme diagram, while Figure 9 displays the physical diagram.
As there are currently no other SISR methods specifically designed for the RSA system, we compared our proposed method with general SISR methods. These methods include SRGAN, EDSR, SRMD, and RealESRGAN, which are representative explicit methods that use external training datasets, DualSR, which is an explicit method that uses internal statistics of images, and FSSR, which is a representative implicit method.

3.2. Experimental Results

3.2.1. Quantitative Results

Table 3 presents a quantitative evaluation of the aforementioned methods, utilizing two quality metrics, namely, PSNR (Peak Signal-to-Noise Ratio) and SSIM (Structural Similarity) [45]. These metrics gauge the level of resemblance between two images. The table also includes the results obtained through bicubic interpolation for the purpose of comparison. It contains the super-resolution results for six different scenes, each with six different aspect ratios of the rectangular primary mirror. To provide a comprehensive overview, Table 4 and Figure 10 show the average results for all test images.

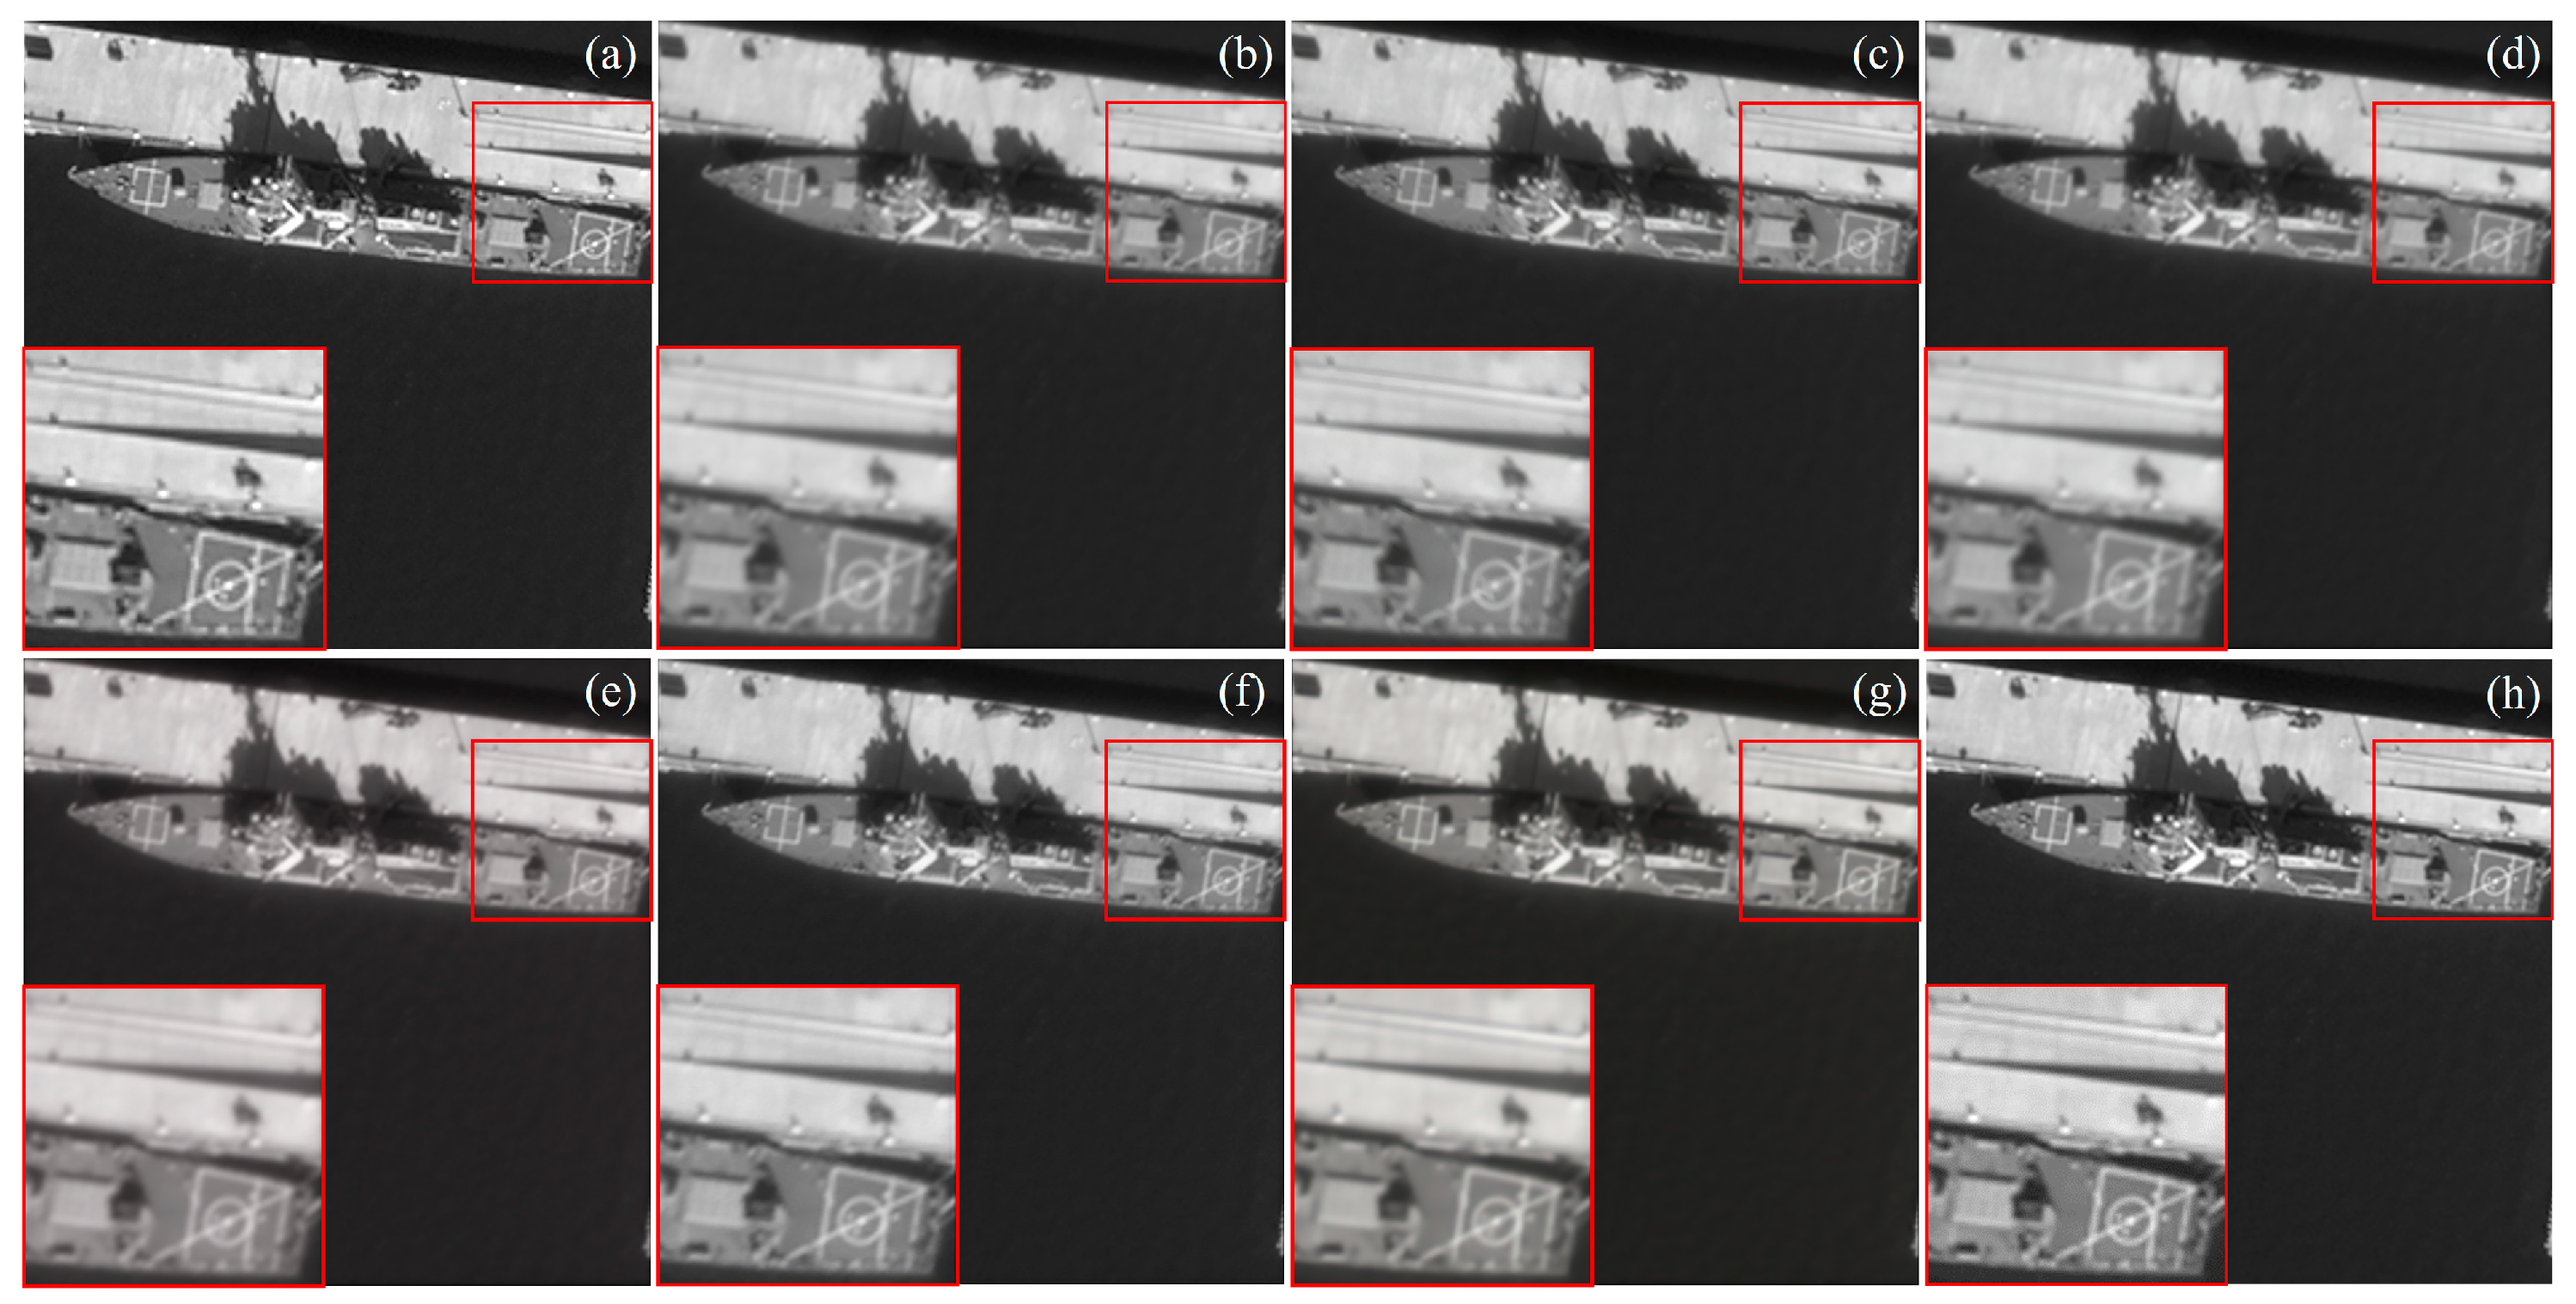
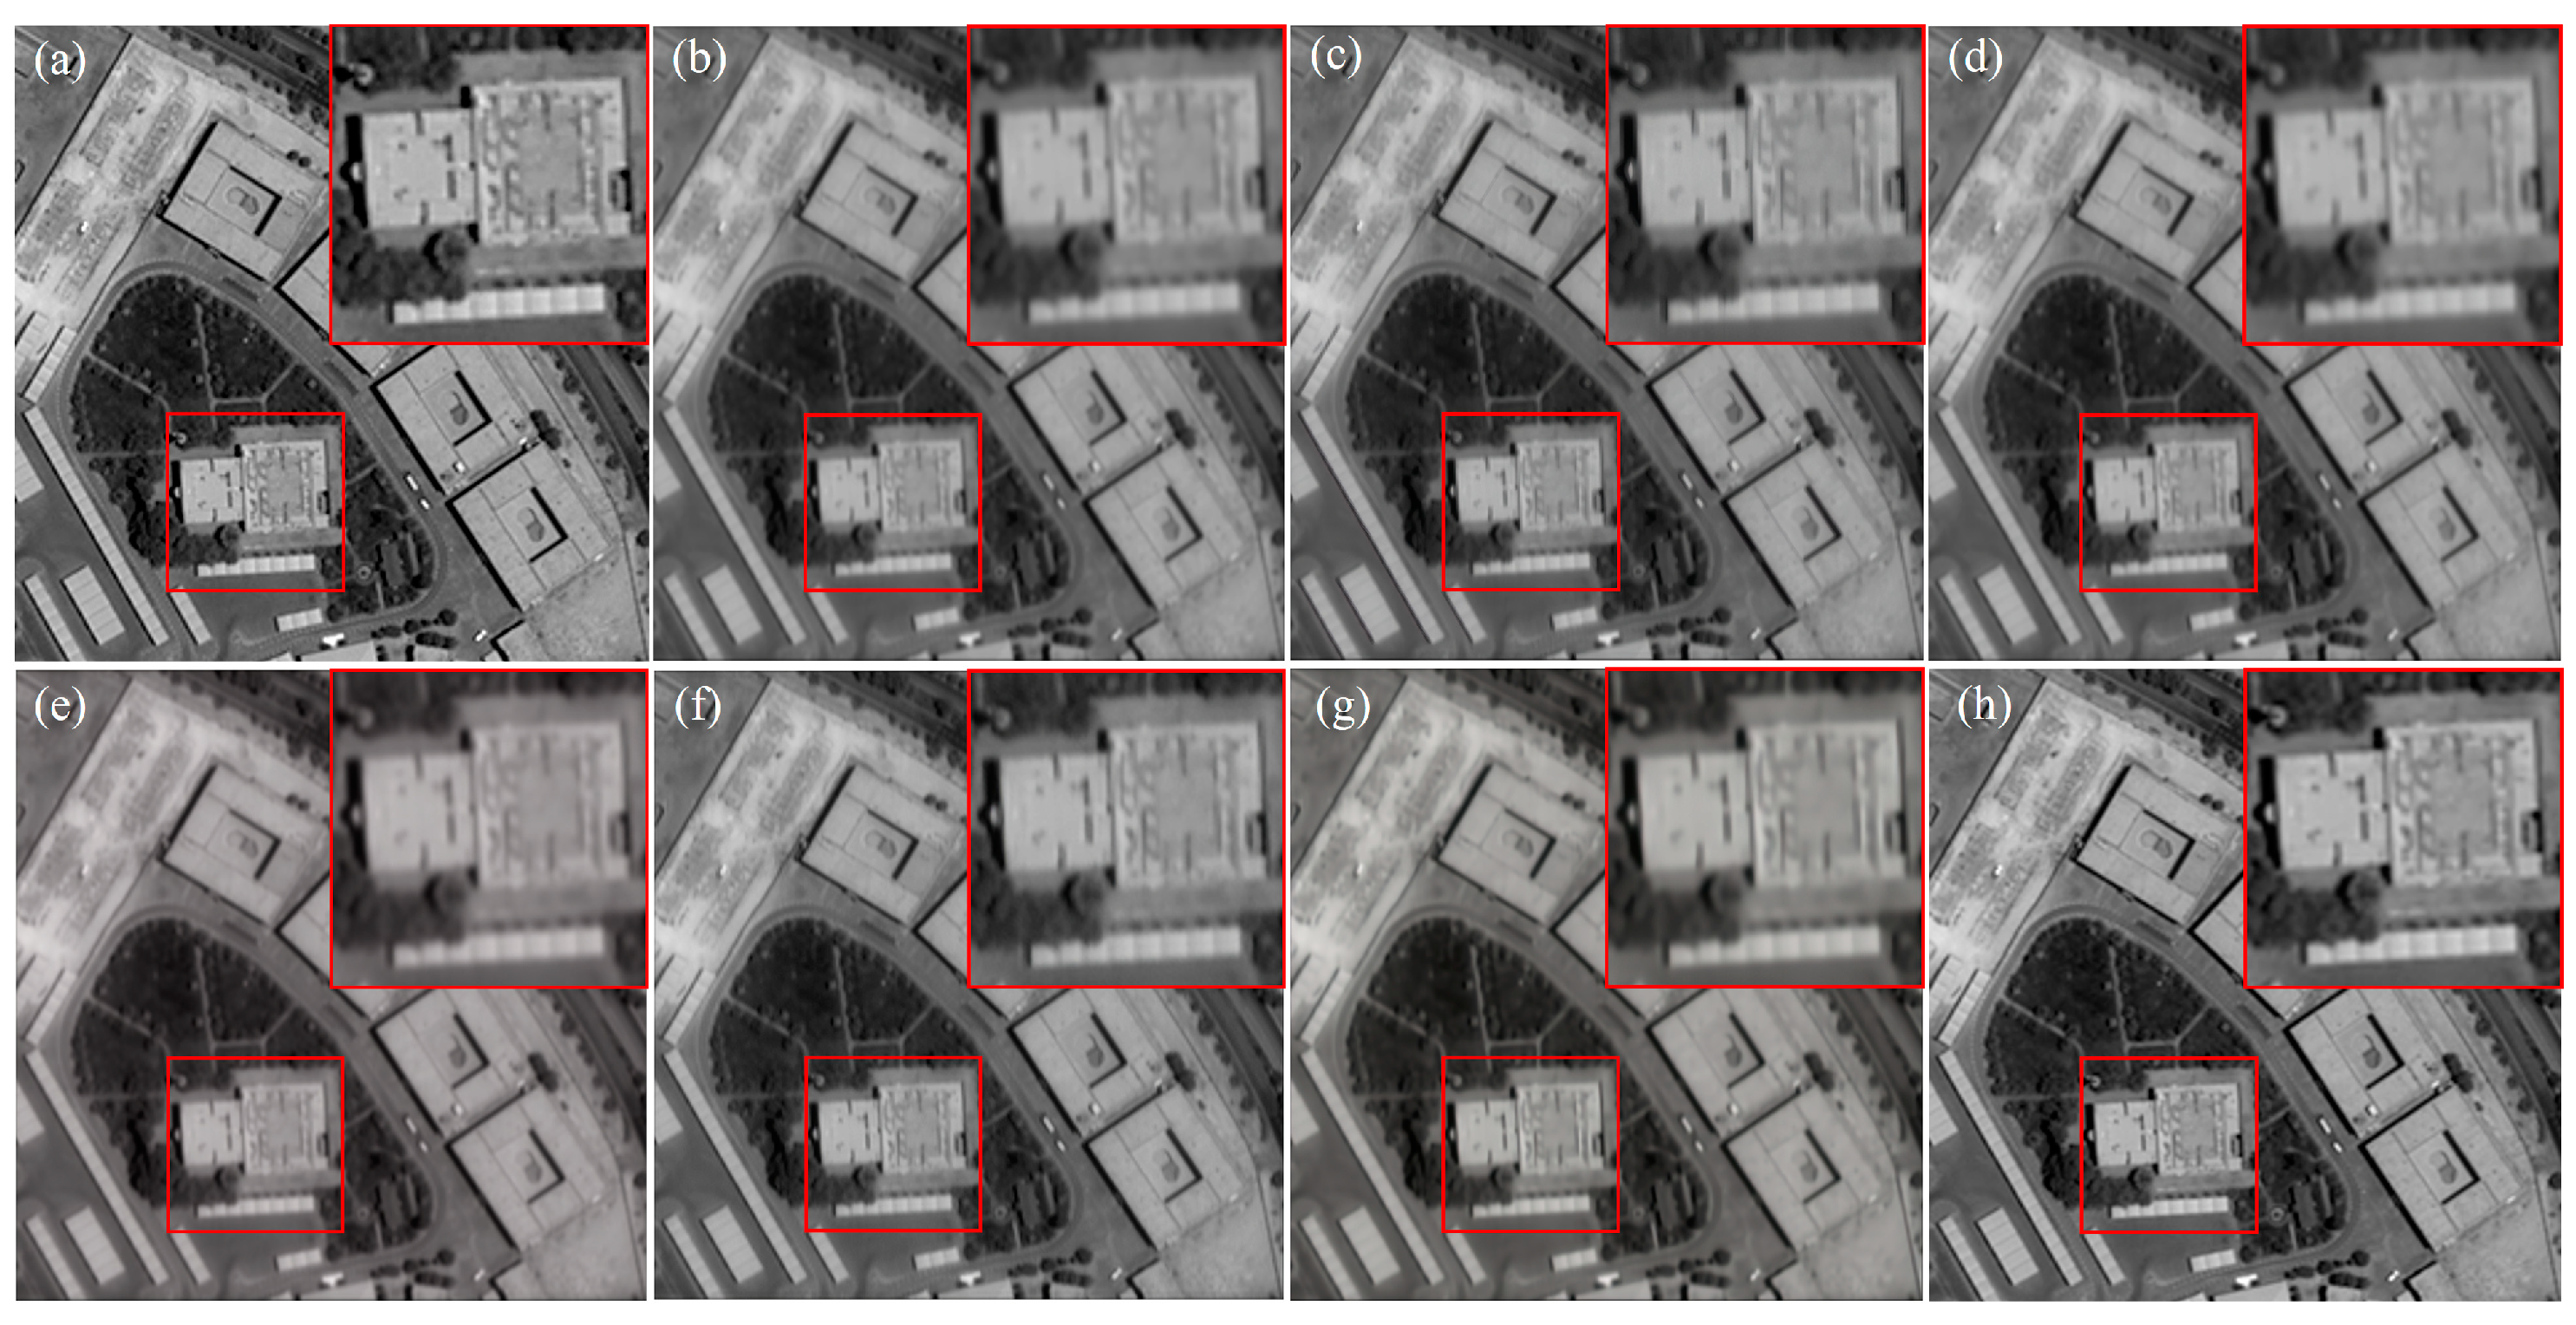
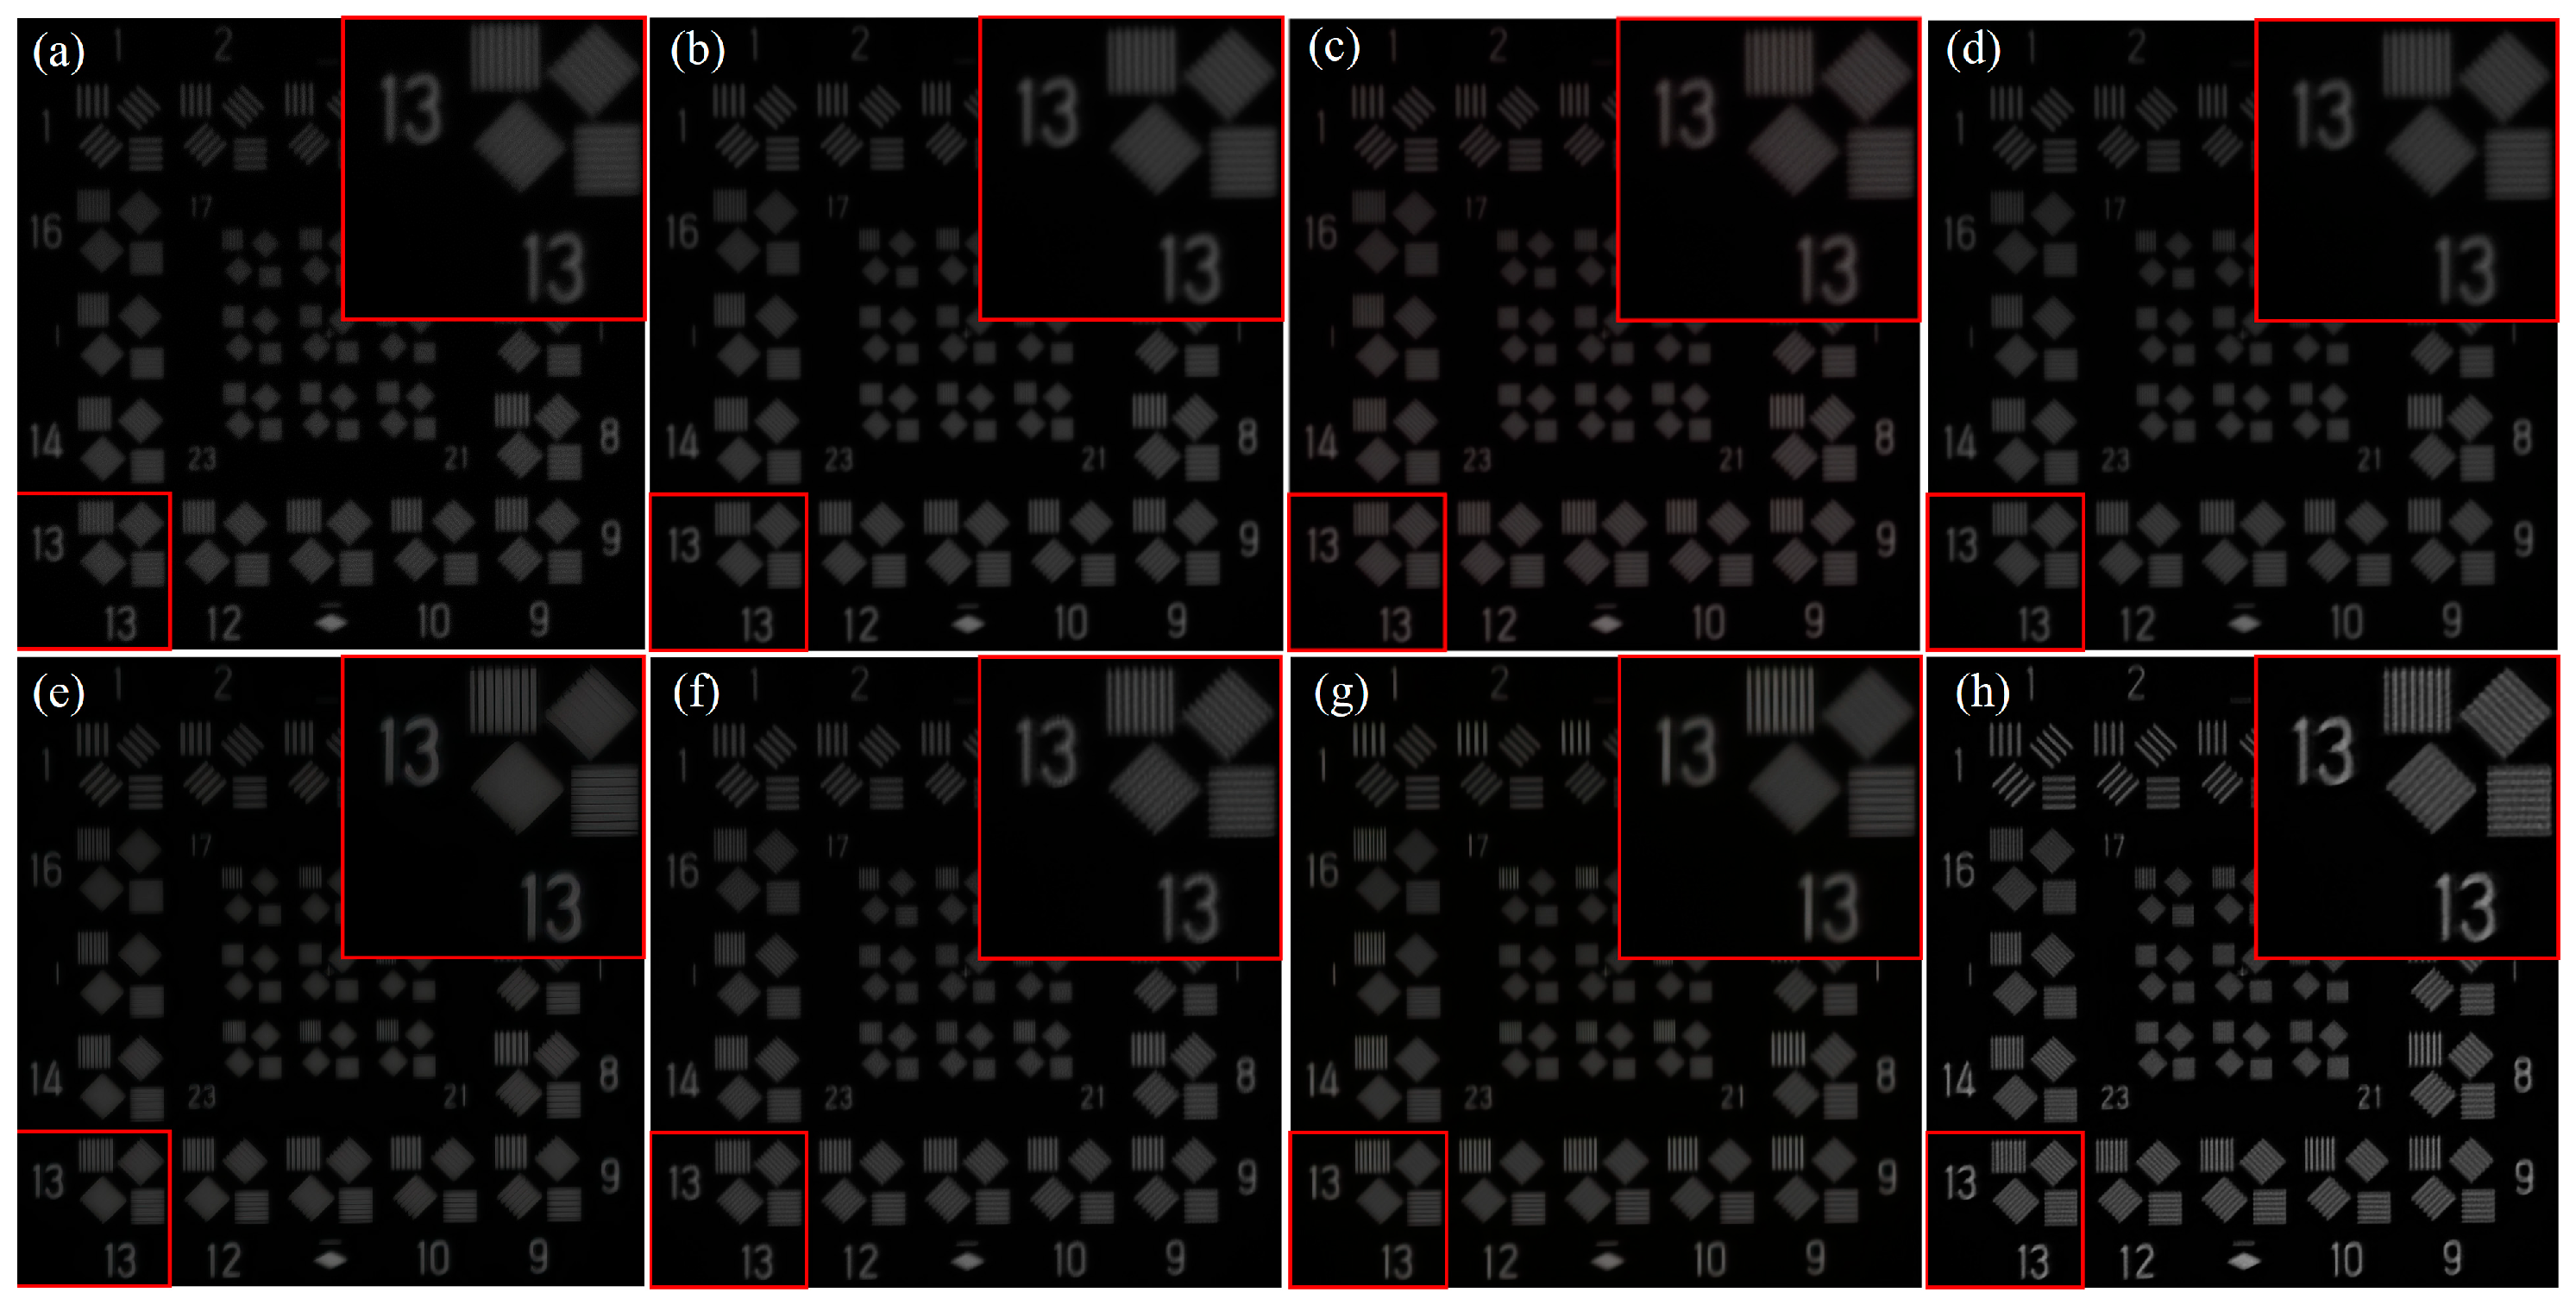
3.2.2. Qualitative Results

In addition to the quantitative evaluations provided by the full-reference metrics mentioned earlier, we present visual results as qualitative evaluations for the scenes depicted in Figure 7. Figure 11, Figure 12, Figure 13 and Figure 14 illustrate the super-resolution outcomes for SRGAN, EDSR, SRMD, real-ESRGAN, DualSR, FSSR, and the proposed method. Additionally, Figure 15 displays semi-physical imaging experimental images with a primary mirror aspect ratio of 3 and a rotation angle of 90. Specifically, the local enlargement image is shown in Figure 15a, while the SR results generated by SRGAN, EDSR, SRMD, real-ESRGAN, DualSR, FSSR, and the proposed method are displayed in Figure 15b–h, respectively.

3.2.3. Ablation Study

We compared two training methods: the “one-stage” method, which involves directly training on unmasked degraded images for 400 epochs, and the “two-stage” method, which involves first pre-training on images masked with strip-like masks along the direction of the rectangle’s short side for 360 epochs, followed by fine-tuning on the unmasked images for 40 epochs. Table 5 presents the results of the ablation study, which includes the average results of all target scenes with six different aspect ratios ranging from 3 to 8. The table also includes a comparison with the results obtained from randomly masked images for pre-training.

4. Discussion

The main objective of image super-resolution for the RSA system is to enhance the resolution in the direction of the shorter edge of the rectangular pupil. In contrast, the resolution of LR and HR in the longer edge direction is essentially the same. As such, experimental results demonstrate that a straightforward ViT model can produce outstanding results without requiring overly complex structures. Table 3 lists 36 sets of digital simulation test images of six scenes and six aspect ratios. The proposed method achieves the best performance in 33 sets of test images according to the PSNR metric and in 35 sets according to the SSIM metric. While DualSR outperforms the proposed method in some scenes, the proposed method yields significantly superior average results. For different aspect ratios of the primary mirror, the proposed method performs exceptionally well when the aspect ratio is 3, with a 26.31% improvement in PSNR and a 17.36% improvement in SSIM over bicubic interpolation. Similarly, when the aspect ratio of the primary mirror is 4 or 5, our proposed method achieves the best results and significantly outperforms other methods. Even when the aspect ratio of the primary mirror is 6, our super-resolution results still exhibit a PSNR of over 31dB, owing to the proposed method’s consideration of the imaging characteristics of the RSA system. However, the performance of the proposed method decreases when the aspect ratio is large (greater than or equal to 7). We attribute this issue to the high degree of blurriness that is prevalent along the shorter side of the rectangular pupil. Despite applying strip-shaped masking to the images, numerous blurred edges remain challenging to conceal. Hence, these blurred pixels may still impede the model’s super-resolution reconstruction.
From the visual results in Figure 11, Figure 12, Figure 13, Figure 14 and Figure 15, it is evident that each SR method tends to exhibit specific visual characteristics in the SR output, which can be classified into two categories. One category, exemplified by SRGAN and Real-ESRGAN, tends to generate smoother outputs with clearer visual effects, making them more robust against noise. However, these methods exhibit subpar performance on objective evaluation metrics. The other methods tend to produce sharper SR outputs. Furthermore, the visual results show that when the aspect ratio of the primary mirror is relatively large, the image quality along the shorter side is significantly reduced. Although some details can be restored, the SR results may still fall short of meeting the resolution requirements of interpretation applications. Compared to other methods, our proposed method exhibits reduced susceptibility to the adverse effects of non-uniform resolution and demonstrates a superior ability to reconstruct directions with low resolution in the image. This is particularly evident from the outcomes of our semi-physical imaging simulation experiments shown in Figure 15. In addition, the fact that the semi-physical experimental test image and the training image were obtained from different sensors also serves to demonstrate the robust generalization capability of our method.
The results of ablation experiments demonstrate the advantages of our “two-stage” training method. As shown in Table 5, the performance of the model pre-trained on randomly masked images is similar to that of the “one-stage” training method. However, our “two-stage” training method, which utilizes a strip-wise mask sampling strategy, improves the SSIM and PSNR by 0.91% and 1.68%, respectively, compared to the “one-stage” method. This outcome is expected because remote sensing images possess a significant amount of spatial redundancy, which means that even if some pixels are masked, deep neural networks are capable of extracting enough information from the images to infer complex and holistic reconstructions. Furthermore, as explained in Section 2.3.1, masking along the shorter side of the rectangle can help the model avoid interference from blurred pixels, resulting in reconstructed images that are sharper and clearer along the shorter edge.

5. Conclusions

In this paper, we conduct an analysis of the imaging characteristics of the RSA system and put forth a corresponding SISR method. Our proposed method employs an end-to-end image super-resolution network that is based on the rotated varied-size window-based attention mechanism. By utilizing window-based self-attention, this mechanism generates windows with varying locations, sizes, shapes, and angles. Such an approach proves advantageous in effectively processing objects with diverse orientations and scales in remote sensing images. To effectively handle the special asymmetric degradation characteristic of the RSA system, we employ a mask strategy using strip-wise masks along the short side of the rectangular primary mirror. On this basis, we adopt a two-stage training method that involves pre-training the model on masked images, followed by fine-tuning using unmasked images. This approach not only mitigates interference caused by the non-circular symmetry PSF but also enhances the network’s ability to make more effective use of the high-resolution information inherent in the remote sensing images themselves. Consequently, our network excels in reconstructing detailed and clear edges and textures in the direction of the shorter edge of the pupil. Extensive experiments are conducted, which include six aspect ratios of the primary mirror and six different SR methods, to demonstrate the superior performance of our proposed method. Specifically, our method outperforms other methods in objective evaluation for primary mirrors with aspect ratios ranging from 3 to 8, especially in terms of the PSNR metric. Furthermore, our method effectively addresses the issue of uneven resolution in SR results, showcasing its superiority in image interpretation applications. Through this research, we offer valuable guidance for the practical implementation of the RSA imaging technology, while also providing significant references for its future advancements.

Author Contributions

Conceptualization, Y.S. and S.J.; methodology, Y.S. and S.J.; software, Y.S. and T.S.; validation, X.Z. and S.J.; formal analysis, S.J. and T.S.; investigation, J.S. and J.Y.; resources, X.Z.; data curation, T.S. and J.Y.; writing—original draft preparation, Y.S. and S.W.; writing—review and editing, Y.S. and S.W.; visualization, Y.S. and J.S.; supervision, X.Z. and W.Z.; project administration, X.Z. and W.Z.; funding acquisition, X.Z. and S.J. All authors have read and agreed to the published version of the manuscript.

Funding

This research was funded by the National Natural Science Foundation of China (NSFC) (62305086, 62101160, and 61975043) and the China Postdoctoral Science Foundation (2023M740901).

Data Availability Statement

The datasets used or analyzed during the current study are available from the corresponding author upon reasonable request.

Conflicts of Interest

The authors declare no conflicts of interest.

References

  1. Yang, X.; Li, F.; Xin, L.; Lu, X.; Lu, M.; Zhang, N. An improved mapping with super-resolved multispectral images for geostationary satellites. Remote Sens. 2020, 12, 466. [Google Scholar] [CrossRef]
  2. Yao, L.; Liu, Y.; He, Y. A Novel Ship-Tracking Method for GF-4 Satellite Sequential Images. Sensors 2018, 18, 2007. [Google Scholar] [CrossRef]
  3. Kulkarni, S.C.; Rege, P.P. Pixel Level Fusion Techniques for SAR and Optical Images: A Review. Inf. Fusion 2020, 59, 13–29. [Google Scholar] [CrossRef]
  4. Yu, W.; You, H.; Lv, P.; Hu, Y.; Han, B. A Moving Ship Detection and Tracking Method Based on Optical Remote Sensing Images from the Geostationary Satellite. Sensors 2021, 21, 7547. [Google Scholar] [CrossRef] [PubMed]
  5. Zhang, Y.; Ye, M.; Zhu, G.; Liu, Y.; Guo, P.; Yan, J. FFCA-YOLO for Small Object Detection in Remote Sensing Images. IEEE Trans. Geosci. Remote Sens. 2024, 62, 5611215. [Google Scholar] [CrossRef]
  6. Zhao, J. Higher Temporal Evapotranspiration Estimation with Improved SEBS Model from Geostationary Meteorological Satellite Data. Sci. Rep. 2019, 9, 14981. [Google Scholar] [CrossRef] [PubMed]
  7. Wang, Y.; Zhang, C.; Guo, L.; Xu, S.; Ju, G. Decoupled Object-Independent Image Features for Fine Phasing of Segmented Mirrors Using Deep Learning. Remote Sens. 2022, 14, 4681. [Google Scholar] [CrossRef]
  8. Jikuya, I.; Uchida, D.; Kino, M.; Kurita, M.; Yamada, K. Development status of the segmented mirror control system in Seimei Telescope. In Advances in Optical and Mechanical Technologies for Telescopes and Instrumentation IV; SPIE: Montréal, QC, Canada, 2020; Volume 11451, pp. 965–973. [Google Scholar]
  9. Atcheson, P.; Domber, J.; Whiteaker, K.; Britten, J.A.; Dixit, S.N.; Farmer, B. MOIRE: Ground Demonstration of a Large Aperture Diffractive Transmissive Telescope; Oschmann, J.M., Clampin, M., Fazio, G.G., MacEwen, H.A., Eds.; SPIE: Montréal, QC, Canada, 2014; p. 91431W. [Google Scholar]
  10. Liu, D.; Wang, L.; Yang, W.; Wu, S.; Fan, B.; Wu, F. Stray Light Characteristics of the Diffractive Telescope System. Opt. Eng. 2018, 57, 1. [Google Scholar] [CrossRef]
  11. Peng, Y.; Fu, Q.; Amata, H.; Su, S.; Heide, F.; Heidrich, W. Computational Imaging Using Lightweight Diffractive-Refractive Optics. Opt. Express 2015, 23, 31393. [Google Scholar] [CrossRef]
  12. Tang, J.; Wang, K.; Ren, Z.; Zhang, W.; Wu, X.; Di, J.; Liu, G.; Zhao, J. RestoreNet: A deep learning framework for image restoration in optical synthetic aperture imaging system. Opt. Lasers Eng. 2021, 139, 106463. [Google Scholar] [CrossRef]
  13. Rai, M.R.; Rosen, J. Optical incoherent synthetic aperture imaging by superposition of phase-shifted optical transfer functions. Opt. Lett. 2021, 46, 1712–1715. [Google Scholar] [CrossRef] [PubMed]
  14. Wu, J.; Yang, F.; Cao, L. Resolution enhancement of long-range imaging with sparse apertures. Opt. Lasers Eng. 2022, 155, 107068. [Google Scholar] [CrossRef]
  15. Sun, Y.; Zhi, X.; Jiang, S.; Fan, G.; Yan, X.; Zhang, W. Image Fusion for the Novelty Rotating Synthetic Aperture System Based on Vision Transformer. Inf. Fusion 2024, 104, 102163. [Google Scholar] [CrossRef]
  16. Zhi, X.; Jiang, S.; Zhang, L.; Wang, D.; Hu, J.; Gong, J. Imaging mechanism and degradation characteristic analysis of novel rotating synthetic aperture system. Opt. Lasers Eng. 2021, 139, 106500. [Google Scholar] [CrossRef]
  17. Sun, Y.; Zhi, X.; Zhang, L.; Jiang, S.; Shi, T.; Wang, N.; Gong, J. Characterization and Experimental Verification of the Rotating Synthetic Aperture Optical Imaging System. Sci. Rep. 2023, 13, 17015. [Google Scholar] [CrossRef]
  18. Zhi, X.; Jiang, S.; Zhang, L.; Hu, J.; Yu, L.; Song, X.; Gong, J. Multi-frame image restoration method for novel rotating synthetic aperture imaging system. Results Phys. 2021, 23, 103991. [Google Scholar] [CrossRef]
  19. Gendy, G.; He, G.; Sabor, N. Lightweight Image Super-Resolution Based on Deep Learning: State-of-the-Art and Future Directions. Inf. Fusion 2023, 94, 284–310. [Google Scholar] [CrossRef]
  20. Xiao, Y.; Yuan, Q.; Jiang, K.; He, J.; Wang, Y.; Zhang, L. From Degrade to Upgrade: Learning a Self-Supervised Degradation Guided Adaptive Network for Blind Remote Sensing Image Super-Resolution. Inf. Fusion 2023, 96, 297–311. [Google Scholar] [CrossRef]
  21. Wei, S.; Cheng, H.; Xue, B.; Shao, X.; Xi, T. Low-Cost and Simple Optical System Based on Wavefront Coding and Deep Learning. Appl. Opt. 2023, 62, 6171. [Google Scholar] [CrossRef]
  22. Freeman, W.T.; Jones, T.R.; Pasztor, E.C. Example-based super-resolution. IEEE Comput. Graph. Appl. 2002, 22, 56–65. [Google Scholar] [CrossRef]
  23. Liu, A.; Liu, Y.; Gu, J.; Qiao, Y.; Dong, C. Blind image super-resolution: A survey and beyond. IEEE Trans. Pattern Anal. Mach. Intell. 2022, 45, 5461–5480. [Google Scholar] [CrossRef] [PubMed]
  24. Chen, H. Real-World Single Image Super-Resolution: A Brief Review. Inf. Fusion 2022, 79, 124–145. [Google Scholar] [CrossRef]
  25. Lepcha, D.C.; Goyal, B.; Dogra, A.; Goyal, V. Image Super-Resolution: A Comprehensive Review, Recent Trends, Challenges and Applications. Inf. Fusion 2023, 91, 230–260. [Google Scholar] [CrossRef]
  26. Ledig, C.; Theis, L.; Huszár, F.; Caballero, J.; Cunningham, A.; Acosta, A.; Aitken, A.; Tejani, A.; Totz, J.; Wang, Z.; et al. Photo-realistic single image super-resolution using a generative adversarial network. In Proceedings of the IEEE Conference on Computer Vision and Pattern Recognition, Honolulu, HI, USA, 21–26 July 2017; pp. 4681–4690. [Google Scholar]
  27. Lim, B.; Son, S.; Kim, H.; Nah, S.; Mu Lee, K. Enhanced deep residual networks for single image super-resolution. In Proceedings of the IEEE Conference on Computer Vision and Pattern Recognition Workshops, Honolulu, HI, USA, 21–26 July 2017; pp. 136–144. [Google Scholar]
  28. Zhang, K.; Zuo, W.; Zhang, L. Learning a single convolutional super-resolution network for multiple degradations. In Proceedings of the IEEE Conference on Computer Vision and Pattern Recognition, Salt Lake City, UT, USA, 18–23 June 2018; pp. 3262–3271. [Google Scholar]
  29. Wang, X.; Xie, L.; Dong, C.; Shan, Y. Real-esrgan: Training real-world blind super-resolution with pure synthetic data. In Proceedings of the IEEE/CVF International Conference on Computer Vision, Montreal, BC, Canada, 11–17 October 2021; pp. 1905–1914. [Google Scholar]
  30. Bell-Kligler, S.; Shocher, A.; Irani, M. Blind super-resolution kernel estimation using an internal-gan. arXiv 2019, arXiv:1909.06581. [Google Scholar]
  31. Emad, M.; Peemen, M.; Corporaal, H. Dualsr: Zero-shot dual learning for real-world super-resolution. In Proceedings of the IEEE/CVF Winter Conference on Applications of Computer Vision, Waikoloa, HI, USA, 3–8 January 2021; pp. 1630–1639. [Google Scholar]
  32. Kim, J.; Jung, C.; Kim, C. Dual back-projection-based internal learning for blind super-resolution. IEEE Signal Process. Lett. 2020, 27, 1190–1194. [Google Scholar] [CrossRef]
  33. Yuan, Y.; Liu, S.; Zhang, J.; Zhang, Y.; Dong, C.; Lin, L. Unsupervised image super-resolution using cycle-in-cycle generative adversarial networks. In Proceedings of the IEEE Conference on Computer Vision and Pattern Recognition Workshops, Salt Lake City, UT, USA, 18–22 June 2018; pp. 701–710. [Google Scholar]
  34. Fritsche, M.; Gu, S.; Timofte, R. Frequency separation for real-world super-resolution. In Proceedings of the 2019 IEEE/CVF International Conference on Computer Vision Workshop (ICCVW), Seoul, Republic of Korea, 27–28 October 2019; pp. 3599–3608. [Google Scholar]
  35. Dosovitskiy, A.; Beyer, L.; Kolesnikov, A.; Weissenborn, D.; Zhai, X.; Unterthiner, T.; Dehghani, M.; Minderer, M.; Heigold, G.; Gelly, S.; et al. An image is worth 16 × 16 words: Transformers for image recognition at scale. arXiv 2020, arXiv:2010.11929. [Google Scholar]
  36. Wang, D.; Zhang, Q.; Xu, Y.; Zhang, J.; Du, B.; Tao, D.; Zhang, L. Advancing plain vision transformer towards remote sensing foundation model. IEEE Trans. Geosci. Remote Sens. 2022, 61, 5607315. [Google Scholar] [CrossRef]
  37. He, K.; Chen, X.; Xie, S.; Li, Y.; Dollár, P.; Girshick, R. Masked autoencoders are scalable vision learners. In Proceedings of the IEEE/CVF Conference on Computer Vision and Pattern Recognition, New Orleans, LA, USA, 18–24 June 2022; pp. 16000–16009. [Google Scholar]
  38. Shi, W.; Caballero, J.; Huszár, F.; Totz, J.; Aitken, A.P.; Bishop, R.; Rueckert, D.; Wang, Z. Real-Time Single Image and Video Super-Resolution Using an Efficient Sub-Pixel Convolutional Neural Network. In Proceedings of the IEEE Conference on Computer Vision and Pattern Recognition, Las Vegas, NV, USA, 26 June–1 July 2016; pp. 1874–1883. [Google Scholar]
  39. Ba, J.L.; Kiros, J.R.; Hinton, G.E. Layer normalization. arXiv 2016, arXiv:1607.06450. [Google Scholar]
  40. Liu, Z.; Lin, Y.; Cao, Y.; Hu, H.; Wei, Y.; Zhang, Z.; Lin, S.; Guo, B. Swin transformer: Hierarchical vision transformer using shifted windows. In Proceedings of the IEEE/CVF International Conference on Computer Vision, Montreal, BC, Canada, 11–17 October 2021; pp. 10012–10022. [Google Scholar]
  41. Li, Y.; Mao, H.; Girshick, R.; He, K. Exploring plain vision transformer backbones for object detection. In Proceedings of the Computer Vision–ECCV 2022: 17th European Conference, Tel Aviv, Israel, 23–27 October 2022; Proceedings, Part IX. Springer Nature: Cham, Switzerland, 2022; pp. 280–296. [Google Scholar]
  42. Loshchilov, I.; Hutter, F. Decoupled weight decay regularization. arXiv 2017, arXiv:1711.05101. [Google Scholar]
  43. Loshchilov, I.; Hutter, F. Sgdr: Stochastic gradient descent with warm restarts. arXiv 2016, arXiv:1608.03983. [Google Scholar]
  44. Sun, Y.; Zhi, X.; Jiang, S.; Gong, J.; Shi, T.; Wang, N. Imaging Simulation Method for Novel Rotating Synthetic Aperture System Based on Conditional Convolutional Neural Network. Remote Sens. 2023, 15, 688. [Google Scholar] [CrossRef]
  45. Wang, Z.; Bovik, A.C.; Sheikh, H.R.; Simoncelli, E.P. Image quality assessment: From error visibility to structural similarity. IEEE Trans. Image Process. 2004, 13, 600–612. [Google Scholar] [CrossRef] [PubMed]
Figure 1. Imaging principle of the rotating synthetic aperture (RSA) system. Blue arrows represent the coordinate axes of the detector plane, while black arrows indicate the rotation of the pupil.
Remotesensing 16 01508 g001
Figure 2. Rectangular pupils with different rotation angles and their point spread functions: 0°, 45°, 90°, and 135°, from left to right.
Remotesensing 16 01508 g002
Figure 3. Overall framework of pre-training and fine-tuning. Different colors are used to distinguish between various modules and their outputs, while varying shades are employed to delineate the features extracted from different patches.
Remotesensing 16 01508 g003
Figure 4. The structures of the rotated varied-size window-based attention block. It includes layer normalization (LN) [39], rotated varied-size multi-head attention (RVSA), and a feed-forward network (FFN).
Remotesensing 16 01508 g004
Figure 5. Explanation of mask sampling strategy.
Remotesensing 16 01508 g005
Figure 6. Illustration of rotated varied-size multi-head attention.
Remotesensing 16 01508 g006
Figure 7. (a) Target scenes; (b) degraded images with different rotation angles, from left to right, corresponding to rotation angles of 0°, 45°, 90°, and 135°.
Remotesensing 16 01508 g007
Figure 8. Design scheme of the imaging experiment platform.
Remotesensing 16 01508 g008
Figure 9. (a) Semi-physical imaging experiment platform; (b) rectangular pupil optical elements; (c) the primary mirror with a rectangular pupil optical element [44].
Remotesensing 16 01508 g009
Figure 10. Average super-resolution results. (a) PSNR; (b) SSIM.
Remotesensing 16 01508 g010
Figure 11. HR and SR results of the test image harbor with a rotation angle of 45° and an aspect ratio of 3. (a) HR; (b) SRGAN; (c) EDSR; (d) SRMD; (e) real-ESRGAN; (f) DualSR; (g) FSSR; and (h) proposed method.
Remotesensing 16 01508 g011
Figure 12. HR and SR results of the test image residential area with a rotation angle of 90° and an aspect ratio of 4. (a) HR; (b) SRGAN; (c) EDSR; (d) SRMD; (e) real-ESRGAN; (f) DualSR; (g) FSSR; and (h) proposed method.
Remotesensing 16 01508 g012
Figure 13. HR and SR results of the test image yard with a rotation angle of 0° and an aspect ratio of 5. (a) HR; (b) SRGAN; (c) EDSR; (d) SRMD; (e) real-ESRGAN; (f) DualSR; (g) FSSR; and (h) proposed method.
Remotesensing 16 01508 g013
Figure 14. HR and SR results of the test image airport with a rotation angle of 135° and an aspect ratio of 6. (a) HR; (b) SRGAN; (c) EDSR; (d) SRMD; (e) real-ESRGAN; (f) DualSR; (g) FSSR; and (h) proposed method.
Remotesensing 16 01508 g014
Figure 15. LR and SR results of the semi-physical experimental image with a rotation angle of 0° and an aspect ratio of 3. (a) LR; (b) SRGAN; (c) EDSR; (d) SRMD; (e) real-ESRGAN; (f) DualSR; (g) FSSR; and (h) proposed method.
Remotesensing 16 01508 g015
Table 1. Overview of deep learning-based single-image super-resolution methods.
MethodGeneral MeaningType
SRGAN [26]Generative adversarial networks for image super-resolutionExplicit methods rely on external training datasets
EDSR [27]Enhanced deep residual networks for image super-resolution
SRMD [28]Image super-resolution networks for multiple degradations
Real-ESRGAN [29]Real-world enhanced super-resolution generative adversarial networks
KernelGAN [30]Generative adversarial networks for kernel estimationExplicit methods rely on internal statistics
DualSR [31]Dual learning for image super-resolution
DBPI [32]Dual back-projection-based internal learning
CinCGAN [33]Cycle-in-cycle generative adversarial networks for image super-resolutionImplicit methods
FSSR [34]Frequency separation for image super-resolution
Table 2. Training settings.
ConfigPre-trainingFine-Tuning
OptimizerAdamW [42]
Base Learning Rate1.5 × 10−41 × 10−3
Weight Decay0.05
Optimizer Momentum β 1 = 0.9 ,   β 2 = 0.95 β 1 = 0.9 ,   β 2 = 0.999
Batch Size25664
Learning Rate ScheduleCosine Decay [43]
Table 3. Super-resolution results. The unit of PSNR is decibel (dB). The best result for each scene type and aspect ratio is highlighted in bold font.
Scene TypeMethodAspect Ratio 3Aspect Ratio 4Aspect Ratio 5Aspect Ratio 6Aspect Ratio 7Aspect Ratio 8
PSNRSSIMPSNRSSIMPSNRSSIMPSNRSSIMPSNRSSIMPSNRSSIM
AirportsBicubic28.630.816027.680.799226.870.783326.090.767725.730.760825.150.7505
SRGAN32.460.902231.410.880230.460.857329.370.835828.820.823728.070.8084
EDSR32.570.919531.520.898130.540.878229.420.855528.890.845528.020.8263
SRMD32.470.922831.310.902730.360.884129.460.866029.040.858028.370.8462
Real-ESRGAN32.680.905431.790.882930.770.857029.550.827328.890.813628.040.7952
DualSR34.220.951732.680.929431.220.904430.020.881229.490.870928.660.8553
FSSR32.280.910531.070.892630.130.876329.250.860328.850.853228.200.8427
Proposed35.960.958434.680.938432.240.914230.400.882729.310.874528.800.8554
HarborsBicubic27.980.835126.770.819326.050.807325.410.798224.990.791424.490.7847
SRGAN31.370.933330.110.915629.270.899728.590.889128.060.880627.530.8732
EDSR31.400.940930.170.923329.260.907028.620.895828.160.890727.610.8816
SRMD31.770.944030.300.925329.440.911128.700.900728.200.892827.630.8851
Real-ESRGAN30.650.918729.480.901528.720.884028.020.872327.600.864027.050.8560
DualSR34.550.966831.890.943830.540.925229.450.912328.820.902828.120.8936
FSSR32.650.943330.880.925329.840.910929.020.900928.470.893227.850.8857
Proposed36.380.971234.590.954431.790.931230.570.913229.390.904328.550.8941
Residential areasBicubic28.420.803127.690.785326.550.763625.810.743625.370.732624.840.7219
SRGAN31.590.884430.590.866929.810.839429.020.818128.310.816827.730.8055
EDSR31.920.894831.040.878430.140.847229.300.827028.740.821328.070.7993
SRMD32.230.909531.340.888030.010.862629.140.839328.630.826728.010.8143
Real-ESRGAN32.150.883931.320.854729.850.811328.730.779428.040.759227.220.7382
DualSR33.920.945532.730.921630.850.889229.670.858329.030.842828.320.8279
FSSR32.100.900631.140.880729.880.857929.000.836228.490.824327.890.8128
Proposed36.360.955734.850.940831.830.902630.350.867929.520.849928.480.8316
YardsBicubic27.190.814326.310.798725.500.783324.670.767724.440.762924.030.7563
SRGAN30.670.914029.750.893728.960.871527.860.841527.600.845326.890.8268
EDSR30.730.913329.800.897829.010.878627.900.852127.650.846727.040.8342
SRMD30.860.921229.800.902528.840.884727.870.866627.600.861227.120.8535
Real-ESRGAN30.220.890229.440.869228.810.849427.580.819327.330.813026.580.7963
DualSR32.680.946727.770.912429.670.900628.540.880828.140.873627.580.8641
FSSR31.370.914530.110.896929.060.880628.010.864227.700.859027.200.8519
Proposed35.630.962133.470.939530.870.915529.180.883628.460.875628.140.8684
FarmlandBicubic32.600.855631.350.847230.740.842629.930.836729.190.831928.710.8285
SRGAN36.330.958634.900.950534.250.945533.350.938932.580.934432.060.9309
EDSR36.700.962035.220.953434.490.947233.540.940632.820.936032.250.9326
SRMD37.050.965135.520.955334.810.950033.850.943232.980.937632.420.9338
Real-ESRGAN31.730.847331.710.837631.280.830830.210.822129.270.811028.750.8076
DualSR37.430.971735.780.961034.910.953333.880.946633.000.941032.460.9373
FSSR35.620.952234.290.945833.690.941132.850.934632.180.931131.700.9280
Proposed38.850.976637.050.964535.660.959033.250.948333.340.943031.920.9292
ForestsBicubic30.300.798529.380.777228.700.761227.850.740927.240.727127.100.7237
SRGAN33.470.873931.950.844631.070.825229.980.800829.240.783529.050.7788
EDSR33.650.882832.690.853331.920.829930.950.803730.140.780329.900.7706
SRMD34.340.904533.220.879132.430.860131.430.836430.730.820430.570.8164
Real-ESRGAN32.960.861032.150.827631.410.799830.470.771029.550.740229.220.7248
DualSR36.650.949334.520.912033.440.889232.120.860731.250.839931.000.8340
FSSR33.500.879732.560.860431.900.845931.010.826530.370.812930.220.8100
Proposed38.040.953036.330.931334.480.900532.390.865031.500.842731.190.8341
Table 4. Average super-resolution results. The unit of PSNR is decibel (dB). The best result is highlighted in bold font.
Scene TypeMethodAspect Ratio 3Aspect Ratio 4Aspect Ratio 5Aspect Ratio 6Aspect Ratio 7Aspect Ratio 8
PSNRSSIM PSNRSSIM PSNRSSIM PSNRSSIM PSNRSSIM PSNRSSIM
AverageBicubic29.190.820428.200.804527.400.790226.630.775826.160.767825.720.7609
SRGAN32.650.911131.450.891930.640.873129.700.854029.100.847428.550.8373
EDSR32.830.918931.740.900730.890.881329.950.862429.400.853428.640.8408
SRMD33.120.927831.910.908830.980.892130.070.875429.530.866129.020.8582
Real-ESRGAN31.730.884430.980.862230.140.838729.090.815228.450.800227.810.7864
DualSR34.910.955332.560.930031.770.910330.610.890029.950.878529.360.8687
FSSR32.920.916831.680.900330.750.885429.860.870529.340.862328.850.8552
Proposed36.870.962835.160.944832.810.920531.020.893530.250.881729.510.8688
Table 5. Ablation study on the three training methods. The unit of PSNR is decibel (dB).
Training MethodOne-StageTwo-Stage-Random MaskTwo-Stage-Strip Mask
PSNR32.0731.9132.61
SSIM0.90380.90240.9120
Disclaimer/Publisher’s Note: The statements, opinions and data contained in all publications are solely those of the individual author(s) and contributor(s) and not of MDPI and/or the editor(s). MDPI and/or the editor(s) disclaim responsibility for any injury to people or property resulting from any ideas, methods, instructions or products referred to in the content.

