
A New Extended Target Detection Method Based on the Maximum Eigenvalue of the Hermitian Matrix


College of Electronic Science, National University of Defense Technology, Changsha 410073, China
*
Author to whom correspondence should be addressed.
Remote Sens. 2024, 16(9), 1488; https://0-doi-org.brum.beds.ac.uk/10.3390/rs16091488
Submission received: 9 February 2024
/
Revised: 16 April 2024
/
Accepted: 18 April 2024
/
Published: 23 April 2024
Abstract
:In the field of radar target detection, the conventional approach is to employ the range profile energy accumulation method for detecting extended targets. However, this method becomes ineffective when dealing with non-stationary and non-uniform radar clutter scenarios, as well as long-distance targets with weak radar cross sections (RCSs). In such cases, the signal-to-noise ratio (SNR) of the target echo is severely degraded, rendering the energy accumulation detection algorithm unreliable. To address this issue, this paper presents a new extended target detection method based on the maximum eigenvalue of the Hermitian matrix. This method utilizes a detection model that incorporates observed data and employs the likelihood ratio test (LRT) theory to derive the maximum eigenvalue detector at low SNR. Specifically, the detector constructs a matrix using a sliding window block with the available data and then computes the maximum eigenvalue of the covariance matrix. Subsequently, the maximum eigenvalue matrix is transformed into a one-dimensional eigenvalue image, enabling extended target detection through analogy with the energy accumulation detection method. Furthermore, this paper analyzes the proposed extended target detection method from both theoretical and experimental perspectives, validating it through field-measured data. The results obtained from the measured data demonstrate that the method effectively enhances the SNR in low SNR conditions, thereby improving target detection performance. Additionally, the method exhibits robustness across different scattering center targets.
1. Introduction
In high-resolution radar, bandwidth is a key factor affecting radar range resolution [1,2,3,4]. Since the radar range resolution is inversely proportional to the bandwidth, when the radar bandwidth increases to a certain extent, the size of the target is much larger than the range resolution of the radar. The target echo is displayed as a collection of multiple scattering centers in the radar echo, so the target is called an extended target in high-resolution radar [5,6]. Compared with the point target in narrowband radar, the signal of the extended target contains more abundant and fine target structure information. Therefore, how to improve the resolution of radar has always been an important subject and direction in radar technology development [7,8,9,10].
High-resolution radar needs to generate large bandwidth, which poses challenges to radar equipment. Stepped-frequency synthetic wideband radar has attracted much attention due to its advantages of anti-clutter, small instantaneous bandwidth, low hardware requirements, and easy waveform design. Compared with traditional low-resolution radar and conventional wideband radar, stepped-frequency synthetic wideband radar is of great significance in the development of modern wideband radar signals and has become a hot research direction [11,12,13,14,15].
In stepped-frequency synthetic wideband radar, the common technique for detecting targets is to reconstruct a high-resolution range profile (HRRP) in different coarse range resolution units by inverse discrete Fourier transform (IDFT) [16,17,18]. The HRRP sample reflects the distribution of the radar cross-sectional area of the scatterer on the target along the direction of the radar line of sight at a certain radar angle of view. However, in the process of synthesizing high resolution, there are two main problems, namely, oversampling redundancy and distance mismatch redundancy. Distance mismatch redundancy will lead to distance migration, thus reducing the ranging accuracy. The oversampling redundancy increases the false alarm rate, which adversely impacts the subsequent target detection and recognition processes. To solve these problems, researchers have conducted in-depth analysis and discussion in the literature and proposed some extraction algorithms for one-dimensional range profiles of targets, such as the abandonment method and the same distance selection method, to extract effective information about targets in radar echoes. These range profile extraction methods are mainly applied to the stationary target in the background of ground clutter or the relatively stationary scene with high-speed measurement accuracy. Through these methods, the range profile of the target can be effectively extracted, thus providing a basis for subsequent target detection and recognition tasks. However, in practical applications, these methods still need to be further studied and improved to adapt to complex situations in different scenarios and improve the performance and reliability of radar systems.
Due to the particularity of the signal of stepped-frequency wideband radar, the extended target detection of stepped-frequency radar is closely related to the range profile extraction of the target [16,17,18,19,20,21]. At present, the range spread target detection method of stepped frequency radar is mainly divided into two categories: one is the detection algorithm after range profile extraction, and the other is the detection algorithm before range profile extraction. In engineering experiments, since the detection method after range profile extraction is easy to implement in engineering, most studies tend to extract the range profile of the target first, and then perform range-extended target detection on the one-dimensional range profile. The advantage of this method is that the effective information of the target can be extracted by distance image extraction, which reduces the amount of redundant data to be processed and improves detection efficiency [22,23,24].
Stepped-frequency radar usually adopts a down-looking mode in target detection. For ground stationary targets under strong ground clutter conditions, the detection area is mainly located in the main clutter area of the radar. When the radar detects the ground target, in addition to the need to counter the noise, it also needs to deal with the interference from the strong ground clutter. In the process of target detection, long-distance targets with weak RCSs significantly reduce the signal-to-noise ratio of the target echo, which makes the traditional extended target detection algorithm based on radar one-dimensional range profile energy invalid [25,26]. Therefore, in order to solve this problem, it is necessary to study a new radar target detection algorithm to improve the signal-to-clutter ratio.
Due to the non-uniformity and non-stationarity of strong ground clutter, the decimation of stepped-frequency radar to form a one-dimensional range profile radar extended target fails. Because the maximum eigenvalue of the covariance matrix is a good characterization of radar signal energy and correlation, Wenjing Zhao [27] proposed a cascade algorithm that combined sub-band decomposition with an eigenvalue-based detection scheme, but this method is only effective for moving targets on the sea surface. Yuan Jiang [28] proposed a modified scaled largest eigenvalue detector for static homogenous ground clutter that uses a set of secondary data; however, this method requires the clutter to have the same distribution as the clutter primarily assumed to be available. To solve these problems, in the case that the speed of the radar moving platform is well compensated, this paper proposes a maximum eigenvalue detector based on a sliding window matrix covariance matrix to solve the problem of non-stationary, non-uniform, and low signal-to-noise ratio target detection. The corresponding Hermitian covariance matrix is constructed by using the sliding window block, and its maximum eigenvalue is used as the test statistic. A new detection mechanism is designed to improve the signal-to-noise ratio and improve the detection probability of the target in the background of strong ground clutter.
The main structure of this paper is as follows: Section 2 introduces the detection method based on the maximum eigenvalue of the covariance matrix in detail. Firstly, the principle and algorithm flow of the method are introduced, and the calculation process of the covariance matrix and how to extract the maximum eigenvalue as the basis of target detection are described in detail. In Section 3, the proposed method is compared with the extended target detection method that forms a one-dimensional range profile after extraction. By comparing the experimental results, the difference between the two methods in target detection effect is evaluated, and their advantages and disadvantages are analyzed. Section 4 is the conclusion of this paper, which summarizes the main research contents and results of this study and emphasizes the practical application prospect and potential value of the detection method based on the maximum eigenvalue of the covariance matrix in the field of radar target detection.
2. Methods Based on Maximum Eigenvalue of Covariance Matrix
2.1. Scene Construction
The complex detection scene of the stepped-frequency radar is shown in Figure 1. Under the background of strong ground clutter, the detection radial distance is R, and there are A, B, C, and other extended targets in the beam irradiation range.
2.2. Signal Model
The transmitted signal of the stepped-frequency modulation radar is a set of pulse signals with in-pulse frequency modulation and linear jump between pulses. When performing synthetic high-resolution processing, the original echo is first mixed, and then the echo pulse is compressed. Finally, the obtained pulse compression signal is subjected to IFFT (Inverse Fast Fourier Transform) to obtain the high-resolution range profile of the target. The time domain equation of the transmitted signal of the stepped-frequency radar is shown as follows:
and in the following equation:
where (2) is the complex envelope of the pulse signal, is the time variable, is the pulse repetition interval, is the linear frequency modulation slope in the pulse, is the sub-pulse width, is the sub-pulse bandwidth, is the carrier frequency of the pulse, is the pulse starting frequency, is the frequency step, is the number of pulses, and is the rectangular function. The relationship between the frequency of the transmitted signal of the stepped-frequency modulation radar and the time is shown as follows:
Assuming that the radar approaches the target at the radial velocity of uniform velocity and the transmitted signal form is shown in (1), the echo expression of the point target with the initial radial distance within the radar coverage can be expressed as:
Here, is the complex envelope amplitude of the echo pulse, is the time delay of the point target echo, and is the speed of light. When the stepped-frequency radar performs correlation processing, the influence of acceleration on the target echo can be generally ignored; that is, it is assumed that the radar and the target maintain a uniform speed within a CPI (Coherent Processing Interval).
The received echo signal needs to be mixed. This operation requires the local oscillator signal to be synchronized with the transmitted signal of the radar. The expression of the local oscillator signal is shown as follows:
The baseband echo expression obtained after mixing processing is:
Here, denotes the Doppler frequency shift of the velocity to the baseband echo.
The processing of high-resolution range profile synthesis of the baseband echo signal can be divided into two steps:
The first step is to perform pulse compression processing on the linear frequency modulation term in the baseband echo signal represented by , so as to obtain the intermediate resolution range profile of the baseband echo signal.
Assuming that the velocity in the echo signal is accurately compensated and the relative radial velocity of the radar and the target is compensated, the expression of the intermediate resolution range profile is obtained after the pulse compression processing of the echo baseband signal. Performing pulse compression on Equation (6) yields Equation (7).
Equation (7) is expressed as follows: , , represents the number of sampling points for a single sub-pulse, represents the initial phase, signifies the delay of the echo, , denotes the sampling rate, and represents the sub-pulse sampling width.
In the second step, the mid-resolution range profile obtained in the first step is processed by IDFT (Inverse Discrete Fourier Transform), which is the high-resolution processing of pulse synthesis, so as to obtain the high-resolution range profile of the radar echo.
Then, the high-resolution range profile of the target can be obtained by performing IDFT processing on the sampling points of the middle-resolution range profile and taking the modulus. Performing IDFT on Equation (7) yields Equation (8).
According to Equation (8), the time resolution of the high-resolution range profile is .
2.3. Description of Detection Problem and Detection Method
The high-resolution range image obtained by preprocessing the radar echo signal is , and the data matrix block of the high-resolution range image is obtained in turn by using the sliding window with a size of ( in this paper). Assuming that the size of is , the data matrix is represented by the matrix block by the following expression:
The expression of the sliding window is:
The columns of the sliding window block are connected to the column vector of .
For the sake of generality, according to the empirical model of a binary hypothesis, in the problem of radar target detection, the problem of radar target detection under the background of complex ground clutter can be expressed by the following formula in probability statistics:
Among them, represents the observation vector of the echo, represents the target vector in the echo, and represents the ground clutter vector obeying the compound Gaussian distribution in the echo.
According to the literature [1], the composite Gaussian distribution echo still obeys the complex Gaussian distribution after high-resolution processing. Therefore, after the stepped-frequency radar echo signal is transformed by IDFT, the binary hypothesis empirical model can be expressed as the following:
Among them, represents the observation vector of the echo, represents the target vector in the echo, and represents the ground clutter vector obeying the compound Gaussian distribution in the echo.
Under the assumption of , there is no target in the sliding window matrix block, and only the clutter component is contained. Under the assumption of , in the observation vector of the sliding window matrix block, in addition to the clutter component, there is also the target component. Assuming that the target vector and the clutter vector are independent of each other, the following covariance matrix can be constructed:
Among them, represents the covariance matrix of the observation matrix vector, represents the covariance matrix of the target signal vector, and represents the covariance matrix of the ground clutter, which is obtained by the Formulas (11), (14)–(16). The covariance matrix of the sliding window block observation vector can be represented by the following expression:
In the problem of radar target detection, the statistical covariance matrix of clutter is difficult to obtain accurately. Based on this, in the theoretical analysis, the covariance matrix of the sample is used to replace the statistical covariance matrix of the clutter, and its expression is as follows:
Here, denotes the number of sampling points of the high-resolution domain sliding window matrix block.
In addition, it is assumed that the clutter observation vectors are independent of each other and obey the complex Gaussian distribution with zero mean, which satisfies the following relationship:
According to the relevant theoretical analysis of the random matrix, the clutter covariance matrix can be approximated as a Hermitian positive definite matrix. At the same time, its covariance matrix obeys the distribution , where denotes the degree of freedom and denotes the covariance matrix.
According to the previous binary hypothesis test theory and the related theory of random matrix, under the hypothesis, the joint probability density function of the ordered eigenvalues of the clutter covariance matrix can be expressed by Theorem 1.
Theorem 1.
Let be a Hermitian positive definite matrix with distribution. Then, the ordered eigenvalue of obeys the following joint probability density function:
Among them, represents the diagonal matrix composed of all eigenvalues of the clutter covariance matrix , and represents the complex hypergeometric function between two Hermitian positive definite matrices, A and B. The complex multivariate gamma function is defined as follows:
Under another hypothesis, , the complex multivariate gamma function is defined as follows:
Among them, and are independent of each other. When the number of sampling points is sufficiently large, is approximately equivalent to . Under Assumption , the approximate joint distribution of the ordered eigenvalues of the clutter covariance matrix can be expressed as follows:
According to the problem of radar target detection in a complex ground clutter background, combined with the Neyman–Pearson criterion, likelihood ratio detection is recognized as the optimal detection mechanism. Therefore, in the following, the likelihood ratio detection of the characteristic value domain of the clutter covariance matrix is analyzed. In order to not lose generality, let and represent the joint probability density function of the eigenvalue of the clutter covariance matrix under the assumption and the assumption, respectively. Then, the likelihood ratio of the feature range is expressed as follows:
Substituting Equations (20) and (23) into (24), the likelihood ratio test of the feature range can be re-represented as follows:
In order to facilitate the subsequent analysis and processing, some constant items are ignored, and only the data-related items are retained. The likelihood ratio test statistic of the characteristic range can be simplified as follows:
The complex hypergeometric function satisfies the following properties:
Taking logarithms at both ends of (26) at the same time, the log-likelihood function of the characteristic range is expressed as follows:
By using the theory of matrix inversion lemma, the log-likelihood function of the characteristic range of (28) can be re-represented as follows:
Since is a rank-1 matrix, according to the theory of random matrix, the rank of the product of any two matrices satisfies the following relation:
In the above formula, represents the rank of the matrix. Therefore, it can be concluded that the matrix represents a matrix of rank 1. Equivalently, the matrix has only one nonzero eigenvalue, namely the maximum eigenvalue. Based on the discussion and analysis, the logarithmic likelihood ratio function can be expressed as the following:
According to the analysis of Equation (31), the maximum eigenvalue of the covariance matrix plays a very important role in the likelihood function. However, in practical application, Equation (31) is very complicated and tedious, which causes considerable difficulties in analyzing and solving subsequent problems. Therefore, in order to solve the above problems, the properties of their eigenvalues are analyzed.
According to the theory of random matrix, for any two positive definite matrices, their eigenvalues satisfy the following properties.
Property 1.
Let be any two Hermitian positive definite matrices; then, their ordered eigenvalues satisfy the following inequality:
For a matrix of rank 1, according to Formula (32), the maximum eigenvalue satisfies the following relation:
To further process Equation (33), let
According to the maximum eigenvalue inequality (33), it can be obtained that there must be a positive number about , such that its log-likelihood function satisfies the following relationship:
Next, we can obtain the relationship between the log-likelihood function and the maximum eigenvalue of the covariance matrix. For further processing of the above formula, we can use the maximum eigenvalue of the covariance matrix to design a new detector, and its test statistics can be expressed as the following formula:
where denotes the threshold factor.
According to Equation (36), a detection method based on the maximum eigenvalue of radar-received data is derived. However, the detection threshold in the detection method depends on the received data, which are difficult to obtain in the actual detection scene of radar targets. The detection threshold can only be set by empirical data, and it is difficult to ensure data accuracy. Therefore, based on the maximum eigenvalue of the sliding window matrix block of the high-resolution range profile data applied as the test statistic to the maximum eigenvalue extraction detection problem, the above method is further improved.
According to the above analysis, it is assumed that the clutter observation vectors are independent of each other and obey the complex Gaussian distribution with zero mean: the mean value is 0 and the variance is . Therefore, it can be proved that:
In the above formula, represents the unit matrix of order m. Under the assumption of , the target vector covariance matrix is , , and the eigenvalue decomposition is . Therefore, the maximum eigenvalue can be obtained as follows:
Under the assumption of , assuming that is the largest eigenvalue of , then the largest eigenvalue of matrix is the following:
Combining Equations (36) and (39), it can be seen that when the target exists, the maximum eigenvalue of the covariance matrix of the sliding window data matrix is greater than the maximum eigenvalue when the target does not exist. Therefore, the maximum eigenvalue can be used as a test statistic to detect whether the target exists in the high-resolution range profile of the stepped-frequency radar. According to the theoretical analysis, the radar target has strong scattering, and the radar clutter has fluctuation characteristics. These characteristics usually make the correlation and scattering energy of the target stronger than the clutter. According to the properties of the eigenvalues of the covariance matrix, the eigenvalues of the covariance matrix of the sliding window data matrix can well characterize the correlation and energy of the target and clutter.
In summary, the maximum eigenvalue of the covariance matrix of the sliding window data matrix can well characterize the existence or non-existence of radar targets.
When the actual stepped-frequency radar detects ground targets, due to the limited number of actual measurement samples, the sample covariance matrix is usually used to approximate the statistical covariance matrix.
According to the previous analysis, the covariance matrix of the high-resolution range profile sample is constructed for Equation (11). The formula of the covariance matrix is as follows:
The matrix is a Hermitian positive definite matrix, and the matrix expression is as follows:
Next, the eigenvalue decomposition of the covariance matrix of the sample is performed, and the following formula is obtained:
In Equation (42), denotes the orthogonal matrix composed of the eigenvectors of the matrix, denotes the diagonal matrix, denotes all eigenvalues of the matrix, and denotes the maximum eigenvalue corresponding to the sliding window block matrix.
According to the previous analysis, the maximum eigenvalue of the covariance matrix of the high-resolution range profile sliding window can separate the clutter and the target well. Therefore, the maximum eigenvalue matrix is constructed by using the maximum eigenvalue of the covariance matrix of the high-resolution range profile sliding window.
In the stepped-frequency modulated synthetic bandwidth high-resolution radar, when the echo signal is synthesized for high-resolution processing, due to the existence of oversampling, the obtained one-dimensional high-resolution range profile has a lot of range redundancy information. Based on this, it is necessary to adopt the target extraction algorithm to eliminate the redundant information in the high-resolution range profile, so as to achieve the effect of obtaining the radar target’s complete high-resolution range profile (HRRP). In this paper, three classical range profile extraction algorithms are used to process the high-resolution range profile and the maximum eigenvalue image of the sliding window covariance matrix, respectively, which are the same distance selection method after amplitude interpolation, the maximum 1 norm range profile search method, and the Doppler offset correction method based on the strongest amplitude sub-range profile. In order to facilitate the description of the three extraction algorithms applied in this paper, they are named method 1, method 2, and method 3, respectively.
Finally, the extended target integral detection method is used to detect the one-dimensional range profile of the maximum eigenvalue of the extracted covariance matrix, so as to obtain the distance, size, and other related information of the target.
The extended target integral detector is used to conduct the non-coherent accumulation of all signals in the distance window of the target prior to obtaining the required target information. The form of the detector is as follows:
When there is only noise, the detection statistic obeys the distribution. According to the relationship between the false alarm rate and the decision threshold, the decision threshold of the integral detector is obtained as follows:
2.4. Algorithm Steps and Algorithm Flow Chart
2.4.1. Algorithm Steps
In summary, it is assumed that the stepped-frequency radar obtains the original image (the size of the image is ). As shown in Figure 2, the maximum eigenvalue algorithm based on the Hermitian covariance matrix proposed in this paper can be summarized in the following steps:
Step 1: The original image received by the radar receiver is subjected to pulse compression processing to obtain the image after pulse compression;
Step 2: The pulse-compressed image is processed by inverse discrete Fourier transform along the slow time dimension to obtain the high-resolution–medium-resolution radar image of the stepped-frequency radar;
Step 3: Select a sliding window with a size of , select the sliding window for , and obtain the sliding window matrix block of the high-resolution–medium-resolution radar image , in turn;
Step 4: Connect each selected sliding window matrix block to construct the column vector as shown in Formula (11), and construct the Hermitian covariance matrix corresponding to its column vector according to Formula (40);
Step 5: Find the maximum eigenvalue corresponding to each Hermitian covariance matrix, and construct the maximum eigenvalue of each covariance matrix into a two-dimensional matrix with a size of ;
Step 6: The maximum eigenvalue matrix of the Hermitian covariance matrix is extracted by using the same distance maximization method after amplitude interpolation, the maximum 1 norm range profile search method, and the Doppler offset correction method based on the strongest amplitude sub-range profile, so as to obtain the one-dimensional range profile of the maximum eigenvalue;
Step 7: Use the radial energy accumulation detection method of the range-extended target to detect the one-dimensional range profile of the maximum eigenvalue, so as to obtain the distance, size, and other related information of the target.
2.4.2. Algorithm Flow Chart
The flow chart of the detection method based on the maximum eigenvalue of the Hermitian covariance matrix is shown in Figure 3.
3. Validation and Analysis of Measured Data
3.1. Measured Data Parameters
In order to verify the performance of the proposed algorithm, this section uses measured data. The parameters corresponding to the measured data verification radar are shown in Table 1.
3.2. Data Acquisition Modes
When collecting data, the acquisition process is mainly carried out in a flying manner. The schematic diagram of the flight path is shown in Figure 4. The ABCD represents the flight stage, and the dotted line represents the vertical lift and horizontal flight stage.
The measured experiment is aimed at the ground vehicle target, and the typical scene data under different attitude angles are collected according to the specific trajectory. The 3D model of Target 1 is shown in Figure 5.
3.3. Algorithm Verification
In this study, we utilized the pulse compression technique to enhance the radar echo of Target 1 in a disk-flying scene. In Figure 6 and Figure 7, we present the two-dimensional and three-dimensional images obtained after applying pulse compression processing. Figure 6 exhibits the two-dimensional image following pulse compression, while Figure 7 showcases the corresponding three-dimensional image.
Upon careful observation of these two images, it becomes apparent that the target is not adequately distinguishable in both Figure 6 and Figure 7 due to a low signal-to-noise ratio prevalent in the flying scene. This outcome indicates that in such scenarios, where the signal and noise data exhibit minimal disparity, the echo signal from the target becomes susceptible to being concealed by the noise, thereby hindering clear target detection. Consequently, solely relying on pulse compression may not suffice to effectively enhance radar target detection performance in this particular case.
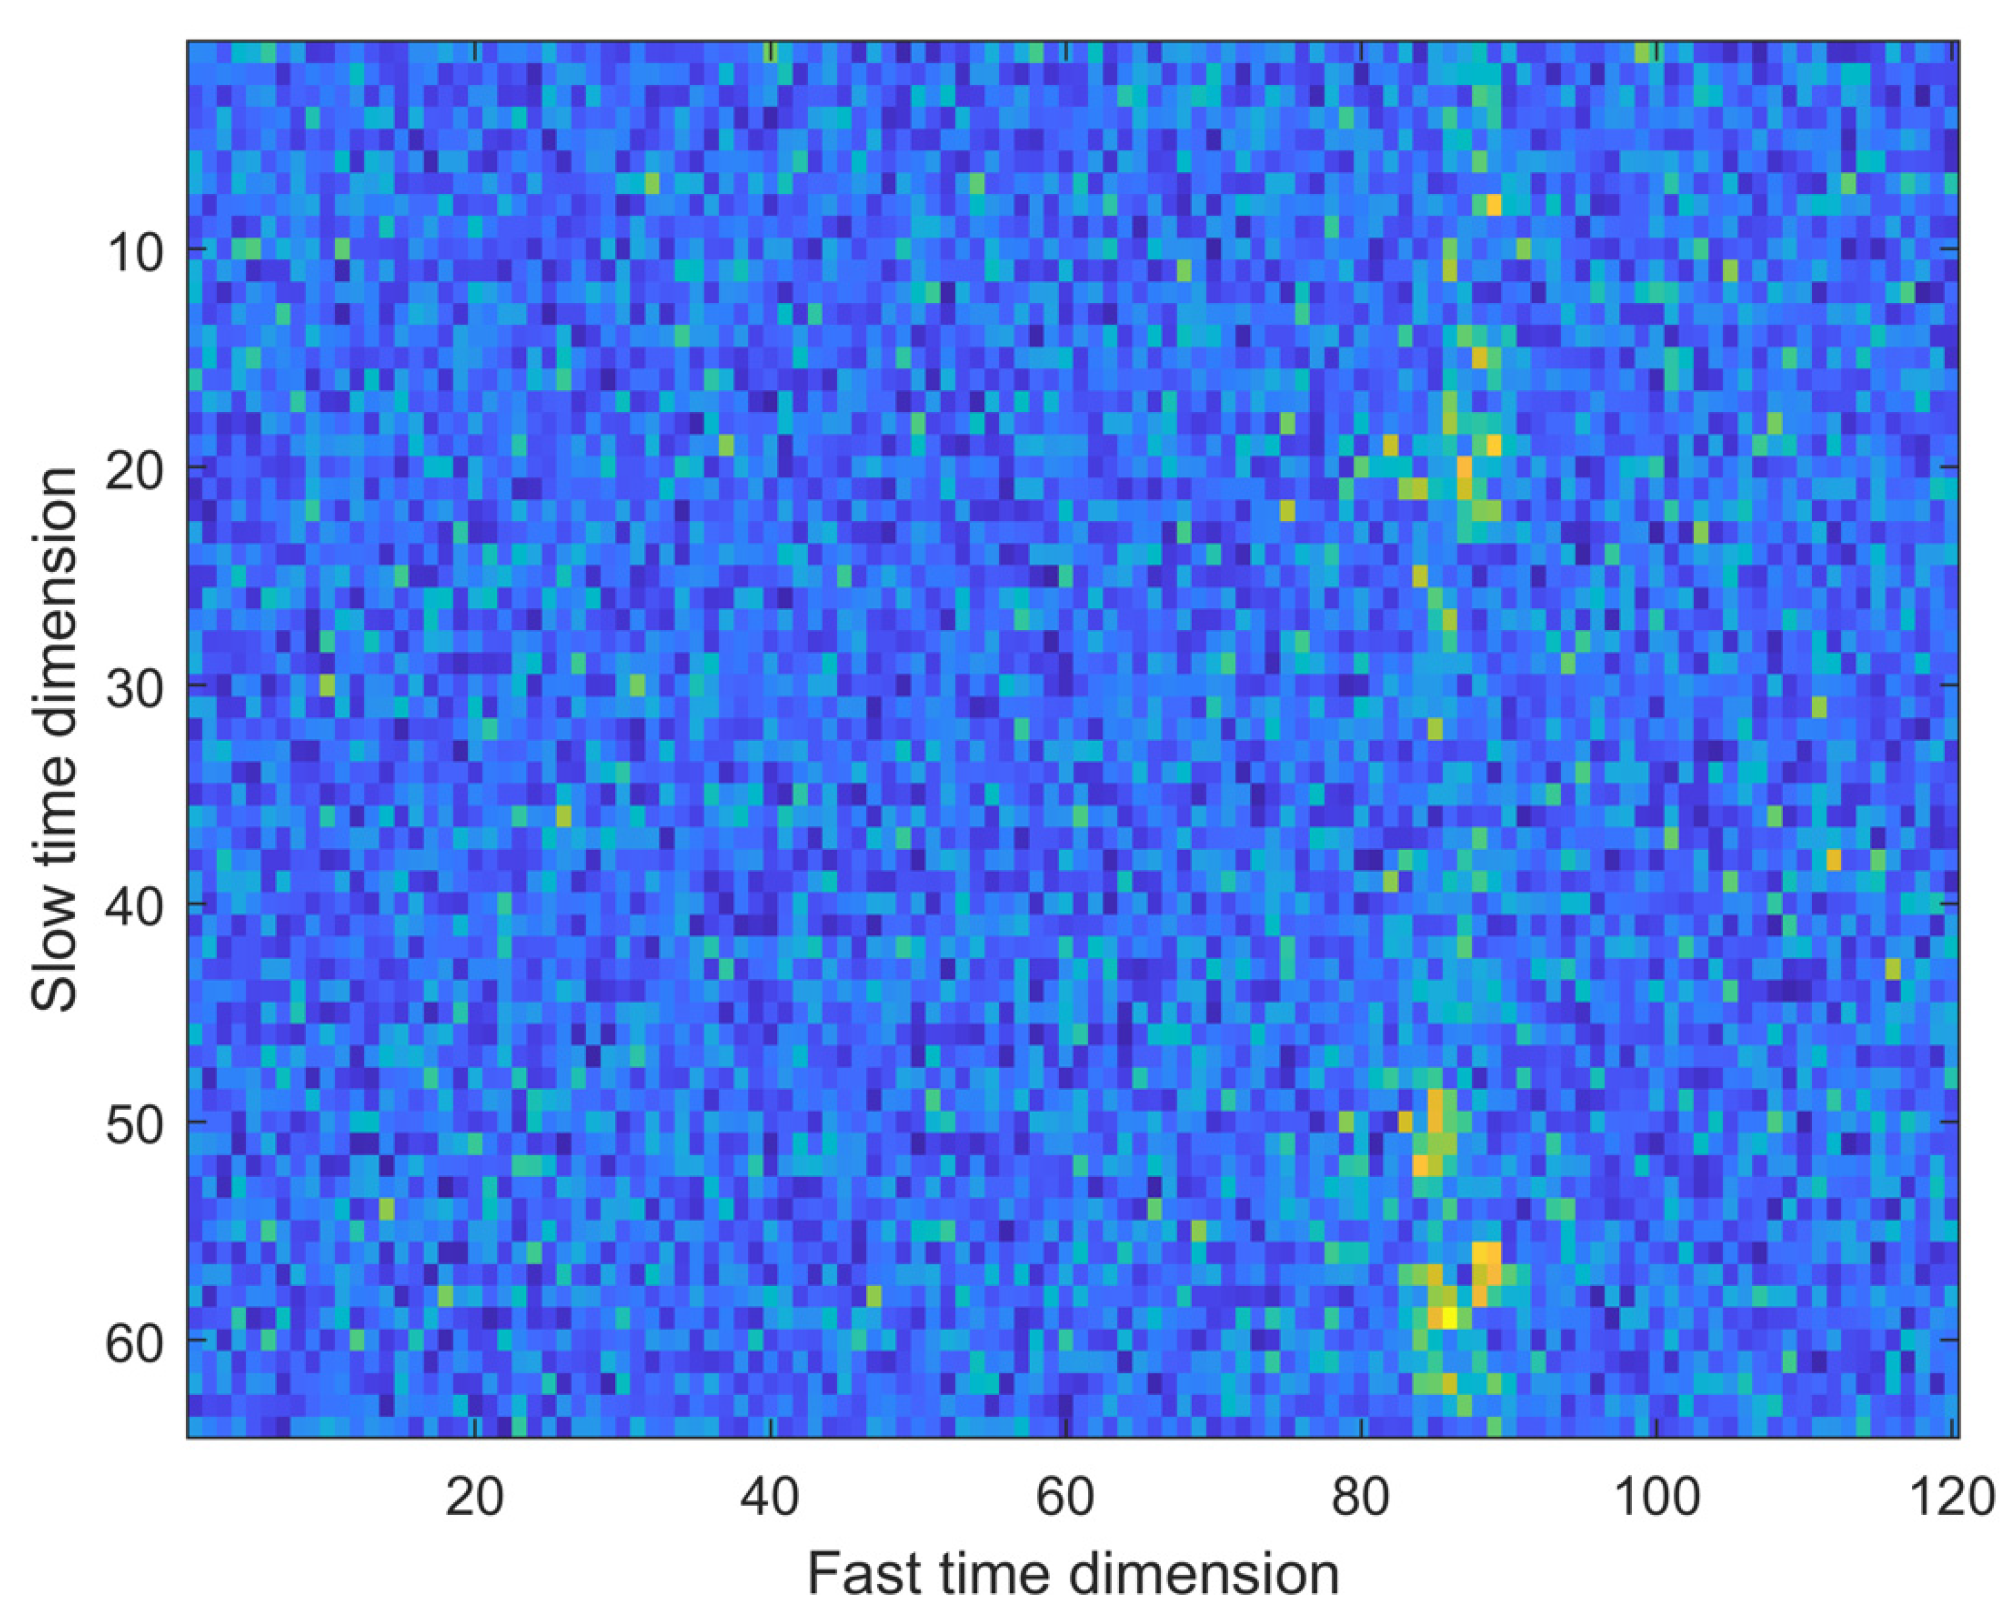
Based on the theoretical analysis presented in Section 2, it can be deduced that stepped-frequency radar has the capability to achieve high-resolution imaging by employing IFFT processing on the pulse-compressed radar echo. In Figure 8 and Figure 9, we showcase the two-dimensional and three-dimensional images of the radar echo obtained after inter-pulse IFFT processing, where the highlighted red area represents the scattering center of the target.
Upon comparison of Figure 8 and Figure 9, it is noticeable that the inter-pulse IFFT processing leads to a certain level of enhancement in the signal-to-clutter ratio within the echo image. However, owing to the presence of significant background clutter intensity, the differentiation between the target signal and clutter signal is not distinctly evident. This poses considerable challenges for subsequent radar target detection.
In view of the presented scenario, it is evident that the identification and extraction of the target signal from the radar echo following inter-pulse IFFT processing pose significant challenges. Consequently, future research endeavors should prioritize the development of effective methods to mitigate the interference stemming from background ground clutter on the target signal. This strategic focus aims to enhance the precision and dependability of radar target detection.
In this paper, we propose a method that utilizes the echo map obtained after inter-pulse IFFT processing. Subsequently, we calculate the maximum eigenvalue of the sliding window block’s covariance matrix. For this experiment, we opted to use a 2 × 2 size sliding window as the calculation unit. By analyzing the eigenvalues of the covariance matrix of the data within the sliding window block, we can effectively extract the critical characteristics of the radar target.
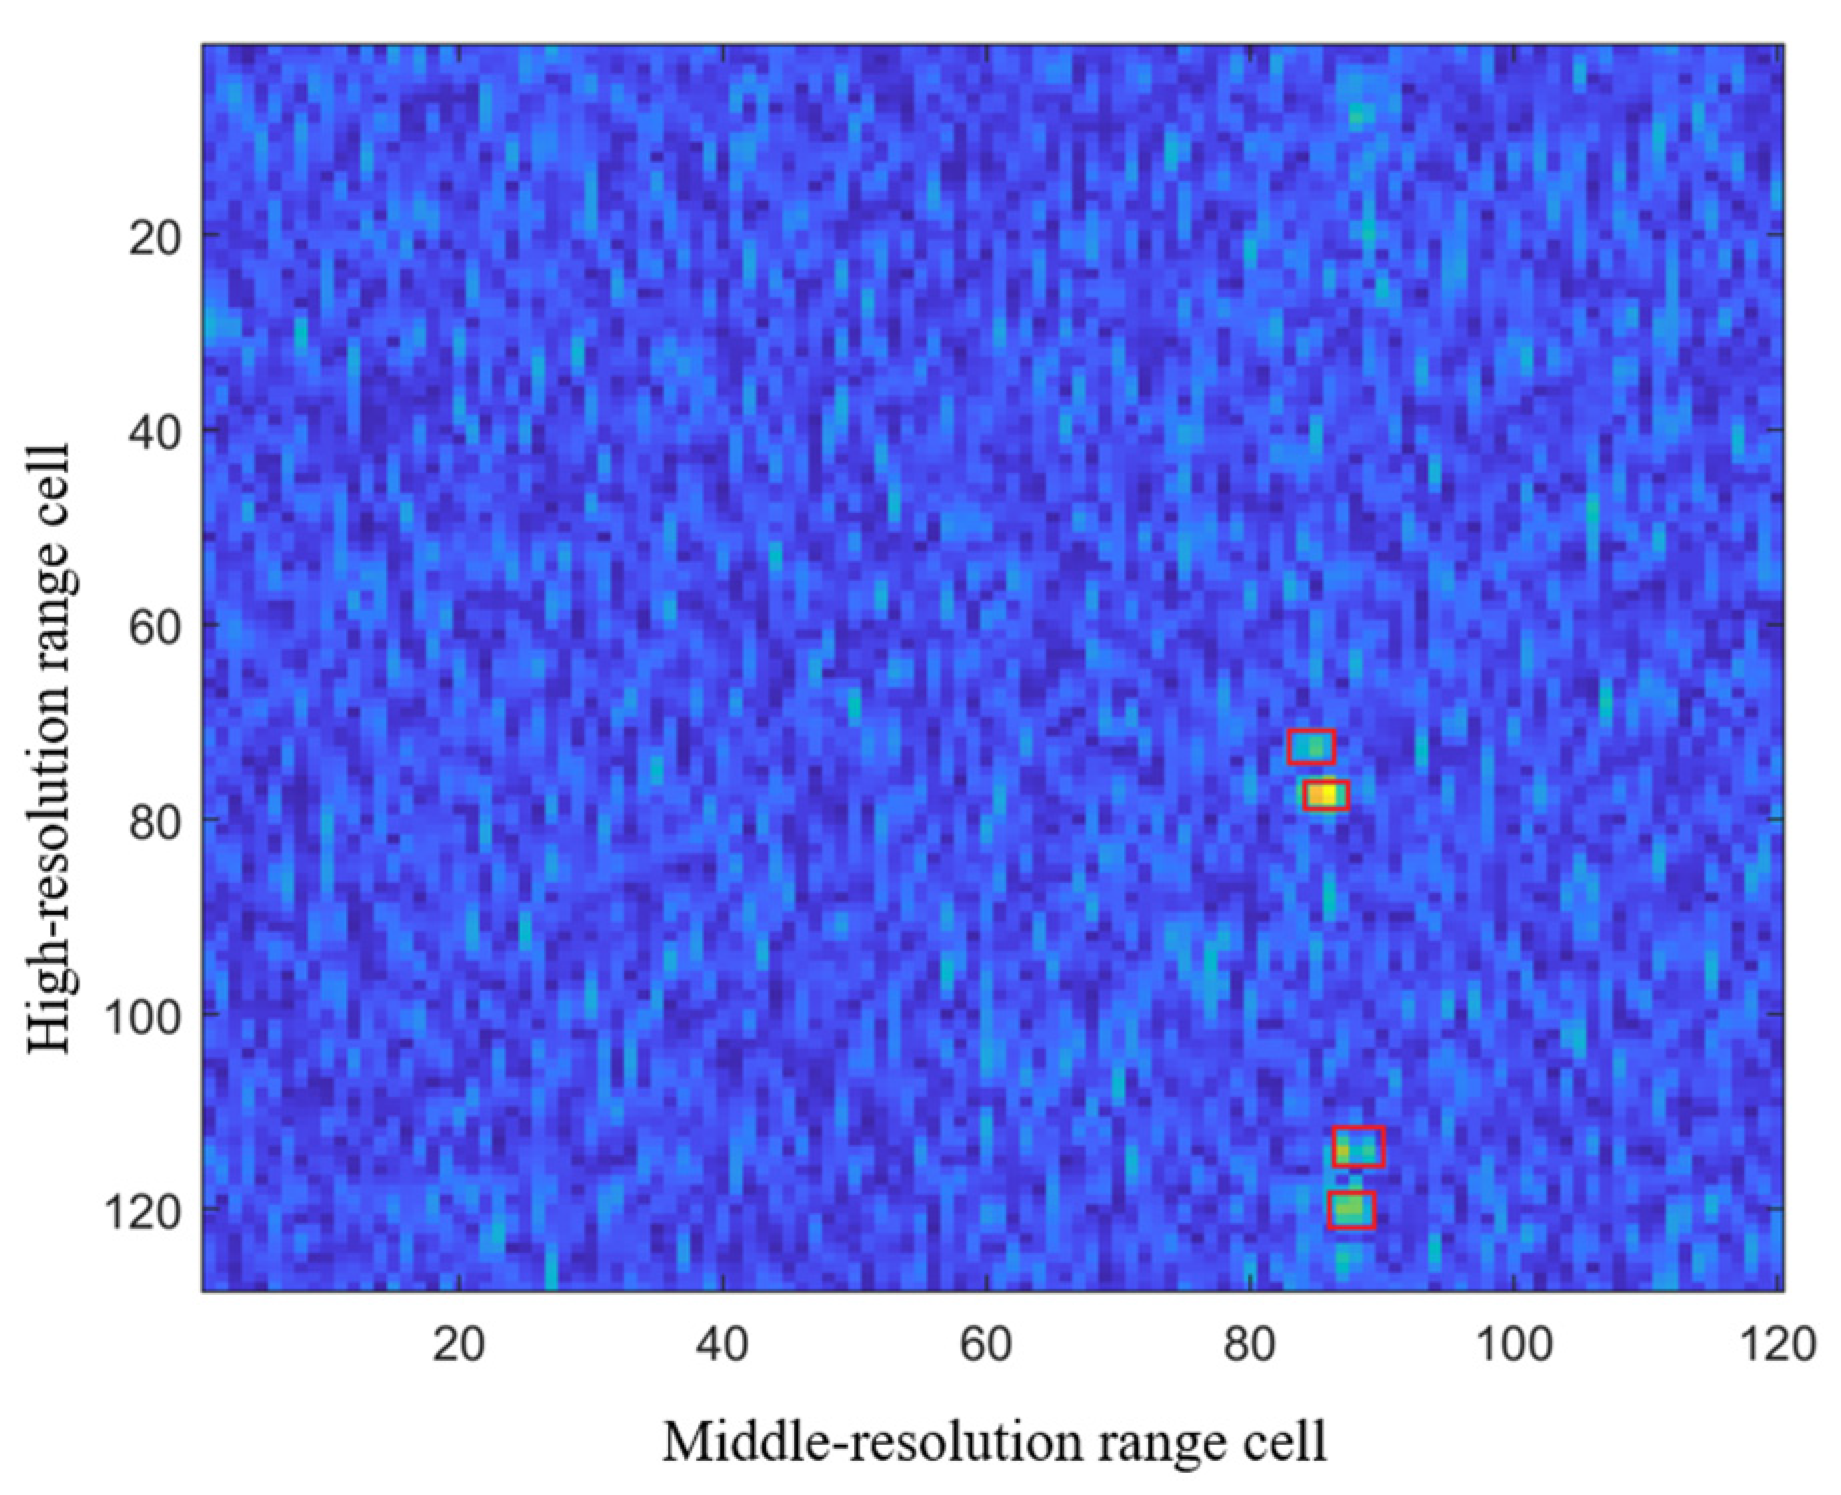
To showcase the results of our proposed method based on the maximum eigenvalue of the sliding window covariance matrix, we present two-dimensional and three-dimensional images in Figure 10 and Figure 11. These images exhibit evident high-contrast features. Upon observation of these images, the distinction between the target and background becomes significantly apparent, facilitating accurate detection and recognition of radar targets. Upon analyzing Figure 8 and Figure 10, it is apparent that the two-dimensional image of the maximum eigenvalue of the covariance matrix highlights target scattering centers in red, demonstrating superior discrimination compared with the clutter background. This enhancement is notably pronounced when contrasted with the two-dimensional image of the radar echo after inter-pulse IFFT. Furthermore, observations from Figure 11 reveal that the amplitude of the target scattering center in the three-dimensional representation of the maximum eigenvalue of the covariance matrix significantly surpasses that of the clutter. Comparing Figure 9 and Figure 11, it becomes evident that the amplitude of the target scattering center in Figure 10 further elevates the signal-to-clutter ratio, thereby creating favorable conditions for subsequent radar target detection. These findings underscore the potential application prospects of the maximum eigenvalue of the sliding window covariance matrix in radar target detection.
In the field of radar target detection, signal-to-noise ratio (SNR) and signal-to-clutter ratio (SCR) are crucial indicators that determine the radar’s performance. To improve the SCR in target detection of stepped-frequency radar, we propose a maximum eigenvalue image extraction algorithm based on the Hermitian matrix. Figure 12 presents the local amplification of the target one-dimensional range profile using three range profile extraction algorithms for radar echoes. The figure reveals a difference between the maximum value and mean value of the extracted range profile in different range profile extraction algorithms, with a difference of 15.25 dB.
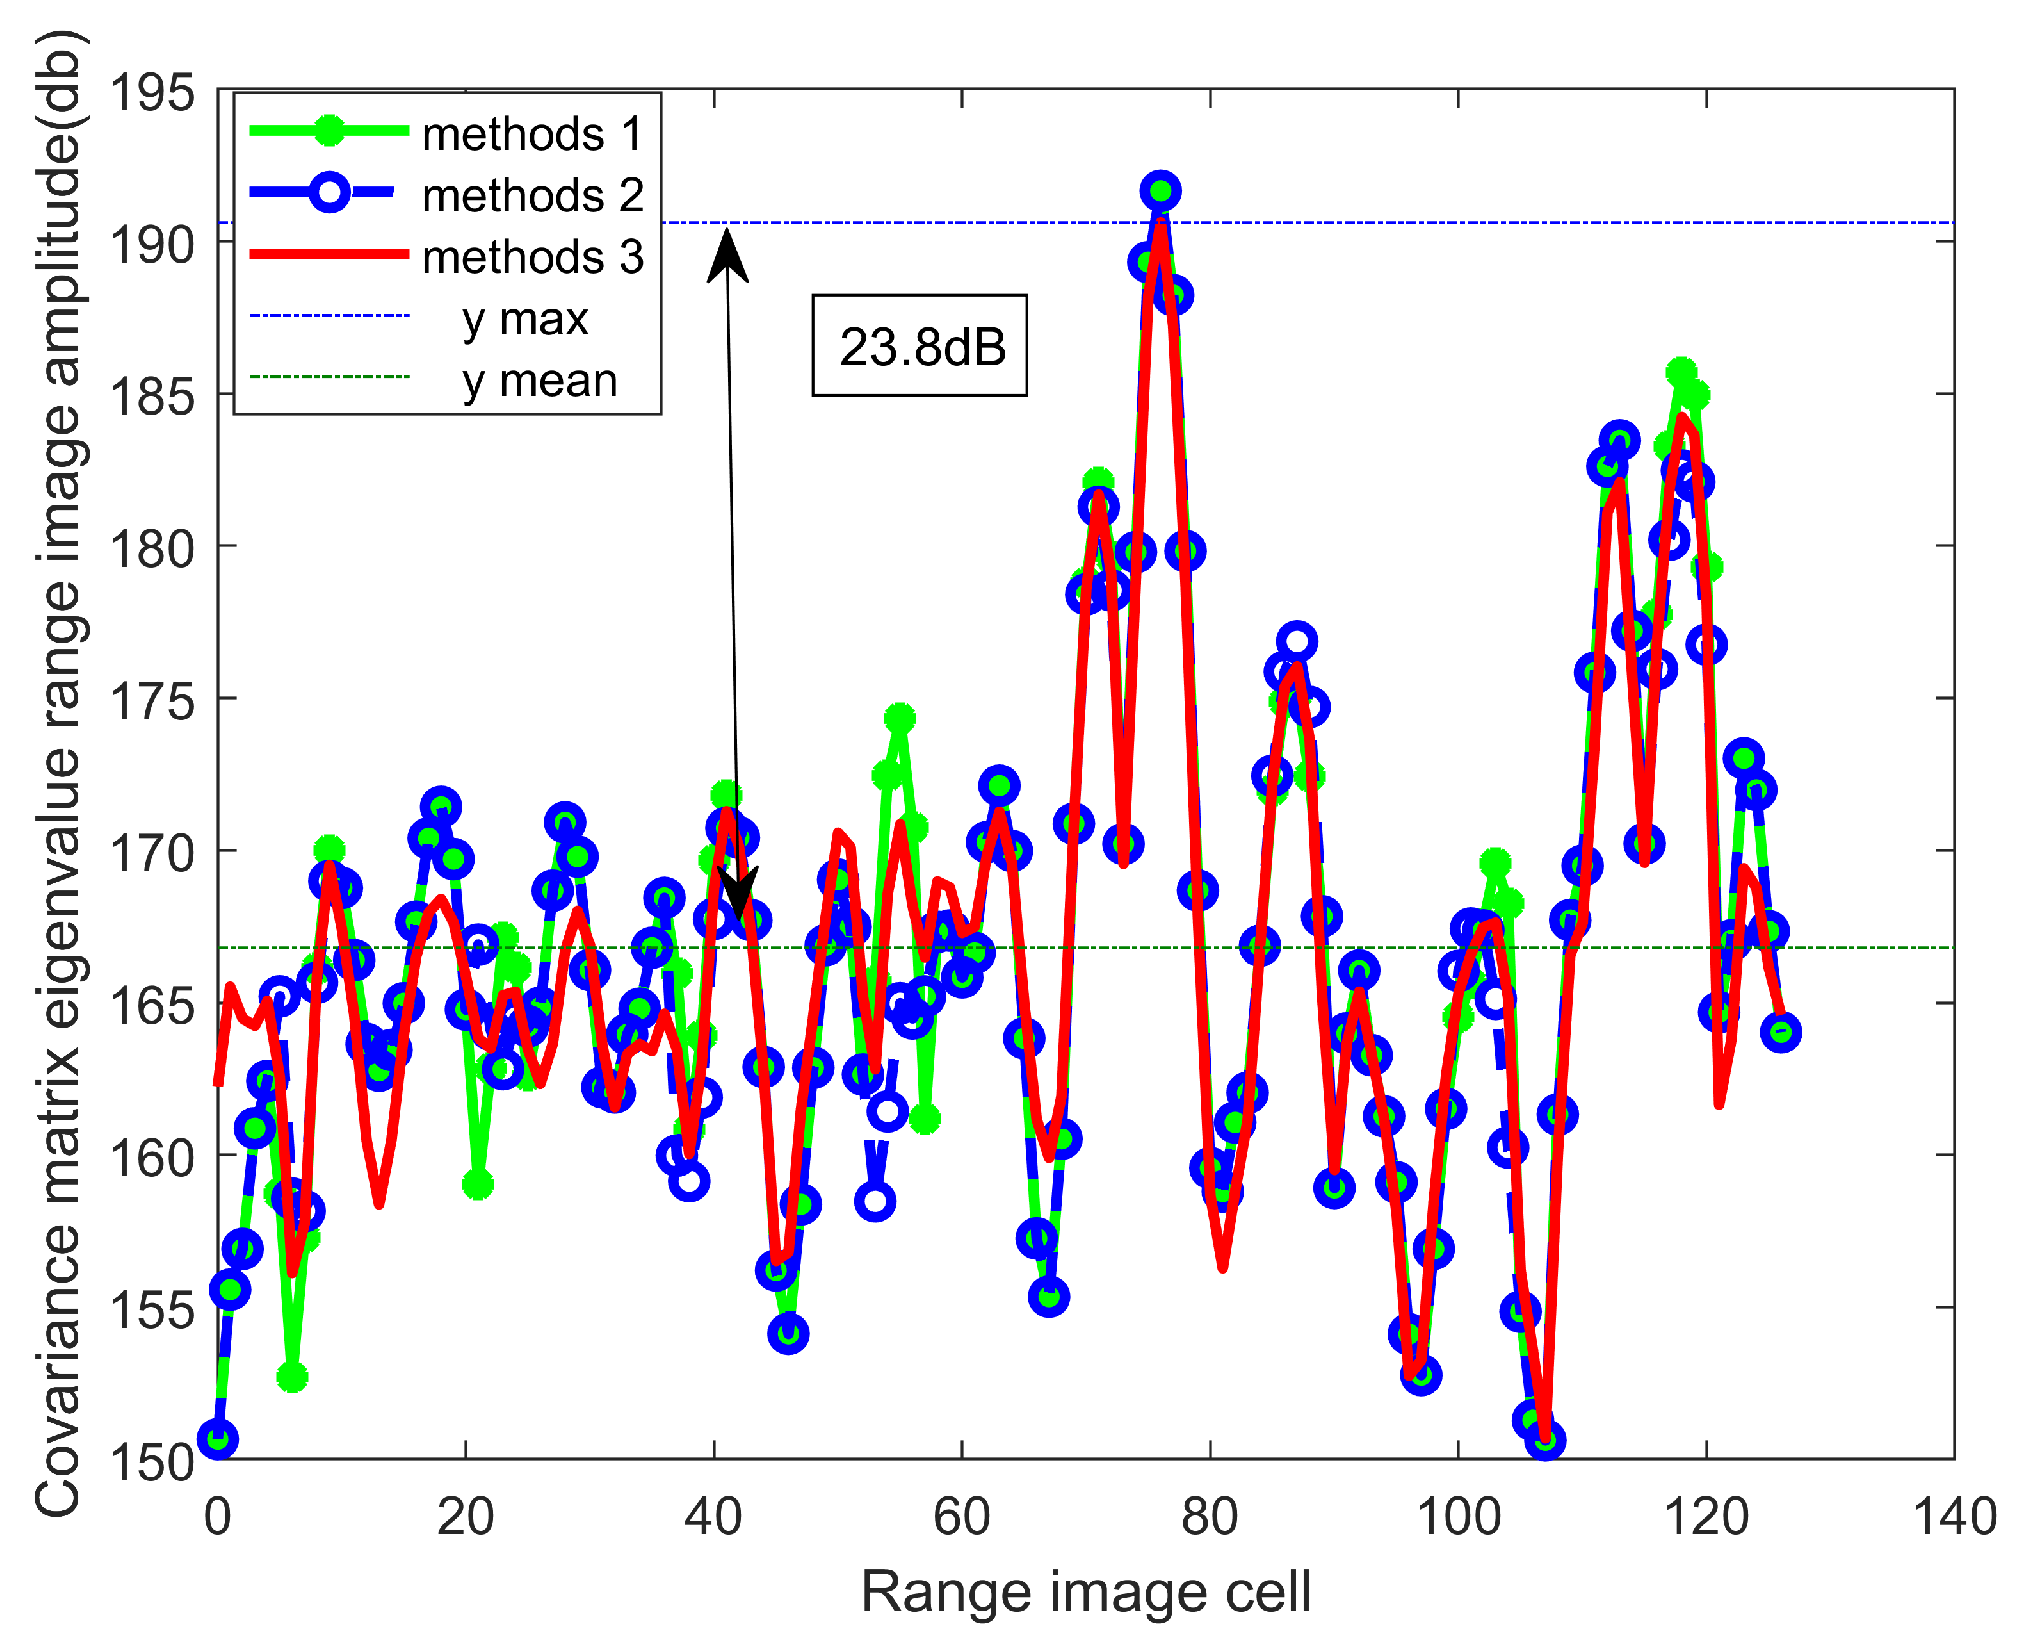
In Figure 13, we observe the locally enlarged image of the one-dimensional eigenvalue image obtained by utilizing three-range image extraction algorithms to extract the maximum eigenvalue of the covariance matrix. The maximum and mean values of the extracted eigenvalue images differ by 23.8 dB. These findings highlight the effectiveness of the proposed algorithm in enhancing SCR and improving the detection performance of stepped-frequency radar.
By comparing Figure 12 and Figure 13, we observe that the signal-to-clutter ratio (SCR) of the eigenvalue image obtained using the proposed one-dimensional range profile extraction algorithm to extract the maximum eigenvalue of the covariance matrix surpasses that of the extracted target one-dimensional range profile, with an increase of 8.55 dB. This significant improvement highlights the effectiveness of the proposed method in enhancing the SCR of radar target detection, thereby providing robust support for subsequent radar target detection efforts. These findings demonstrate that employing the eigenvalue one-dimensional range profile for range profile extraction can effectively enhance radar performance. Therefore, in the context of radar target detection, this method holds practical application value and offers important insights for radar system design and optimization.
In the field of radar-extended target detection, this paper employs the integral extended target detection method for experimental analysis. Figure 14 presents the results of target detection on the radar’s one-dimensional panoramic range image using this method. Upon comparison with prior information on the radar scattering center, it becomes evident that only one scattering center is detected in the panoramic range profile due to the low signal-to-noise ratio. This observation underscores the challenges posed by the limited detectability of scattering centers in a low signal-to-noise environment during the detection of panoramic range profiles.
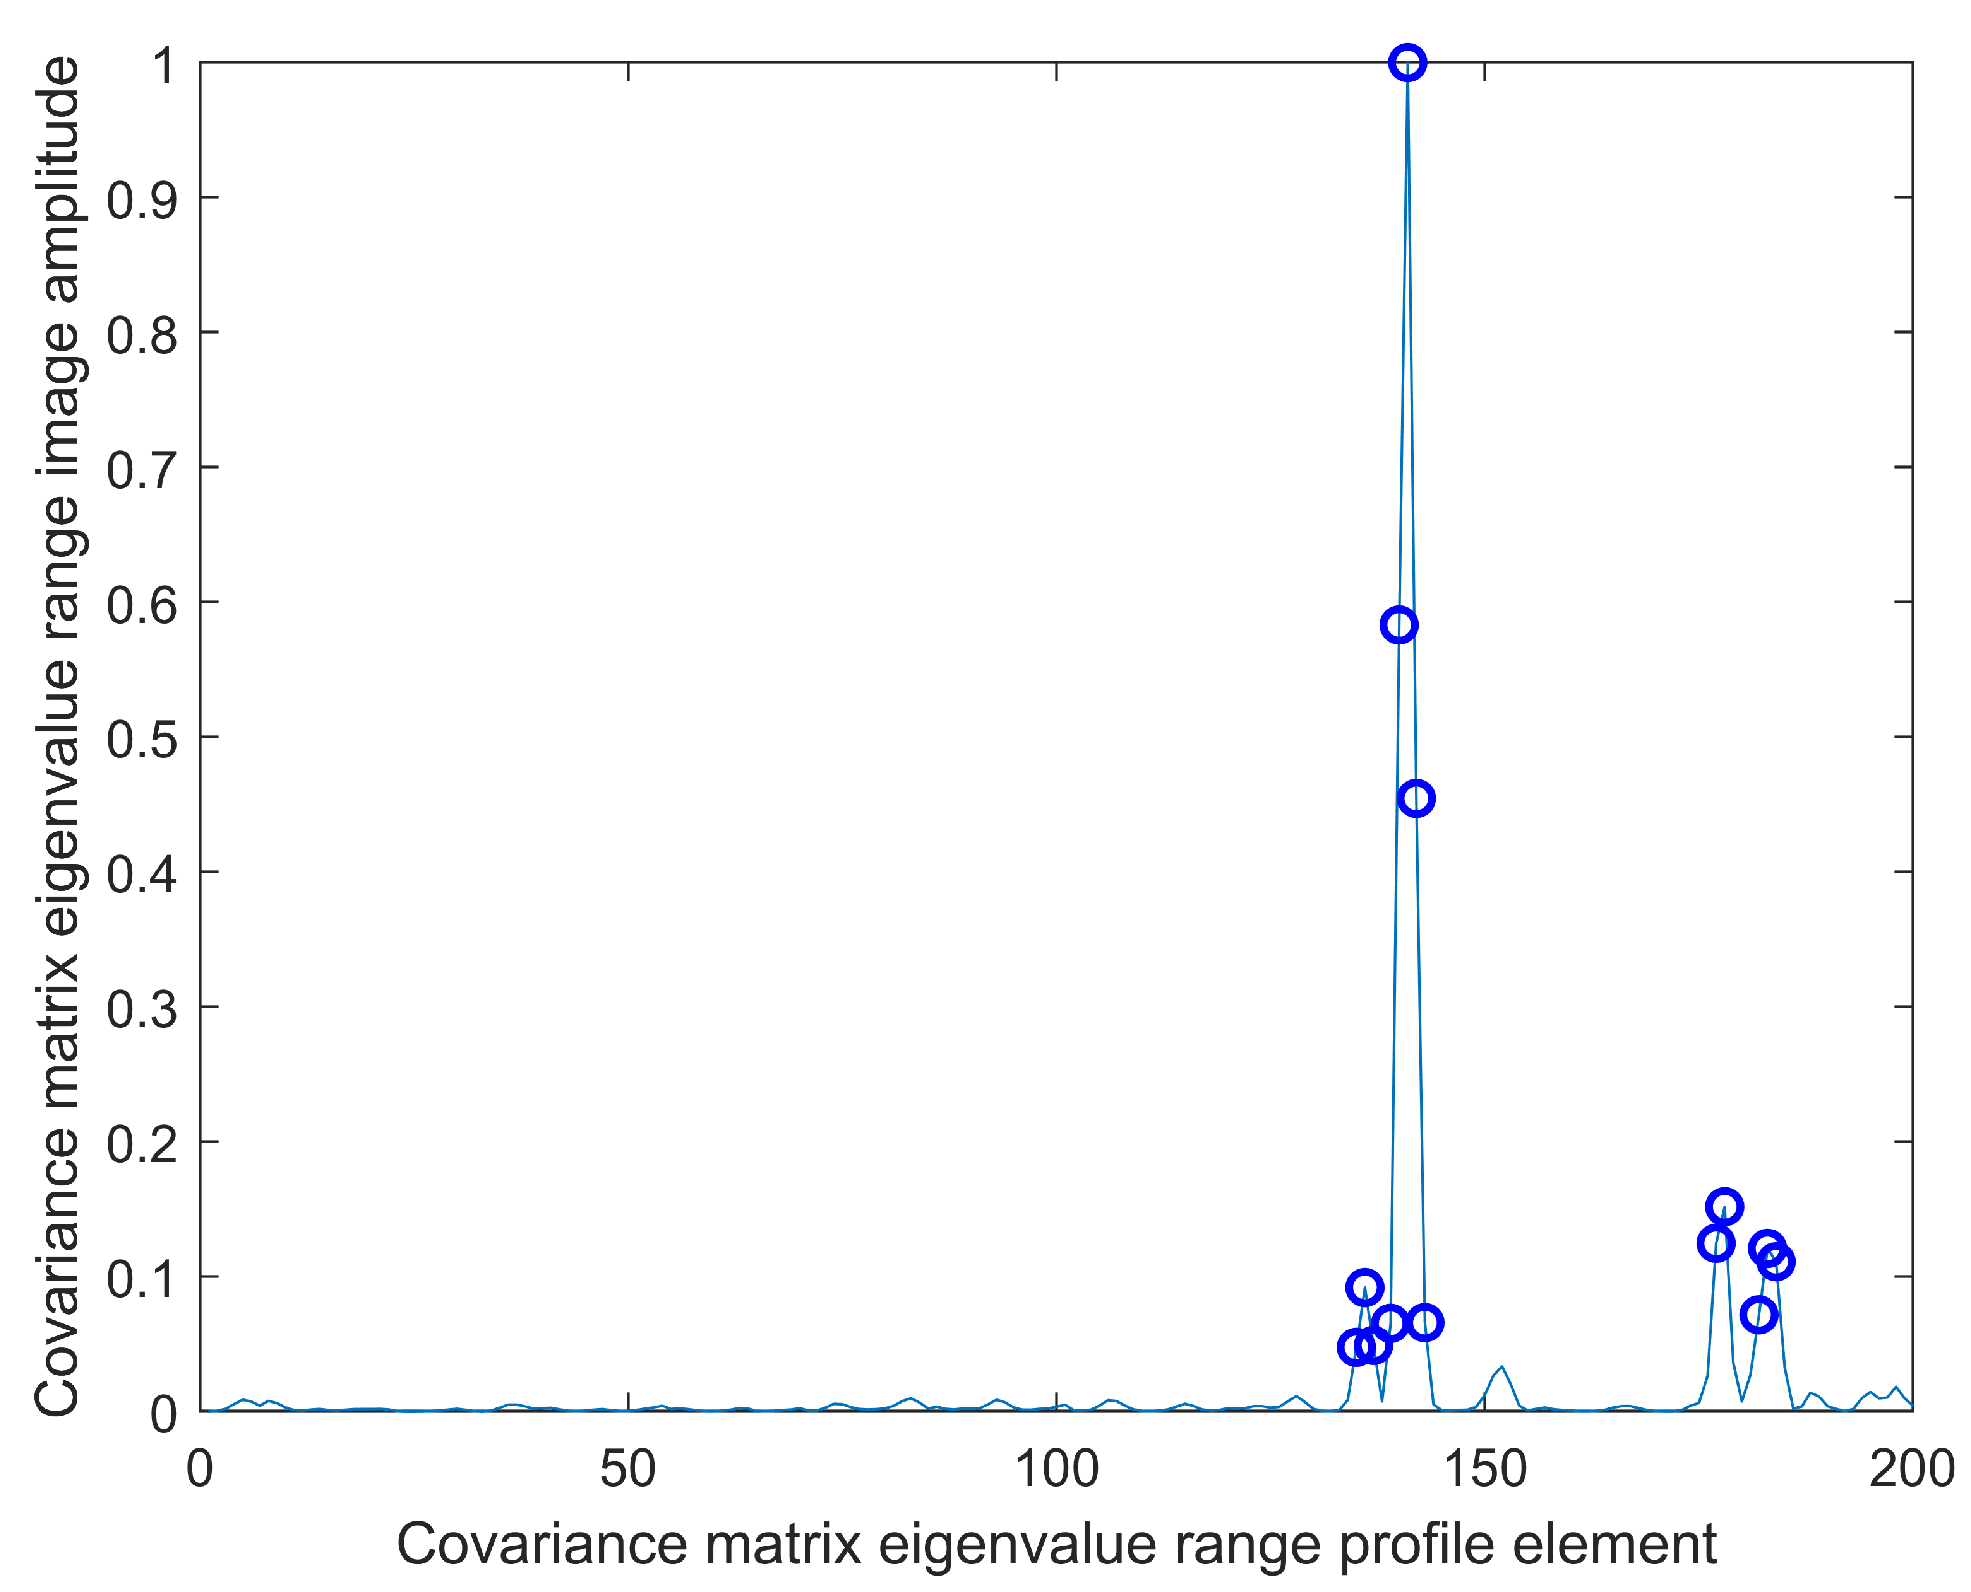
Furthermore, Figure 15 demonstrates the outcome of target detection on the maximum eigenvalue distance image of the Hermitian matrix utilizing the integral extended target detection method. A notable observation is that the panoramic maximum eigenvalue range image exhibits a significant enhancement in the signal-to-noise ratio. Consequently, upon comparison with prior information on the radar scattering center, it becomes evident that the improved signal-to-noise ratio enables the successful detection of all four scattering centers. This outcome highlights the efficacy of the integral extended target detection method in enhancing the detectability of scattering centers and improving the overall performance of radar target detection.
The experimental results indicate that utilizing the maximum eigenvalue of the Hermitian matrix as a test statistic can significantly enhance the signal-to-clutter ratio and improve radar target detection probability. This observation underscores the efficacy of the proposed method in enhancing the overall performance of radar target detection. The results further highlight the potential of the maximum eigenvalue of the Hermitian matrix as a test statistic in the context of stepped-frequency radar target detection, thereby offering promising opportunities for enhancing radar target detection capabilities.
4. Discussion
To further validate the effectiveness of the proposed method, Target 2 and Target 3 were selected as the subjects for detection. The 3D model diagrams of Target 2 and Target 3 are depicted in Figure 16a and Figure 16h, respectively. The detection process was carried out using a stepped-frequency radar in the same scene. This experimental design allows for the observation and analysis of the reflection characteristics and radar return signals of Target 2 and Target 3 at different frequency steps. The subsequent analysis presented in this paper aims to assess the applicability and effectiveness of the proposed method across various targets, thereby providing comprehensive insights into its performance.
In this study, we utilized a pulse compression technique to enhance the radar echo of Target 2 in a disk-flying scene. Figure 16b depicts the three-dimensional radar echo map obtained after performing the Inverse Fast Fourier Transform (IFFT) between two pulses of the target. The observation from Figure 16b indicates a minimal difference between the target and the background, resulting in a less conspicuous target appearance. To address this challenge, we introduce the maximum eigenvalue of the Hermitian matrix as the detection statistic. Subsequently, Figure 16c presents a three-dimensional image of the maximum eigenvalue of the Hermitian matrix, revealing that the utilization of the maximum eigenvalue of the sliding window covariance matrix as the detection statistic enables clear differentiation of the target from the background. This enhancement facilitates more accurate target location detection.
Furthermore, to assess the performance of the maximum eigenvalue of the sliding window covariance matrix, localized enlarged images of the one-dimensional range profile and the maximum image of the one-dimensional covariance matrix are extracted, as depicted in Figure 16d and Figure 16e, respectively. The experimental results demonstrate that the signal-to-clutter ratio of the one-dimensional range profile is approximately 14.56 dB, while the signal-to-clutter ratio of the maximum range profile of the one-dimensional covariance matrix reaches approximately 21.5 dB. By utilizing the maximum eigenvalue of the Hermitian matrix as the detection statistic, a noteworthy improvement in the signal-to-clutter ratio of approximately 6.94 dB is observed. This significant increase signifies that the maximum eigenvalue of the Hermitian matrix plays a crucial role in enhancing the signal-to-noise ratio, thereby leading to improved target detection performance.
Furthermore, Figure 16f,g exhibits the localized amplification maps of the one-dimensional range profile and the maximum range profile of the one-dimensional covariance matrix in target detection. Upon observation of these two images, it becomes apparent that employing the maximum range profile of the one-dimensional covariance matrix enables the detection of two scattering centers, whereas the one-dimensional range profile can only detect a single scattering center.
In this study, we utilized a pulse compression technique to enhance the radar echo of Target 3 in a disk-flying scene. Figure 16i illustrates a three-dimensional radar echo map obtained through the Inverse Fast Fourier Transform (IFFT) of three pulses from the target. Upon examining Figure 16i, it becomes apparent that there is a minimal difference between the target and the background, resulting in a less pronounced target appearance. In contrast, Figure 16j presents a three-dimensional image depicting the maximum eigenvalue of the sliding window covariance matrix. By analyzing Figure 16j, it can be observed that utilizing the maximum eigenvalue of the sliding window covariance matrix as the detection statistic enables clear differentiation of the target from the background. This enhancement in target distinguishability allows for more accurate target location detection. To further assess the effectiveness of the maximum eigenvalue of the sliding window covariance matrix, localized enlarged images of the one-dimensional range profile and the maximum image of the one-dimensional covariance matrix are extracted, as shown in Figure 16k and Figure 16l, respectively. The experimental results indicate that the signal-to-clutter ratio of the one-dimensional range profile is approximately 13.98 dB, while the signal-to-clutter ratio of the maximum image of the one-dimensional covariance matrix reaches approximately 22.8 dB. It is noteworthy that the utilization of the maximum eigenvalue of the sliding window covariance matrix as the detection statistic leads to an increase in the signal-to-clutter ratio by approximately 8.82 dB. This improvement highlights the significant capability of the maximum eigenvalue of the sliding window covariance matrix in enhancing the signal-to-noise ratio, ultimately improving the performance of target detection.
In summary, the target detection outcomes obtained through the utilization of the maximum range profile of the one-dimensional sliding window covariance matrix align with our prior knowledge of the target. This alignment serves to further validate the efficacy of the maximum eigenvalue of the sliding window covariance matrix as a reliable detection statistic. By adopting this approach, there is a noteworthy enhancement in the signal-to-clutter ratio, leading to an increased probability of successful target detection. Consequently, this method holds significant practical value in enhancing the detection of Target 2 and Target 3 when utilizing stepped-frequency radar.
5. Conclusions
In this paper, we propose a novel target detection method for ground target detection using stepped-frequency radar. Our method addresses the challenges posed by non-uniform, non-stationary, and complex ground clutter. Unlike traditional approaches that rely on clutter characteristics, our method utilizes the eigenvalue decomposition of the Hermite matrix to enhance target detection accuracy.
To achieve this, we construct a sliding window Hermite matrix and compute the covariance matrix of the samples within the window blocks. The maximum eigenvalue of this covariance matrix is then employed as the test statistic. By avoiding the need for statistical modeling of clutter, our method mitigates the performance degradation caused by model inaccuracies and mismatches. We validate the effectiveness of our proposed method using measured data from a stepped-frequency radar. In this study, we utilized the pulse compression technique to enhance the radar echo of Target 1, Target 2, and Target 3, which are three different scattering center targets in a disk-flying scene. Experimental results demonstrate significant improvements in the signal-to-clutter ratio and target detection probability compared with traditional methods that rely on energy-based test statistics. This indicates the promising application potential of our proposed method.
Therefore, our research makes an important contribution to ground target detection using stepped-frequency radar. It provides valuable insights and can serve as a reference for future studies in related fields.
Author Contributions
Theoretical study, experiments, and writing Y.X.; experimental environment and software Y.Z.; review and editing, Z.S. All authors have read and agreed to the published version of the manuscript.
Funding
This work was supported by the National Natural Science Foundation of China under Grant 61401475.
Data Availability Statement
The data presented in this study are available on request from the author. The data are not publicly available because it is currently privileged information.
Acknowledgments
The authors extend their sincere thanks to the editors and reviewers for their careful reading and fruitful suggestions.
Conflicts of Interest
The authors declare no conflicts of interest.
References
- Knill, C.; Schweizer, B.; Sparrer, S.; Roos, F.; Fischer, R.F.; Waldschmidt, C. High Range and Doppler Resolution by Application of Compressed Sensing Using Low Baseband Bandwidth OFDM Radar. IEEE Trans. Microw. Theory Technol. 2018, 66, 3535–3546. [Google Scholar] [CrossRef]
- Mao, S.Y. The Impact of Bandwidth on Target Detection in High Resolution Radar. J. Astronaut. 2006, 27, 5. [Google Scholar]
- Tao, M.L.; Zhou, F.; Zhang, Z.J. Wideband Interference Mitigation in High-Resolution Airborne Synthetic Aperture Radar Data. IEEE Trans. Geosci. Remote Sens. 2016, 54, 74–87. [Google Scholar] [CrossRef]
- Pen, S. Squinted high resolution SAR based on the frequency synthetic bandwidth. J. Xi Dian Univ. 2015, 24, 7. [Google Scholar]
- Yang, D.; Guo, Y.; Yin, T.; Lin, B. Cost-Effective Gaussian Processes Based Extended Target Tracking. IEEE Trans. Aerosp. Electron. Syst. 2023, 59, 8282–8296. [Google Scholar] [CrossRef]
- Xu, Z.; Xie, Z.; Fan, C.; Huang, X. Probabilistically Robust Radar Waveform Design for Extended Target Detection. IEEE Trans. Signal Process. 2022, 70, 4212–4224. [Google Scholar] [CrossRef]
- Hwang, W.J.; Jang, H.J.; Choi, M.-R. Clutter Cancellation Methods for Small Target Detection Using High-Resolution W-band Radar. Sensors 2023, 23, 7557. [Google Scholar] [CrossRef]
- Li, T.; Liang, Z.N.; Liu, Q.H. Advanced technology of high-resolution radar: Target detection, tracking, imaging, and recognition. Sci. China Inf. Sci. 2019, 62, 40301. [Google Scholar] [CrossRef]
- Buck, A.; Keller, J.M.; Popescu, M.; Sheen, D.; Luke, R.H. Target detection in high-resolution 3D radar imagery. Proc. SPIE 2017, 10182, 411–420. [Google Scholar] [CrossRef]
- Xu, H.; Zhang, J.; Liu, W.; Wang, S.; Li, C. High-Resolution Radar Waveform Design Based on Target Information Maximization. IEEE Trans. Aerosp. Electron. Syst. 2020, 56, 3577–3587. [Google Scholar] [CrossRef]
- Yi, L.; Kaname, R.; Mizuno, R.; Li, Y.; Fujita, M.; Ito, H.; Nagatsuma, T. Ultra-Wideband Frequency Modulated Continuous Wave Photonic Radar System for Three-Dimensional Terahertz Synthetic Aperture Radar Imaging. J. Light. Technol. 2022, 40, 6719–6728. [Google Scholar] [CrossRef]
- Saleh, M.; Omar, S.M.; Grivel, E.; Legrand, P. A variable chirp rate stepped frequency linear frequency modulation waveform designed to approximate wideband non-linear radar waveforms. Digit. Signal Process. 2021, 109, 102884. [Google Scholar] [CrossRef]
- Yang, J.; Huang, X.; Jin, T.; Thompson, J.; Zhou, Z. Synthetic Aperture Radar Imaging Using Stepped Frequency Waveform. IEEE Trans. Geosci. Remote Sens. 2012, 50, 2026–2036. [Google Scholar] [CrossRef]
- Nguyen, L. Signal processing techniques for stepped frequency ultra-wideband radar. Radar Sens. Technol. 2014, 9077, 469–475. [Google Scholar] [CrossRef]
- He, S.W.; Wu, X. Research of a Radar Imaging Algorithm Based on High Pulse Repetition Random Frequency Hopping Synthetic Wideband Waveform. Sensors 2019, 19, 5424. [Google Scholar] [CrossRef]
- Aubry, A.; Carotenuto, V.; De Maio, A.; Pallotta, L. High Range Resolution Profile Estimation via a Cognitive Stepped Frequency Technique. IEEE Trans. Aerosp. Electron. Syst. 2019, 55, 444–458. [Google Scholar] [CrossRef]
- Schweizer, B.; Knill, C.; Schindler, D.; Waldschmidt, C. Stepped-Carrier OFDM-Radar Processing Scheme to Retrieve High-Resolution Range-Velocity Profile at Low Sampling Rate. IEEE Trans. Microw. Theory Technol. 2018, 66, 1610–1618. [Google Scholar] [CrossRef]
- Schimpf, H.; Wahlen, A.; Essen, H. High range resolution by means of synthetic bandwidth generated by frequency-stepped chirps. Electron. Lett. 2003, 39, 1346–1348. [Google Scholar] [CrossRef]
- Yu, L.; Li, Y.; Yang, Y. Method of Aerial Target Length Extraction Based on High Resolution Range Profile. In Proceedings of the 2019 IEEE International Conference on Signal, Information and Data Processing (ICSIDP), Chongqing, China, 11–13 December 2019. [Google Scholar] [CrossRef]
- Li, L.; Liu, Z.; Li, T. Radar high-resolution range profile feature extraction method based on multiple kernel projection subspace fusion. IET Radar Sonar Navig. 2018, 12, 417–425. [Google Scholar] [CrossRef]
- Liao, Z.; Li, Y. A Range Profile Synthesis Method for Random Frequency Hopping Radar and Comparison with Experiments. Procedia Comput. Sci. 2018, 131, 545–550. [Google Scholar] [CrossRef]
- Zhou, D.; Shen, X.; Yang, W. Radar target recognition based on fuzzy optimal transformation using high-resolution range profile. Pattern Recognit. Lett. 2013, 34, 256–264. [Google Scholar] [CrossRef]
- Xiang, Q.; Wang, X.; Lai, J.; Song, Y.; Li, R.; Lei, L. Multi-scale group-fusion convolutional neural network for high-resolution range profile target recognition. IET Radar Sonar Navig. 2022, 16, 1997–2016. [Google Scholar] [CrossRef]
- Liang, C.; Li, Y.; Lu, D.; Long, T.; Chen, P. An improved target extraction algorithm for stepped frequency chirp signal. In Proceedings of the IET International Radar Conference 2013, Xi’an, China, 14–16 April 2013. [Google Scholar] [CrossRef]
- Li, P.; Ding, Z.; Zhang, T.; Wei, Y.; Gao, Y. Detection and Imaging Algorithm for Radar Sparse Targets via CFAR-ADMM. IEEE Trans. Geosci. Remote Sens. 2023, 61, 5204015. [Google Scholar] [CrossRef]
- Yang, J.; Yi, J.; Sakamoto, T.; Wan, X. An Extended Target Detector Using Image-Processing Techniques Exploiting Energy-Spillover Phenomenon in Radar Echoes. IEEE Sens. J. 2023, 23, 22919–22929. [Google Scholar] [CrossRef]
- Zhao, W.; Chen, Z.; Jin, M. Subband Maximum Eigenvalue Detection for Radar Moving Target in Sea Clutter. IEEE Geosci. Remote Sens. Lett. 2021, 18, 281–285. [Google Scholar] [CrossRef]
- Jiang, Y.; Wang, Y.H.; Li, Y.; Chen, X. Eigenvalue-based ground target detection in high-resolution range profiles. IET Radar Sonar Navig. 2020, 14, 1747–1756. [Google Scholar] [CrossRef]
Figure 1.
Stepped-frequency radar complex detection scene.

Figure 2.
Frequency and time relationship figure of the stepped-frequency radar transmitting signal.
Figure 2.
Frequency and time relationship figure of the stepped-frequency radar transmitting signal.

Figure 3.
The flow chart of the detection method based on the maximum eigenvalue of the Hermitian covariance matrix.
Figure 3.
The flow chart of the detection method based on the maximum eigenvalue of the Hermitian covariance matrix.

Figure 4.
Radar dish flight path diagram.

Figure 5.
3D model of Target 1.

Figure 6.
Pulse compression radar 2D image of Target 1.

Figure 7.
Pulse compression radar 3D image of Target 1.

Figure 8.
IDFT radar 2D image of Target 1.

Figure 9.
IDFT radar 3D image of Target 1.

Figure 10.
Hermitian matrix maximum eigenvalue IDFT image of Target 1.

Figure 11.
Hermitian matrix maximum eigenvalue IDFT 3D image of Target 1.

Figure 12.
One-dimensional range profile extraction for local magnification.

Figure 13.
One-dimensional Hermitian matrix maximum eigenvalue distance profile extraction for local magnification.
Figure 13.
One-dimensional Hermitian matrix maximum eigenvalue distance profile extraction for local magnification.

Figure 14.
One-dimensional range profile target detection for local magnification.

Figure 15.
One-dimensional Hermitian matrix maximum eigenvalue distance profile target detection for local magnification.
Figure 15.
One-dimensional Hermitian matrix maximum eigenvalue distance profile target detection for local magnification.

Figure 16.
(a) 3D model of Target 2. (b) IDFT radar 3D image of Target 2. (c) Hermitian matrix maximum eigenvalue IDFT 3D image of Target 2. (d) One-dimensional range profile extraction for local magnification of Target 2. (e) One-dimensional Hermitian matrix maximum eigenvalue distance profile extraction for local magnification of Target 2. (f) One-dimensional range profile target detection for local magnification of Target 2. (g) One-dimensional Hermitian matrix maximum eigenvalue distance profile target detection for local magnification of Target 2. (h) 3D model of Target 3. (i) IDFT radar 3D image of Target 3. (j) Hermitian matrix maximum eigenvalue IDFT 3D image of Target 3. (k) One-dimensional range profile extraction for local magnification of Target 3. (l) One-dimensional Hermitian matrix maximum eigenvalue distance profile extraction for local magnification of Target 3. (m) One-dimensional range profile target detection for local magnification of Target 3. (n) One-dimensional Hermitian matrix maximum eigenvalue distance profile target detection for local magnification of Target 3.


Table 1.
Parameter setting.
| Parameter Name | Numerical Magnitude | Unit |
|---|---|---|
| Light velocity | m/s | |
| Pulse width | 48 | |
| Step frequency interval | 15 | |
| Sampling rate | 120 | |
| Radial distance | 1500 | m |
| Tail down angle | 27 | ° |
| Step frequency points | 64 | / |
| Signal carrier frequency | 92 | |
| False alarm probability | / | |
| Test window width | 128 | / |
| Protection window width | 64 | / |
| Reference window width | 64 | / |
Disclaimer/Publisher’s Note: The statements, opinions and data contained in all publications are solely those of the individual author(s) and contributor(s) and not of MDPI and/or the editor(s). MDPI and/or the editor(s) disclaim responsibility for any injury to people or property resulting from any ideas, methods, instructions or products referred to in the content. |
© 2024 by the authors. Licensee MDPI, Basel, Switzerland. This article is an open access article distributed under the terms and conditions of the Creative Commons Attribution (CC BY) license (https://creativecommons.org/licenses/by/4.0/).
Share and Cite
MDPI and ACS Style
Xu, Y.; Zhu, Y.; Song, Z. A New Extended Target Detection Method Based on the Maximum Eigenvalue of the Hermitian Matrix. Remote Sens. 2024, 16, 1488. https://0-doi-org.brum.beds.ac.uk/10.3390/rs16091488
AMA Style
Xu Y, Zhu Y, Song Z. A New Extended Target Detection Method Based on the Maximum Eigenvalue of the Hermitian Matrix. Remote Sensing. 2024; 16(9):1488. https://0-doi-org.brum.beds.ac.uk/10.3390/rs16091488
Chicago/Turabian StyleXu, Yong, Yongfeng Zhu, and Zhiyong Song. 2024. "A New Extended Target Detection Method Based on the Maximum Eigenvalue of the Hermitian Matrix" Remote Sensing 16, no. 9: 1488. https://0-doi-org.brum.beds.ac.uk/10.3390/rs16091488
Note that from the first issue of 2016, this journal uses article numbers instead of page numbers. See further details here.