Article

Using Keyhole Images to Map Soil Liquefaction Induced by the 1966 Xingtai Ms 6.8 and 7.2 Earthquakes, North China

1
Key Laboratory of Earthquake Prediction, Institute of Earthquake Forecasting, China Earthquake Administration, Beijing 100036, China
2
College of Mining Engineering, Taiyuan University of Technology, Taiyuan 030024, China
*
Author to whom correspondence should be addressed.
Remote Sens. 2023, 15(24), 5777; https://0-doi-org.brum.beds.ac.uk/10.3390/rs15245777
Submission received: 8 November 2023 / Revised: 6 December 2023 / Accepted: 13 December 2023 / Published: 18 December 2023

Abstract

:
In March 1966, Ms 6.8 and 7.2 earthquakes occurred in Xingtai, North China, resulting in widespread soil liquefaction that caused severe infrastructure damage and economic losses. Using Keyhole satellite imagery combined with aerial images and fieldwork records, we interpreted and identified 66,442 liquefaction points and analyzed the coseismic liquefaction distribution characteristics and possible factors that influenced the Xingtai earthquakes. The interpreted coseismic liquefaction was mainly concentrated above the IX-degree zone, accounting for 80% of all liquefaction points. High-density liquefaction zones (point density > 75 pieces/km2) accounted for 22% of the total liquefaction points. Most of the interpreted liquefaction points were located at the region with a peak ground acceleration (PGA) of >0.46 g. The liquefaction area on 22 March was significantly larger than that on 8 March. The region of liquefaction was mainly limited by sandy soil conditions, water system conditions, and seismic geological conditions and distributed in areas with loose fine sand and silt deposits, a high water table (groundwater level increases before both mainshocks corresponding to the liquefaction intensive regions), rivers, and ancient river channels. Liquefaction exhibited a repeating characteristic in the same region. Further understanding of the liquefaction characteristics of Xingtai can provide a reference for the prevention of liquefaction in northern China.

Graphical Abstract

1. Introduction

Liquefaction is a common phenomenon associated with large-magnitude earthquakes. Soil liquefaction refers to the phenomenon in which saturated sandy soils are subjected to strong vibrations from an earthquake and present a liquid state after the stress between soil grains disappears [1,2]. When liquefaction occurs, pore water moves from the bottom to the top under the action of excess pore water pressure. In the process of water flow, sand breaks through the cover layer or sprays out along the cracks to the surface [2,3]. Soil liquefaction is a serious seismic hazard caused by earthquakes, and it is usually accompanied by widespread ground deformation, subsidence, and sandblasting [4]. Extensive liquefaction-induced foundation failure and ground deformation have caused infrastructure and building damage and resulted in heavy economic losses worldwide, such as after the 1964 Niigata earthquake in Japan [5], the 1995 Kobe earthquake [6], the 1999 Chi-Chi earthquake [7], the 2008 Wenchuan earthquake [8], and the 2010–2011 Canterbury earthquake sequence [9,10]. The 6 February 2023 earthquake in Turkey induced widespread liquefaction and subsequent damage [11]. Thus, investigations of liquefaction have become a necessary component of modern earthquake research.
On 8 March 1966, an earthquake of Ms 6.8 occurred in the area of Malan village, Longyao County, Xingtai District, Hebei Province, at a depth of 10 km and an intensity of IX degrees in the epicenter area, and on 22 March, another earthquake of Ms 7.2 occurred in the area of Dongwang village, Ningjin County, at a depth of 9 km and an intensity of X degrees in the epicenter area [12]. These two major earthquakes caused damage in more than 100 counties in Hebei Province and neighboring areas [13]. A destructive earthquake of approximately M 6 occurred in the Xingtai area in 777 A.D., and in the subsequent 1189 years, namely, to 1966, eight earthquakes of M 4.5 or greater occurred in the area, with the Ms 7.2 earthquake on 22 March 1966 being the largest ever reported [14]. The 1966 Xingtai earthquake was the first destructive earthquake to occur in a densely populated area since the founding of the People’s Republic of China [15], and its epicenter was close to Beijing. Researchers from the Chinese Academy of Sciences, Ministry of Geology, and other departments visited the earthquake site immediately afterward to carry out observations and research. In-depth investigations and on-site studies revealed that earthquakes may have precursors that could help to forecast future events, thus providing insights for future research on earthquake forecasting and promoting investigations into earthquake causes in China. Researchers observed extensive liquefaction phenomena during the Xingtai earthquake site investigation. Some researchers even witnessed ground liquefaction during the 22 March earthquake [16]. The most serious manifestation of surface liquefaction is sandblast, which is one of the main causes of ground damage [17]. Liquefaction has caused farmland flooding, well blockage, river embankment damage, and house sinking, cracking, and collapse, thereby threatening the safety of people’s lives and property [12].
Liquefaction after the Xingtai earthquake is representative of this phenomenon that occurred throughout the around the Beijing Metropolitan Area and Bohai Rim and has reference value for the entire North China Plain region (Figure 1). Detailed liquefaction damage information and research experience can be obtained by studying the entire range of liquefaction that occurred after the Xingtai earthquakes [11,18,19,20]. Previous liquefaction studies of the Xingtai earthquake were based on field investigations and concentrated in local areas. Because of time and technological limitations, more comprehensive liquefaction distribution maps and characteristics have not been obtained. In modern times, the detailed study of coseismic liquefaction events has increased. There are more efficient and intelligent tools and methods to obtain the complete range of recent coseismic liquefaction. Thus, older events with high-quality archive images can also be studied further with advanced technology, which can help reveal macro-features that were not detected in previous site visits and elucidate the factors influencing liquefaction induced by the Xingtai earthquakes. Based on the previously collected field survey data, this study proposes a method to accurately locate and quantitatively record the liquefaction orientation, distribution range, and further feature analysis using image data. This paper represents a reference for the research methods of sediment deformation caused by recent modern earthquakes in the North China Plain region and provides basic information for identifying liquefaction-prone zones caused by modern earthquakes and preventing and controlling liquefaction hazards.

2. Earthquake and Geological Background

The tectonics of North China are dominated by the Shanxi Fault System in the west, the narrow strike-slip fault zone (Tanlu Fault Zone) in the east, and the hidden fault zone of the North China Plain in the center. Roughly bounded by the Taihang Mountains, the seismicity of North China is divided into eastern and western parts (Figure 1a) [27]. The North China Plain in the east experienced strong strain and rift sinking in the early Cenozoic, and a series of northeast-east strike faults intertwined with part of the north-west-west faults to cut the basin into block tectonics, thus generating the Xingtai earthquakes in the Shuanglu Fault Basin [28]. The Shulu Fault Basin is generally elongated and has a length of approximately 70 km and a width of 14–20 km [29,30]. The source of the Xingtai earthquake was originally considered a northeast trending right-turning fault that corresponded to the Xinhe Fault within the Shulu Fault Basin [31]. However, the Xinhe Fault has not been active since the Late Pleistocene and is not a seismogenic fault [32]. Based on previous studies, Xu et al. (2000) suggested that the Xingtai earthquake was the product of the interaction of discontinuous pre-existing deep faults that ruptured upwards to form “new faults” under the effect of the latest tectonic stress field [33].
During the 10 years from 1966 to 1976, the Xingtai, Hejian, and Tangshan earthquakes in the North China Plain area occurred on the Tangshan–Hejian–Cixian fault. Xu et al. (1996), through the analysis of seismic and geological data, concluded that the Tangshan-Hejian–Cixian fault is a northeast-oriented new seismic tectonic zone that began to develop in the Neogene, and 17 earthquakes of M 6 or above have occurred in this zone, among which the 1976 Tangshan M 7.8 earthquake was the largest [34]. Later, Yin et al. (2015) combined historical records and early paleo-earthquake findings to show that a 160 km seismic null zone exists along the northeast-sliding right-lateral Tangshan–Hejian–Cixian fault zone (Figure 1a) [26].
Records have shown that major earthquakes have occurred in North China since ancient times, including the 1556 A.D. Huaxian earthquake, 1679 A.D. Sanhe-Pinggu earthquake, 1969 Bohai earthquake, and 1976 Tangshan earthquake, all of which have produced liquefaction phenomena, such as gushing water from cracks in the ground, springs of black sand, subsidence, and sandblasting holes around the river, especially in the plains area of the earthquake [14]. Liquefaction is widely distributed throughout the North China Plain and was observed after the Tangshan earthquake in 1976, which liquefied an area of approximately 24,000 km2 [35,36,37,38]. The main reason for this is that loose Quaternary sediments cover the North China Plain, and the water table is very high because of the dense rainy season, which can easily cause soil liquefaction in the event of a strong earthquake. The situation in the North China Plain cannot be separated from the long-term overflow and diversion of the Yellow River during the historical period. The formation of sedimentary patterns and hydrological conditions over a wide area from the Haihe River in the north to the Huaihe River in the south is related to the Yellow River (Figure 1) [39]. Therefore, the problem of earthquake-induced soil liquefaction in the North China Plain region of China warrants additional attention.
The depositional and hydrological conditions of the Xingtai area reflect those of the entire North China Plain region. The Xingtai earthquake area is located at the southwest edge of the alluvial fan of the Hutuo River, the fore edge of the premountain flood-alluvial tilted plains of the Taihang Mountains, and between the Lacustrine-alluvial depressions and alluvial plains of the ancient Ningjinbo Lake [40]. The basement of the seismic area is covered by a wide range of Tertiary-Quaternary loose sedimentary layers, and the thickness of the Quaternary layer cover can reach approximately 300–550 m [41]. These layers are muddy and sandy river and lake sediments, and the historical depositional environment in this area was related to the frequent diversion and migration of the Yellow River, XiaoZhanghe River, and Hutuohe River (Figure 1) [28].

3. Data and Methods

The initial development of remote sensing imagery has allowed for the accurate tracing of certain earthquakes that occurred in the recent past. Surface liquefaction is a short-lived phenomenon and must be recorded within a short period after an earthquake; thus, field investigations must be highly efficient. The Xingtai earthquake is one of the few recent earthquakes for which high-quality short-term post-earthquake aerial images, Keyhole satellite images, and detailed field survey data are available. Based on multiple image records of this earthquake, multisource high-resolution images were used to provide a more complete interpretation of the liquefaction phenomenon in this earthquake case. We used ArcGIS software (http://www.esri.com/software/ArcGIS, accessed on 1 September 2022) to align the keyhole images and then identified and vectorized the liquefaction points on the images. The final liquefaction database was verified against descriptions of liquefaction in the literature, and the topographic background was overlapped for detailed mapping. The software counts the number of liquefaction points, calculates the liquefaction area, and provides information on the extent of liquefaction, distribution patterns, and characteristics. In addition, the statistics on the number of collapsed buildings and population casualties from the book “1966 Xingtai Earthquake Fact Sheet” are collated, and the data are used to make the seismic damage kernel density map with ArcGIS. Finally, by combining the interpretation results and field study records and taking into account many factors, such as the regional sedimentary structure and water system conditions, we analyzed the formation mechanism of widespread liquefaction by this earthquake. Figure 2 shows a flowchart of this procedure.
Keyhole satellites are optical reconnaissance satellites developed by the American military that have a high resolution that far exceeds that of commercial satellites of the same period, and three sets of images from 1959 to 1984 have been declassified and made available for download. We acquired multiperiod Keyhole images with a resolution of approximately 3 m covering an area of approximately 50,000 km2 from the USGS (https://earthexplorer.usgs.gov/, accessed on 11 November 2022) for the period before the earthquake (23 August 1965) and for one month after the earthquake (15 April 1966). After the Xingtai earthquake, the relevant departments also carried out aerial imaging, starting on 12 March and ending on 3 April to preserve valuable preliminary information on the distribution of the damage caused by the earthquake. The total area covered by aerial photography was 1704 km2, with 225 km2 after the first earthquake and 1479 km2 after the second earthquake [28]. Because aerial images covered only the severely damaged area while the Keyhole image comprehensively covered the full range affected by this earthquake, the aligned post-earthquake Keyhole image was chosen to interpret the liquefaction phenomenon over a fuller range. Aerial images assist in the interpretation of liquefaction details. Pre-earthquake Keyhole imagery was used to examine the identified liquefaction and eliminate the possibility that liquefaction occurred prior to the earthquake (Figure 3). In addition, GF-7 images were acquired from the China Resource Satellite Application Center (https://data.cresda.cn/, accessed on 7 May 2023) and ESRI world images (with a spatial resolution of 0.6–1.2 m) to identify the extent of rural buildings, and these images were supplemented with field UAV photographs to preliminarily identify the structures representing newly built houses. By comparing the building boundaries between 1966 and 2023, we obtained the range of village building expansion and analyzed the seismic risk of newly constructed buildings in the liquefaction zone.
In this study, seismic liquefaction phenomena recorded in the data, features of imaged liquefaction phenomena, and other people’s experience in interpreting liquefaction were used as references to establish guidance for identifying liquefaction and interpreting signs of liquefaction in the study area [25,42,43,44]. Generally, the phenomena of sandblasting, subsidence, and lateral spreading are taken as evidence for determining liquefaction, and the liquefaction potential of subsurface soils may also be inferred from damage to surface facilities. Sandblasting was used as the main sign of liquefaction for both the Tangshan and Wenchuan earthquakes [3,36,45], and surface damage caused by the Xingtai earthquake was also dominated by sandblasting [38]; thus, we mapped this liquefaction feature as points in this study. Liquefied sand ejected from the surface is depicted as white or light-gray tones on images or darker gray-black tones if ponding water is present. Individual sandblast holes are mainly round and oval, while continuous holes form beads or lines. A dense number of liquefaction pits can be linked into sheets that can be easily distinguished from surrounding features with clear boundaries. We extracted the seismic liquefaction information for Xingtai using these indicators.
The Keyhole data we used in this paper include local autumn images in September 1965 before the earthquake and images in April 1966 within one month after the earthquake (Figure 3). The pre-earthquake images more realistically reflect the local features. According to the previous land use type, the local spring plowing time was generally in mid-to-late April, so the Keyhole images obtained after the earthquake reflect the overall characteristics of the coseismic liquefaction. At the same time, we obtained some aerial images (Figure 3) of the epicenter area from March to April 1966. Through comparison, it was found that although the clarity of the Keyhole images was not as complete and clear as the aerial images, there was a significant difference in color tone between the liquefied area and the non-liquefied area, especially the large-area liquefaction pits distributed in a planar manner (Figure 3).
Regarding the completeness of liquefaction interpretation, there are three issues here: (1) The spatial resolution of the Keyhole data is about 2 m, so the area of liquefaction points we can determine must reach a certain scale. For horizontally expanding areas, we cannot extract the smaller liquefaction points within the cracks. Therefore, the number of liquefaction points in the liquefaction intensive area that we interpret is the main part of all the liquefaction points triggered by coseismic events. (2) Some villages and towns in the epicenter are encircled by dense liquefaction pits, and the houses in the residential areas have collapsed. As a result, many liquefaction points under the ruins in villages and towns cannot be extracted through remote sensing images. However, many of the liquefaction points in this part of the area were recorded in field surveys at the time. This discovery also illustrates the generality and limitations of remote sensing interpretation. (3) After a certain range of the epicenter, the number of soil liquefaction points we interpret sharply decreases. This is related to the rapid instant of strong ground acceleration values because the number is small. The scale is also small, and therefore the completeness of our inventory coverage far from the epicenter (>40 km) is only approximate.
In sum, the shooting range of traditional post-earthquake aerial photos is limited. Therefore, using publicly shared Keyhole images (https://earthexplorer.usgs.gov/, accessed on 11 November 2022) can provide a more complete coseismic liquefaction database over a larger range, which will help us better understand the farthest distance of coseismic liquefaction from the epicenter. For a clear understanding, our interpretation results are well corroborated with the field investigations of senior scientists after the earthquake, indicating the feasibility of this research interpretation. However, as some scholars have pointed out [19], it is necessary to exhaust the secondary disasters of a strong earthquake case. It is impossible due to the limited resolution and quality of the data used in the research, but obtaining a relatively complete database is still very helpful for understanding the occurrence rules of liquefaction.

4. Results

4.1. Spatial Distribution of Liquefaction Manifestations

A total of 66,442 points were interpreted, thus forming a more complete liquefaction database for the Xingtai seismic zone. Figure 4a shows the distribution of the interpreted liquefaction points, which ranged from 38°24′N to 37°3′N and 114°30′E to 115°40′E. The total liquefaction area was approximately 5000 km2. From the distribution map, liquefaction occurred in all intensity zones, and the spatial inhomogeneity of the distribution was obvious; large-scale liquefaction occurred in the zone above IX degrees, accounting for 80% of all liquefaction points in this case. Most of the liquefaction points were concentrated within Longyao, Ningjin, and Xinhe Counties, and the distribution showed a broader belt-like area at approximately 88 km in length and 35 km in width, with an orientation of approximately 30° northeast. The density distribution map in Figure 4b shows that liquefaction was concentrated in the interval with the highest density within 8 km of the epicenter. This interval reached more than 75 pieces/km2 and accounted for 22% of the total liquefaction points, mainly in the eastern part of Ningjin County and the border area of Xinhe County. Areas with coseismic liquefaction densities greater than 12.5 pieces/km2 accounted for 83% of the total liquefaction points, and only sporadic liquefaction or no liquefaction was observed beyond 30 km from the epicenter area. The density of the liquefaction points in the epicenter area was greater for the 22 March earthquake than for the 8 March earthquake.
According to the 1966 Xingtai Earthquakes Fact Sheet, ground cracks and sandblasting also appeared in low-lying wet areas of riverbanks and old river channels from Xingtang City in the north to Linzhang and Nanle Counties in Henan Province in the south, Linqing Counties in Shandong Province in the east, and Taihang Mountain foothills in the west. However, liquefaction has not been fully interpreted in these areas because of issues with image resolution and timeliness [25], and outside the epicenter, the amount of liquefaction did indeed decrease significantly (Figure 4a). We found that the liquefaction points were distributed as far north as the village of Baiba in Xingtang County on the north bank of the Gaohe River, which is approximately 140 km from the epicenter (Figure 5a), and as far south as Qinghe County on the right bank of the Laosha River, which is approximately 90 km from the epicenter area (Figure 5b).
The 8 March intensive sandblast area occurred in a northeast direction and was distributed within a belt with a length of approximately 40 km, a width of 20 km, and an area of approximately 570 km2. This area was mainly distributed in the south of Gengzhuanqiao, north of Beiyanchi, and on both sides of the Fuyanghe and Xiaozhanghe Rivers (Figure 4). After the earthquake on 22 March, the sandblasted area continued to develop and extend in the northeast direction, with a dense distribution area that was approximately 50 km in length, 40 km in width, and 2000 km2. This area was mainly distributed from Gengzhuangqiao village in the northeast to the area around Dadongsi and Gengzhuangsi villages in Shulu County. Both the 8 and 22 March earthquakes had sandblast areas in the same direction; however, the 22 March earthquake caused much more liquefaction than the 8 March earthquake (Figure 6a). Prof. Gao Weiming of the Institute of Geology, China Academy of Sciences, followed different routes to explore the liquefaction phenomenon from the first main earthquake; three investigations were conducted, from 10 to 16 March, 23 to 27 March, and after 27 March (Figure 6b), and the distribution of coseismic liquefaction was confirmed and recorded in the villages around the epicenter after the 8 March earthquake; some of the sandblasted holes had stopped gushing water but had begun leaking muddy water after the second mainshock, and some new liquefaction points were found. Liquefaction occurred in the villages of Gengzhuangqiao, Maoerzhai, and Niujiaqiao during both earthquakes, suggesting that several villages experienced more than one liquefaction event during the Xingtai earthquake swarm, which may have resulted in the merging of multiple liquefaction phenomena [46].
Observations of paleoseismic liquefaction have also shown that sandy soils that initially liquefy during earthquake shaking can liquefy again during aftershocks [47]. We reviewed detailed records of liquefaction phenomena in villages during the 8 and 22 March earthquakes according to the 1966 Xingtai Earthquake Act Sheet to obtain the villages where liquefaction occurred during both earthquakes, and they are marked with the red square symbol in Figure 6a. Beihouzhuang village, at approximately 27 km from the epicenter of the earthquake, also experienced liquefaction on 8 March, presumably because this area is a low-lying area between two old river channels and the surface deposits are lacustrine sedimentary strata [48]. The villages of Donglizhai, Hucun, and Ping’ancun, north of Shijiazhuang City, also experienced liquefaction during both earthquakes, which is probably because of their proximity to the left bank of the Hutuohe River.

4.2. Characteristics of the Soil Liquefaction Distribution

The frequency of the Xingtai seismic liquefaction points was projected based on the spatial distribution of the inferred deep seismic fault strike, profile CD (see Figure 4, counted at 10 km intervals), and profile EF, which is traced perpendicular to the seismogenic fault strike (see Figure 4, counted at 5 km intervals). The inferred deep seismic fault was approximately 80 km long, and the liquefaction points were almost entirely located in this area. Between both epicenters of the 8 March and 22 March earthquakes, approximately 43% of the total number of liquefaction points were within this area, which shows that the effects of the two earthquakes overlapped and intensified the liquefaction (Figure 7a). Liquefaction points were projected vertically along the strike of the inferred fault, and 65% of the total occurred within 5 km of the inferred fault, with the value increasing to 85% within 10 km of each side of the fault, indicating that the coseismic liquefaction density remained high within a certain range from the epicenter (Figure 7b). Liquefaction is more frequent closer to the epicenter and decreases with distance because of weakening ground motion [49].
The interpreted liquefaction was mostly concentrated in ground cracks, wells, ditches, river beaches, old river channels, lake and marsh depressions, and farmland, with the most serious liquefaction occurring near the Fuyanghe River, Xiaozhanghe River, and ancient Ningjin Lake (Figure 8a,c,e). A small amount of liquefaction was also found in the interior of some villages (Figure 8d). Regarding the terrain and ejector channel constraints, the sandblasted holes were distributed in random spots within farmland (Figure 9a) and in beads and lines along cracks or ditches (Figure 9b). Moreover, many sandblasted holes were connected to form blocks or pieces (Figure 9c). The sandblasted hole parameters also varied in size. For example, sandblasted holes in Ningjin County had diameters up to 8.6 m, depths of 1.2 m, and volumes of 80 m3 [13]. The results of the leveling measurements after both the 8 and 22 March earthquakes indicated that a clear subsidence zone was formed in the extreme seismic zone with the epicenter as the center [31], and it had the same basic range as the sandblast zone of the earthquake. The greater the level drop was, the stronger the sandblasting in the area. Ground liquefaction leads to the drainage of formation water and sediments and the sinking of overlying materials, and vibratory densification and sandblasting represent causes of ground subsidence [35,42,48].
A combination of our data with the records of the post-earthquake site visit revealed that the Xingtai earthquake also caused widespread lateral spreading (Figure 8b), primarily in the areas of riverbanks, old river channels, and lake depressions on plains [48,50]. Most of the lateral spreading distributed near the river channel occurred parallel to the channel, such as along the banks of the Fuyanghe and Xiaozhanghe Rivers, with spreading occurring most frequently along the convex banks of the rivers. The distribution of lateral spreading was generally comparable to the extent of sandblasting on the ground, and sand was also ejected from the ground in areas of lateral spreading.

4.3. Conditions for the Occurrence of Soil Liquefaction

As liquefaction is influenced by several factors, the geometry, size, and type of liquefaction features vary according to location [51]. The distributional characteristics of liquefaction in Xingtai revealed a connection between liquefaction and sand conditions, hydrological conditions, and seismic activity.
Liquefaction is strongly correlated with loosely deposited and poorly graded silt and fine sand [3,51,52,53]. Liu and Li (1993) generated threshold values for certain indicators of modern liquefiable soils and showed that the average grain size of liquefiable soils ranged from 0.02 to 1 mm, the coefficient of inhomogeneity of the soils was not greater than 10, and the relative density of the soils was not greater than 75% [54]. However, silt and fine sand are not necessary conditions, and researchers have also observed gravel soil liquefaction. In the Wenchuan earthquake that occurred in 2008 in China, gravel soil liquefaction was dominant [8]. According to the mechanism of soil liquefaction, the pore fluid pressure must exceed the overlying clay layer hydraulic rupture pressure, and then water carrying sand and soil will spray out of cracks in the surface, thereby liquefying the shallow-buried sand layer [55]. Liquefaction has not been detected in strata of older geological ages (Q3 and earlier strata); thus, liquefied strata are all sedimentary strata of a relatively new geological age [56].
The Xingtai earthquake occurred in the Quaternary basin within the Shulu Depression, which has received fluvial and lacustrine sediments since the Quaternary. The top of the basin is covered with loose sedimentary layers of the Quaternary system, among which the Holocene layers are sandy, sub-sandy, and sub-clay interbedded with sand. The Holocene stratigraphy is dominated by alluvial deposits, with lakes and marshes in between, and the structure is soft. Therefore, the sediments in the Xingtai Plain area are prone to liquefaction [28,57,58]. According to observations from drilling holes and spraying surface sand, the spray was mainly composed of white fine sand, which was buried approximately 3 m below the surface, and black and gray fine sand and powder sand with mica, which was buried at a depth of approximately 8 m. The sprayed sand primarily corresponded to the sedimentary layer of the ancient river channel and ancient lake [48,59].
The sensitivity of sediments to liquefaction is closely related to hydrological factors. The dense distribution of rivers in the Xingtai earthquake area provided conditions for liquefaction. Many rivers flow through the earthquake area, with the Fuyanghe River flowing from southwest to northeast through the central part of the earthquake area. Considerable historical changes occurred in the rivers within the Xingtai earthquake area. Due to the long-term influence of frequent changes and alluvial deposits in the channels of the Yellow River, Zhanghe River, and Hutuohe River, ancient river channels are distributed in a belt shape, with many closed depressions occurring in the intervals. In addition to ancient rivers, the research area also contains the remains of ancient lakes [58]. These ancient rivers and lakes are often composed of soft silt, fine sand, and silt with a burial depth of more than 10 m. These soft strata increase seismic vibrations and their duration and are more prone to liquefaction than other normal sedimentary soil layers [28,48]. Some of the liquefaction distributions that we interpreted overlapped extremely well with the ancient river channel track traces (Figure 10a,b).
A shallow water table is a major factor in determining the potential for liquefaction [60]. The epicenter area has flat terrain and many rivers and channels, the shallow-buried groundwater is stored in the pore space of the Quaternary sand layer, and the groundwater level is generally within 3 m [25]. Moreover, before the earthquakes of 8 and 22 March, a sudden rise in the local groundwater level was observed in dozens of counties and cities in the region, thus forming a large north-northeast-oriented high groundwater zone roughly centered on the epicenters of the two earthquakes. Rising groundwater levels provide more potential for liquefaction, and the villages where liquefaction occurred during both earthquakes were generally located in areas of rising groundwater, especially in areas with increases of more than 2 m (Figure 11a,b).
Earthquake-induced liquefaction is related to the intensity and duration of the earthquake [55]. Worldwide data on historical earthquakes show that liquefaction features can occur at magnitudes as low as approximately 4.5–5 [61]. The PGA is an important indicator for describing the strength of earthquakes, and the larger the PGA is, the more likely the saturated-sand layer will liquefy. The PGA starting range for liquefaction events globally is 0.16–0.32 g [62]. Most of the liquefaction points we interpreted were in a region with a PGA of >0.46 g (converted from the Chinese seismic intensity scale GB/T 17742-2020) [63]. The duration of ground shaking determines the stresses suffered by the soil, with longer durations liquefying the relatively denser sand layers [64]. Additionally, the distribution of liquefaction is related to seismic faults. According to the results of the source mechanism, the seismic fault of the Xingtai earthquake was a right-trending strike-slip fault with a strike of 20°N–30°E [33]. Surface liquefaction in the Xingtai seismic area was also distributed in a north–northeast direction, and it was generated by a deep source mechanism.

5. Discussions

5.1. Damage Induced by Coseismic Liquefaction

The liquefaction phenomenon can cause foundation failure, horizontal displacement, and uneven settlement of the ground surface, thereby affecting the stability of the ground surface, which can lead to subsidence and even the destruction of buildings and infrastructure [65], including houses, bridges, and roads. Housing collapse was the most important cause of casualties in the studied earthquakes. Sprayed sand can also flood large amounts of agricultural land and change the structure of the soil, thus affecting the growth of crops [13]. Wells, which serve as conduits for sand blasting, can be easily blocked or filled via sandblasting during earthquakes, resulting in a lack of clean drinking water for the public and irrigation water for farmlands. Earthquake liquefaction caused varying degrees of damage to industrial and civil housing, farmland, and water facilities in the Xingtai area. Michetti et al. (2007) proposed a macroseismic scale based exclusively on environmental effects; however, Xingtai is located in a densely populated area, so the intensity had to be assessed using damage-based traditional scales [66,67]. Previous existing intensity classifications had considered the distribution of coseismic liquefaction, but part of the intensive liquefaction area was in the VIII-degree area, indicating that the characteristics of liquefaction distribution had the potential to improve the intensity distribution map, even in densely populated areas [66,67].
The Xingtai earthquakes were the first earthquakes to cause major casualties after the founding of the People’s Republic of China, and they resulted in a total of 8064 deaths and more than 38,000 injuries, damaged more than 500,0000 houses and 86 bridges, and caused direct economic losses of more than 1 billion CNY (~400 million U.S. dollars, $1 ≈ 2.5 CNY, based on the exchange rate in 1966) (http://www.hbdzj.gov.cn/hbdzj/webpage/view.jsp?id=2020030810290514113993, accessed on 6 August 2023). Here, we analyzed the damage status of each village affected by both mainshocks, including the number of collapsed houses, casualties, and damaged wells, to illustrate the potential and extent of liquefaction-induced damage.
Rural buildings are the main bearers of earthquake damage because of their vulnerability [68]. Limited liquefaction was observed within the villages during our interpretation, although houses at the sites where liquefaction occurred would have suffered various degrees of damage, with poorly seismic-resistant houses collapsing outright and slightly less poorly built houses potentially tilting, sinking, cracking, or showing little impact. In the 1976 Tangshan earthquake, many brick buildings in liquefaction zones were more severely damaged than those in nonliquefaction zones, and many brick flats built on soft soil in Tianjin sank 14–30 cm; however, the amount of subsidence of buildings built on good foundations was very small [35]. Liquefaction easily damaged traditional housing types in the research area. Approximately 260,000 houses collapsed on 8 March, while approximately 310,000 collapsed on 22 March, with the affected area extending to more than 100,000 km2. The houses that almost completely collapsed in the villages of Malan and Rencun in Longyao County and the village of Dongwang in Ningjin County were in the epicenter area [69].
A kernel density map produced from the number of house collapses shows that building damage was very intense (kernel density > 300) above the IX-degree zone from Dongguoying village to Guanting village and from Xizhangcun village to Hanzhuangcun village on 8 March 1966. Jiajiakou village is in Dongwang Township within the VII-degree zone, with a higher kernel density (Figure 12a). The most intensive collapses on 22 March occurred in Jiajiakou village within the X-degree zone and the area of Gengzhuangqiao village in the IX-degree zone (Figure 12b). The earthquake on 22 March had a greater impact on the more distant areas around the town of Lianzi, presumably because of its geological conditions. The town of Lianzi was established on a lakeshore depression with shallow surface strata of silty sub-clay and chalk, and geological structures normally lead to more severe liquefaction and house collapses [48]. The effects of the two earthquakes were combined to produce a kernel density map (Figure 12c), with areas of higher density near the epicenters of the two earthquakes, which decreased with decreasing intensity. The kernel density map fits the liquefaction distribution. The villages surrounding the dense liquefaction points also experienced severe house collapses. In addition, the number of house collapses in villages situated in ancient river channels was several times higher than that in the neighboring villages [15]. The general orientation of the densely distributed areas was consistent with the seismic mechanism.
According to the kernel density map generated by counting the number of casualties in each village, the areas with high casualties were distributed in the area from Beiyanzhuang village to Maoerzhai village, which is located in the IX-degree zone. The number of casualties in these areas accounted for approximately 45% of the total number of casualties. The village of Malan was the worst affected, with 490 deaths and 431 injuries (Figure 13a). The areas with high casualties in Dayingshang village and Huangerying village on 22 March were located near the epicenter (Figure 13b). It is worth noting that Beiyanzhuang village, which is far from the epicenter of the earthquake on 22 March, also suffered heavy casualties, and it is assumed that a greater number of collapsed houses in Beiyanzhuang village led to a corresponding increase in the number of casualties. However, the number of casualties caused by the earthquake on 22 March was much smaller than that on 8 March because the earthquake on 8 March occurred at 5.30 a.m. when most villagers were still asleep and did not have time to react. In addition, because most earthquake casualties were caused by building collapse, the number of casualties due to house collapse on 22 March 1966 was greatly reduced because the survivors of the 8 March earthquake were living in temporary tents or shelters.
The phenomenon of sandblasting is common in earthquake zones, and sand pressure can lead to the burial of large quantities of crops. Salty water that spews from sandblast holes kills crops and changes the nature of the soil, resulting in reduced yields or destroying the harvest. The village of Wangkou, which is in the IX-degree zone, had 89 sandblasted holes over 80,000 m2 of farmland, and they sprayed out a sand layer as thick as 0.8 m, thereby burying two-thirds of the wheat fields [13]. During earthquake-induced sand liquefaction, water from wells and springs carries the sand body upward and spouts from the ready-made channels. Well water rises dramatically or overflows, and it becomes entrained with black sand, thus leading to liquefaction. The destruction of farmland and wells was also observed after other earthquakes in the North China Plain, such as the 1976 Tangshan Earthquake, in which 73% of wells were destroyed and 21% of the total cultivated area was sanded and flooded [70].

5.2. Seismic Hazard Analysis in the Future

The epicenters of both mainshocks were located in a rural area (Figure 2), which is less serious than when the epicenter occurs in an urban area. China has enacted relevant standards for earthquake-resistant construction, such as the Regulations on Seismic Management of Construction Projects and the General Code for Seismic Resistance of Construction and Municipal Engineering. However, before the Wenchuan Mw 7.9 earthquake in 2008, the relevant seismic-resistant regulations for the construction of rural houses were not strictly regulated, and supervision or approval procedures were not in place for the seismic-resistant design of houses [71]. In addition, many rural houses in Xingtai were constructed before 2008.
We compared the extent of village buildings in 2023 and 1966 within the high-intensity zone (Figure 14a,b) and found that county house floor space expanded by a factor of approximately eight and village floor space expanded by a factor of approximately five (Figure 14c). Many village buildings were blindly expanded based on the scope of production and living, especially in areas where liquefaction occurred during the 1966 earthquake. Moreover, in many local villages around epicenters that were built on the remains of ancient river channels, which caused severe liquefaction, the expansions did not avoid areas of ancient river channels (Figure 14a). Although the houses in the former earthquake area collapsed severely because of the lack of seismic defenses, most of the new houses built after the earthquake on sites where liquefaction had previously occurred still had no seismic-resistant structures. Moreover, even among the few buildings with seismic-resistant structures, the foundations may not have been effectively treated because there is no requirement for liquefaction-resistant foundations in rural buildings (Figure 15). Thus, there is a possibility of a situation similar to the 1964 Niigata earthquake in Japan, where an entire building collapsed without damage [72]. Therefore, most newly built houses in the epicenters have safety risks. Seismic damage is frequently repeated, and seismic damage that occurs in a region during a strong earthquake is often repeated during subsequent earthquakes; an example is liquefaction, which occurred continuously and repeatedly in the same place during the 2011 Canterbury earthquake sequence [2]. Luanxian County (now referred to as Luanzhou City) in Hebei Province has experienced repeated sandblasting during multiple earthquakes [73,74]. Governments and relevant departments should learn from the experience of liquefaction damage caused by the Xingtai earthquakes, enact good defensive and mitigation countermeasures, carry out analyses and research on the liquefaction risk of rural sites, and require appropriate seismic reinforcement for already-built houses and seismic defenses for newly built houses in liquefaction-prone areas.
The North China Plain is a region characterized by urban agglomeration, economic development, and a dense population. The total population of this region amounts to more than 300 million, or approximately 22% of the country’s total population. The highly developed megacities in North China have numerous industrial zones, large buildings, high-speed railways, highways, and complex pipelines. In the 20th century, many earthquakes have occurred worldwide, and liquefaction has caused serious damage to buildings used for various functions, public infrastructure, and lifeline facilities [47,75,76]. In today’s developmental situation, if this area is hit by an earthquake that causes liquefaction damage, the loss will be hundreds of times greater than that caused by the 1966 Xingtai earthquake. Thus, the impact of earthquake-induced liquefaction on public safety in this region requires significant attention. To address this issue, the possibility of earthquakes in the North China Plain and the possibility of liquefaction due to existing conditions in North China must be considered.
Yin et al. (2015) proposed that there is a seismic quiescence zone along the northeast-sliding Tangshan–Hejian–Cixian fault zone, the seismic gap of which is located in Tianjin City, which is approximately 100 km away from Beijing; this region has a total population of 35.76 million. If an earthquake occurs in this seismic quiescence zone, the estimated magnitude could reach approximately 7.5 [26]. Seismic liquefaction caused by the Mw 7.9 earthquake in Tangshan in 1976 occurred over an area of approximately 24,000 km2, and its impact should not be underestimated. Recently, the Ms 5.5 earthquake that occurred in Pingyuan County, Shandong Province, on 6 August 2023, led to liquefaction along the river. Thus, widespread liquefaction can occur due to an earthquake of magnitude 7 or higher. In Tianjin City, many ancient river channels have been filled, and factories or housing sites have been built on these channels. Thus, significant damage will occur under liquefication.
Fifty-three years have passed since the Xingtai earthquake, and some of the existing liquefaction conditions have changed owing to human activity. Approximately 70% of the water used in northern China, especially in Beijing-Tianjin-Hebei, comes from groundwater. Ground subsidence in these areas due to the overexploitation of groundwater has resulted in the formation of the world’s largest groundwater subsidence funnel. Over 86% of the total area of the North China Plain is affected by subsidence [77]. Lowering the water table and reducing the subsidence of the ground will reduce the liquefaction potential near the surface. However, such changes will only affect the amount of liquefaction observed at the surface and cannot eliminate the liquefaction of the saturated sandy soil layer in the deep subsurface. During the Wenchuan earthquake, liquefaction occurred at a soil depth of 20 m [36]. In addition, with the opening of the central line of the South-to-North Water Diversion Project as well as pressure tapping, re-irrigation, and other man-made interference, the long-term negative groundwater equilibrium will be modified, and the groundwater level will either rebound or be restored. The ground subsidence already occurring in the study area will result in urban funnels, thereby increasing the potential for liquefaction in the event of an earthquake.

6. Conclusions

In this study, we collected multisource remote sensing data before and after the Ms 6.8 and 7.2 Xingtai earthquakes, including satellite and aerial images, and reviewed the relevant literature and book materials. On this basis, we provide a complete identification and analysis of the scope and distribution characteristics of the coseismic liquefaction of the 1966 Xingtai earthquakes and its influencing factors. The conclusions are as follows.
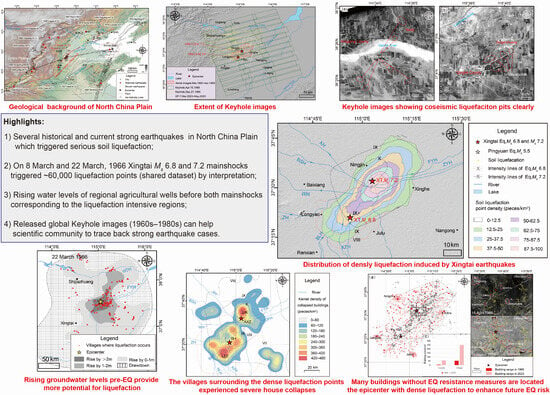
  • We extracted a new relatively complete inventory of 66,442 coseismic soil liquefaction pits induced by both mainshocks; the interpreted coseismic liquefaction was mainly concentrated above the IX-degree zone, accounting for 80% of all liquefaction points; most of the interpreted liquefaction points were located at the region with a PGA of >0.46 g; and the second mainshock triggered more liquefaction pits.
  • The region of liquefaction was mainly limited by sandy soil conditions, water system conditions, and seismic geological conditions and was distributed in areas with loose fine sand and silt deposits, a high water table, especially due to increases in local groundwater levels (rising water levels of regional agricultural wells before both mainshocks corresponding to the liquefaction intensive regions), rivers, and ancient river channels; liquefaction exhibited a repeating characteristic in the same region.
  • The epicenter of the Xingtai earthquake is mostly located in rural areas, and many houses that have not met earthquake resistance measures are located in areas where sand and soil liquefaction has occurred. Once a moderately strong earthquake or a major earthquake occurs in the future, the superimposed losses will still be serious.
  • Using, but not limited to, publicly available high-spatial-resolution Keyhole satellite archived image data (1960s–1980s), we can carry out the work of tracing back earthquake cases of current strong earthquakes around the world, especially typical earthquake cases in large-scale plain areas, such as the 1976 Tangshan earthquake in North China. Detailed knowledge of the distribution of coseismic soil liquefaction induced by strong earthquake can help the central government and local governments to formulate effective disaster reduction measures.

Author Contributions

Conceptualization, Y.X.; methodology, Y.X. and Y.G.; software, Y.G.; validation, L.L. and W.X.; formal analysis, P.L.; investigation, Y.X., H.L. and Y.G.; resources, Y.X.; data curation, Y.G., H.L., W.X. and L.L.; writing—original draft preparation, Y.G.; writing—review and editing, Y.X.; visualization, P.L.; supervision, Y.X.; project administration, Y.X.; funding acquisition, Y.X. All authors have read and agreed to the published version of the manuscript.

Funding

This research was funded by the National Natural Science Foundation of China (Grant Nos. 42041006 and 42072248), National Key Research and Development Program of China (Grant Nos. 2019YFE0108900 and 2021YFC3000600), and Basic Research Program of the Institute of Earthquake Forecasting, China Earthquake Administration (IEF, CEA) (Grant Nos. CEAIEF20220102, and CEAIEF2022050502).

Data Availability Statement

The data presented in this study are available from the corresponding author Y.X. upon reasonable request.

Conflicts of Interest

The authors declare no conflict of interest.

References

  1. Seed, H.B. Soil liquefaction and cyclic mobility evaluation for level ground during earthquakes. J. Geotech. Eng. Div. 1979, 105, 201–255. [Google Scholar] [CrossRef]
  2. Quigley, M.C.; Bastin, S.; Bradley, B.A. Recurrent liquefaction in Christchurch, New Zealand, during the Canterbury Earthquake sequence. Geology 2013, 41, 419–422. [Google Scholar] [CrossRef]
  3. Harp, E.L.; Jibson, R.W.; Kayen, R.E.; Keefer, D.K.; Sherrod, B.L.; Carver, G.A.; Collins, B.D.; Moss, R.E.S.; Sitar, N. Landslides and Liquefaction Triggered by the M 7.9 Denali Fault Earthquake of 3 November 2002. GSA Today 2003, 13, 4–10. [Google Scholar] [CrossRef]
  4. Youd, T.L.; Idriss, I.M. Liquefaction resistance of soils: Summary report from the 1996 NCEER and 1998 NCEER/NSF workshops on evaluation of liquefaction resistance of soils. J. Geotech. Geoenviron. Eng. 2001, 127, 297–313. [Google Scholar] [CrossRef]
  5. Seed, H.B.; Idriss, I.M. Analysis of soil liquefaction: Niigata Earthquake. J. Soil Mech. Found. Div. 1967, 93, 83–108. [Google Scholar] [CrossRef]
  6. Elgamal, A.W.; Zeghal, M.; Parra, E. Liquefaction of reclaimed island in Kobe, Japan. J. Geotech. Eng. 1996, 122, 39–49. [Google Scholar] [CrossRef]
  7. Wang, C.Y.; Dreger, D.S.; Wang, C.H.; Mayeri, D.; Berryman, J.G. Field relations among coseismic ground motion, water level change and liquefaction for the 1999 Chi-Chi (Mw = 7.5) Earthquake, Taiwan. Geophys. Res. Lett. 2003, 30, 1–4. [Google Scholar] [CrossRef]
  8. Chen, L.; Yuan, X.; Cao, Z.; Hou, L.; Sun, R.; Dong, L.; Wang, W.; Meng, F.; Chen, H. Liquefaction macrophenomena in the great Wenchuan Earthquake. Earthq. Eng. Eng. Vib. 2009, 8, 219–229. [Google Scholar] [CrossRef]
  9. Cubrinovski, M.; Bray, J.D.; Taylor, M.; Giorgini, S.; Bradley, B.; Wotherspoon, L.; Zupan, J. Soil liquefaction effects in the central business district during the February 2011 Christchurch Earthquake. Seismol. Res. Lett. 2011, 82, 893–904. [Google Scholar] [CrossRef]
  10. Villamor, P.; Almond, P.; Tuttle, M.P.; Giona-Bucci, M.; Langridge, R.M.; Clark, K.; Ries, W.; Bastin, S.H.; Eger, A.; Vandergoes, M.; et al. Liquefaction features produced by the 2010–2011 Canterbury Earthquake sequence in southwest Christchurch, New Zealand, and Preliminary assessment of paleoliquefaction Features. Bull. Seismol. Soc. Am. 2016, 106, 1747–1771. [Google Scholar] [CrossRef]
  11. Taftsoglou, M.; Valkaniotis, S.; Papathanassiou, G.; Karantanellis, E. Satellite imagery for rapid detection of liquefaction surface manifestations: The case study of Türkiye–Syria 2023 Earthquakes. Remote Sens. 2023, 15, 4190. [Google Scholar] [CrossRef]
  12. Hebei Provincial Local Records Compilation Committee. Hebei Provincial Records—Earthquake Records; Hebei People’s Publishing House: Shijiazhuang, China, 1998. [Google Scholar]
  13. Yang, S.; Chu, D.; Dong, J.; Yang, J.; Li, R. The influence of earthquakes of Xingtai and Tangshan on the soils in Hebei Plain. J. Hebei Agric. Univ. 1990, 13, 83–87, (In Chinese with English Abstract). [Google Scholar]
  14. Gu, G. Catalogue of Earthquakes in China: 1831 B.C.E.–1969 A.D.; Science Publishing House: Beijing, China, 1983; (In Chinese with English Abstract). [Google Scholar]
  15. Huang, F. 1966 Xingtai Earthquake—A milestone in China’s earthquake monitoring and forecasting. Seism. Geomagn. Obs. Res. 2021, 42, 179–182, (In Chinese with English Abstract). [Google Scholar]
  16. Liu, X. Land Deformations in the Xingtai Earthquake. J. Inst. Geomech. Chin. Acad. Geol. Sci. 1981, 1, 48–65, (In Chinese with English Abstract). [Google Scholar]
  17. Chen, Y.; Lin, B.; Lin, Z.; Li, Z. Research on the seismic process of the 1966 Xingtai earthquake based on observations of ground deformation. Acta Geophysica Sinica 1975, 18, 164–182, (In Chinese with English Abstract). [Google Scholar]
  18. Li, P.; Tian, Z.; Bo, J.S.; Li, X.; Zhang, Y.; Gu, J.; Zhou, C. Study on sand liquefaction of the magnitude-5.7 Songyuan earthquake. China Civ. Eng. J. 2019, 52, 91–99. [Google Scholar]
  19. Xu, Y.; Zhang, Y.; Liu, R.; Li, W.; Zhang, W.; Du, P.; Tian, Q. Preliminary analyses of landslides and sand liquefaction triggered by 22 May, 2021, Maduo Mw 7.3 Earthquake on northern Tibetan Plateau, China. Landslides 2022, 19, 155–164. [Google Scholar] [CrossRef]
  20. Wang, W.; Liu-Zeng, J.; Shao, Y.; Wang, Z.; Han, L.; Shen, X.; Qin, K.; Gao, Y.; Yao, W.; Hu, G.; et al. Mapping of soil liquefaction associated with the 2021 Mw 7.4 Maduo (Madoi) Earthquake based on the UAV photogrammetry technology. Remote Sens. 2023, 15, 1032. [Google Scholar] [CrossRef]
  21. Department of Earthquake Preparedness of China Earthquake Administration. Catalogue of Historical Strong Earthquakes in China (23rd Century B.C.—1911 A.D.); Earthquake Press: Beijing, China, 1995; (In Chinese with English Abstract). [Google Scholar]
  22. Wang, J.; Wu, X.; Zhang, X.; Wang, S. Seismic characteristics near the epicenter of the 1303 Hongdong M = 8 Earthquake, Shanxi province and its implication. J. Earthq. 2004, 17, 347–354+456, (In Chinese with English Abstract). [Google Scholar]
  23. Hou, J. The seismic and geologic conditions of the earthquake in Huaxian, Shaanxi. Northwest J. Earthq. 1985, 7, 66–74, (In Chinese with English Abstract). [Google Scholar]
  24. Gao, W.; Zheng, L.; Li, J.; Lin, Z. Seismic tectonics of the 1668 Tancheng magnitude 8.5 earthquake. China Earthq. 1988, 4, 15–21, (In Chinese with English Abstract). [Google Scholar]
  25. Institute of Earthquake Physics under the China Earthquake Administration. 1966 Xingtai Earthquake Fact Sheet; Fujian Science and Technology Press: Fuzhou, China, 1986; (In Chinese with English Abstract). [Google Scholar]
  26. Yin, A.; Yu, X.; Shen, Z.-K.; Liu-Zeng, J. A Possible Seismic Gap and High Earthquake Hazard in the North China Basin. Geology 2015, 43, 19–22. [Google Scholar] [CrossRef]
  27. Jiang, P.; Dai, L.; Xu, F.; Gao, Q. Seismic research on the dynamics of modern tectonic ruptures in the North China fault block area. Earthq. Geol. 1983, 5, 15–28, (In Chinese with English Abstract). [Google Scholar]
  28. Hebei Provincial Seismological Administration. The 1966 Xingtai Earthquake; Earthquake Publishing House: Beijing, China, 1986. (In Chinese) [Google Scholar]
  29. Wang, C.Y.; Zhang, X.K.; Lin, Z.Y.; Wu, Q.J.; Zhang, Y.-S. Crustal structure beneath the Xingtai Earthquake Area in North China and its tectonic implications. Tectonophysics 1997, 274, 307–319. [Google Scholar] [CrossRef]
  30. Shao, Z.; Li, Y.; Wang, P. Pre-, co-seismic and post-seismic fault motion features of the 1966 Xingtai strong earthquake swarm. Earthquake 2015, 35, 1–9, (In Chinese with English Abstract). [Google Scholar]
  31. China Earthquake Administration Seismological Survey Team. Crustal deformation associated with the Xingtai earthquake in March,1966. J. Geophys. 1975, 18, 153–163, (In Chinese with English Abstract). [Google Scholar]
  32. Diao, G.; Li, Q. Scientific research of Xingtai earthquake. N. China Earthq. Sci. 2006, 24, 24–29, (In Chinese with English Abstract). [Google Scholar]
  33. Xu, X.; Yu, G.; Wang, F.; Gu, M.; Sun, Z.; Liu, B.; You, H. Seismogenic model for the 1966 Xingtai Earthquakes—Nucleation of new-born Fault or strick-slip of pre-existing fault? Earthq. Res. China 2000, 16, 73–87, (In Chinese with English Abstract). [Google Scholar]
  34. Xu, J.; Niu, L.; Wang, C.; Han, Z. Tangshan-Hejian-Cixian newly-generated seismtectonic zone. Earthq. Geol. 1996, 18, 193–198, (In Chinese with English Abstract). [Google Scholar]
  35. Fu, S.; Fumio, T. Soil liquefaction during Haicheng and Tangshan Earthquake in China; a review. Soils Found. 1984, 24, 11–29. [Google Scholar] [CrossRef]
  36. Yuan, X.; Cao, Z. Features and new aspects of liquefaction in the Wenchuan earthquake. World Earthq. Eng. 2011, 27, 1–8, (In Chinese with English Abstract). [Google Scholar]
  37. Moss, R.E.; Kayen, R.E.; Tong, L.Y.; Liu, S.Y.; Cai, G.J.; Wu, J. Retesting of liquefaction and Non liquefaction case histories from the 1976 Tangshan Earthquake. J. Geotech. Geo. Environ. Eng. 2011, 137, 334–343. [Google Scholar] [CrossRef]
  38. Li, Z.Y.; Guan, Y. Analysis of Soil Liquefied and Damage Phenomenon at Home and Abroad. AMR 2014, 1028, 305–310. [Google Scholar]
  39. Huang, X.; Zhang, G.; Gao, M.; Hou, G.; Chen, G.; Zhuang, H.; Yu, D. Marine sedimentary environment on the south bank of modern Yellow River estuary. Front. Mar. Geol. 2019, 35, 12–21, (In Chinese with English Abstract). [Google Scholar]
  40. Song, W.; Ma, X.; Jia, G. Cause analysis of creep type ground fissures for Longyao typical faults in Xingtai. Geol. J. 2011, 35, 405–412, (In Chinese with English Abstract). [Google Scholar]
  41. Chen, W.; Ni, M.; Shi, D.; Wang, J. Some problems on the Quaternary geology of the Hebei Plain. Quat. Res. 1985, 6, 1–14, (In Chinese with English Abstract). [Google Scholar]
  42. Townsend, D.; Lee, J.; Strong, D.; Jongens, R.; Smith Lyttle, B.; Ashraf, S.; Rosser, B.; Perrin, N.; Lyttle, K.; Cubrinovski, M.; et al. Mapping Surface Liquefaction Caused by the September 2010 and February 2011 Canterbury Earthquakes: A Digital Dataset. N. Zealand J. Geol. Geophys. 2016, 59, 496–513. [Google Scholar] [CrossRef]
  43. Rathje, E.M.; Franke, K. Remote Sensing for Geotechnical Earthquake Reconnaissance. Soil Dyn. Earthq. Eng. 2016, 91, 304–316. [Google Scholar] [CrossRef]
  44. Ramakrishnan, D.; Mohanty, K.K.; Nayak, S.R.; Chandran, R.V. Mapping the Liquefaction Induced Soil Moisture Changes Using Remote Sensing Technique: An Attempt to Map the Earthquake Induced Liquefaction around Bhuj, Gujarat, India. Geotech. Geol. Eng. 2006, 24, 1581–1602. [Google Scholar] [CrossRef]
  45. Liu-Zeng, J.; Wang, P.; Zhang, Z.; Li, Z.; Cao, Z.; Zhang, J.; Yuan, X.; Wang, W.; Xing, X. Liquefaction in Western Sichuan Basin during the 2008 Mw 7.9 Wenchuan Earthquake, China. Tectonophysics 2017, 694, 214–238. [Google Scholar] [CrossRef]
  46. Institute of Earthquake Prediction of the China Earthquake Administration. The Heart of Forecasting; Earthquake Publishing House: Beijing, China, 2019; (In Chinese with English Abstract). [Google Scholar]
  47. Huang, Y.; Yu, M. Review of Soil Liquefaction Characteristics during Major Earthquakes of the Twenty-First Century. Nat. Hazards 2013, 65, 2375–2384. [Google Scholar] [CrossRef]
  48. Jiang, P.; Wu, Y.; Fan, C. Geological conditions for strong seismic effects in the Xingtai area. N. China Earthq. Sci. 1987, 5, 186–201, (In Chinese with English Abstract). [Google Scholar]
  49. Bloom, C.K.; Howell, A.; Stahl, T.; Massey, C.; Singeisen, C. The Influence of Off-Fault Deformation Zones on the near-Fault Distribution of Coseismic Landslides. Geology 2021, 50, 272–277. [Google Scholar] [CrossRef]
  50. Liu, X. Preliminary analysis of the surface deformation phenomenon of the Xingtai earthquake. Collect. Inst. Geomech. Chin. Acad. Geol. Sci. 1981, 1, 52–69, (In Chinese with English Abstract). [Google Scholar]
  51. Galli, P. New Empirical Relationships between Magnitude and Distance for Liquefaction. Tectonophysics 2000, 324, 169–187. [Google Scholar] [CrossRef]
  52. Owen, G.; Moretti, M. Identifying Triggers for Liquefaction-Induced Soft-Sediment Deformation in Sands. Sediment. Geol. 2011, 235, 141–147. [Google Scholar] [CrossRef]
  53. Andrews, D.C.A.; Martin, G.R. Criteria for liquefaction of silty soils. Earthq. Eng. 2000, 1, 1–8. [Google Scholar]
  54. Liu, Y.; Li, D. Scale and probability of sand liquefaction. Earthq. Res. 1993, 16, 193–198, (In Chinese with English Abstract). [Google Scholar]
  55. Obermeier, S.F. Use of liquefaction-induced features for paleoseismic analysis-An overview of how seismic liquefaction features can be distinguished from other features and how their regional distribution and properties of source sediment can be used to infer the location and strength of Holocene Paleo-Earthquakes. Eng. Geol. 1996, 44, 1–76. [Google Scholar]
  56. Dong, J. Study of liquefaction of sandy soils in the Tangshan earthquake. Eng. Surv. 1984, 5, 7–14, (In Chinese with English Abstract). [Google Scholar]
  57. Chen, W.; Ni, M. Quaternary Geology of Hebei; Geological Publishing House: Beijing, China, 1987; (In Chinese with English Abstract). [Google Scholar]
  58. Xiao, Y. Xingtai Regional Water Conservancy Journal; Hebei Science and Technology Press: Shijiazhuang, China, 1992; (In Chinese with English Abstract). [Google Scholar]
  59. Dong, S.; Wan, D.; Jia, H. An example of anomalous change of groundwater in Xingtai earthquake. N. China Earthq. Sci. 1986, 4, 45–49, (In Chinese with English Abstract). [Google Scholar]
  60. Yao, X.; Zhang, J.; Zhang, Y.; Yang, B.; Yu, K. Study of sand liquefaction hazard features induced by Yingjiang M 5.8 Earthquake on 10 March 2011. J. Eng. Geol. 2011, 19, 152–161, (In Chinese with English Abstract). [Google Scholar]
  61. Green, R.A.; Bommer, J.J. What is the smallest earthquake magnitude that needs to be considered in assessing liquefaction Hazard? Earthq. Spectra 2019, 35, 1441–1464. [Google Scholar] [CrossRef]
  62. de Magistris, F.S.; Lanzano, G.; Forte, G.; Fabbrocino, G. A database for PGA threshold in Liquefaction occurrence. Soil Dyn. Earthq. Eng. 2013, 54, 17–19. [Google Scholar] [CrossRef]
  63. National Earthquake Standardization Technical Committee. China Earthquake Intensity Scale; Standards Press of China: Beijing, China, 2020.
  64. Ishihara, K. Liquefaction of subsurface soils during earthquakes. J. Disaster Res. 2006, 1, 245–261. [Google Scholar] [CrossRef]
  65. Bray, J.D.; Dashti, S. Liquefaction-Induced Building Movements. Bull Earthq. Eng. 2014, 12, 1129–1156. [Google Scholar] [CrossRef]
  66. Michetti, A.M.; Esposito, E.; Guerrieri, L.; Porfido, S.; Serva, L.; Tatevossian, R.; Vittori, E.; Audemard, F.; Azuma, T.; Clague, J.; et al. Environmental seismic intensity scale-ESI 2007. Mem. Descr. Della Carta Geol. D’italia 2007, 74, 7–23. [Google Scholar]
  67. Maria, F.; Ferrario; Franz, L.; Alessandro, M. Fifteen years of Environmental Seismic Intensity (ESI-07) scale: Dataset compilation and insights from empirical regressions. Quatern. Int. 2022, 625, 107–199. [Google Scholar]
  68. Wang, Y.; Shi, P.; Wang, J. Characteristics of earthquake disasters in rural China and countermeasures for disaster reduction. J. Nat. Disasters 2005, 14, 82–89, (In Chinese with English Abstract). [Google Scholar]
  69. Zhang, G.; Li, Z.; Yang, L. Xingtai earthquake and the development of earthquake prediction in China. N. China Earthq. Sci. 2006, 16–23+45, (In Chinese with English Abstract). [Google Scholar]
  70. Liu, H. Damage from the Tangshan Earthquake; Earthquake Publishing House: Beijing, China, 1977; (In Chinese with English Abstract). [Google Scholar]
  71. Chen, Q.F.; Wang, K. The 2008 Wenchuan Earthquake and Earthquake Prediction in China. Bull. Seismol. Soc. Am. 2010, 100, 2840–2857. [Google Scholar] [CrossRef]
  72. Kenji, I.; Yasuyuki, K. Case Studies of Liquefaction in the 1964 Niigata Earthquake. Soils Found. 1981, 21, 35–52. [Google Scholar]
  73. Wang, K.; Song, H.; Liu, H. Characteristics of earthquake damage in China and its significance. Earthq. Geol. 1983, 5, 59–69, (In Chinese with English Abstract). [Google Scholar]
  74. Yu, L.; Lin, Z. The main damage of the Bohai earthquake and its revelations. J. Earthq. 1990, 3, 70–72, (In Chinese with English abstract). [Google Scholar]
  75. Cubrinovski, M.; Henderson, D.; Bradley, B. Liquefaction impacts in residential areas in the 2010–2011 Christchurch Earthquake. In Proceedings of the One Year after 2011 Great East Japan Earthquake: International Symposium on Engineering Lessons Learned from the Giant Earthquake, Tokyo, Japan, 3–4 March 2012. [Google Scholar]
  76. Yasuda, S.; Harada, K.; Ishikawa, K.; Kanemaru, Y. Characteristics of Liquefaction in Tokyo Bay Area by the 2011 Great East Japan Earthquake. Soils Found. 2012, 52, 793–810. [Google Scholar] [CrossRef]
  77. Gong, H.; Pan, Y.; Zheng, L.; Li, X.; Zhu, L.; Zhang, C.; Huang, Z.; Li, Z.; Wang, H.; Zhou, C. Long-term groundwater storage changes and land subsidence development in the North China plain (1971–2015). Hydrogeol. J. 2018, 26, 1417–1427. [Google Scholar] [CrossRef]
Figure 1. (a) Distribution of active tectonics and historical earthquakes in North China; historical seismic data from the Catalogue of Historical Strong Earthquakes in China [21]; fault data from the Seismic Activity Fault Prospecting Data Center (https://www.activefault-datacenter.cn, accessed on 5 August 2013); Hongdong earthquake isoseismic line [22], Huaxian earthquake isoseismic line [23], Tanlu earthquake isoseismic line [24], Heze earthquake, Bohai earthquake, Haicheng earthquake, Tangshan earthquake isoseismic line [14], and Xingtai earthquake isoseismic line [25]. All the isoseismic lines were produced by using the Chinese intensity scale with 12 levels. The red dashed line indicates the Tangshan–Hejian–Cixian fault, and the yellow dashed line indicates the seismic null zone trace [26]. BJ: Beijing, TJ: Tianjin, TS: Tangshan, HC: Haicheng, DL: Dalian, QHD: Qinhuangdao, JN: Jinan, QD: Qingdao, TC: Tancheng, ZZ: Zhengzhou, XA: Xi’an, TY: Taiyuan, SJZ: Shijiazhuang, XT: Xingtai, HD: Handan, HZ: Heze, TX: Tongxian, SH: Sanhe, TG: Tanggu, HG: Hangu, LT: Laoting, YK: Yingkou, CX: Cixian, HD: Hongdong, FY: Fenyang, and YX: Yingxian. (b) Topographic profile of line segment AB. The blue and red lines represent the maximum elevation and minimum elevation curves of the strip topographic profile, respectively.
Remotesensing 15 05777 g001
Figure 2. Flowchart of the step-by-step analysis method for identifying and mapping liquefaction using remotely sensed data.
Remotesensing 15 05777 g002
Figure 3. Extent of distribution of multisource image data in the study area.
Remotesensing 15 05777 g003
Figure 4. (a) Interpreted coseismic liquefaction distribution map of the 1966 Xingtai earthquakes based on the Chinese intensity scale. (b) Density map of the interpreted liquefaction around the epicenter area. XH: Xiaohe River; BSH: Beishahe River; WH: Wuhe River; ZH: Zhihe River; BLH: Beilihe River; NLH: Nanlihe River; XZH: Xiaozhanghe River; FYH: Fuyanghe River; ZYH: Ziyahe River.
Remotesensing 15 05777 g004
Figure 5. Interpreted soil liquefaction of the (a) northernmost site and (b) southernmost site; locations are as shown in Figure 4.
Remotesensing 15 05777 g005
Figure 6. (a) Distribution of villages where liquefaction was detected after the 8 March and 22 March earthquakes; BHZ: Beihouzhuang; DW: Dongwang; XLZ: Xinlizhuang; GZQ: Gengzhuangqiao; XJH: Xujiahe; HZT: Huangzhaotai; NJQ: Niujiaqiao; BYZ: Beiyanzhuang; MEZ: Maoerzhai; LSX: LiShenxian; CL: Changlu; XZ: Xianzhuang; JJZ: Jingjiazhuang; DLZ: Donglizhai; PAC: Ping’ancun; and HC: Hucun. Names of rivers are given in the notes for Figure 4. (b) Map of the route taken by Gao Weiming during the post-earthquake field trips (Institute of Earthquake Prediction of the China Earthquake Administration, 2019). ZT: Zaotuo; SZGD: Shizigeda; JC: Jiucheng; BJZ: Baijiazhuang; ML: Malan; DJZ: Dujiazhuang; SY: Sunyao; SJZ: Shijiazui; PT: Poutou; and AXZ: Aixinzhuang.
Remotesensing 15 05777 g006
Figure 7. Frequency statistics of liquefaction points along inferred deep faults (counted in 10 km intervals) and the vertical strike (counted in 5 km intervals). The locations of profiles CD and EF are shown in Figure 4.
Remotesensing 15 05777 g007
Figure 8. (a) Liquefaction phenomenon around Ren Village, with the specific location shown in Figure 4; (b) lateral spreading phenomenon; (c) liquefaction along the remains of the ancient river channel; (d) sandblasted holes in the village; and (e) liquefaction phenomenon near the riverbank.
Remotesensing 15 05777 g008
Figure 9. Distribution features of liquefaction points shown on the image. (a) Haphazard and scattered point-like distribution; (b) bead-like and line-like distribution; and (c) block or sheet-like distribution. Red arrows show the locations of coseismic soil liquefaction points during mainshocks.
Remotesensing 15 05777 g009
Figure 10. Distribution of the interpreted liquefaction points and ancient river channels. Ancient river channel traces are from [50]. The specific location is shown in Figure 4.
Remotesensing 15 05777 g010
Figure 11. Map of the relationship between the distribution of villages where liquefication occurred and groundwater level rose and fell before the 8 March and 22 March earthquakes. Data on the changes in groundwater level were obtained from the 1966 Xingtai Earthquake Fact Sheet (Institute of Earthquake Physics under the China earthquake administration, 1986). Names of the rivers are given in the notes in Figure 4.
Remotesensing 15 05777 g011
Figure 12. (a) Kernel density map of houses that collapsed in the 8 March earthquake; (b) kernel density map of houses that collapsed in the 22 March earthquake; and (c) total Kernel density map of houses that collapsed in the two earthquakes. Names of rivers are given in the notes in Figure 4. Village abbreviations, JJK: Jiajiakou; DW: Dongwang; AXZ: Aixinzhuang; LZZ: Lianzizhen; DGY: Dongguoying; GT: Guanting; XZC: Xizhangcun; HZC: Hanzhuangcun; and GZQ: Gengzhuangqiao.
Remotesensing 15 05777 g012
Figure 13. (a) Kernel density map of earthquake casualties on 8 March 1966; (b) kernel density map of earthquake casualties on 22 March 1966. Names of rivers are given in the notes in Figure 4. MEZ: Maoerzhai; BYZ: Beiyanzhuang; ML: Malan; RC: Rencun; HEY: Huangerying; DYS: Dayingshang; and SZL: Sizhilan.
Remotesensing 15 05777 g013
Figure 14. (a) Comparison of the building extent in villages within the high-intensity zone of the Xingtai earthquake in 1966 and 2023; (b) comparison of images of the building extent in the vicinity of the epicenter of the earthquake on 22 March 1966; and (c) statistical histogram of the building area in 1966 and 2023.
Remotesensing 15 05777 g014
Figure 15. (a) Images of the range of buildings in Niujiaqiao village in 1966 and 2023 at the locations shown in Figure 14; (b) UAV photo of Niujiaqiao village near the epicenter of the earthquake on 8 March 1966 (taken on 27 February 2023), with most of the extended houses built as bungalows with no seismic-resistant measures and few of the school and residential buildings exhibiting seismic-resistant structures; (c) two-story houses next to streets with no seismic-resistant measures; (d) houses built around the adjacent dried-up river channel with no seismic-resistant structures; and (e) new construction of a small number of houses with structural columns.
Remotesensing 15 05777 g015
Disclaimer/Publisher’s Note: The statements, opinions and data contained in all publications are solely those of the individual author(s) and contributor(s) and not of MDPI and/or the editor(s). MDPI and/or the editor(s) disclaim responsibility for any injury to people or property resulting from any ideas, methods, instructions or products referred to in the content.

