Article

Performance Evaluation and Cycle Time Optimization of Vapor-Compression/Adsorption Cascade Refrigeration Systems

by
Mahmoud Badawy Elsheniti
1,2,*,
Hany Al-Ansary
1,
Jamel Orfi
1 and
Abdelrahman El-Leathy
1
1
Mechanical Engineering Department, College of Engineering, King Saud University, Riyadh 11451, Saudi Arabia
2
Mechanical Engineering Department, Faculty of Engineering, Alexandria University, Alexandria 21544, Egypt
*
Author to whom correspondence should be addressed.
Sustainability 2024, 16(9), 3669; https://0-doi-org.brum.beds.ac.uk/10.3390/su16093669
Submission received: 25 March 2024 / Revised: 16 April 2024 / Accepted: 25 April 2024 / Published: 27 April 2024
(This article belongs to the Special Issue Renewable Energy Driven Sorption Cooling and Desalination)

Abstract

:
The reliance on more sustainable refrigeration systems with less electricity consumption attracts a lot of attention as the demand for refrigeration increases due to population growth and global warming threats. This study examines the use of a cascade vapor-compression/adsorption refrigeration system in hot weather, focusing on condensing temperatures of 50, 55, and 60 °C, whereas an air-cooled condenser is in use due to practical considerations. A fully coupled transient model is developed using COMSOL Multiphysics to simulate the integrated system, considering the practical limitations of the vapor compression system (VCS) and the dynamic nature of the adsorption system (ADS). The model combines a lumped model for the ADS with the manufacturer’s data for a VCS compressor at different condensing and evaporating temperatures. It was found that the VCS is more sensitive to the change in the ADS’s condensing temperature, since when the temperature is raised from 50 °C to 60 °C, the VCS’s COP decreases by 29.5%, while the ADS’s COP decreases by 7.55%. Furthermore, the cycle time of ADS plays an important role in providing the cooling requirements for the bottoming cycle (VCS), and it can be optimized to maximize the energy conversion efficiency of the VCS. At optimum cycle time and compared to the conventional VCS, the cascade system can boost the cooling capacity of the VCS by 18.2%, lower the compressor power by 63.2%, and greatly enhance the COP by 221%. These results indicate that the application of the cascade VCS/ADS in such severe conditions is a more sustainable and energy-efficient solution to meet the growing need for refrigeration.

1. Introduction

Many sectors depend on the refrigeration process as a necessary means for human comfort and industrial production, and it is crucial in hot weather conditions. In Saudi Arabia, summertime temperatures are 2.5 times higher than wintertime averages. In the past 45 years, the hottest temperature observed in KSA has been 53 °C [1], and warming trends for the summer and winter seasons in Riyadh are 0.058 °C and 0.042 °C annually, respectively [2]. Approximately 20% of the electricity used globally is consumed by the refrigeration industry, and it is expected to grow in the next years as a result of global warming and the growing cooling needs across many different industries [3]. According to Lelieveld et al. [4], KSA’s summertime temperatures will rise by 6 °C by 2081–2100 relative to the period of 1986–2005. The conventional vapor compression refrigeration system (VCS) is a commonly utilized technique in the refrigeration industry due to its superior efficiency, in contrast to alternative refrigeration systems that are currently in use [5,6].
However, the VCS uses a lot of electricity, generated mostly from fossil fuels, and represents one of the challenges in controlling the emissions of greenhouse gases [7]. Statistically, about 60% of the energy used in buildings is accounted for by air conditioning [8]. Unfavorably, the high temperature of the heat sink greatly reduces the coefficient of performance (COP) of the VCS. For each degree Celsius that the condenser temperature rises, the COP of a VCS drops by 2–4% [9]. On the other hand, the development of alternative refrigeration technologies, including the adsorption refrigeration system (ADS), is therefore gaining excessive attention [10,11]. The ADS is a thermally driven cooling method that generates cooling by using a refrigerant’s adsorption/desorption process on a solid adsorbent material [12]. Two main benefits of this technique are its low electricity use and the utilization of natural refrigerants. However, the operating circumstances, such as the temperatures of the heating and cooling sources and the temperature of chilling or ice production in their evaporators, have a significant impact on the performance of the ADS [13]. The studies on the ADS for ice production reported COP ranged from 0.452 to 0.086 [14]. A recent strategy to increase the benefits of both systems (the VCS and ADS) and lessen their drawbacks has been offered in the literature by integrating the two systems using different approaches [15,16,17].
The effectiveness of integrating an adsorption system as a topping cycle to cool the condenser of a compression refrigeration system was theoretically examined by Gado et al. [18]. They utilized a generalized thermodynamic model for a VCS combined with a lumped model for the ADS. Given the ambient circumstances in Alexandria, Egypt (latitude 31.2° N and longitude 29.92° E), the PVT collector system was proposed to power the integrated system. In order to produce brine at −20 °C from the VCS evaporator, the AD cycle time of 900 s was chosen, and the cooling water for the ADS condenser and beds was set at 30 °C, assuming a cooling application with chilled water temperature of 12 °C, as in reference [19]. They concluded that the suggested solution might save 24.8% of energy annually. Additionally, they suggested that lowering the cooling temperature and compressor capacity might significantly improve energy savings and the overall coefficient of performance. Using the same approach and two different sources of driving power, Gado et al. [20] assessed the performance of coupling ADS and VCS in a cascade arrangement, with the maximum condensing temperature of the upper cycle being close to 31 °C. They found that the COP of the integrated system increased by 41.6% compared to the conventional VCS.
Koushaeian et al. [21] evaluated an integrated cascade ADS and VCS using a lumped model for the ADS and a sample thermodynamic model for the VCS for cooling purposes at a chilled water temperature of 12 °C. They highlighted that when the temperature of the cooling water was raised from 26 to 34 °C, a 34.33% drop in energy savings and a 20.99% loss in overall COP were reported. Kilic and Anjrini [22] theoretically investigated the combined cascade ADS and VCS when the ambient temperature changed from 25 to 40 °C, using a cycle time of 1100 s. The highest COP of the VCS was 8.8 at an evaporating temperature of 0 °C when the R152A refrigerant was used.
To fully utilize the electrical and thermal energy produced by a CPVT system operating in the hot climate of Riyadh city, Elsheniti et al. [23] investigated the parallel integration of the VCS and ADS. They suggested a coupled ice-production system attained a solar COP of 0.875 on average over the year. According to their findings, adjusting the ADS cycle duration can be a useful strategy for getting the best use out of the heating power produced by the CPVT system. Because the VCS has a greater COP than the ADS, it was able to contribute 84.5% of the total ice production over the year. According to Albaik et al. [24], ADS was also effectively used to cool down the condenser of an organic Rankine cycle (ORC), and the ORC’s thermodynamic efficiency jumped to 11.6% from 6.95%. Calise et al. [25] simulated a polygeneration system including parallel arrangement for the ADS and solar-assisted heat pump for space cooling and heating, respectively, and using component-based thermodynamic models in TRNSYS software. They revealed that the suggested approach may save 20% on electricity by using the meteorological data of a Mediterranean city, at a moderately warm heat sink. Roumpedakis et al. [26] experimentally evaluated the performance of a solar driven adsorption system while a conventional VCS was used in parallel operation to cover the peak load at higher ambient temperatures. They concluded that the combined operation improved overall performance, and the ADS’s maximum COP was 0.575. To improve the ADS performance, Xu et al. [27] proposed and examined a hybrid ADS with desiccant-coated heat exchangers to treat the conditioned air latent load. The hybrid system increased the cooling capacity from 3 kW to 3.95 kW and increased the COP to 0.539. Activated carbon and silica gel are the most recommended adsorbates in the previous research relevant to hybrid ADS and VCS, as summarized by Kılıç [11]. He also reported that the use of such hybrid systems makes it possible to use a wide range of heating sources with low grades and can enhance the performance of the VCS by up to 100%,reducing the electrical power consumption by 50%.
Vasta et al. [28] conducted experimental tests to evaluate the performance of a cascade adsorption unit and vapor compression chiller using condenser cooling temperatures up to 40 °C. They reported that the electrical COP of the integrated system increased in the range from 25% to 50%, obtaining an ultimate COP of 8. They also extended the study theoretically to optimize the cascade system using thermodynamic models for both cycles while setting the ADS cycle time to 1000 s. They revealed that an increase of 110% in the efficiency of the VCS can be attained in refrigeration applications while applying the cascade system. Gibelhaus et al. [29] investigated the application of ADS to improve the performance of a CO2-based VCS as a cascade refrigeration system. They showed that when considering the ambient temperatures of 35 °C and 25 °C, respectively, annual energy savings of 22% and 16% can be achieved. For both cycles, thermodynamic models were utilized, and the ADS cycle periods were adjusted to account for the varying size ratios between the two cycles. Palomba et al. [30] investigated critical control strategies for the hybrid VC/AD chillers. They emphasized that the ADS’s cycle duration can be adjusted to correspond with changes in the hybrid system’s cooling power.
Previous studies focused on condensing temperatures in the range of 25–30 °C, except for a few papers extending the range to 40 °C. This range will not be applicable in severe conditions where ambient temperatures reach 47 °C and are expected to be higher due to global warming, according to the statistics discussed earlier. In this introductory section, it can be highlighted that the modeling of such systems was mainly based on a simple or general thermodynamic model for the VCS. In some studies, the compressor’s isentropic efficiency was fixed. Furthermore, the cycle time of the adsorption system was set to a fixed value during most of the studies. To the best of the author’s knowledge, no single study has discussed the ADS’s cycle time limitation and optimization in order to enhance the electrical energy conversion efficiency of the VCS, as expressed by the COP, particularly at higher ambient temperatures.
To support the effective integration of the cascade chillers in practice, further information, and findings about the variation limits of the ADS cycle time are required, particularly under harsh operating conditions. Previous studies make it clear that integrating the ADS as a topping cycle for the conventional VCS is a very promising strategy for raising the VCS’s energy efficiency and lowering its electricity consumption. Given that VCS is an established technology, this study aims to fill the gap between the theoretical and experimental studies in which the manufacturer datasheet of a VCS has been utilized in modeling the cascaded adsorption-compression refrigeration system. The direct impact of the VCS’s practical limitations and component sizes has been used to determine the operational conditions of the coupled ADS, mainly the range and the optimum cycle time, along with the intermediate condenser/evaporator temperatures. Unlike the previous studies with generalized thermodynamic models for the VCS, the investigation in this study will focus on how the defined compressor of the VCS responds to the dynamic nature of the ADS. Additionally, the use of an air-cooled condenser to deal with the heat sink of the upper cycle comes with many benefits, particularly in terms of small-scale refrigeration systems and limited cooling water sources; however, it limits the condensing temperatures to the ambient conditions. Therefore, this study will investigate the effect of condensing temperatures in the range of 50 °C to 60 °C, which are expected when applying such a system in Riyadh city. The integrated VCS/ADS could help mitigate excessive energy consumption and the associated indirect emissions from the refrigeration system that produce ice for continuous cooling.

2. Methodology

Figure 1 shows the schematic diagram of the proposed cascade refrigeration system, which shows the adsorption system (ADS) as a topping cycle and the vapor compression system (VCS) as a bottoming cycle. The use of water-cooled condensing units can be limited in some applications, particularly in arid climates, where the availability of water represents a great challenge. Therefore, in this study, the ADS condenser is an air-cooled unit that can be used with medium- and small-scale refrigeration equipment to lessen reliance on the cooling water circuit and associated complications. The proposed system is used to produce ice using a conventional ice maker. The ice can be used directly for freezing purposes, or it can be used to overcome the solar heating system’s intermittent operation, which can be used to power the ADS, and provide constant chilling over the day and night.
As extensively studied in the literature, the heating source can be solar or waste heat that can produce a regeneration temperature of 90 °C [18,23,25]. The design of the adsorbent beds is based on Maxsorb III adsorbent filled in a promising structured aluminum-foam bed and uses ethanol as a refrigerant. This design provided remarkable performance compared to a typical finned-tube configuration, as reported in reference [12].
The VCS uses an off-the-shelf compressor, type Copeland ZP42K5E-PFV [31], with known performance under a range of condensing and evaporating temperatures, from 26.6 °C to 65.6 °C and from −23.3 °C to 12.78 °C, respectively. The nominal cooling capacity and compressor power are 12.29 kW and 4.07 kW at condensing and evaporating temperatures of 54.44 °C and 7.22 °C, respectively. To produce ice in the freezer unit, the VCS’s evaporating temperature is set to −5 °C, and VCS’s condensing temperature is set to 5 °C above the ADS’s evaporating temperature. By using this approach, the developed model in this study can calculate the temperatures of the circulated refrigerants in the condenser/evaporator unit, which is an intermediate heat exchanger (HEX), based on the energy balances between the two cycles and under any specific circumstance. In this study, a datasheet-based thermodynamic model for the VCS is simultaneously solved with a transient lumped-parameter model for the two-bed ADS. As a result, both the condensing and evaporating temperatures of the bottoming cycle and the topping cycle, respectively, as well as the instantaneous amount of heat transfer from the bottoming cycle to the topping cycle, fluctuate over time.
Through control valves, the intermediate heat exchanger is connected to the beds and functions as the ADS’s evaporator of a conventional two-bed system. The valves allow for the switching between the four ADS modes because they only open while a bed is undergoing the adsorption process. Conversely, only during the desorption process will the valves connecting the two beds to the condenser of the ADS be turned on.

3. Mathematical Modeling

3.1. Adsorbent Beds

The transient natural operation of the ADS involves repeated cycles, each of which being represented by four sequential processes, namely, preheating/precooling, desorption/adsorption, precooling/preheating, and adsorption/desorption, applied to beds A and B, respectively. This operation can be replicated using the energy balance Equations (1) and (2), as follows [32]:
M C b 1 d T b 1 d t = 1 α b [ m ˙ c C c ε c T c , i T b 1 ] α b [ m ˙ h C h ε h T h , i T b 1 ] + H s M s d w b 1 d t
M C b 2 d T b 2 d t = α b [ m ˙ c C c ε c T c , i T b 2 ] ( 1 α b ) [ m ˙ h C h ε h T h , i T b 2 ] + H s M s d w b 2 d t
The thermal masses,  M C b 1  and  M C b 2 , represent all the components of beds A and B, respectively, and can be written as follows:
M C b 1 = M s C s + M s C r l w b 1 + M b C b + M f C f
M C b 2 = M s C s + M s C r l w b 2 + M b C b + M f C f
The thermal masses of the solid sorbent, adsorbate, bed metal heat exchanger, and foam are represented by the RHS term in Equations (3) and (4), respectively. Except for the mass of adsorbate, which varies with time, the masses of the two beds are the same. The water mass flow rates for cooling and regeneration are denoted by  m ˙ c  and  m ˙ h , respectively, and  H s  is the isosteric heat of adsorption. The heat transfer effectiveness of the foam bed during cooling and heating is represented by  ε c  and  ε h . These parameters rely on the heat transfer resistances within the bed heat exchanger, which are influenced by factors such as the fluid flow scheme, foam thickness, and thermophysical characteristics of both the foam structure and adsorbent material.
The present zero-dimensional lumped model necessitates simplification. Therefore, the values of  ε c  and  ε h  were calculated from the more intricate CFD model developed in reference [12] to be 0.802 and 0.853, respectively. The obtained results were validated for the specific situation under investigation. The operator  α b  is used in the program coding to alternate between the cooling and heating modes in the equations, delivering either the cooling or heating effect for each bed, and switching between them every half cycle.
In an adsorption system, the isotherms and kinetics equations are typically integrated with the bed energy equation to determine the amount of adsorbate in both equilibrium ( w e q ) and instantaneous ( w ) states. For the Maxsorb III/ethanol system, the following equations were utilized [33,34]:
w e q = w m a x exp R T b E ln P s p n
P s = 0.1333 × 10 8.1122 1592.864 T b + 226.184
w t = K L D F w e q w
K L D F = A exp E a R u T b
where the maximum uptake, ethanol-gas constant, characteristic energy, and heterogeneity parameter are defined, respectively, by  w m a x = 1.2   k g · k g 1 R = 0.1805   k J · k g 1 · K 1 E = 139.5   k J · k g 1 ,  and n = 1.8 [26].  P s  is the saturation pressure at the bed temperature, and  p  is the pressure of the associated evaporator/condenser module. The adsorption kinetics were defined by the linear-driving-force model, Equation (7), where  K L D F  denotes for the overall intra-particle mass-transfer coefficient. The pre-exponential constant, activation energy, and universal gas constant are given as  A = 132.89   s 1 E a = 22.97   k J · m o l 1 , and R u = 8.314   k J · k m o l 1 · K 1 , respectively [33].

3.2. Intermediate Condenser/Evaporator Heat Exchanger

The energy balance equation of the intermediate heat exchanger between the two cycles should consider the instantaneous heat released from the VCS,  Q ˙ c o n d , v ( T c o n d , v , t ) , which in turn is relevant to the condensing temperature,  T c o n d , v , of the VCS. It should also consider the intermittent connections between the two beds during the adsorption process. Therefore, it can be written as follows:
M C H E X d T e v a , a d t = Q ˙ c o n d , v ( T c o n d , v , t ) 1 β e v a , a   h f g ( T e v a , a ,   t ) C r l , a T c o n d , a T e v a , a M s d w b 1 d t 1 γ e v a , a h f g ( T e v a , a ,   t ) C r l , a T c o n d , a T e v a , a M s d w b 2 d t
M C H E X  denotes the thermal mass of the heat exchanger, and  T e v a , a  and  T c o n d , a  are the evaporating and condensing temperatures of the ADS, respectively. The  T c o n d , a  is also abbreviated as  T c . The  h f g  is the latent heat of evaporation as a function of  T e v a , a . The amount of ethanol vapor generated during the throttling process in the ADS is eliminated from the latent heat in the evaporator by the term ( C r l , a T c o n d , a T e v a , a ).  β e v a , a  and  γ e v a , a  are programing operators used to mimic the alternating connections between the two beds. The simulation parameters for the adsorption system are displayed in Table 1.

3.3. Vapor Compression System

The datasheet of the compressor unit provided by the manufacturer can be used to determine the refrigerant mass flow rate, compressor isentropic efficiency, and the second-law efficiency of the cycle at different condensing and evaporating temperatures [31]. Figure 2 shows the changes in the previous parameters when the evaporating temperature is set to −5 °C, as calculated from the manufacturer’s confirmed results based on a 72 h run-in period, with maximum ± 5% deviations [31]. It is evident that at higher condensing temperatures, the VCS’s performance is significantly reduced in terms of compressor isentropic efficiency ( η i s ) and second-law efficiency ( η I I ). This emphasizes how crucial it is to research the suggested method in severe conditions in order to lower the VCS condensing temperature. In addition, setting some of the main compressor parameters to fixed values can lead to misleading results, which was avoided in the present study. The figure also shows that, as the condensing temperature rises, the mass flow rate of the refrigerant ( m ˙ r e f , v ) experiences a modest increase, resulting from the increased volumetric capacity of the compressor at a high discharge pressure. These results consider the physical parameters of the compressor, as well as the changes in the thermophysical properties of the refrigerant at different condensing temperatures.
The thermodynamic properties of the refrigerant [35], which is HFC-410A, are integrated with the datasheet interpolation functions, developed in COMSOL Multiphysics to model the performance of the VCS under different operating conditions. Figure 3 shows the refrigerant status on the p-h graph for a complete refrigeration cycle. In practice, certain amounts of superheat and subcooling should be considered before the compressor and after the condenser, respectively, to save operation and increase the cooling effect. The amounts of superheat and subcooling used in the simulation are based on the recommendations in the compressor datasheet. The main specifications and parameters of the VCS used in the simulation are shown in Table 2.
The VCS performance is simulated using the following set of equations, which consider that all parameters are time-dependent and must be simultaneously solved in a fully coupled scheme with the system of equations of ADS.
T c o n d , v = T e v a , a + 5
h 2 = h 1 + h 2 , i s h 1 η i s
Q ˙ c o n d , v = m ˙ r e f , v h 2 h 3 , s a t
Q ˙ e v a , v = m ˙ r e f , v h 1 , s a t h 4
C O P v = T e v a , v T c o n d , v T e v a , v × η I I
W ˙ v = Q ˙ e v a , v C O P v
At any given time, both  Q ˙ c o n d , v  and  T c o n d , v  relate the VCS to the ADS to find out the instant compressor power ( W ˙ v ), which, in turn, enables the set of equations of both cycles to be solved.

3.4. Performance Indicators

Once cyclic steady state is reached, the cascade VCS/ADS’s performance is assessed using the data of the last cycle as follows:
C C a d s = 0 t c y c l e Q ˙ c o n d , v d t t c y c l e
Q ˙ h e a t , a d s = 0 t c y c l e m ˙ h C h T h , i n T h , o u t d t t c y c l e
C O P t h e r m a l , a d s = C C a d s Q ˙ h e a t , a d s
P o w e r e l e c t , v c s = 0 t c y c l e W ˙ v d t t c y c l e
C C v c s = 0 t c y c l e Q ˙ e v a , v d t t c y c l e
C O P e l e c t , v c s = C C e v a , v c s P o w e r e l e c t , v c s
D I P V C S = C C e v a , v c s 3600 W o r k i n g   h o u r s C p , w T w , i n T f r e e z i n g + h f g , i c e + C p , i c e T f r e e z i n g T i c e , o u t
where  C C  and  D I P  denote the cooling capacity and the daily ice production. The working hours of the system are 24 h, as the adsorption system can be driven by either industrial waste heat or solar collectors assisted with heat storage.  C O P e l e c t , v c s  is the coefficient of the performance of the VCS, which represents the electrical energy conversion efficiency of the system.

3.5. Mathematical Model Validation

The adsorbent bed design and working pair used in this study are identical to those identified in the reference [12]. As seen in Figure 4a, the published data corresponding to a foam thickness of 2 mm are therefore used for validation. The COPs determined from the lumped model in this study for the ADS at different cycle times exhibit adequate agreement with the published ones, with a maximum deviation of 6.2%. On the other hand, as can be shown in Figure 4b, the COPs of the VCS model at various condensing temperatures demonstrate an accurate match with those specified in the manufacturer’s datasheet [31]. As mentioned earlier, the test case reported in the datasheet had a deviation of ±5% based on a 72 h run-in period.

4. Results and Discussions

First, the study will clarify how the major characteristics of the bottoming cycle (VCS) vary over time and how the dynamic nature of the topping cycle (ADS) affects these variations. Next, a detailed investigation will be conducted at various condensing temperatures for the topping cycle based on the use of the ADS’s cycle time as the primary controlling parameter to fit the cooling requirements of the VCS.

4.1. Cyclic Performance of the Integrated System

In this section, the results are obtained by setting the condensing temperature of the topping cycle to 50 °C and the ADS cycle time to 760 s. The simulation lasts 10 complete cycles (7600 s) to reach a cyclic steady state, which is required in the evaluation and comparison of the different cycles in the next section, as shown in Figure 5, Figure 6 and Figure 7.
Figure 5 shows the high fluctuations in the variation of the ADS’ refrigerant mass flow rate in the intermediate heat exchanger (HEX). This is due to the higher adsorption kinetics at the start of the adsorption processes, which are slowed down dramatically over the half-cycle times. Since there is no adsorption process occurring in either bed during the switching periods, there is no mass flow rate of refrigerant for the ADS during these brief intervals. However, the fluctuations in the VCS’s refrigerant flow rate are very limited compared to those in its counterpart, the ADS. This is controlled by the scroll-type compressor’s characteristics, which cause these variations in the VCS’s refrigerant flow rate, related to the compressor’s volumetric capacity and temperature lift, as shown in Figure 2. The thermal mass of the HEX absorbs or releases its energy to maintain a balance between the two cycles and mitigate the effect of the high fluctuations associated with the ADS side.
Figure 6 shows how the approach followed in this study maintained a temperature difference of 5 °C between the two refrigerants in the HEX over the study periods, reaching a cyclic steady state. Additionally, the variations in the two beds’ temperatures are cyclic after the 10 complete ADS cycles. The cooling water temperature for the beds in this test case is set to 25 °C, and the regeneration temperature is set to 90 °C. After reaching a cyclic steady state, the cascade system successfully managed to reach an average condensing temperature of the VCS of 26.42 °C, using an average evaporating temperature of 21.42 °C for the ADS.
The energy balance among the VCS components is confirmed during the simulation periods, as exemplified in Figure 7. The figure shows how the operational conditions of the topping cycle, which featured transient conditions, affect the time variations of the capacities of the compressor and evaporator of the VCS. These variations in the two components accumulate to form the heat rejected by the condenser of the VCS, which is handled by the HEX.
It is important to highlight that most of the heat generated due to the inefficiencies in the compression process is absorbed by the refrigerant and then rejected by the condenser; however, some heat is directly released to the surrounding area from the compressor unit and connections.
Based on the data presented in Figure 7, the average compressor power during the final cycle, which lasted from 6840 to 7600 s, is approximately 1870 W. However, the difference between the average thermal power transferred in the condenser and the evaporator is 1783 W in this cycle. This difference, which is about 87 W, is due to the use of practical data from the manufacturer to calculate the compressor power, which should be slightly higher than that calculated from the direct energy balance due to the thermal losses from the compressor unit and its connections. In this cyclic steady-state cycle, the condenser heat rejected is 11,383 W, while the evaporator cooling power is about 9600 W.

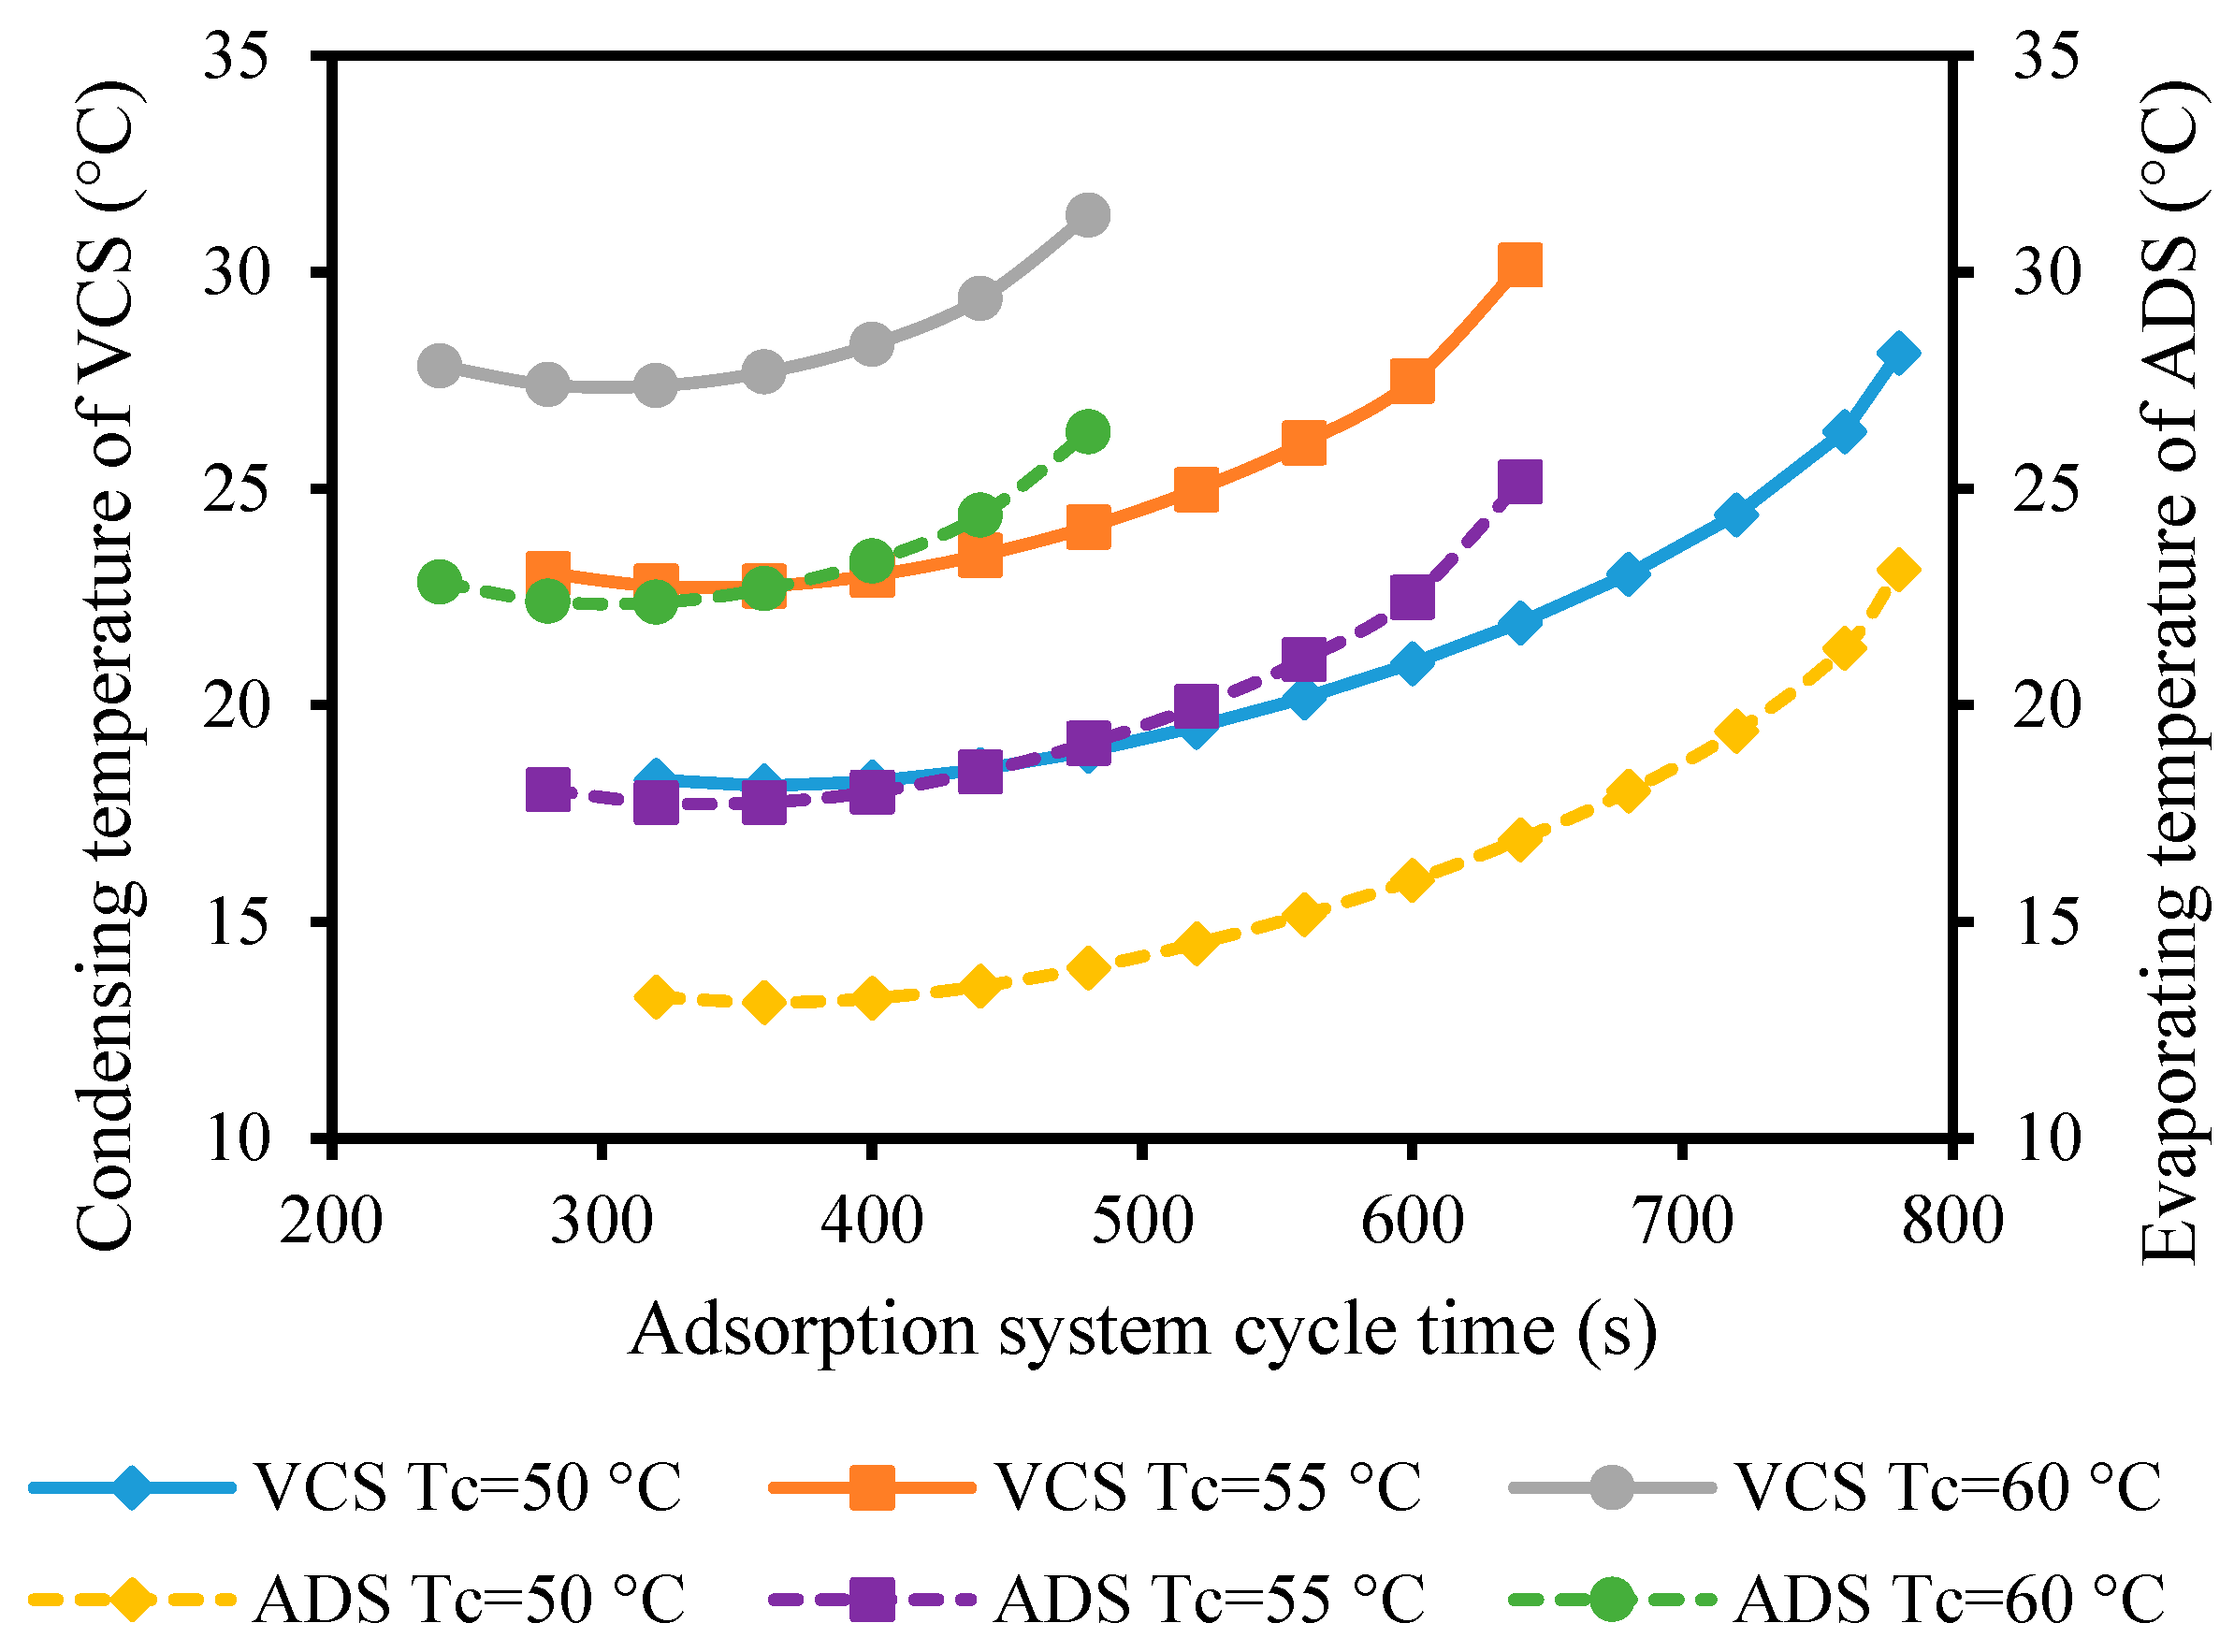
4.2. The Effect of Adsorption Cycle Time

When the condenser is an air-cooled type, the heat sink temperature in severe weather, such as that of Riyadh City, causes a high condensing temperature ( T c ) in the topping cycle. This section examines the influence of ADS cycle time, which affects the ADS’s cooling capacity, at various  T c  values of 50, 55, and 60 °C. Contrary to what was frequently done in earlier studies, the real VCS system data used in the current simulations come with limitations on modifying the ADS’s cycle time to comply with VCS requirements. Therefore, the maximum cycle time shown in each line graph in the following figures is the maximum possible cycle time for the ADS in the case under study that can be used for balanced operation in the integrated system. Increasing the cycle time over that period decreases the cooling capacity of the ADS to a point where it is not able to absorb the heat released from the VCS, leading to a cumulative heat and increasing the condensing temperature of the VCS. In practice, the VCS will go into forced shutdown in such cases to save the compressor unit. On the other hand, since further cycle time reduction is not beneficial, the minimum cycle time for each line graph is set when a deterioration in the performance of both cycles is observed. These limitations on the maximum and minimum cycle times can be deduced from the results in Figure 8, Figure 9, Figure 10 and Figure 11.
Figure 8 shows how the temperatures of both refrigerants in the HEX change with respect to the ADS cycle time and its limitations at different  T c . The best cycle times are 360, 320, and 320 s, which led to the minimum condensing temperatures of the VCS ( T c o n d , v ) of 18.14, 22.75, and 27.37 °C at    T c  values of 50, 55, and 60 °C, respectively. These result from the minimum evaporating temperature of the ADS ( T e v a , a ) attained at these times. Reducing the cycle duration below the optimal times results in an increase in  T e v a , a , and subsequently increases  T c o n d , v . In the adsorption system, a very short cycle time can lead to a decrease in the net amount of adsorbate (circulated refrigerant) during the cycle, due to insufficient time for the desorption process. This demolishes the benefit gained from the higher adsorption kinetics at shorter cycle times.
It can also be noted that the integrated VCS/ADS can be operated using a wide range of cycle times, from 320 s to 780 s at a lower  T c  of 50 °C; however, this range is reduced from 240 s to a maximum of 480 s at a higher  T c  of 60 °C. This is attributed to the dynamic balance point for the integrated system, which can be achieved in different circumstances. For instance, the elevated temperatures in the HEX ( T e v a , a , and  T c o n d , v ) can enhance the adsorption process on the side of the ADS and adversely increase the compressor power consumption on the other side. Figure 9 illustrates the inconsistency between the ADS’s and VCS’s cooling capacities in response to the variations in the  T c  over various cycle times. While the ADS’s cooling capacity gets higher values at  T c  of 60 °C at different cycle times, the VCS’s cooling capacity has lower values compared to the values at  T c  of 50 and 55 °C.
In conventional ADS, the cooling capacity declines at higher cycle times; however, in the integrated system, the  T e v a , a  also increases at higher cycle times, which unusually enhanced the ADS’s cooling capacity, as shown in Figure 9. Conversely, as the cycle time increases, the VCS’s cooling capacity declines. This is because the evaporator experiences less effective cooling, resulting from the rise in the condensing temperatures of the VCS. The optimal cycle times identified in Figure 8 correspond to the highest cooling capacity of the VCS at each  T c .
Figure 10 shows how the change in the ADS’s cycle time at different  T c  affects the compressor power and the DIP of the VCS. The minimum compressor power and the maximum DIP indicate that the VCS performs best at the ideal cycle durations of 360, 320, and 320 s, with  T c  of 50, 55, and 60 °C. This is attributed to the minimum compressor temperature lifts at these times, resulting in minimum  T c o n d , v , as indicated in Figure 8. The compressor power can be significantly increased by prolonging the ADS’s cycle duration beyond what is considered optimal. The compressor power increases by approximately 41.3%, from 1390.6 W to 1964.7 W, when the cycle time is increased from 360 s to 780 s, with  a   T c  of 50 °C. Moreover, raising the  T c  lowers the DIP and raises the compressor power. The minimum compressor power at a  T c  of 60 °C is 1922.17 W, which is 38.3% more than the minimum power at  a   T c  of 50 °C. The DIP drops by only 2.57%, from 1.8308 to 1.7837 ton day−1, when  T c  is raised from 50 to 60 °C.
Figure 11 illustrates how, at various ADS condensing temperatures, the energy conversion efficiency of both DAS and VCS, as represented by the COPs, responds to the cycle time variations. The ideal cycle times found while examining the prior parameters consistently yield the highest COPs for VCSs. At optimal cycle times of 360, 320, and 320 s, and with  T c  of 50, 55, and 60 °C, the maximum VCS’ COPs are 7.06, 5.84, and 4.98, respectively. The VCS’s COPs are significantly decreased when the cycle periods are increased beyond the optimal ones. For instance, at a  T c  of 50 °C, the VCS’s COP decreases by 31.16%, from 7.06 to 4.86, when the cycle time is increased from 360 s to 780 s.
Conversely, when the cycle time increases, the ADS’s COPs rise dramatically, as seen in Figure 11. In conventional ADS, this is certainly because the regeneration heat supplied to the ADS at longer cycle durations is decreased, and in this integrated system, its cooling capacity is also marginally increased. The reduction in the heat supply, combined with a fixed or increased cooling capacity of the ADS, leads to these increases in the ADS’s COPs at higher cycle times.
The ADS’s COP decreases with increasing  T c ; for example, it is reduced by 7.55%, from 0.45 to 0.416 at cycle times of 360 s and 320 s, when the  T c  is increased from 50 °C to 60 °C. This is less significant than what can be observed for the VCS’s COP under the same circumstances compared to the above example, where the VCS’s COP has a reduction of 29.5%, from 7.06 to 4.98. Therefore, the VCS is more sensitive to the change in the ADS’s condensing temperature,  T c . This is due to the dynamics of the balancing conditions of the intermediate heat exchanger, which raises both the evaporating temperature of the ADS and the condensing temperature of the VCS in response to an increase in  T c .

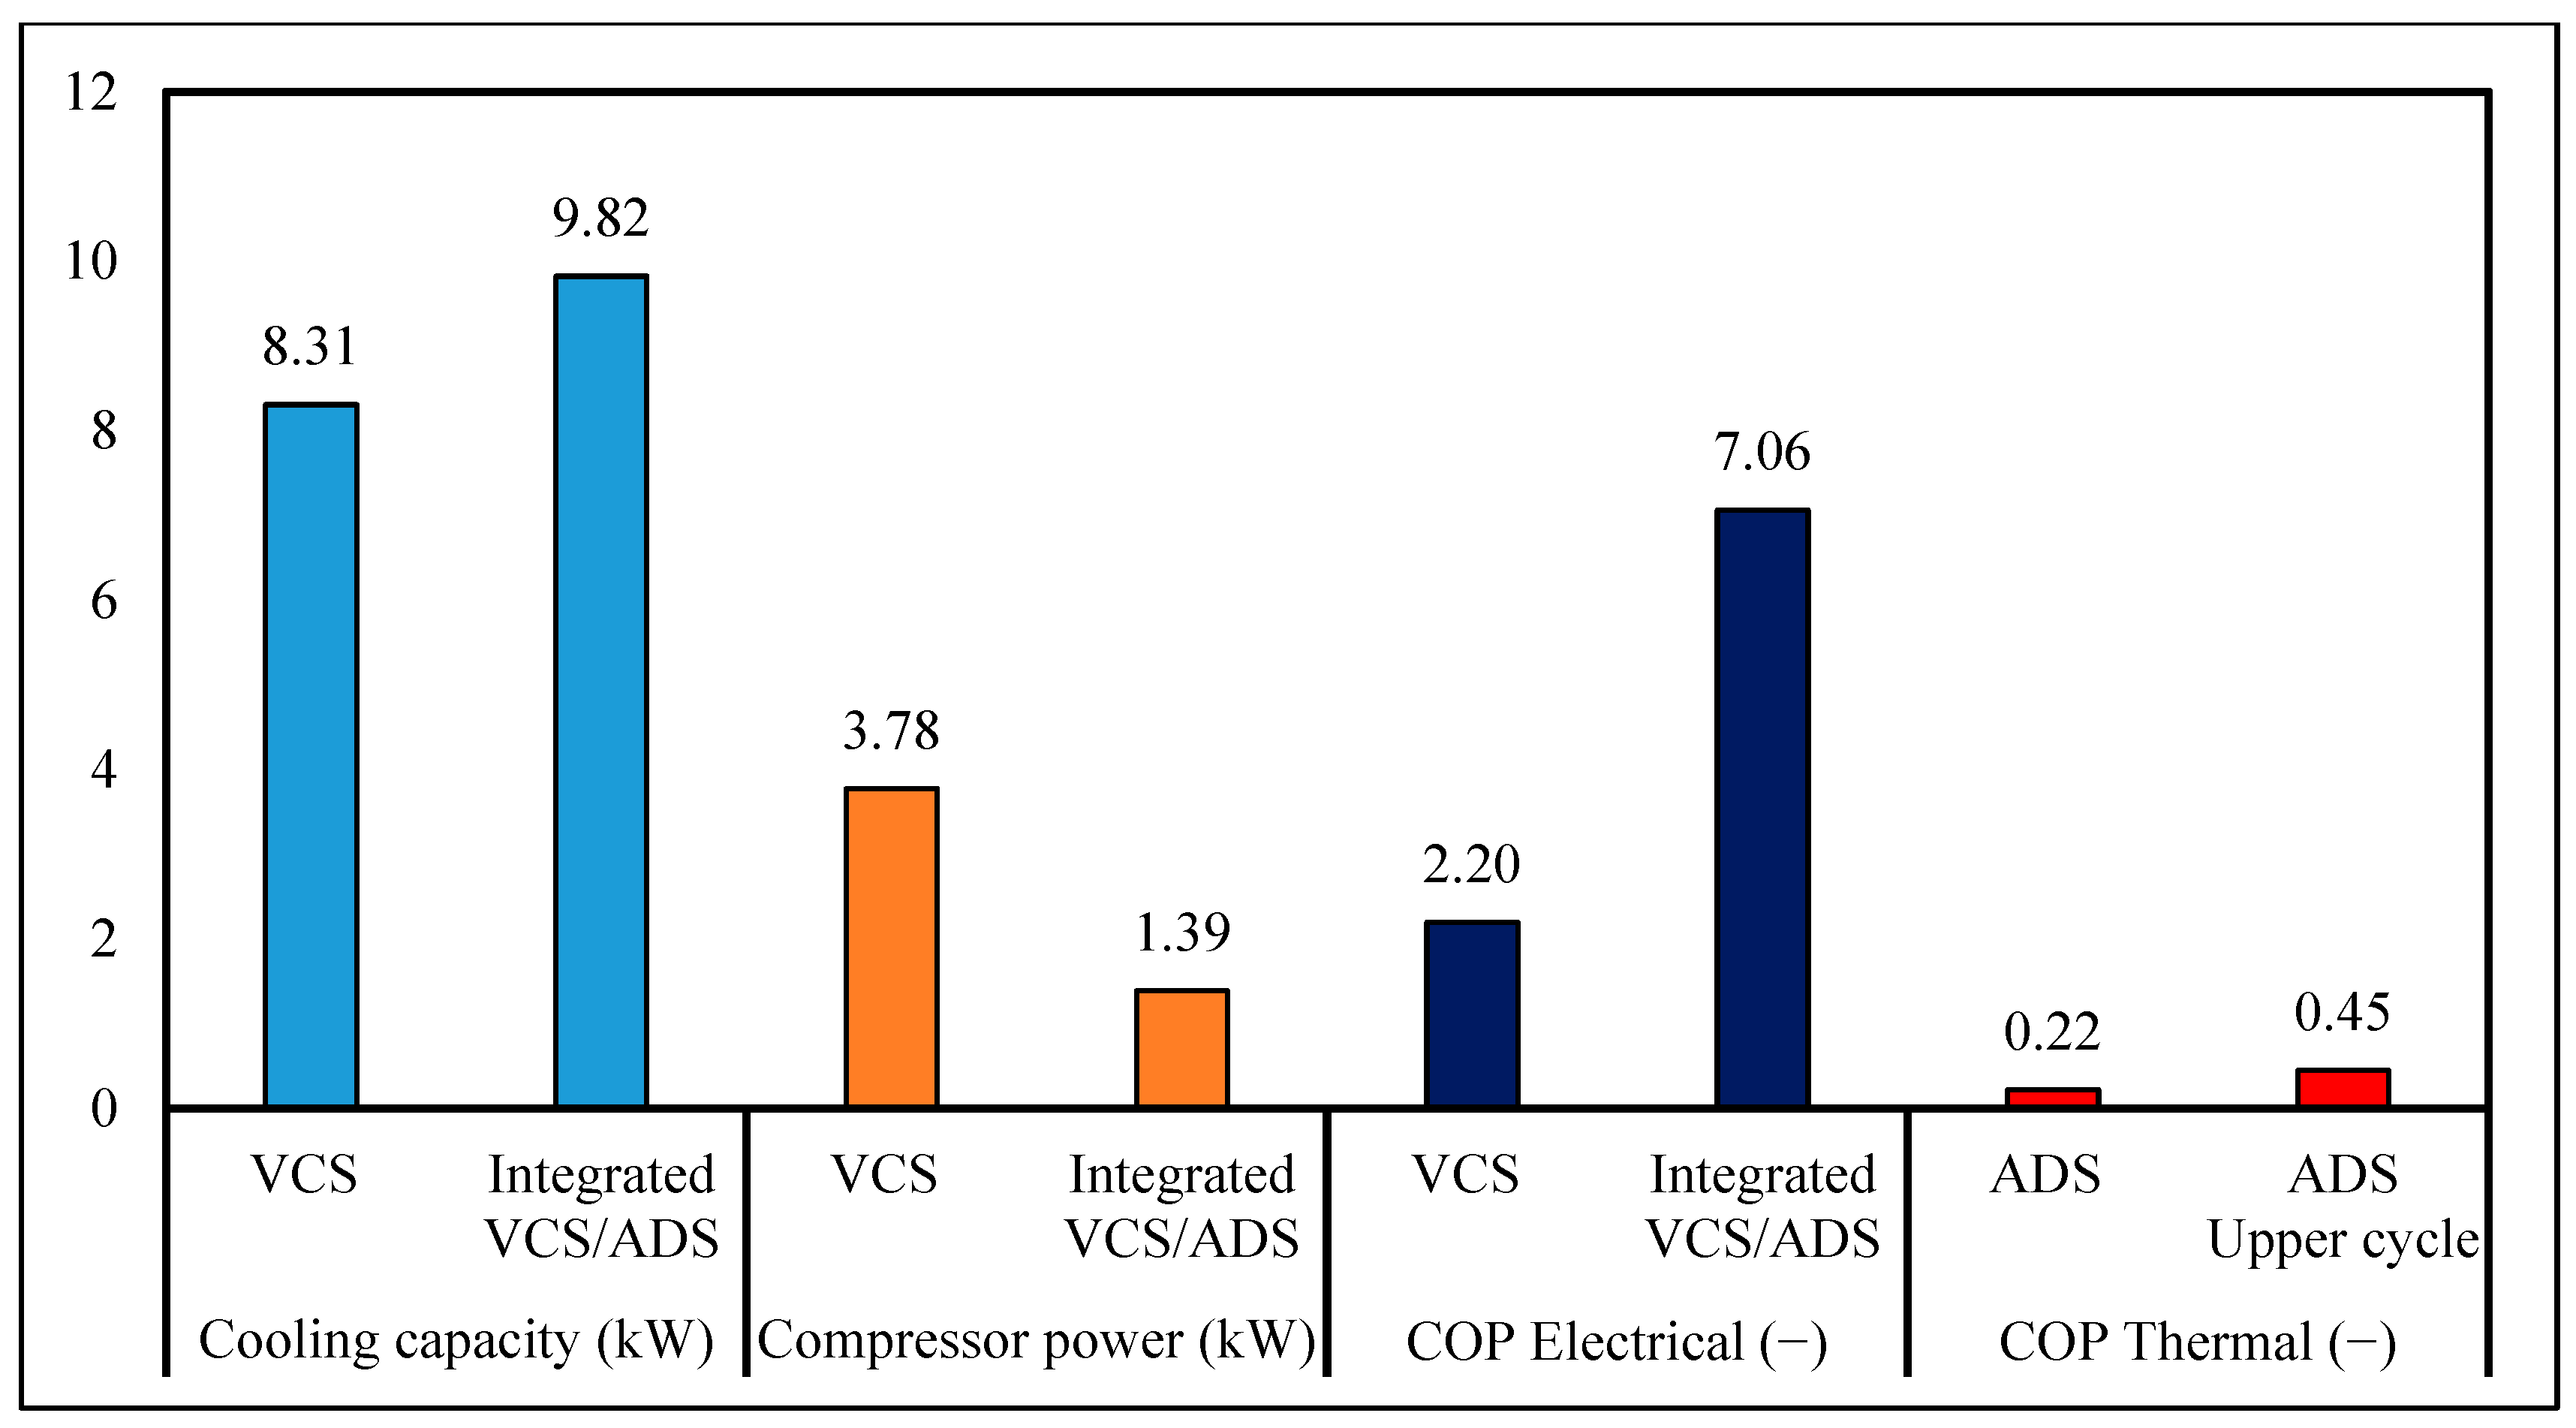
4.3. Comparison with the Conventional VCS

Finally, the importance of the cascade vapor compression and adsorption refrigeration system being applied at higher ambient temperatures can be summarized as shown in Figure 12. The datasheet of the manufacturer for the VCS’s compressor is used to define the performance of the single conventional VCS, which is also used in this study to simulate the integrated VCS/ADS. The above findings in this study emphasize how crucial it is to use the optimal ADS cycle time. As a result, the comparisons in Figure 12 use the optimal ADS cycle time of 360 s and a condensing temperature of 50 °C.
By using the cascade system, the VCS’s cooling capacity can be raised from 8.31 to 9.82 kW, representing an increase of 18.2%. This is directly related to the evaporator’s increased ability, with a higher enthalpy difference when the VCS condensing temperature drops from 50 °C to 18.14 °C. In such a case, compressor power can be significantly decreased by 63.2% by taking advantage of the larger condensing temperature drops. Consequently, the COP of the VCS has a very high potential to be increased by 221%, from 2.2 to 7.06. These findings make the use of such integrated VCS/ADS a promising solution for refrigeration systems working under high ambient temperature conditions. On the other hand, using the ADS as a topping cycle for the VCS results in a higher COP for the ADS compared to operating it individually. The ADS’s COP can be increased by 104.5% in such challenging circumstances, with a condensing temperature of 50 °C, as shown in Figure 12.
The results match those reported for the VCS. When the condensing temperature increases by 1 °C, the COP drops by 2–4% [9]. In this study, and according to the case given in Figure 12, the condensing temperature is increased by 31.86 °C. That results in a minimum expected drop in the COP of 63.72%. The result of the present study shows that the drop in the COP from 7.06 to 2.2 represents a 68.8% drop, which also represents an increase of 221% when calculated based on the change in COP from 2.2 to 7.06.

5. Conclusions

This study investigates using a cascade vapor-compression/adsorption refrigeration system in hot weather when there is not as much cooling water available, which raises the condensing temperature. For the adsorption system (ADS) in the topping cycle, 50, 55, and 60 °C are considered to be the condensing temperatures. Furthermore, the combined VCS/ADS system is assessed using changes in the ADS’s cycle time. In this study, COMSOL Multiphysics is used to construct a fully coupled transient model that simulates the integrated system. The manufacturer’s data for a VCS compressor under various condensing and evaporating temperatures are merged with an adsorption model. Taking into account the practical limitations of the VCS, the integrated model built in this study captures the dynamic nature of the ADS on the overall performance of the integrated system. In the event that the ADS is powered by a solar heating system, the cascade system generates ice to offer continuous cooling for air conditioning purposes. The main findings of the study can be summarized as follows:
  • The minimum temperatures in the intermediate HEX can be reached at an ideal ADS cycle time, leading to the best performance for the vapor compression system.
  • To ensure a balanced functioning between the two cycles, there is a limit to how long the ADS cycle can be extended, which should not be disregarded.
  • When the condensing temperature,  T c ,  is raised from 50 °C to 60 °C, the VCS’s COP decreases by 29.5%, while the ADS’s COP decreases by 7.55%, indicating that the VCS is more susceptible to the change in the condensing temperature of the ADS.
  • Compared to the conventional VCS, the cascade system can increase the VCS’s cooling capacity by 18.2%, reduce the compressor power by 63.2%, and increase the COP by 221%, at a high condensing temperature,  T c , of 50 °C. These results demonstrated that, in extreme environmental circumstances, the cascade VCS/ADS refrigeration system has a tremendous potential to be more sustainable with lower electricity consumption compared to the typical system.
  • In this study, the selection of the adsorption working pair was based on their higher adsorption performance along with their lower environmental impact. However, more investigations need to be carried out to compare different adsorbent/adsorbate pairs, considering many more aspects, such as conducting a 4E (energy, exergy, economic, and environment) study.

Author Contributions

Conceptualization, M.B.E.; methodology, M.B.E.; software, M.B.E.; validation, M.B.E. and J.O.; formal analysis, M.B.E. and A.E.-L.; investigation, M.B.E.; resources, H.A.-A., J.O. and A.E.-L.; data curation, M.B.E.; writing—original draft, M.B.E.; writing—review and editing, M.B.E.; visualization, J.O. and A.E.-L.; supervision, H.A.-A.; project administration, J.O. and A.E.-L.; funding acquisition, H.A.-A. All authors have read and agreed to the published version of the manuscript.

Funding

This project was funded by the National Plan for Science, Technology and Innovation (MAARIFAH), King Abdulaziz City for Science and Technology, Kingdom of Saudi Arabia, award number (ll-ENE1845-02).

Institutional Review Board Statement

Not applicable.

Informed Consent Statement

Not applicable.

Data Availability Statement

The data that support the findings of this study are available from the corresponding author, [M.B.E.], upon reasonable request.

Conflicts of Interest

The authors declare no conflict of interest.

Nomenclature

ADSAdsorption system
C O P Coefficient of performance 
C p Specific heat capacity  J · k g 1 · K 1
C C Cooling capacity  W
D I P Daily ice production  ( k g · d a y 1 )
K L D F Mass-transfer coefficient  s 1
h f g Ethanol refrigerant latent heat  J · k g 1
h Enthalpy  J · k g 1
M Mass  k g
M C H E X Thermal mass of the intermediate HEX ( kJ · k 1 )
m ˙ Mass flow rate ( kg · s 1 )
p Pressure  ( P a )
Q ˙ Rate of heat transfer  W
H s Isosteric heat of adsorption  J · k g 1
T Temperature  K
t Time  s
t c y c l e Adsorption system cycle time  s
VCSVapor compression system
w Uptake  k g w · k g a d 1
w e q Equilibrium adsorption uptake  k g w · k g a d 1
W ˙ v Instantaneous compressor work  W
Greek symbols:
ε Heat transfer effectiveness
η i s Compressor isentropic efficiency 
η I I Second law efficiency 
Subscripts and superscripts:
a ,   a d s Adsorption
b Bed
c cooling
c o n d Condenser
c o m p Compressor
e v a Evaporator
e q Equilibrium
f Foam
h Heating
i Inlet
i s Isentropic
r e f Refrigerant
r l Refrigerant liquid
s Solid adsorbent
s a t Saturation
v Vapor
w Water

References

  1. Tarawneh, Q.; Chowdhury, S. Trends of Climate Change in Saudi Arabia: Implications on Water Resources. Climate 2018, 6, 8. [Google Scholar] [CrossRef]
  2. Muradov, A.; Hasanli, Y.; Hajiyev, N. World Market Price of Oil: Impacting Factors and Forecasting; Springer: Cham, Switzerland, 2019. [Google Scholar] [CrossRef]
  3. Dupont, J.L.; Domanski, P.; Lebrun, P.; Ziegler, F. The Role of Refrigeration in the Global Economy. In Proceedings of the 38th Note on Refrigeration Technologies; International Institute of Refrigeration: Paris, France, 2019. [Google Scholar]
  4. Lelieveld, J.; Proestos, Y.; Hadjinicolaou, P.; Tanarhte, M.; Tyrlis, E.; Zittis, G. Strongly increasing heat extremes in the Middle East and North Africa (MENA) in the 21st century. Clim. Chang. 2016, 137, 245–260. [Google Scholar] [CrossRef]
  5. Tang, R.; Wang, S.; Sun, S. Impacts of technology-guided occupant behavior on air-conditioning system control and building energy use. Build. Simul. 2020, 14, 209–217. [Google Scholar] [CrossRef]
  6. Alsouda, F.; Bennett, N.S.; Saha, S.C.; Salehi, F.; Islam, M.S. Vapor Compression Cycle: A State-of-the-Art Review on Cycle Improvements, Water and Other Natural Refrigerants. Clean Technol. 2023, 5, 584–608. [Google Scholar] [CrossRef]
  7. Sovacool, B.K.; Griffiths, S.; Kim, J.; Bazilian, M. Climate change and industrial F-gases: A critical and systematic review of developments, sociotechnical systems and policy options for reducing synthetic greenhouse gas emissions. Renew. Sustain. Energy Rev. 2021, 141, 110759. [Google Scholar] [CrossRef]
  8. Kim, J.-H.; Seong, N.-C.; Choi, W. Forecasting the Energy Consumption of an Actual Air Handling Unit and Absorption Chiller Using ANN Models. Energies 2020, 13, 4361. [Google Scholar] [CrossRef]
  9. Çengel, Y.A.; Boles, M.A.; Kanoğlu, M. Thermodynamics: An Engineering Approach, 9th ed.; McGraw-Hill: New York, NY, USA, 2019. [Google Scholar]
  10. Shabir, F.; Sultan, M.; Niaz, Y.; Usman, M.; Ibrahim, S.M.; Feng, Y.; Naik, B.K.; Nasir, A.; Ali, I. Steady-State Investigation of Carbon-Based Adsorbent–Adsorbate Pairs for Heat Transformation Application. Sustainability 2020, 12, 7040. [Google Scholar] [CrossRef]
  11. Kılıç, M. Evaluation of Combined Thermal–Mechanical Compression Systems: A Review for Energy Efficient Sustainable Cooling. Sustainability 2022, 14, 13724. [Google Scholar] [CrossRef]
  12. Elsheniti, M.B.; Eissa, M.S.; Al-Ansary, H.; Orfi, J.; Elsamni, O.; El-Leathy, A. Examination of Using Aluminum-Foam/Finned-Tube Beds Packed with Maxsorb III for Adsorption Ice Production System. Energies 2022, 15, 2757. [Google Scholar] [CrossRef]
  13. Rezk, M.; Elsheniti, M.B.; Rezk, A.; Elsamni, O.A. Multi-objective optimisation of MOF-801 adsorbent packed into copper foamed bed for cooling and water desalination systems. Appl. Therm. Eng. 2023, 229, 120642. [Google Scholar] [CrossRef]
  14. Dakkama, H.J.; Youssef, P.G.; Al-Dadah, R.K.; Mahmoud, S. Adsorption ice making and water desalination system using metal organic frameworks/water pair. Energy Convers. Manag. 2017, 142, 53–61. [Google Scholar] [CrossRef]
  15. Cyklis, P. Two stage ecological hybrid sorption–compression refrigeration cycle. Int. J. Refrig. 2014, 48, 121–131. [Google Scholar] [CrossRef]
  16. Palomba, V.; Varvagiannis, E.; Karellas, S.; Frazzica, A. Hybrid Adsorption-Compression Systems for Air Conditioning in Efficient Buildings: Design through Validated Dynamic Models. Energies 2019, 12, 1161. [Google Scholar] [CrossRef]
  17. Yu, M.; Jin, S.; Zhang, W.; Xia, G.; Liu, B.; Jiang, L. Feasibility Analysis on Compression-Assisted Adsorption Chiller Using Chlorides for Underground Cold Transportation. Energies 2023, 16, 7963. [Google Scholar] [CrossRef]
  18. Gado, M.G.; Megahed, T.F.; Ookawara, S.; Nada, S.; El-Sharkawy, I.I. Potential application of cascade adsorption-vapor compression refrigeration system powered by photovoltaic/thermal collectors. Appl. Therm. Eng. 2022, 207, 118075. [Google Scholar] [CrossRef]
  19. Gado, M.G.; Megahed, T.F.; Ookawara, S.; Nada, S.; El-Sharkawy, I.I. Performance and economic analysis of solar-powered adsorption-based hybrid cooling systems. Energy Convers. Manag. 2021, 238, 114134. [Google Scholar] [CrossRef]
  20. Gado, M.G.; Ookawara, S.; Nada, S.; Hassan, H. Renewable energy-based cascade adsorption-compression refrigeration system: Energy, exergy, exergoeconomic and enviroeconomic perspectives. Energy 2022, 253, 124127. [Google Scholar] [CrossRef]
  21. Koushaeian, M.; Duong, X.Q.; Park, M.Y.; Lee, W.S.; Kwon, O.K.; Shah, N.A.; Chung, J.D. Investigation of the cascade type of hybrid adsorption-vapor compression chiller. Case Stud. Therm. Eng. 2023, 47, 103037. [Google Scholar] [CrossRef]
  22. Kilic, M.; Anjrini, M. Comparative performance analysis of a combined cooling system with mechanical and adsorption cycles. Energy Convers. Manag. 2020, 221, 113208. [Google Scholar] [CrossRef]
  23. Elsheniti, M.B.; AlRabiah, A.; Al-Ansary, H.; Almutairi, Z.; Orfi, J.; El-Leathy, A. Performance Assessment of an Ice-Production Hybrid Solar CPV/T System Combining Both Adsorption and Vapor-Compression Refrigeration Systems. Sustainability 2023, 15, 3711. [Google Scholar] [CrossRef]
  24. Albaik, I.; Alamri, Y.A.; Elsheniti, M.B.; Al-Dadah, R.; Mahmoud, S.; Ismail, M.A. Assessment of a novel multi-generation solar CPV/T system combining adsorption and organic rankine cycle subsystems. Sol. Energy 2022, 236, 455–472. [Google Scholar] [CrossRef]
  25. Calise, F.; Figaj, R.D.; Vanoli, L. A novel polygeneration system integrating photovoltaic/thermal collectors, solar assisted heat pump, adsorption chiller and electrical energy storage: Dynamic and energy-economic analysis. Energy Convers. Manag. 2017, 149, 798–814. [Google Scholar] [CrossRef]
  26. Roumpedakis, T.C.; Vasta, S.; Sapienza, A.; Kallis, G.; Karellas, S.; Wittstadt, U.; Tanne, M.; Harborth, N.; Sonnenfeld, U. Performance Results of a Solar Adsorption Cooling and Heating Unit. Energies 2020, 13, 1630. [Google Scholar] [CrossRef]
  27. Xu, J.; Pan, Q.; Zhang, W.; Liu, Z.; Wang, R.; Ge, T. Design and experimental study on a hybrid adsorption refrigeration system using desiccant coated heat exchangers for efficient energy utilization. Renew. Sustain. Energy Rev. 2022, 169, 112890. [Google Scholar] [CrossRef]
  28. Vasta, S.; Palomba, V.; La Rosa, D.; Mittelbach, W. Adsorption-compression cascade cycles: An experimental study. Energy Convers. Manag. 2018, 156, 365–375. [Google Scholar] [CrossRef]
  29. Gibelhaus, A.; Fidorra, N.; Lanzerath, F.; Bau, U.; Köhler, J.; Bardow, A. Hybrid refrigeration by CO2 vapour compression cycle and water-based adsorption chiller: An efficient combination of natural working fluids. Int. J. Refrig. 2019, 103, 204–214. [Google Scholar] [CrossRef]
  30. Palomba, V.; Dino, G.E.; Frazzica, A. Coupling sorption and compression chillers in hybrid cascade layout for efficient exploitation of renewables: Sizing, design and optimization. Renew. Energy 2020, 154, 11–28. [Google Scholar] [CrossRef]
  31. EMERSON. Copeland ScrollTM 1-5 HP ZPK5. Available online: https://climate.emerson.com/en-us/shop/1/copeland-sku-zp42k5e-pfv-800 (accessed on 20 October 2023).
  32. Wang, X.; Chua, H.T. Two bed silica gel–water adsorption chillers: An effectual lumped parameter model. Int. J. Refrig. 2007, 30, 1417–1426. [Google Scholar] [CrossRef]
  33. Jribi, S.; Miyazaki, T.; Saha, B.B.; Koyama, S.; Maeda, S.; Maruyama, T. Corrected adsorption rate model of activated carbon–ethanol pair by means of CFD simulation. Int. J. Refrig. 2016, 71, 60–68. [Google Scholar] [CrossRef]
  34. Elsheniti, M.B.; Eissa, M.S.; Al-Ansary, H.; Orfi, J.; El-Leathy, A.; Elsamni, O. Using a Combination of Activated Carbon and Graphene Nanoparticles in a Consolidated Form for Adsorption Ice Maker: A System-Level Modeling. Appl. Sci. 2022, 12, 7602. [Google Scholar] [CrossRef]
  35. Freon 410a si Thermodynamic Properties. Available online: www.freon.com (accessed on 25 October 2023).
Figure 1. Schematic diagram of the integrated vapor-compression/adsorption refrigeration system.
Sustainability 16 03669 g001
Figure 2. The datasheet parameters of the VCS at −5 °C evaporating temperature and different condensing temperatures.
Sustainability 16 03669 g002
Figure 3. The representation of the vapor compression cycle on a pressure–enthalpy graph.
Sustainability 16 03669 g003
Figure 4. The validation of the COPs of both ADS and VCS models against their counterparts; (a) ADS validation reference [12], and (b) VCS validation reference [31].
Sustainability 16 03669 g004
Figure 5. The time variation of the refrigerant flow rates in both cycles with an adsorption cycle time of 760 s.
Sustainability 16 03669 g005
Figure 6. The time variation of temperatures in both beds, VCS condensing temperature, and ADS evaporating temperature.
Sustainability 16 03669 g006
Figure 7. The variation of evaporator cooling power, compressor power, and condenser heat rejection in the VCS.
Sustainability 16 03669 g007
Figure 8. The effect of ADS cycle time on the intermediate HEX temperatures at different ADS condensing temperatures.
Sustainability 16 03669 g008
Figure 9. The effect of the ADS cycle time on the cooling capacities of both cycles at different ADS condensing temperatures.
Sustainability 16 03669 g009
Figure 10. The effect of ADS cycle time on the compressor power and DIP at different ADS condensing temperatures.
Sustainability 16 03669 g010
Figure 11. The effect of ADS cycle time on the COP of both cycles at different ADS condensing temperatures.
Sustainability 16 03669 g011
Figure 12. The performance of the hybrid system at the best ADS cycle time compared to the conventional system.
Sustainability 16 03669 g012
Table 1. Adsorption system parameters.
ParameterSymbolValueUnit
Cooling water mass flow rate m ˙ c 0.7628 kg · s 1
Heating water mass flow rate m ˙ h 0.5394 kg · s 1
Bed effectiveness during cooling ε c 0.802-
Bed effectiveness during heating ε h 0.853-
Adsorbent mass per bed M s 9.512 kg
Foam mass per bed M f 9.509 kg
Mass of copper heat exchanger per bed M b 54 kg
Thermal mass of the intermediate HEX M C H E X 366 kJ · k 1
Isosteric heat of adsorption H s 1002 kJ ·   kg 1
Activated carbon specific heat C s 1370 J ·   kg 1 · k 1
Aluminum-foam specific heat C f 895 J ·   kg 1 · k 1
Cupper specific heat C b 385 J ·   kg 1 · k 1
Specific heat of ethanol (liquid) C r l 2570 J ·   kg 1 · k 1
Bed inlet cooling water temperature T c , i 30
Regeneration temperature T h , i 90
ADS’s condensing temperature T c o n d , a   or       T c 50, 55, and 60
Table 2. The parameters used in the simulation of the VCS.
ParameterValueUnit
Compressor type Copeland ZP42K5E-PFV
RefrigerantHFC-410A
Cooling capacity
@ T c o n d , v  = 54.44 °C
and  T e v a , v  = 7.22 °C
12.29 kW
Compressor power
@ T c o n d , v  = 54.44 °C
and  T e v a , v  = 7.22 °C
4.07 kW
Degree of superheating11
Degree of subcooling8.3
Evaporating temperature−5
Enthalpy   at   compressor   inlet   h 1 432 kJ ·   kg 1
Enthalpy   at   evaporator   outlet   h 1 , s a t @ T e v a , v = 5 ° C 421 kJ ·   kg 1
Disclaimer/Publisher’s Note: The statements, opinions and data contained in all publications are solely those of the individual author(s) and contributor(s) and not of MDPI and/or the editor(s). MDPI and/or the editor(s) disclaim responsibility for any injury to people or property resulting from any ideas, methods, instructions or products referred to in the content.

