Article

Geomorphological and Bioclimatic Relationships in the Occurrence of Species of Agro-Extractivist Interest in the Cerrado Biome

by
Renan Augusto Miranda Matias
1,*,
Alba Valéria Rezende
1,
Anderson Cássio Sevilha
2,
Aldicir Osni Scariot
2,
Eraldo Aparecido Trondoli Matricardi
1 and
Levi Carina Terribile
3
1
Postgraduate Program in Forest Sciences, Brasília University, Campus Darcy Ribeiro, Brasília 70910-900, Brazil
2
Embrapa Genetic Resources and Biotechnology, Ecology and Conservation Laboratory, Brasília 70770-917, Brazil
3
Macroecology Laboratory, Academic Unit of Biological Sciences, Federal University of Jataí, Jataí 75801-615, Brazil
*
Author to whom correspondence should be addressed.
Sustainability 2024, 16(9), 3653; https://0-doi-org.brum.beds.ac.uk/10.3390/su16093653
Submission received: 4 February 2024 / Revised: 26 February 2024 / Accepted: 26 February 2024 / Published: 26 April 2024
(This article belongs to the Special Issue Sustainability for Social Community Impact)

Abstract

:
The distribution of species of agro-extractivist interest and their ecological relationship with the physical environment geomorphological and bioclimatic allow supporting strategies aimed at socioeconomic and environmental development. We evaluated the contribution of high spatial resolution topographic variables in ecological niche models and the relationship of the distribution of five tree species with the geomorphological units and bioclimatic variables. The variables related to temperature variation and water availability proved to be important in predicting the areas of occurrence of the target species, with increased suitability of occurrence in regions with higher isothermality, located in the plateau and table geomorphological units. The predictions showed a significant difference when high spatial resolution variables were used, generating a more conservative scenario in the indication of suitable regions for the occurrence of species, important for local scale studies. The geomorphological units of plateau and tableland showed high suitability of occurrence, while the fluvial plains and dissected depressions did not present suitability for the occurrence of the species. The results allow us to strategically define areas with the greatest productive potential and prioritize areas for conservation, management, ecological restoration of forests, and targeting areas for the implementation of community agro-industries, essential for territorial planning within traditional communities.

1. Introduction

Biological communities, including humans, depend on an ecosystem in balance regarding its functions and services to maintain its populations. However, human-driven land-cover and climate change have affected how ecosystems function across the Earth [1,2]. Furthermore, the abundance and success of species of high commercial and social value (species of agro-extractivist interest) that have traditionally been sustainably exploited by local communities have also suffered due to a significant reduction and fragmentation of area available to them [3], putting diverse populations at risk of extinction, with increases in the number of threatened species and the intensity of extinction risks [4]. In response to the environmental change human communities worldwide have sought to adapt traditional practices to try to preserve their livelihoods [5].
The fragmentation of natural landscapes can cause various environmental impacts on remnant vegetation, which will directly or indirectly influence climate conditions, hydrological cycles, availability, quality of natural resources, biodiversity, ecological interactions between flora and fauna, and soil fertility. These environmental impacts also affect traditional populations, especially when there is a reduction in natural resources, essential for the maintenance and survival of these populations, such as water and fruits, for the extraction of pulp, oils, wood, fibers, and resin species present in native vegetation.
Traditional populations hold extensive knowledge about the spatialization and distribution of native species in their territories, which can allow them to develop management practices that enable a balance between human exploitation of native species and ecosystem’s function [6]. However, the balance between human species use and ecosystem function can be disturbed by external anthropogenic and climatological factors that alter the availability of natural resources and species distribution. Furthermore, there is a strong relationship between the structural physical environment of the land, the types of phyto-physiognomies that occur, and the communities’ way of life. Therefore, to anticipate the consequences of the external factors within a landscape it is necessary to study the spatial distribution of species and their relationships with bioclimatic variables and the geomorphological physical environment. In particular, information on terrain characteristics is very important to explain geographical constraints and map the variability of natural resources in maintaining sustainable vegetation management for assessment of land-use capabilities [7].
Information from remote sensors related to the potential distribution of species can support relevant data in environmental planning in prioritizing areas for biodiversity conservation, sustainable management, and ecological restoration [8]. The spatial distribution is also a basis for organizing the productive potential for local and regional investments, social organization, promotion of public policies, and access to credit aimed at bioeconomy programs, in addition to incentives for the strategic allocation of community-based agro-industries.
Species distribution (DEM) or ecological niche models have a solid predictive capacity for potential species–environment spatial distribution [9,10]. The fundamental premise of this modeling is that the observed distribution of a given species provides sufficiently essential information about its environmental preferences that can be used as predictive variables to define the appropriate geographic regions for its occurrence [11]. Therefore, obtaining reliable models requires selecting environmental variables related to the characteristics of the target species [12]. Other models can be used for this purpose, but it is less statistically robust when considering only the user-predefined amplitude of the species preference for each environmental variable, such as Fuzzy Analize.
Models with low spatial resolution may be preferred on a continental or biogeographic scale. However, modeling the species distribution from high-resolution variables can represent phenomena at a local scale [13], such as ecological corridors, road and river effects [14], and the model’s sensitivity to geomorphological units. Thus, fine-scale suitability models may be better suited for conservation planning and management at the local or regional level [15]. When responses are desired at a local or regional scale, it is essential to introduce high spatial resolution variables, such as those related to geomorphology (30 m). These variables can aggregate sensitive information on a spatial scale, considering the abrupt morphological modification of the soil at distances less than 1 km (scale of spatial resolution of the bioclimatic variables). This strategy of using topographic variables with high spatial resolution allows us to better represent the occurrence of the target species in a context of great importance for agro-extractivism, filling gaps in research that meets the scenarios aimed at territorial planning in communities that promote the conservation of biodiversity through its rational use, since they depend on these conserved environments.
Given the above, the objective of this work was to evaluate the contribution of high-spatial-resolution topographic variables in ecological niche models and evaluate the relationship of geomorphological units in the species distribution of agro-extractivist interests in the Cerrado. Thus, we sought to answer the following questions: (i) What is the relationship between bioclimatic and geomorphological variables with the species distribution of agro-extractivist interest in savanna vegetation in the TCARP? (ii) Does the inclusion of high-resolution topographic variables translated into geomorphological units enhance species distribution models’ sensitivity to geomorphological units?

2. Materials and Methods

2.1. Study Area

The area selected for the development of the study was the Alto Rio Pardo Territory (ARP), located in the extreme north of the state of Minas Gerais, on the border with the state of Bahia, Brazil. The ARP intercepts the limits of eighteen municipalities, totaling an area of 15,322.9 km2, located between the parallels 4°58′ and 16°30′ of south latitude and 41°34′ and 42°49′ of west longitude (Figure 1), and includes two main hydrographic basins, the Alto Rio Pardo and the Alto Jequitinhonha, in a transition region between the Cerrado and Caatinga biomes.
The region is characterized by its seasonal climate, with dry winters and rainy summers, average annual precipitation around 795 mm, poorly distributed during the rainy season, and an average temperature of 24.2 °C [16]. According to the classification by Koppen and Geigen [17], the climate in the region varies between humid Subtropical with dry winters and hot summers (Cwa), Subtropical with dry winters and temperate summer (Cwb), and Tropical with dry summers (As). The Cwb climate is predominant in the north and northwest regions of the territory, in the plateau areas and in the regions of higher altitudes located in the Serra Geral do Espinhaço, which reach 1700 m of altitude; the “As” climate, predominantly in the center-south region, in depression areas of the Jequitinhonha valley and river plains, with average altitudes of 700 m; and the Cwa climate is distributed throughout the territory in plateau areas, with an average altitude of 1000 m (Figure 1).

2.2. Target Species

The present study contemplates five target species of agro-extractivist interest, four of the selected species for non-timber use: “araticum” (Annona crassiflora Mart.), “pequi” (Caryocar brasiliense Cambess), “cagaita” (Eugenia dysenterica (Mart.) DC.), and “mangaba” (Hancornia speciosa Gomes); and, a species of wood interest: “Veludo” (Tachigali subvelutina (Benth.) Oliveira-Filho). The choice of non-timber species was based on their food importance for the communities and their economic potential in the commercialization in natura or processed in the region. They are responsible for various products and by-products of benefit to the communities, such as pulps, juices, sweets, jellies, ice cream, oil, nuts, and flour. They are sold directly at institutional fairs and private markets. The wood species was selected for its wide use for local family consumption [18], comprising by-products such as firewood and stakes for fences, corrals, ox carts, among other uses.
Other species are also managed by communities in the north of Minas Gerais, for timber and non-timber use, but the five species selected in this manuscript stand out in the aforementioned criteria, also selected by research projects and socioeconomic and environmental development in the territory [19].

2.3. Environmental Variables to Species Distribution Modeling

Twenty-three environmental variables were acquired, being 19 bioclimatic and four topographic. The detailed description of each variable used in this study and their respective values associated with the ecological macro-reading of the ARP are presented in Supplementary Material, Table S1.
The bioclimatic variables were obtained using WorldClim–Global Climate Data (http://www.worldclim.org/) [20], available in matrix format, with a spatial resolution of 30 arc-seconds, that is, approximately 1 km.
The variables related to geomorphological units were incorporated due to their strong relationship with the distribution of phyto-physiognomies, water resources, and the layout and occupation of the landscape by human communities. The selection of variables related to geomorphological units followed the method described by Vasconcelos et al. [21] (Figure 2), which describes the use of digital elevation models and their derivatives in colored composition (R/G/B: altitude/slope/minimum curvature or terrain aspect). The classification and visual interpretation of the colored composition were according to Sena-Souza et al. [22], following the taxonomy of geomorphological mapping described by IBGE [23].
A margin of 50 km in the upper, lower, left, and right limits of the ARP were added to the geospatial bases cut, to better interpret the occurrence adequacy models in the boundary zones of the study area. Subsequently, the cutting of the models’ results for the study area limits was performed. The extension of the study area aims to reduce the arbitrary effects of ecological truncation associated with the limits (perimeter) of the territory, which have no ecological relationship with the distribution of species, thus including possible environmental gradients and zones intercurrence of related species [24].
The bioclimatic variables were resampled [25,26], using the Arcgis Pro 3.1.2 “Resample” tool for the resolution of 30 m, according to the geomorphological variables, keeping the matrix value of bioclimatic variables original. It is important to emphasize that the bioclimatic variables have an original spatial resolution of 1 km. Therefore, keeping the refined pixels (30 m) with the original pixel values is mandatory. They aimed at the best contribution to the refinement of areas of suitability for species occurrence through the geomorphological (topographical) variables inserted in the bioclimatic characteristics. The database with an original spatial resolution of 1km was also used in data processing for comparative purposes with the model with spatial resolution refinement (30 m), adopting the same methodological procedures. For comparative purposes, the occurrence suitability values among the different spatial resolution were submitted to the non-parametric Mann-Whitney test [27] at 5% probability, using 1000 random points distributed in areas with adequate occurrence of the target species.

2.4. Data Collection for Species Distribution Modeling

Species distribution modeling consisted of two stages (pilot modeling and final modeling). The pilot modeling was carried out with available species occurrence data, between online data [SpeciesLink (http://splink.cria.org.br/), the Global Biodiversity Information Facility (GBIF: www.gbif.org)] and data from work carried out in the region [18,28,29], as well as records collected by researchers and technicians from Embrapa Genetic Resources and Biotechnology in work related to the collection of botanical material and identification of populations of native species in the north of Minas Gerais, all incorporated into the CEN Herbarium. After preparing the pilot species distribution map using the Maxent algorithm version 3.4.1 [9], it was used to plan field expeditions and collect data from species occurrence records in different suitability strata to perform the final modeling. This strategy was adopted to incorporate new occurrence records for the final modeling, considering random samples across the range and variation of the suitability of species.

2.5. Data Related to the Occurrence of Species

The survey of the occurrence points of each of the target species was obtained through primary and secondary data. The primary data consisted of recording geographic coordinates with navigation GPS during field expeditions in various fragments of native vegetation. On the other hand, secondary data consisted of obtaining information on species used in the pilot modeling.
For secondary data, imprecise records regarding the geographic location of species occurrence points were eliminated, such as those taken before the advent of GPS in the 1990s, of points in the center of cities and water bodies, of records with less than four decimal places, in addition to data filtering through the simple rarefaction tool, from the SDMtoolbox 2.0 package [30]. In addition, species occurrence points with a distance of less than 1 km were eliminated to avoid more than one record within the same pixel, considering the original spatial resolution of the bioclimatic variables.

2.6. Selection of Variables to Adjust Species Distribution Models (SDM)

The environmental variables were submitted to principal component analysis (PCA). Being used in the processing of data, the principal components (PCs) accounted for 95% of the explained variance. The PC scores were rasterized as a strategy to eliminate collinearity and autocorrelation between variables [31,32]. The component rasterization process was performed using the “rasterPCA” function, from the RStoolbox package, in the R 3.4.4 software [33].
As the first PCs are the most important in explaining the variability of the data, they are represented by all the variables involved in the analysis. However, some variables have greater weight—that is, a more significant contribution to this component. Thus, data processing was performed using the main rasterized components. Initially, the variables with the highest eigenvalue in the first axes of the PCA (with the most significant representation of the variance) were filtered and used to interpret the relationship between the environmental variables that best explained the occurrence of the species. In other words, the essential variables in the principal components with the most significant representation of the data variance were used.
The variables within each PC were evaluated for multicollinearity through the variance inflation value (VIF). This assessment aims to select the essential variables free from multicollinearity when the variance inflation values are below threshold 10 [34]. With multicollinearity between the bioclimatic variables, the criterion adopted was to maintain the variable corresponding to the quarter in which the species flowering/fruiting occurred. This interpretation includes a bioclimatic variable related to phenological characteristics, which is essential to maintaining the species in its occurrence environment. However, this criterion was not applied when the selected variable had superior eigenvalue within the principal component. Thus, the modeling was performed based on the analysis results of rasterized principal components and the interpretation of the most important variables related to species occurrence due to the higher eigenvalue of the data in the principal components.

2.7. Algorithms Used, Processing Parameters, and Model Evaluation

Nine algorithms were used to project the areas of the suitability of species occurrence [35], in order to contemplate different statistical interpretations in the projection of areas of suitability of species occurrence and avoid bias in the choice specific algorithms. The algorithms used were: Artificial Neural Networks (ANN) [36], Classification Tree Analysis (CTA) [37], Flexible Discriminant Analysis (FDA) [38], Generalized Additive Models (GAM) [39], Generalized Boosting Model (GBM) [40], Generalized Linear Models (GLM) [41], Maximum Entropy (MAXENT) [9], Multiple Adaptive Regression Splines (MARS) [42] and Random Forest (RF) [43]. Analyses were performed using the “biomod2” package in the R software [44].
The total number of occurrence records was divided into 70% for training and 30% for validation [45,46], with five replications for calibration of the adjusted models. For the RF, CTA, and GBM algorithms, the processing considered the number of pseudo-absences (PAs) equal to the number of occurrence points of the species. The other algorithms used five sets of 1000 PAs to provide a better quality of the models’ fits [47]. The Pas’ creation method was the “disk”, present in the “biomod2” package of the R software, with a maximum distance equal to the average distance between the occurrence points and the minimum distance equal to the average distance between the reference point and the nearest points [44]. Twenty-five models were processed for each algorithm (five repetitions for five sets of pseudo-absences), totaling 225 models at the end of processing to each specie.
The final map of species occurrence suitability was obtained through the ensemble of all models, among the different algorithms used [48], and whose performance was greater than 0.4 concerning the accuracy metric True Skill Statistic (TSS) [49,50]. The binary map was also built based on the ensemble model. This map was obtained by the value that considers the scores above the threshold that maximizes the sensitivity and specificity (ROC Threshold) [51].
All algorithms and precision metrics were processed in R 3.4.4 software. The routine developed by the Ecology Laboratory (LabEc) at the State University of Mato Grosso–Alta Floresta Campus [52] was used, with necessary modifications to meet the peculiarities of this study. The elaboration of maps and post-processing of the images were carried out using the Arcgis Pro 3.1.2.

3. Results

3.1. Accuracy of Occurrence Suitability Models

Species distribution modeling was performed using seven components generated from PCA that correspond to 96.1% of the explanatory variance, counting with 783 occurrence records, distributed in 68 points for Annona crassiflora, 467 for Caryocar brasiliense, 122 for Eugenia dysenterica, 77 for Hancornia speciosa, and 49 for Tachigali subvelutina.
According to the precision metric used, TSS for all models showed, on average, good quality in the adequacy projections. However, the Generalized Linear Models (GLMs) algorithm stood out with high predictive power of the suitability zones for three species (E. dysenterica, H. speciosa, and T. subvelutina) (Supplementary Material, Figure S1). For the species A. crassiflora and C. brasiliense, the GLM model also presented good precision statistics. However, the algorithms Artificial Neural Networks (ANNs) and Generalized Additive Models (GAMs) resulted in higher TSS values for C. brasiliense and, of Random Forest (RF) algorithm was better for A. crassiflora. The CTA algorithm had the lowest predictive power for all species. However, it is considered satisfactory for presenting TSS > 0.5, with better prediction than expected by chance [49].
The models that presented adequate precision metrics were expressed in an ensemble map (Figure 3). The species C. brasiliense had the largest coverage area with suitable occurrence in the ARP, with 50.1% of suitable areas, followed in descending order by E. dysenterica (45.8%), H. speciosa (37.4%), A. crassiflora (35.9%), and T. subvelutina (17.7%). The unit models of each algorithm by species are presented in Supplementary Material, Figures S2–S6.

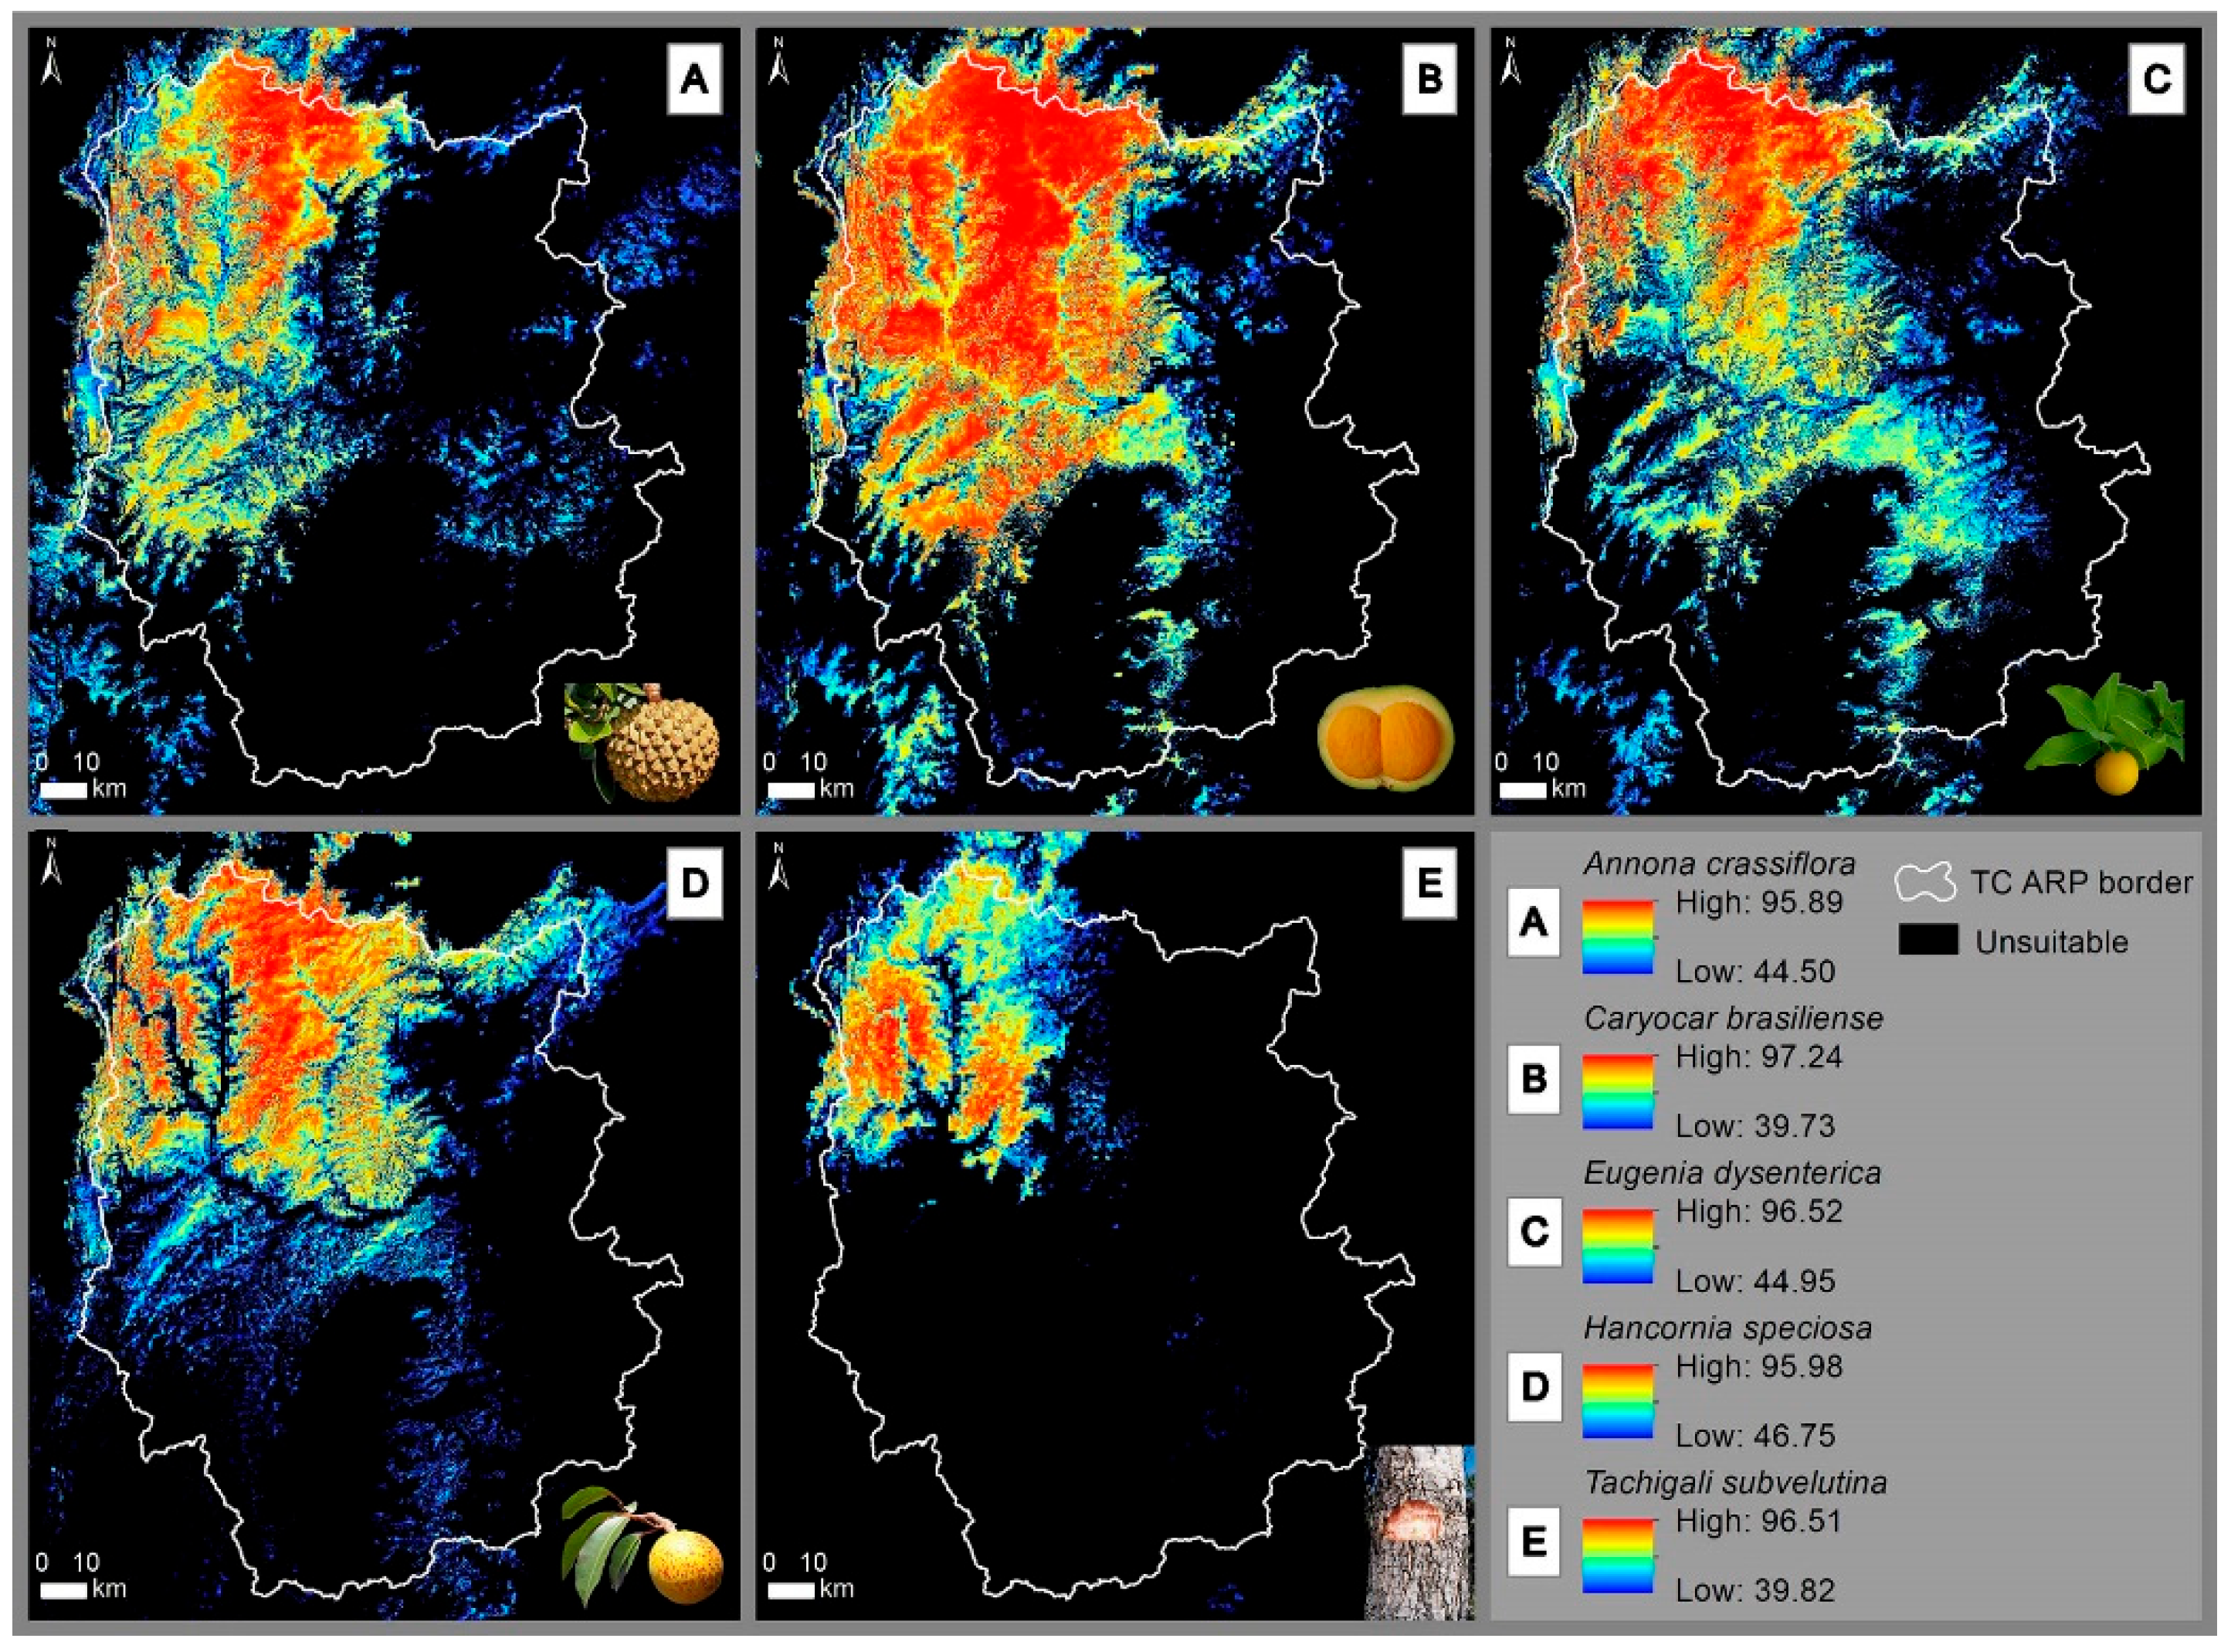
3.2. Geomorphological and Bioclimatic Relationships in the Suitability of Occurrence of Agro-Extractivist Species Interest in the Cerrado Biome

For all species, topographic variables were relevant in predicting areas with occurrence suitability and other variables related to temperature and precipitation. The species, A. crassiflora, C. brasiliense, and T. subvelutina, had a total of five variables in the models with the high predictive power of the suitability zones, and the species E. dysenterica and H. speciosa had four variables (Table 1).
The northwest region of the Alto Rio Pardo Territory (ARP) showed the highest suitability values for all species, which is the region that presents the highest isothermality (Supplementary Material, Figure S7). The geomorphological relationship with the Cerrado sensu stricto phyto-physiognomies corroborates the results of the ensemble model of the potential distribution of the target species of this study, where the areas suitable for the occurrence of the species were predominantly located in plateau and table areas, and these environments are naturally covered by savanna vegetation. In a macro-reading of the landscape in the ARP (Figure 4), a geomorphological unit called the dissected depression in the southeast was observed. This unit exists under the influence of the middle Jequitinhonha hydrographic basin, where seasonal forests predominate. In the northeast, with a predominance of vegetation in transition, which is characteristic of the Caatinga biome, there are no records of occurrence of the five species. In addition, the region located in the extreme west, outside the limits of the ARP, characterized by a depression dissected by the influence of the São Francisco River basin, also does not present records of occurrence. In general, in the southern part of the Alto Rio Pardo Territory, areas that are not suitable for the occurrence of the five species evaluated predominate. In this region, the predominant formation is forestry, specifically seasonal deciduous forests.
Reflectance patterns of phyto-physiognomies of savanna and forest formations, associated with geomorphological units, can be visualized in Landsat 8 satellite images, with false-color interpretation (Figure 4). Reddish tones are represented by surfaces with active photosynthetic rates, predominantly in plateau and colluvium ramp areas, because in these environments there was a peak of near-infrared reflectance. On the other hand, the southern features of the ARP had a predominance of green tones, represented by deciduous forest formations, which have higher absorption of the mentioned bands during the dry season of the year, when the species are in the deciduous stage, corresponding to the geomorphological unit called dissected depression.

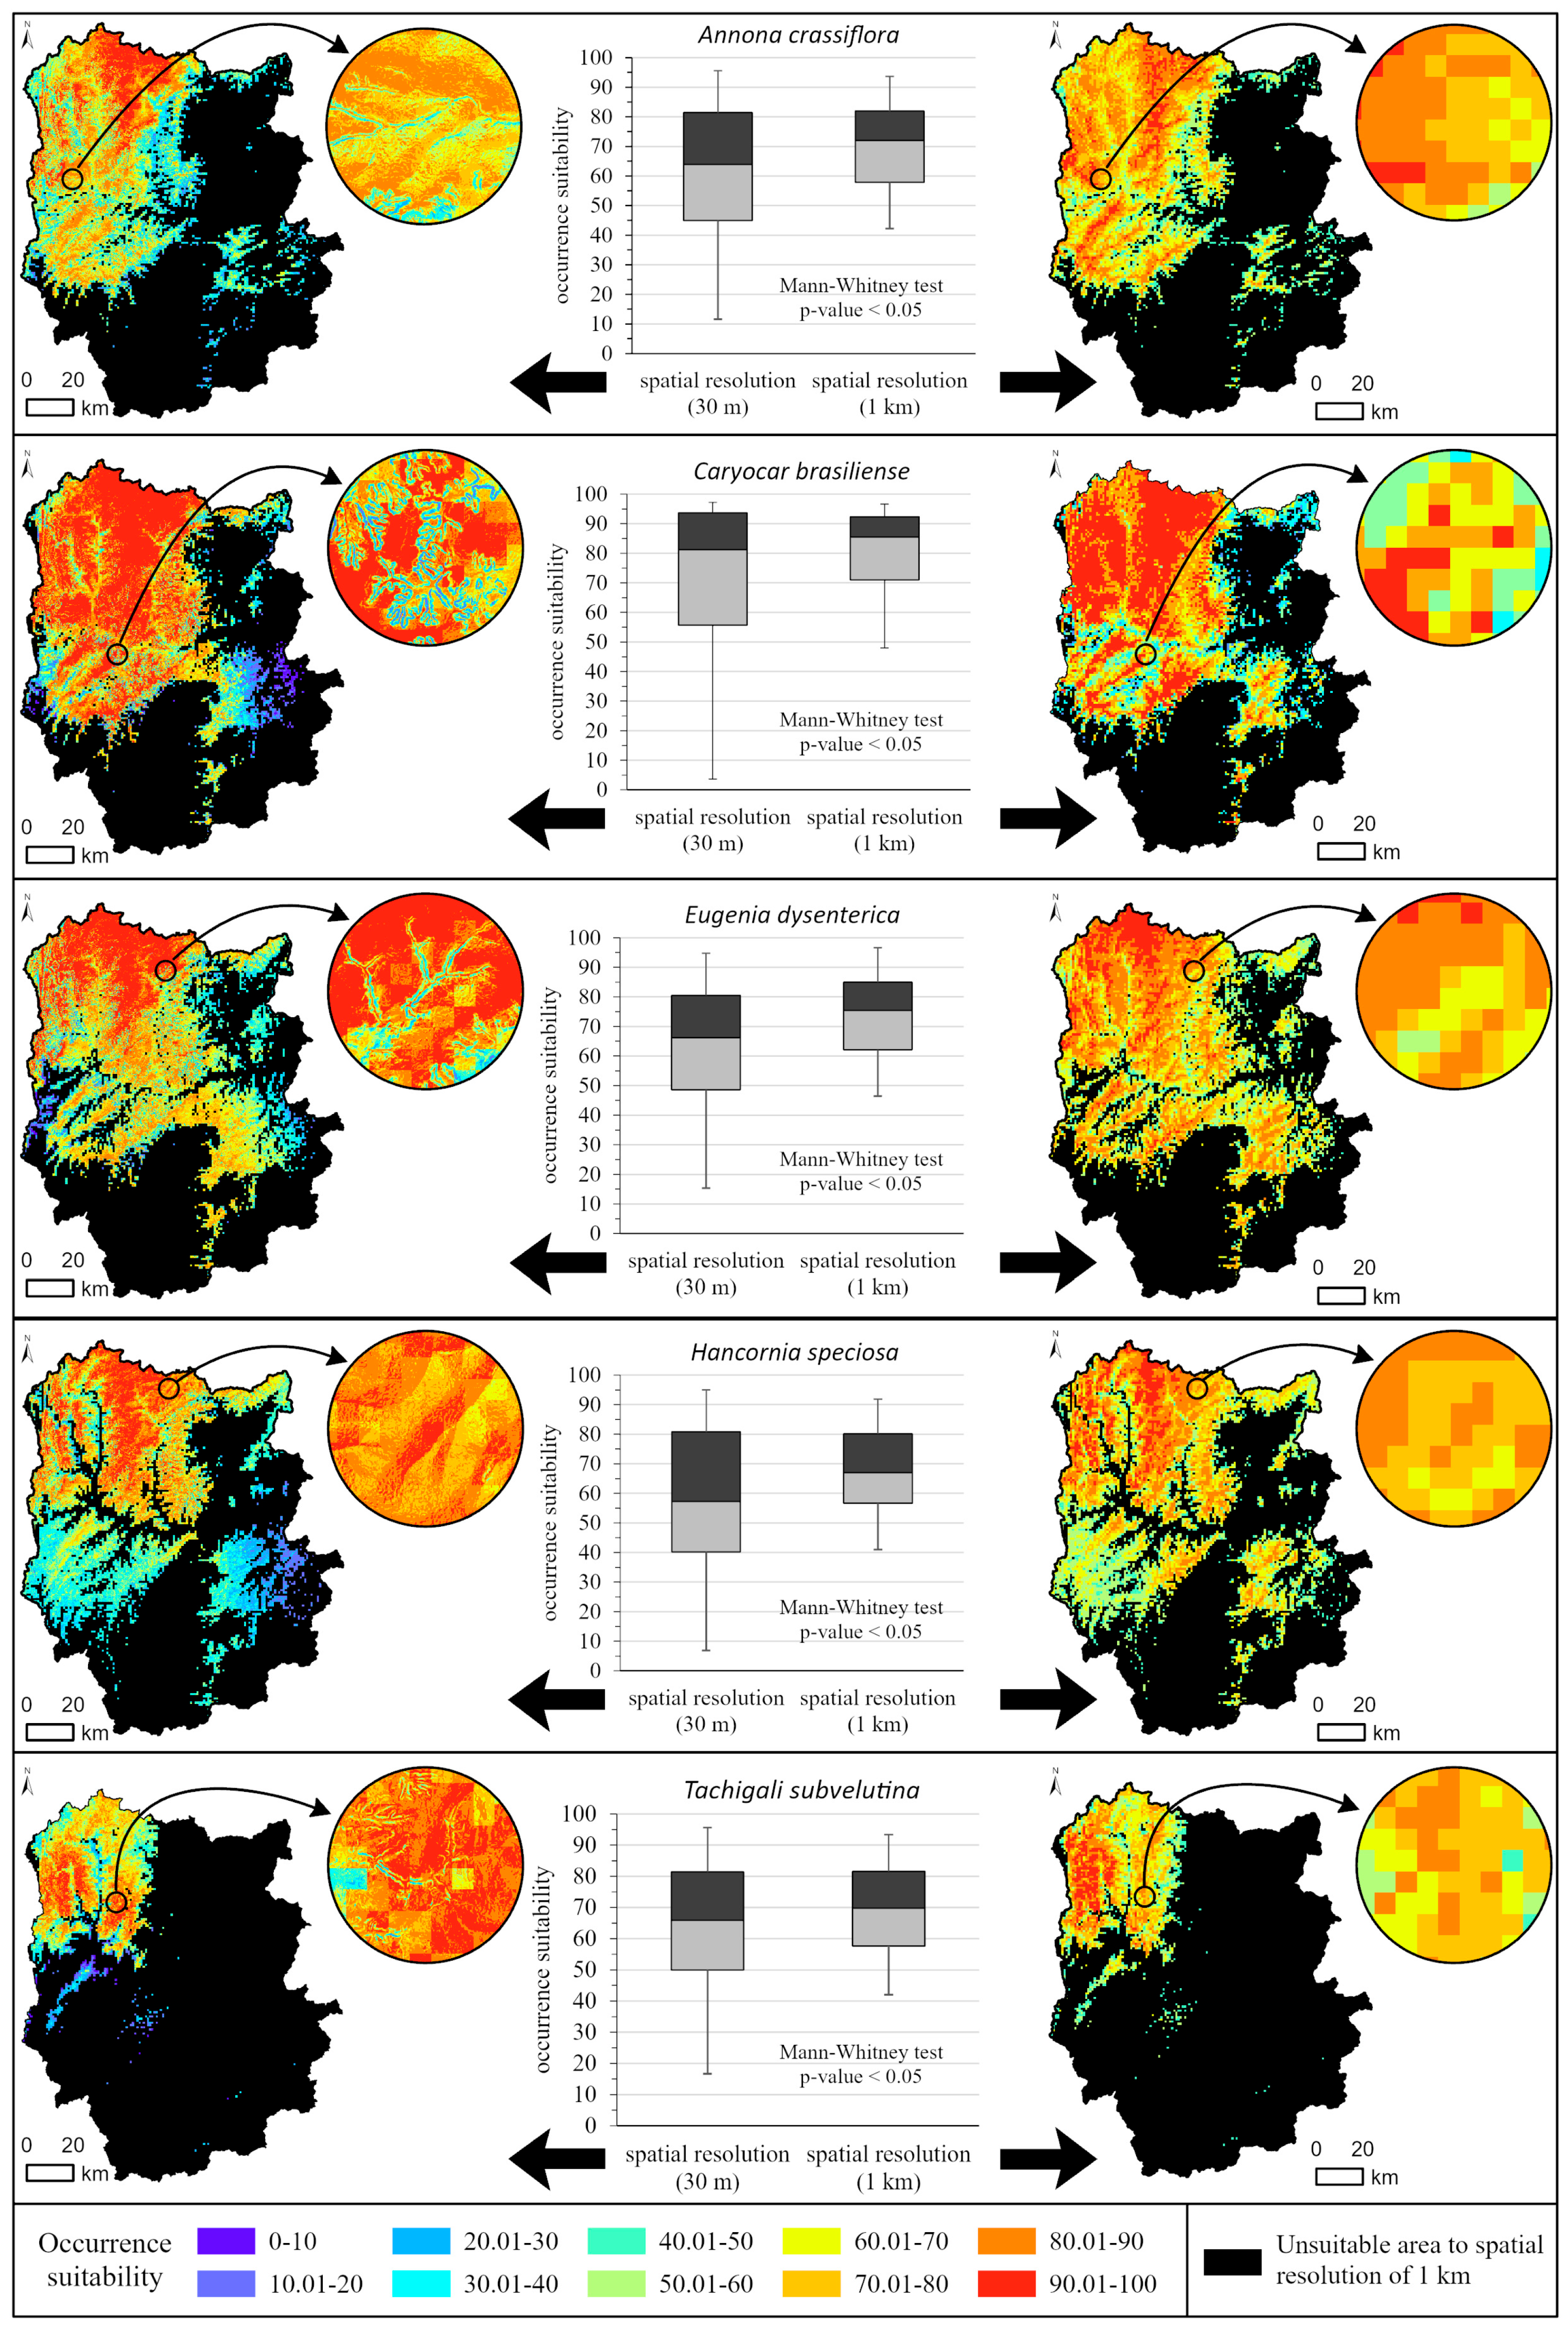
3.3. Improved Prediction of Suitability against Topographic Variables with High Spatial Resolution

The models, whose variables with a spatial resolution of 30 m and 1 km (Figure 5), showed a significant difference by Mann-Whitney test (α < 0.05) with increased amplitude of values below the median for spatial resolution of 30 m when compared to 1 km of spatial resolution. In other words, there was a reduction in the occurrence suitability values when using refined data, providing a more conservative scenario in indicating regions with occurrence suitability.
The high-spatial-resolution models allow a refined reading of the bioclimatic characteristics in relation to the topographic variables, providing maps with sufficient spatial resolution for territorial planning, prioritizing areas for conservation, management and restoration of native vegetation, and indication of strategically suitable zones for the installation of community-based agro-industries, in addition to providing maps with gradients of suitability that can be used to infer the productive potential of socio-biodiversity species. This set of information is relevant for the strengthening of local public policies and socioeconomic and environmental development projects.

4. Discussion

4.1. Bioclimatic Variables and the Suitability of Occurrence of Agro-Extractivist Species Interest in the Cerrado Biome

Temporal plant growth and reproduction patterns are linked to climatic seasonality in tropical savannas [54]. In the present study, it was possible to highlight the variables’ isothermality (bio3) and temperature seasonality (bio4), which reflect the range of daily temperature variations throughout the year. Variables related to temperature variation were also highlighted in studies involving modeling species distribution in the Cerrado [26,55]. These variables support the sensitivity of the species studied to high-temperature ranges. Sites with high suitability for these species, within the scope of the TCARP, increased as the temperature variation was reduced. This trend was observed in all species with one of the two variables with high explanatory power concerning occurrence.
The daily variation in temperature over the years may have little influence on established individuals. However, the response of a species regarding the production of flowers, fruits, seeds, the germination of its seeds, and the establishment of its seedlings is translated as a functional trait due to the high variation in temperature. This trait is directly related to the successful establishment and permanence of the species in the field.
According to Carvalho and Nakagawa [56], extreme temperature variations can affect seed germination percentage and its uniformity. This sensitivity to temperature variation is characterized as term inhibition, when the temperature exceeds the optimal seed germination thresholds [57]. Milder variations can favor the establishment of seedlings by reducing desiccation in the driest period of the year, which coincides with winter, which can provide more moisture in the air and more night dew, which contribute to the maintenance of the individual in the field. The transition between the dry and rainy seasons is characterized as a period of more phenological activity, both vegetative and reproductive, in the community [58]. Temperature and precipitation are fundamental variables that influence the development cycle of plant species, from germination to fruiting when, under favorable conditions, they provide greater adequacy of occurrence and permanence of the species over time.
The variable annual mean temperature (bio1) is essential in predicting the occurrence suitability zones in two species included in the study (A. crassiflora and C. brasiliense). The mean temperature of the driest quarter (bio9) between July and September is present in three species (E. dysenterica, H. speciosa, and T. subvelutina). These variables are highly correlated, with an average variation of around 2.5 °C in the study area.
The same happens with the variables related to precipitation. Annual precipitation (bio12) and precipitation in the wettest quarter (bio16) were selected as the essential bioclimatic variables to determine the potential occurrence of the species A. crassiflora, C. brasiliense, E. dysenterica, H. speciosa, and T. subvelutina. Both precipitation variables were also relevant in determining the occurrence of species since the ARP is a region with a poorly distributed rainfall regime throughout the year. The wettest quarter in the region (October to December) is responsible for 52% of annual precipitation, extending to January and February when they total about 90% of annual precipitation [16]. The analyzed species generally tend to germinate in summer, a period of more significant water availability in the year, to promote a start in seed germination to permeate the subsequent dry season and ensure its establishment.

4.2. Geomorphological Variables and the Suitability of Occurrence of Agro-Extractivist Species Interest in the Cerrado Biome

The variables, given the different geomorphological units of the landscape, allow the understanding of how the units reflect fundamental characteristics for the occurrence of the species. Topography heterogeneity on a local scale plays an important role in forest management, productivity and diversity [59]. The relief, aspect (slope direction), and slope substantially contribute to identifying regions with suitable occurrence due to the strong relationship with the depth of soils and exposure to the sun. This relationship translates into temperature and water availability effects, reflected in the different phyto-physiognomies occurring. In landscapes with high altitude range at short distances, the availability of light and shading is strongly related to the topographical position (aspect of the ground or slope direction) [60] in order to interfere with the incident radiation, in soil moisture and, consequently, in the composition/occurrence of plant species.
In general, the plateaus are predominantly characterized by flat to gently undulating terrain (slope between 0% and 3%) [23], with deep and well-drained soils, which may or may not be delimited by erosive retreat fronts [22]. These plateau are naturally occupied by the Cerrado sensu stricto, which is the phyto-physiognomy of the species included in this study.
It is possible to observe a higher frequency in the plateau and on the edges of the plateau, specifically in the relief break with a tendency to colluvium ramp (smooth undulating terrain) of the species H. speciosa. In an area with accentuated relief break (front of erosive retreat), higher density and frequency of the species T. subvelutina are observed on the edge of the plateau. In flat terrains, in plateau areas, with deep quartzose soils, the species A. crassiflora and E. dysenterica are more frequent, and E. dysenterica is also present in terrains with moderate slope and soil with sediments with more significant variation in size (gravel). It is noteworthy that all five species occur predominantly in plateau with deep and well-drained soils.
The northwest region of the ARP is characterized by plateau, with deep and well-drained quartzarenic soils. These plateau are cut by insertions of fluvial plains, which represent environments with higher humidity, with low suitability for the occurrence of the target species. This fact demonstrates refinement in predicting regions of low suitability, driven by topographic variables with high spatial resolution, though models with 1 km of spatial resolution were also sensitive in river plains over 500 m wide, approximately. In addition, the plateau region is characterized by the presence of Cerrado sensu stricto, which is consistent with the response of the potential distribution models of the species.
In the southeast region of the ARP, the models predict a narrow range of regions with the suitable occurrence of the five species inserted within the geomorphological unit called dissected depression. These strips correspond to isolated remnants of plateau in the shape of tables and are located between the cities Taiobeiras, Salinas and Rubelita. Thus, both geomorphological units (table and plateau) have areas of Cerrado sensu stricto as a natural formation and demonstrate the sensitivity of the models in predicting the suitability of species occurrence.
The northwest region of the ARP has two conservation units (Nascentes Geraizeiras Sustainable Development Reserve and Montezuma State Park). They are located in a region with high occurrence adequacy for the five species analyzed, conserving available forest resources. Lima et al. [18] found in their study that the species C. brasiliense, E. dysenterica, H. speciosa, and A. crassiflora were among the species with the highest importance value index (IVI), and T. subvelutina was in the 29th position of the IVI, in a part of Cerrado sensu stricto located in the RDS Nascentes Geraizeiras. Therefore, the results obtained by Lima et al. [18] corroborate the reliability of the prediction of the models generated in this study, which indicates the same area of Cerrado sensu stricto, in the RDS Nascentes Geraizeiras, as suitable for the occurrence of the five species studied.

4.3. Response of High Spatial Resolution Geomorphological Variables in Occurrence Suitability Models

The variables with the high spatial resolution provided a better reading of the landscape in the representation of regions with suitability of occurrence, which demonstrates a strong potential for use when carrying out studies at a local and regional scale. The models were sensitive in the differentiation of suitability, mainly due to the different slope directions or terrain aspect, in addition to the regions inserted in the geomorphological units called river plains, lowland places with more humid soil, where the target species do not occur. On the other hand, there is a greater demand on the data processing capacity, increasing about 1000 times the number of pixels in data processing when using 30 m spatial resolution variables when compared to the 1 km, which limits the use for large territorial extensions.
Arieira et al. [25] recommends that future studies focus on high-spatial resolution modeling, allowing interpretations of ecological effects in areas of potential establishment of invasive species.

5. Conclusions

Predicting the suitability of the five target species of agro-extractivist interest has a strong relationship with water availability and increased suitability in regions with greater isothermality, in addition to geomorphological, especially with the plateau and table areas, with the natural cover of savanna formation and not suitable for occurrence areas in river plains and dissected depressions, with coverage natural forest formation.
Models with a spatial resolution of 30 m showed a significant difference (α < 0.05) for the occurrence suitability values when compared to models with 1 km of spatial resolution, demonstrating that there were improvements in the identification of suitable areas for the occurrence of species, with a reduction of suitable areas for occurrence, providing a more conservative scenario in the indication of these regions. The models performed with greater sensitivity according to the morphological structure of the terrain, promoting a reduction in suitability values in fluvial plains and different directions of the terrain slopes. This sensitivity makes the use of these models viable for the strategic planning of agro-extractivism in territories of traditional use. Thus, it can be used to strategically define areas with the greatest productive potential and prioritize areas for conservation, sustainable management, ecological restoration of forests, and targeting areas for the implementation of community agro-industries, essential for land use planning with traditional communities that depend on these conserved natural areas.
The level of detail of the distribution of species in high spatial resolution models allows future research on the estimation of the density of individuals of species of socioeconomic and environmental interest at a local or regional scale and in a spatialized way, by the association between the information of suitability of occurrence and density of individuals, consequently, predict the estimation of the productive potential of these species. This information is of fundamental importance for the strategic planning of actions in traditional territories, in promoting the development of local economic potentials and fostering access to existing public policies.

Supplementary Materials

The following supporting information can be downloaded at: https://0-www-mdpi-com.brum.beds.ac.uk/article/10.3390/su16093653/s1, Figure S1: Occurrence point of species of agro-extractivist interest in the Alto Rio Pardo Territory, Minas Gerais, Brazil; Figure S2: Accuracy metrics of the algorithms used in the final modeling of the distribution of species of agro-extractivist interest (MDS). In the Geraizeiras communities of the Cidadania Alto Rio Pardo Territory (TCARP), Minas Gerais; Figure S3: Occurrence suitability models by the algorithm for Annona crassiflora Mart. specie in the Alto Rio Pardo Territory, Minas Gerais, Brazil; Figure S4: Occurrence suitability models by the algorithm for Caryocar brasiliense Cambess specie in the Alto Rio Pardo Territory, Minas Gerais, Brazil; Figure S5: Occurrence suitability models by the algorithm for Eugenia dysenterica (Mart.) specie in the Alto Rio Pardo Territory, Minas Gerais, Brazil; Figure S6: Occurrence suitability models by the algorithm for Hancornia speciosa Gomes specie in the Alto Rio Pardo Territory, Minas Gerais, Brazil; Figure S7: Occurrence suitability models by the algorithm for Tachigali subvelutina (Benth.) Oliveira-Filho specie in the Alto Rio Pardo Territory, Minas Gerais, Brazil; Figure S8: Isothermality map in the Alto Rio Pardo Territory, Minas Gerais, Brazil; Table S1: List and description of environmental variables used in species distribution modeling. References [20,24,60,61] are cited in the Supplementary Materials.

Author Contributions

R.A.M.M.: conceptualization, methodology, software, validation, formal analysis, investigation, data curation, writing—original draft preparation, writing—review and editing, visualization. A.V.R.: conceptualization, methodology, validation, investigation, writing—review and editing, supervision, project administration, funding acquisition. A.C.S.: conceptualization, methodology, software, validation, formal analysis, investigation, resources, writing—review and editing, supervision, project administration, funding acquisition. A.O.S.: conceptualization, methodology, investigation, writing—review and editing, supervision. E.A.T.M.: conceptualization, methodology, investigation, writing—review and editing, supervision. L.C.T.: conceptualization, methodology, writing—review and editing. All authors have read and agreed to the published version of the manuscript.

Funding

This research was funded by the Coordenação de Aperfeiçoamento de Pessoal de Nível Superior-Brasil (CAPES)-Finance Code 001, Projeto Bem Diverso (BRA/14/G33), executed by Embrapa Genetic Resources and Biotechnology, United Nations Development Programme (UNDP) and resource of the Global Environmental Facility (GEF) and Decanatos de Pesquisa e Inovação e de Pós-Graduação, e a Bibliotéca Central da Universidade de Brasília-DPI/DPG/BCE.

Institutional Review Board Statement

Not applicable.

Informed Consent Statement

Not applicable.

Data Availability Statement

The geospatial data presented in this study are available on https://bemdiverso.maps.arcgis.com/apps/MapSeries/index.html?appid=4378836a7a4b42fb98280f707e70d13a, accessed on 3 February 2022.

Acknowledgments

We thank the University of Brasilia, Projeto Bem Diverso, Coordenação de Aperfeiçoamento de Pessoal de Nível Superior-Brasil (CAPES) and the communities present in the territory where this work was developed, all of whom were fundamental in the development of the research and direction of territorial needs.

Conflicts of Interest

Authors Anderson Cássio Sevilha and Aldicir Osni Scariot were employed by Embrapa Genetic Resources and Biotechnology, Ecology and Conservation Laboratory. The remaining authors declare that the research was conducted in the absence of any commercial or financial relationships that could be construed as a potential conflict of interest.

References

  1. Scheffers, B.R.; De Meester, L.; Bridge, T.C.L.; Hoffmann, A.A.; Pandolfi, J.M.; Corlett, R.T.; Butchart, S.H.M.; Pearce-Kelly, P.; Kovacs, K.M.; Dudgeon, D.; et al. The Broad Footprint of Climate Change from Genes to Biomes to People. Science 2016, 354, aaf7671. [Google Scholar] [CrossRef] [PubMed]
  2. Lima, D.L.; Alves, T.S.; Oliveira, A.P.G.; Catalani, T.G.T.; Dalmas, F.B.; Paranhos Filho, A.C. Identificação e Quantificação Semiautomática de Desmatamento Por Sensoriamento Remoto. Res. Soc. Dev. 2020, 9, 30942721. [Google Scholar] [CrossRef]
  3. Evangelista-Vale, J.C.; Weihs, M.; José-Silva, L.; Arruda, R.; Sander, N.L.; Gomides, S.C.; Machado, T.M.; Pires-Oliveira, J.C.; Barros-Rosa, L.; Castuera-Oliveira, L.; et al. Climate Change May Affect the Future of Extractivism in the Brazilian Amazon. Biol. Conserv. 2021, 257, 109093. [Google Scholar] [CrossRef]
  4. Ceballos, G.; Ehrlich, P.R.; Dirzo, R. Biological Annihilation via the Ongoing Sixth Mass Extinction Signaled by Vertebrate Population Losses and Declines. Proc. Natl. Acad. Sci. USA 2017, 114, E6089–E6096. [Google Scholar] [CrossRef] [PubMed]
  5. Martin, T.G.; Watson, J.E.M. Intact Ecosystems Provide Best Defence against Climate Change. Nat. Clim. Chang. 2016, 6, 122–124. [Google Scholar] [CrossRef]
  6. Rigonato, V.D.; Almeida, M.G.d. A Singularidade Do Cerrado: A Interrelação Das Populações Tradicionais Com as Fitofisionomias; Anais VIII EEREGEO; OGdG: Goiânia, Brazil, 2003. [Google Scholar]
  7. Mokarram, M.; Sathyamoorthy, D. Relationship between Landform Classification and Vegetation (Case Study: Southwest of Fars Province, Iran). Open Geosci. 2016, 8, 302–309. [Google Scholar] [CrossRef]
  8. Li, L.; Liu, M.; Ji, L.; Wang, F. Regional Analysis of the Potential Distribution of Heptacodium Miconioides and Its Competitor Species in China. Sustainability 2024, 16, 752. [Google Scholar] [CrossRef]
  9. Phillips, S.J.; Anderson, R.P.; Schapire, R.E. Maximum Entropy Modeling of Species Geographic Distributions. Ecol. Model. 2006, 190, 231–259. [Google Scholar] [CrossRef]
  10. Pearson, R.G.; Raxworthy, C.J.; Nakamura, M.; Townsend Peterson, A. Predicting Species Distributions from Small Numbers of Occurrence Records: A Test Case Using Cryptic Geckos in Madagascar. J. Biogeogr. 2006, 34, 102–117. [Google Scholar] [CrossRef]
  11. Pearson, R.G.; Dawson, T.P. Predicting the Impacts of Climate Change on the Distribution of Species: Are Bioclimate Envelope Models Useful? Glob. Ecol. Biogeogr. 2003, 12, 361–371. [Google Scholar] [CrossRef]
  12. Baek, S.; Kim, M.-J.; Lee, J.-H. Current and Future Distribution of Ricania Shantungensis (Hemiptera: Ricaniidae) in Korea: Application of Spatial Analysis to Select Relevant Environmental Variables for MaxEnt and CLIMEX Modeling. Forests 2019, 10, 490. [Google Scholar] [CrossRef]
  13. Mavárez, J.; Bézy, S.; Goeury, T.; Fernández, A.; Aubert, S. Current and Future Distributions of Espeletiinae (Asteraceae) in the Venezuelan Andes Based on Statistical Downscaling of Climatic Variables and Niche Modelling. Plant Ecol. Divers. 2019, 12, 633–647. [Google Scholar] [CrossRef]
  14. Nezer, O.; Bar-David, S.; Gueta, T.; Carmel, Y. High-Resolution Species-Distribution Model Based on Systematic Sampling and Indirect Observations. Biodivers. Conserv. 2017, 26, 421–437. [Google Scholar] [CrossRef]
  15. Hess, G.R.; Bartel, R.A.; Leidner, A.K.; Rosenfeld, K.M.; Rubino, M.J.; Snider, S.B.; Ricketts, T.H. Effectiveness of Biodiversity Indicators Varies with Extent, Grain, and Region. Biol. Conserv. 2006, 132, 448–457. [Google Scholar] [CrossRef]
  16. INMET. Banco de Dados Meteorológicos para Ensino e Pesquisa (BNDE). Available online: http://www.inmet.gov.br/portal/index.php?r=bdmep/bdmep (accessed on 4 December 2019).
  17. Alvares, C.A.; Stape, J.L.; Sentelhas, P.C.; Gonçalves, J.L.D.M.; Sparovek, G. Köppen’s Climate Classification Map for Brazil. Meteorol. Z. 2013, 22, 711–728. [Google Scholar] [CrossRef] [PubMed]
  18. Lima, I.L.P.; Scariot, A.; de Medeiros, M.B.; Sevilha, A.C. Diversidade e Uso de Plantas Do Cerrado Em Comunidade de Geraizeiros No Norte Do Estado de Minas Gerais, Brasil. Acta Bot. Bras. 2012, 26, 675–684. [Google Scholar] [CrossRef]
  19. Sevilha, A.C.; Scariot, A.; Matias, R.A.M.; Ávila, J.C.C.; Nascimento, M.M.; Viudes, P. Projeto Bem Diverso Sustenta e Inova: Integrando Conservação e Uso Sustentável da Biodiversidade às Práticas Produtivas de Produtos Florestais não Madeireiros e Sistemas Agroflorestais em Paisagens Florestais de Múltiplo Uso e Alto Valor de Conservação. 2021. Available online: https://bemdiverso.org.br/especies/ (accessed on 25 February 2024).
  20. Hijmans, R.J.; Cameron, S.E.; Parra, J.L.; Jones, P.G.; Jarvis, A. Very High Resolution Interpolated Climate Surfaces for Global Land Areas. Int. J. Climatol. 2005, 25, 1965–1978. [Google Scholar] [CrossRef]
  21. Vasconcelos, V.; de Carvalho Junior, O.A.; de Souza Martins, E.; Junior, A.F.C.; Guimarães, R.F.; Gomes, R.A.T. Sistema de classificação geomorfométrica baseado em uma arquitetura sequencial em duas etapas: Árvore de decisão e classificador espectral, no parque nacional serra da canastra. Rev. Bras. De Geomorfol. 2012, 13, 171–186. [Google Scholar] [CrossRef]
  22. Sena-souza, J.P.; Martins, É.D.S.; Felipe, A.; Júnior, C.; Reatto, A.; Vasconcelos, V.; Gomes, M.P.; Abílio, O.; Júnior, D.C.; Reis, A.M. Mapeamento Geomorfológico Da Bacia Hidrográfica Do Rio São Bartolomeu, Escala 1:100.000; Embrapa: Brasília, Brazil, 2013; pp. 1–38. [Google Scholar]
  23. IBGE—Instituto Brasileiro de Geografia e Estatística. Manual Técnico de Geomorfologia, 2nd ed.; IBGE: Rio de Janeiro, Brazil, 2009; ISBN 978-85-240-4110-5. [Google Scholar]
  24. Sevilha, A.C. Systematic Conservation Planning for the Paranã River Basin, Brazil, under Climate Change. Ph.D. Thesis, James Cook University, Douglas, Australia, 2016. [Google Scholar]
  25. Arieira, J.; Padovani, C.R.; Schuchmann, K.-L.; Landeiro, V.L.; Santos, S.A. Modeling Climatic and Hydrological Suitability for an Encroaching Tree Species in a Neotropical Flooded Savanna. Ecol. Manag. 2018, 429, 244–255. [Google Scholar] [CrossRef]
  26. Coelho, G.L.N.; de Carvalho, L.M.T.; Gomide, L.R. Modelagem Preditiva de Distribuição de Espécies Pioneiras No Estado de Minas Gerais. Pesqui. Agropecu. Bras. 2016, 51, 207–214. [Google Scholar] [CrossRef]
  27. Mann, H.B.; Whitney, D.R. On a Test of Whether One of Two Random Variables Is Stochastically Larger than the Other. Ann. Math. Stat. 1947, 18, 50–60. [Google Scholar] [CrossRef]
  28. Mazer, S. Potencial Produtivo de Plantas de Importância Socioeconômica da Reserva de Desenvolvimento Sustentável Nascentes Geraizeiras, Minas Gerais, Brasil. Mater’s Dissertation, Brasilia University, UnB, Brasília, Brazil, 2016. Available online: http://repositorio2.unb.br/jspui/handle/10482/22450 (accessed on 20 May 2021).
  29. Oliveira, L.W. Ecologia Populacional e Extrativismo de Frutos de Caryocar Brasiliense Camb. no Cerrado no Norte de Minas Gerais; IBICT: Brasilia, Brazil, 2009. [Google Scholar]
  30. Brown, J.L.; Bennett, J.R.; French, C.M. SDMtoolbox 2.0: The next Generation Python-Based GIS Toolkit for Landscape Genetic, Biogeographic and Species Distribution Model Analyses. PeerJ 2017, 5, e4095. [Google Scholar] [CrossRef] [PubMed]
  31. Zwiener, V.P.; Lira-Noriega, A.; Grady, C.J.; Padial, A.A.; Vitule, J.R.S. Climate Change as a Driver of Biotic Homogenization of Woody Plants in the Atlantic Forest. Glob. Ecol. Biogeogr. 2018, 27, 298–309. [Google Scholar] [CrossRef]
  32. Castro, M.B.; Barbosa, A.C.M.C.; Pompeu, P.V.; Eisenlohr, P.V.; de Assis Pereira, G.; Apgaua, D.M.G.; Pires-Oliveira, J.C.; Barbosa, J.P.R.A.D.; Fontes, M.A.L.; dos Santos, R.M.; et al. Will the Emblematic Southern Conifer Araucaria Angustifolia Survive to Climate Change in Brazil? Biodivers. Conserv. 2020, 29, 591–607. [Google Scholar] [CrossRef]
  33. Leutner, B.; Horning, N. RStoolbox: Ferramentas Para Análise de Dados de Sensoriamento Remoto. Available online: https://cran.r-project.org/web/packages/RStoolbox/index.html (accessed on 15 January 2020).
  34. Borcard, D.; Gillet, F.; Legendre, P. Numerical Ecology with R; Springer: New York, NY, USA, 2011. [Google Scholar] [CrossRef]
  35. Thuiller, W.; Georges, D.; Engler, R.; Breiner, F.; Georges, M.D.; Thuiller, C.W. Package “biomod2”. Available online: https://cran.r-project.org/web/packages/biomod2/biomod2.pdf (accessed on 6 January 2024).
  36. Ripley, B.D. Pattern Recognition and Neural Networks; Cambridge University Press: Cambridge, UK, 2007. [Google Scholar]
  37. De’ath, G.; Fabricius, K.E. Classification and Regression Trees: A Powerful Yet Simple Technique for Ecological Data Analysis. Ecology 2000, 81, 3178. [Google Scholar] [CrossRef]
  38. Hastie, T.; Tibshirani, R.; Buja, A. Flexible Discriminant Analysis by Optimal Scoring. J. Am. Stat. Assoc. 1994, 89, 1255. [Google Scholar] [CrossRef]
  39. Hastie, T.J.; Tibshirani, R.J. Generalized Additive Models; CRC Press: Boca Raton, FL, USA, 1990. [Google Scholar]
  40. Ridgeway, G. The State of Boosting. Comput. Sci. Stat. 1999, 31, 172–181. [Google Scholar]
  41. McCullagh, P.; Nelder, J.A. Generalized Linear Models; CRC Press: Boca Raton, FL, USA, 1989. [Google Scholar]
  42. Friedman, J.H. Multivariate Adaptive Regression Splines. Ann. Stat. 1991, 19, 123–141. [Google Scholar] [CrossRef]
  43. Breiman, L. Random Forests. Mach. Learn. 2001, 45, 5–32. [Google Scholar] [CrossRef]
  44. Thuiller, W.; Georges, D.; Engler, R.; Breiner, F. Package ‘biomod2′: Pacote R Versão 3.3-7.1. Pacote R Versão 3.3-7.1. Available online: http://cran.r-project.org/package=biomod2/ (accessed on 5 January 2020).
  45. José-Silva, L.; dos Santos, R.C.; de Lima, B.M.; Lima, M.; de Oliveira-Júnior, J.F.; Teodoro, P.E.; Eisenlohr, P.V.; da Silva Junior, C.A. Improving the Validation of Ecological Niche Models with Remote Sensing Analysis. Ecol Model. 2018, 380, 22–30. [Google Scholar] [CrossRef]
  46. Giannini, T.C.; Siqueira, M.F.; Acosta, A.L.; Barreto, F.C.C.; Saraiva, A.M.; Alves-dos-santos, I. Desafios Atuais Da Modelagem Preditiva de Distribuição de Espécies. Rodriguésia 2012, 63, 733–749. [Google Scholar] [CrossRef]
  47. Barbet-Massin, M.; Jiguet, F.; Albert, C.H.; Thuiller, W. Selecting Pseudo-Absences for Species Distribution Models: How, Where and How Many? Methods Ecol. Evol. 2012, 3, 327–338. [Google Scholar] [CrossRef]
  48. ARAUJO, M.; NEW, M. Ensemble Forecasting of Species Distributions. Trends Ecol. Evol. 2007, 22, 42–47. [Google Scholar] [CrossRef]
  49. Allouche, O.; Tsoar, A.; Kadmon, R. Assessing the Accuracy of Species Distribution Models: Prevalence, Kappa and the True Skill Statistic (TSS). J. Appl. Ecol. 2006, 43, 1223–1232. [Google Scholar] [CrossRef]
  50. Zhang, L.; Liu, S.; Sun, P.; Wang, T.; Wang, G.; Zhang, X.; Wang, L. Consensus Forecasting of Species Distributions: The Effects of Niche Model Performance and Niche Properties. PLoS ONE 2015, 10, e0120056. [Google Scholar] [CrossRef]
  51. Liu, C.; Berry, P.M.; Dawson, T.P.; Pearson, R.G. Selecting Thresholds of Occurrence in the Prediction of Species Distributions. Ecography 2005, 28, 385–393. [Google Scholar] [CrossRef]
  52. Eisenlohr, P.V. Niche Modelling with Biomod2 Using 70 Environmental Variables Summarized in PCA Axes. Available online: https://github.com/pedroeisenlohr/niche_modelling (accessed on 15 October 2019).
  53. Bem Diverso. Geoportal Bem Diverso: Mapa Estrutural e Funcional Da Paisagem e de Uso Dos Solos Para a Região Do TC Alto Rio Pardo; Brasília. 2017. Available online: https://bemdiverso.maps.arcgis.com/apps/MapSeries/index.html?appid=4378836a7a4b42fb98280f707e70d13a (accessed on 9 January 2022).
  54. Williams, R.J.; Myers, B.A.; Muller, W.J.; Duff, G.A.; Eamus, D. Leaf Phenology of Woody Species in a North Australian Tropical Savanna. Ecology 1997, 78, 2542–2558. [Google Scholar] [CrossRef]
  55. Nabout, J.C.; Magalhães, M.R.; de Amorim Gomes, M.A.; da Cunha, H.F. The Impact of Global Climate Change on the Geographic Distribution and Sustainable Harvest of Hancornia Speciosa Gomes (Apocynaceae) in Brazil. Environ. Manag. 2016, 57, 814–821. [Google Scholar] [CrossRef]
  56. Carvalho, N.M.; Nakagawa, J. Sementes: Ciência, Tecnologia e Produção, 4th ed.; FUNEP: Jaboticabal, Brazil, 2000. [Google Scholar]
  57. Sousa, M.P.; Braga, L.F.; Braga, J.F.; Delachiave, M.E.A. Germinação de Sementes de Plantago Ovata Forsk. (Plantaginaceae): Temperatura e Fotoblastismo. Rev. Árvore 2008, 32, 51–57. [Google Scholar] [CrossRef]
  58. Pirani, F.R.; Sanchez, M.; Pedroni, F. Fenologia de Uma Comunidade Arbórea Em Cerrado Sentido Restrito, Barra Do Garças, MT, Brasil. Acta Bot. Bras. 2009, 23, 1096–1110. [Google Scholar] [CrossRef]
  59. Kubota, Y.; Murata, H.; Kikuzawa, K. Effects of Topographic Heterogeneity on Tree Species Richness and Stand Dynamics in a Subtropical Forest in Okinawa Island, Southern Japan. J. Ecol. 2004, 92, 230–240. [Google Scholar]
  60. Chapin, F.S.; Matson, P.A.; Mooney, H.A. Principles of Terrestrial Ecosystem Ecology; Springer: New York, NY, USA, 2002. [Google Scholar]
  61. Evans, I. An Integrated System of Terrain Analysis and Slope Mapping. Z. Geomorphol. Suppl. 1980, 36, 274–295. [Google Scholar]
Figure 1. Location of the Alto Rio Pardo Territory, in the far north of the State of Minas Gerais, Brazil.
Sustainability 16 03653 g001
Figure 2. Schematic model of the classification and vectorization process of geomorphological units. The method was used to select variables to compose the database used in the species distribution models (MDS) of agro-extractivist interest in the Geraizeiras communities of the Alto Rio Pardo Territory in Minas Gerais.
Sustainability 16 03653 g002
Figure 3. Ensemble map of occurrence suitability by species of agro-extractivist interest for the Geraizeiras communities of the Alto Rio Pardo Territory (ARP) in Minas Gerais. Where: High indicates the maximum occurrence suitability values; Low indicates the minimum occurrence adequacy values; Unsuitable indicates unsuitable locations for occurrence. ROC threshold (Annona crassiflora = 44.5013; Caryocar brasiliense = 39.7287; Eugenia dysenterica = 44.9449; Hancornia speciosa = 46.7469; Tachigali subvelutina = 39.8240).
Sustainability 16 03653 g003
Figure 4. Land cover map, geomorphological [53], and Landsat Image 8, RGB/564, for August 2021, of the Alto Rio Pardo Territory. They indicate in red tones the savanna formations, while in shades of green, the deciduous formations of the Caatinga, associated with geomorphological units.
Sustainability 16 03653 g004
Figure 5. Ensemble map of occurrence suitability by target species, representing data processing for variables with 30 m and 1 km of spatial resolution. The areas in shades of black represent regions not suitable for occurrence according to data processing with a spatial resolution of 1 km, also plotted for models with 30 m spatial resolution for comparative purposes.
Sustainability 16 03653 g005
Table 1. Variables with the high predictive capacity of the species occurrence suitability zones, with their respective variance inflation values (VIF), tested in the adjustment of species distribution models (MDS) of agro-extractivist interest for the Geraizeiras communities in the Alto Rio Pardo Territory (ARP), in Minas Gerais.
SpeciesEnvironmental VariablesVIF
Annona crassiflorabio1—annual average temperature1.10
bio3—isothermality1.25
bio12—annual precipitation1.21
Aspect—direction of slopes1.01
Slope—slope in degrees1.17
Caryocar brasiliensebio1—annual average temperature1.10
bio4—temperature seasonality1.57
bio12—annual precipitation1.45
Aspect—direction of slopes1.03
Slope—slope in degrees1.04
Eugenia dysentericabio4—temperature seasonality1.43
bio9—average temperature of the driest quarter1.39
bio12—annual precipitation1.24
Slope—slope in degrees1.01
Hancornia speciosabio4—temperature seasonality1.43
bio9—average temperature of the driest quarter1.10
bio12—annual precipitation1.26
Aspect—direction of slopes1.07
Tachigali subvelutinabio3—isothermality2.18
bio9—average temperature of the driest quarter2.06
bio16—precipitation in the wettest quarter1.11
Aspect—direction of slopes1.12
Slope—slope in degrees1.04
Disclaimer/Publisher’s Note: The statements, opinions and data contained in all publications are solely those of the individual author(s) and contributor(s) and not of MDPI and/or the editor(s). MDPI and/or the editor(s) disclaim responsibility for any injury to people or property resulting from any ideas, methods, instructions or products referred to in the content.

