1. Introduction
Notably, river behaviors are undergoing important shifts, marked by an increase in extreme event frequency and magnitude, possibly exacerbated by global warming, manifested through increased air and ocean temperatures, rising tides, glacier melting, and altered precipitation patterns [
1]—together with rapid and uncontrolled urban expansion—leading to soil impermeabilization and increased expose value, which exacerbates flood risk [
2].
During the last decades, the coast of south–central Chile (36°–38° S) has witnessed intricate and unforeseen landscape transformations, mainly driven by urban and industrial expansion, alterations in landscape connectivity, and elimination of native forest [
3,
4,
5], as well as by pseudo-natural events such as forest fires, river floods, and mass movements [
6]. Since 1953, Chile has implemented changes in the Building and Urbanization Law to address rapid demographic growth, emphasizing a systemic and coordinated approach from the regional to city scale. However, during Pinochet’s dictatorship in 1979, a deregulation process began, with them arguing that land scarcity resulted from excessive regulation. Over the following thirty years, accompanying the removal of urban growth boundaries, Chile witnessed a substantial urban expansion; this factor, together with the intensive exploitation of river basins (forestry, mining, agriculture, and cattle rising) and a widespread attempt to control river dynamics via engineering river training works, led to an increased susceptibility to flooding or riverbank instability, erosion and even landslides in virtually all urban settlements. The decline in environmental quality is thought to be linked to the absence of institutions and specific regulations governing urban growth [
7].
Monitoring and assessing river morphology changes is crucial for effective management and minimization of impacts [
8]. Understanding past alterations helps assess current conditions and anticipate future changes [
9]. Features like the Sinuosity Index (SI), channel width (W), and flow length (L) quantify changes in a river [
10,
11]. The River Styles framework [
12] allows us to assesses the character and behavior of rivers throughout the basin, supplying very useful information for sustainable management. Comprehensive assessment of river morphological change analysis based on local surveys is, however, costly, and time-consuming; in this sense, advanced techniques, like remote sensing, offer an efficient support for this task. Nardini et al. [
13] and Yépez et al. [
14] recently developed a semi-automated framework and process to conduct a River Styles analysis, systematizing the role of subjective expert judgments. This process is highly supported by a new plugin being developed in QGIS called as South Rivers Toolbox (SRT). This SRT plugin has been used in several studies in Chile and Colombia to geomorphically classify and characterize the rivers in order to understand their evolution [
15,
16,
17,
18].
This paper shows the results of the application of QGIS tools, developed in-house, to implement a geomorphic analysis in the Andalién River, including a multi-temporal analysis. A section of 11 km, with an average width of 50 m, is selected as a case study. In this context, our specific objectives are (i) to geomorphologically characterize the Andalién River using the SRT plugin and taking advantage of GIS and Remote Sensing techniques; (ii) to assess its evolution between 1945 and 2020, including lateral channel migration rates by adopting a new QGIS tool; and (iii) to explore the impact of urban expansion within the Andalién river floodplain. Our analysis is intended to support decision-making by the institutions responsible for river management, while the methodology can be replicated to study other rivers around the world.
2. Materials and Methods
2.1. Study Area
This study centers on the Andalién River, located in central–southern Chile, is a coastal fluvial system draining into the Pacific Ocean, with a watershed size of 775 km
2 and running through Concepción (
Figure 1A–C), a city in the central region of Chile (30°–45° S) [
5]. The region experiences a Mediterranean climate, featuring a rainy winter season and a drier, warmer summer.
The catchment follows a pluvial regime, with peak discharges in winter, often exceeding 100 mm/24 h. Concepción, the third-largest urban center in Chile, is home to approximately 1,000,000 people in its metropolitan area. Between 1960 and 2010, 21 flood events were recorded, with the 2006 disaster causing a regional cost of
$6.5 million USD, affecting both periphery and consolidated urban zones [
4,
5].
The Andalién River has experienced a 700% increase in urban land from 1955 to 2007, significantly reducing its rainwater storage capacity [
19]. Presently, the Andalién River watershed holds 12,000 people at risk of natural hazards [
20]. Between 1960 and 2010, the watershed witnessed twenty-one flooding events, occurring with a recurrence interval of 2.43 years [
5]. The Andalién river basin, concentrating 90% of its population in the lower zone, near the river mouth, experienced major damage due to flooding in particular during the extreme rainfall event of 2006. Over 68 years, Rojas et al. [
5] observed a 1457 ha increase in the Andalién River’s built-up area. Hazard analysis showed a 286% increase in flood-prone areas, with extreme events potentially affecting over 10,000 homes and about 40,000 people, including the elderly and disabled. Link et al. [
21] innovatively assessed flood risk in Concepción (Chile), recommending conservation measures and restricting urban expansion. While some efforts were dedicated to assessing the pressure of urban expansion in the city of Concepción on the Andalién River floodplain, none delved into the changes in the river’s planform and the processes occurring along the entire river continuum.
The Andalién River begins at the confluence of the Poñén and Curapalihue estuaries and flows into the Pacific Ocean, where the Rocuant wetland is located [
20]. With an approximate length of 35 km, it receives contributions from the Nonguén, Palomares, Queule, and Chaimávida streams. Its river basin exhibits a clearly pluvial pattern, as revealed by the seasonal variation curve depicted in
Figure 1B,D. Owing to its low elevation and geographical placement, the basin does not experience snow-covered areas. This results in maximum discharge during the months of highest precipitation, while minimum discharge are observed in the summer months, characterized by low precipitation due to the regional climate (
Figure 1C). It should be noted that the discharge associated with a 50% exceedance probability has shifted from July to August, due to the climatic variability in the region [
22]. Precipitation peaks during the austral winter (June–August), resulting in a prolonged dry season characterized by high solar radiation, low humidity, and high temperatures from September to April. In addition, precipitation increases with altitude due to the orographic effects of the Coastal Mountain Range.
Figure 1D shows the mean monthly precipitation for the Andalién River watershed derived from CAMELS-CL data [
23]. The catchment has an average annual precipitation of approximately 1060 mm, with monthly peaks exceeding 200 mm in June. On the other hand, during the summer months (December–February), monthly precipitation remains below 50 mm. In terms of temperature, the Andalién watershed records an average of about 20 °C in summer and minimum values close to 10 °C in winter. No damming or withdrawals have been implemented, but important hydraulic interventions have been carried out on its active channel, such as the 2015 channelization project of the Directorate of Hydraulic Works in the lower section, to mitigate flooding effects.
2.2. Input Data and Pre-Processing
Three types of input data were used: temporary satellite images, six historical aerial photogrammetric flights and three DEMs (LIDAR, TanDEM-x and AlosWorld3D) covering the entire study area (
Figure 2).
Satellite images allow the delineation of the active channel and identification of geomorphological units in the study area. To ensure accurate results, it is essential to acquire satellite images captured during different periods of the hydrological cycle—specifically, on days of both high and low flow within the same hydrological year. For this study, we utilized PlanetScope constellation images (
https://www.planet.com/account/#/—accessed on 14 December 2023) with a 3 m spatial resolution. Additionally, high-resolution ESRI platform images (OpenLayers Plugin—QGIS) from the same hydrological year were employed, given the extensive presence of tall vegetation upstream of the Andalién River and the necessity for images with superior spatial resolution for enhanced digitization of elements.
2.2.1. Radiometric/Atmospheric Correction of Satellite Imagery
The downloaded satellite images underwent correction using the ENVI 5.6-IDL software. This process began with atmospheric correction of the radiance data, i.e., the digital data were calibrated to reflectance data using the Radiometric Calibration tool. Subsequently, the images were merged using the Seamless Mosaic tool in ENVI 5.6-IDL software to create a consolidated image mosaic of the study area. To ensure data integrity, the mosaic image was examined for reflectance values exceeding 1, and if identified, normalization was executed using the Band Math tool. After correcting the satellite image, a new raster layer is generated using the Normalized Difference Water Index (
NDWI), calculated with the Band Math tool utilizing Equation (1):
In this context,
B1 represents the near-infrared band (NIR), and
B2 represents the green band. The
NDWI value ranges from −1 to +1, where [
24] used a thresholding of 0, indicating
NDWI > 0 corresponds to water, and it is non-water if
NDWI ≤ 0. Values greater than zero were converted into to vector format and saved as a shapefile for subsequent editing and debugging within a GIS platform (
Figure 2). It is crucial to emphasize that the analysis involving the
NDWI index specifically focuses on PlanetScope images. Additionally, manual editing is consistently applied during the extraction process of the water mask and other elements within the fluvial continuum.
2.2.2. Historic Aerial Photogrammetry
For the multitemporal analysis of the Andalién River’s behavior, six aerial photogrammetric flights from the years 1945, 1955, 1961, 1978, 1992, and 1998 were utilized. These images were georeferenced using the ArcGIS Geographic Information System and a base satellite image of 2020. To validate the alignment correction of the geo-referenced image, Ground Control Points (GCPs) were strategically placed in a clockwise direction and calibrated based on the root-mean-square error (RMSE) value. This involved utilizing more than 10 GCPs, ensuring that the RMSE converges to zero and does not surpass 1.5 times the nominal pixel value.
2.2.3. Disaggregation and Aggregation Methodology
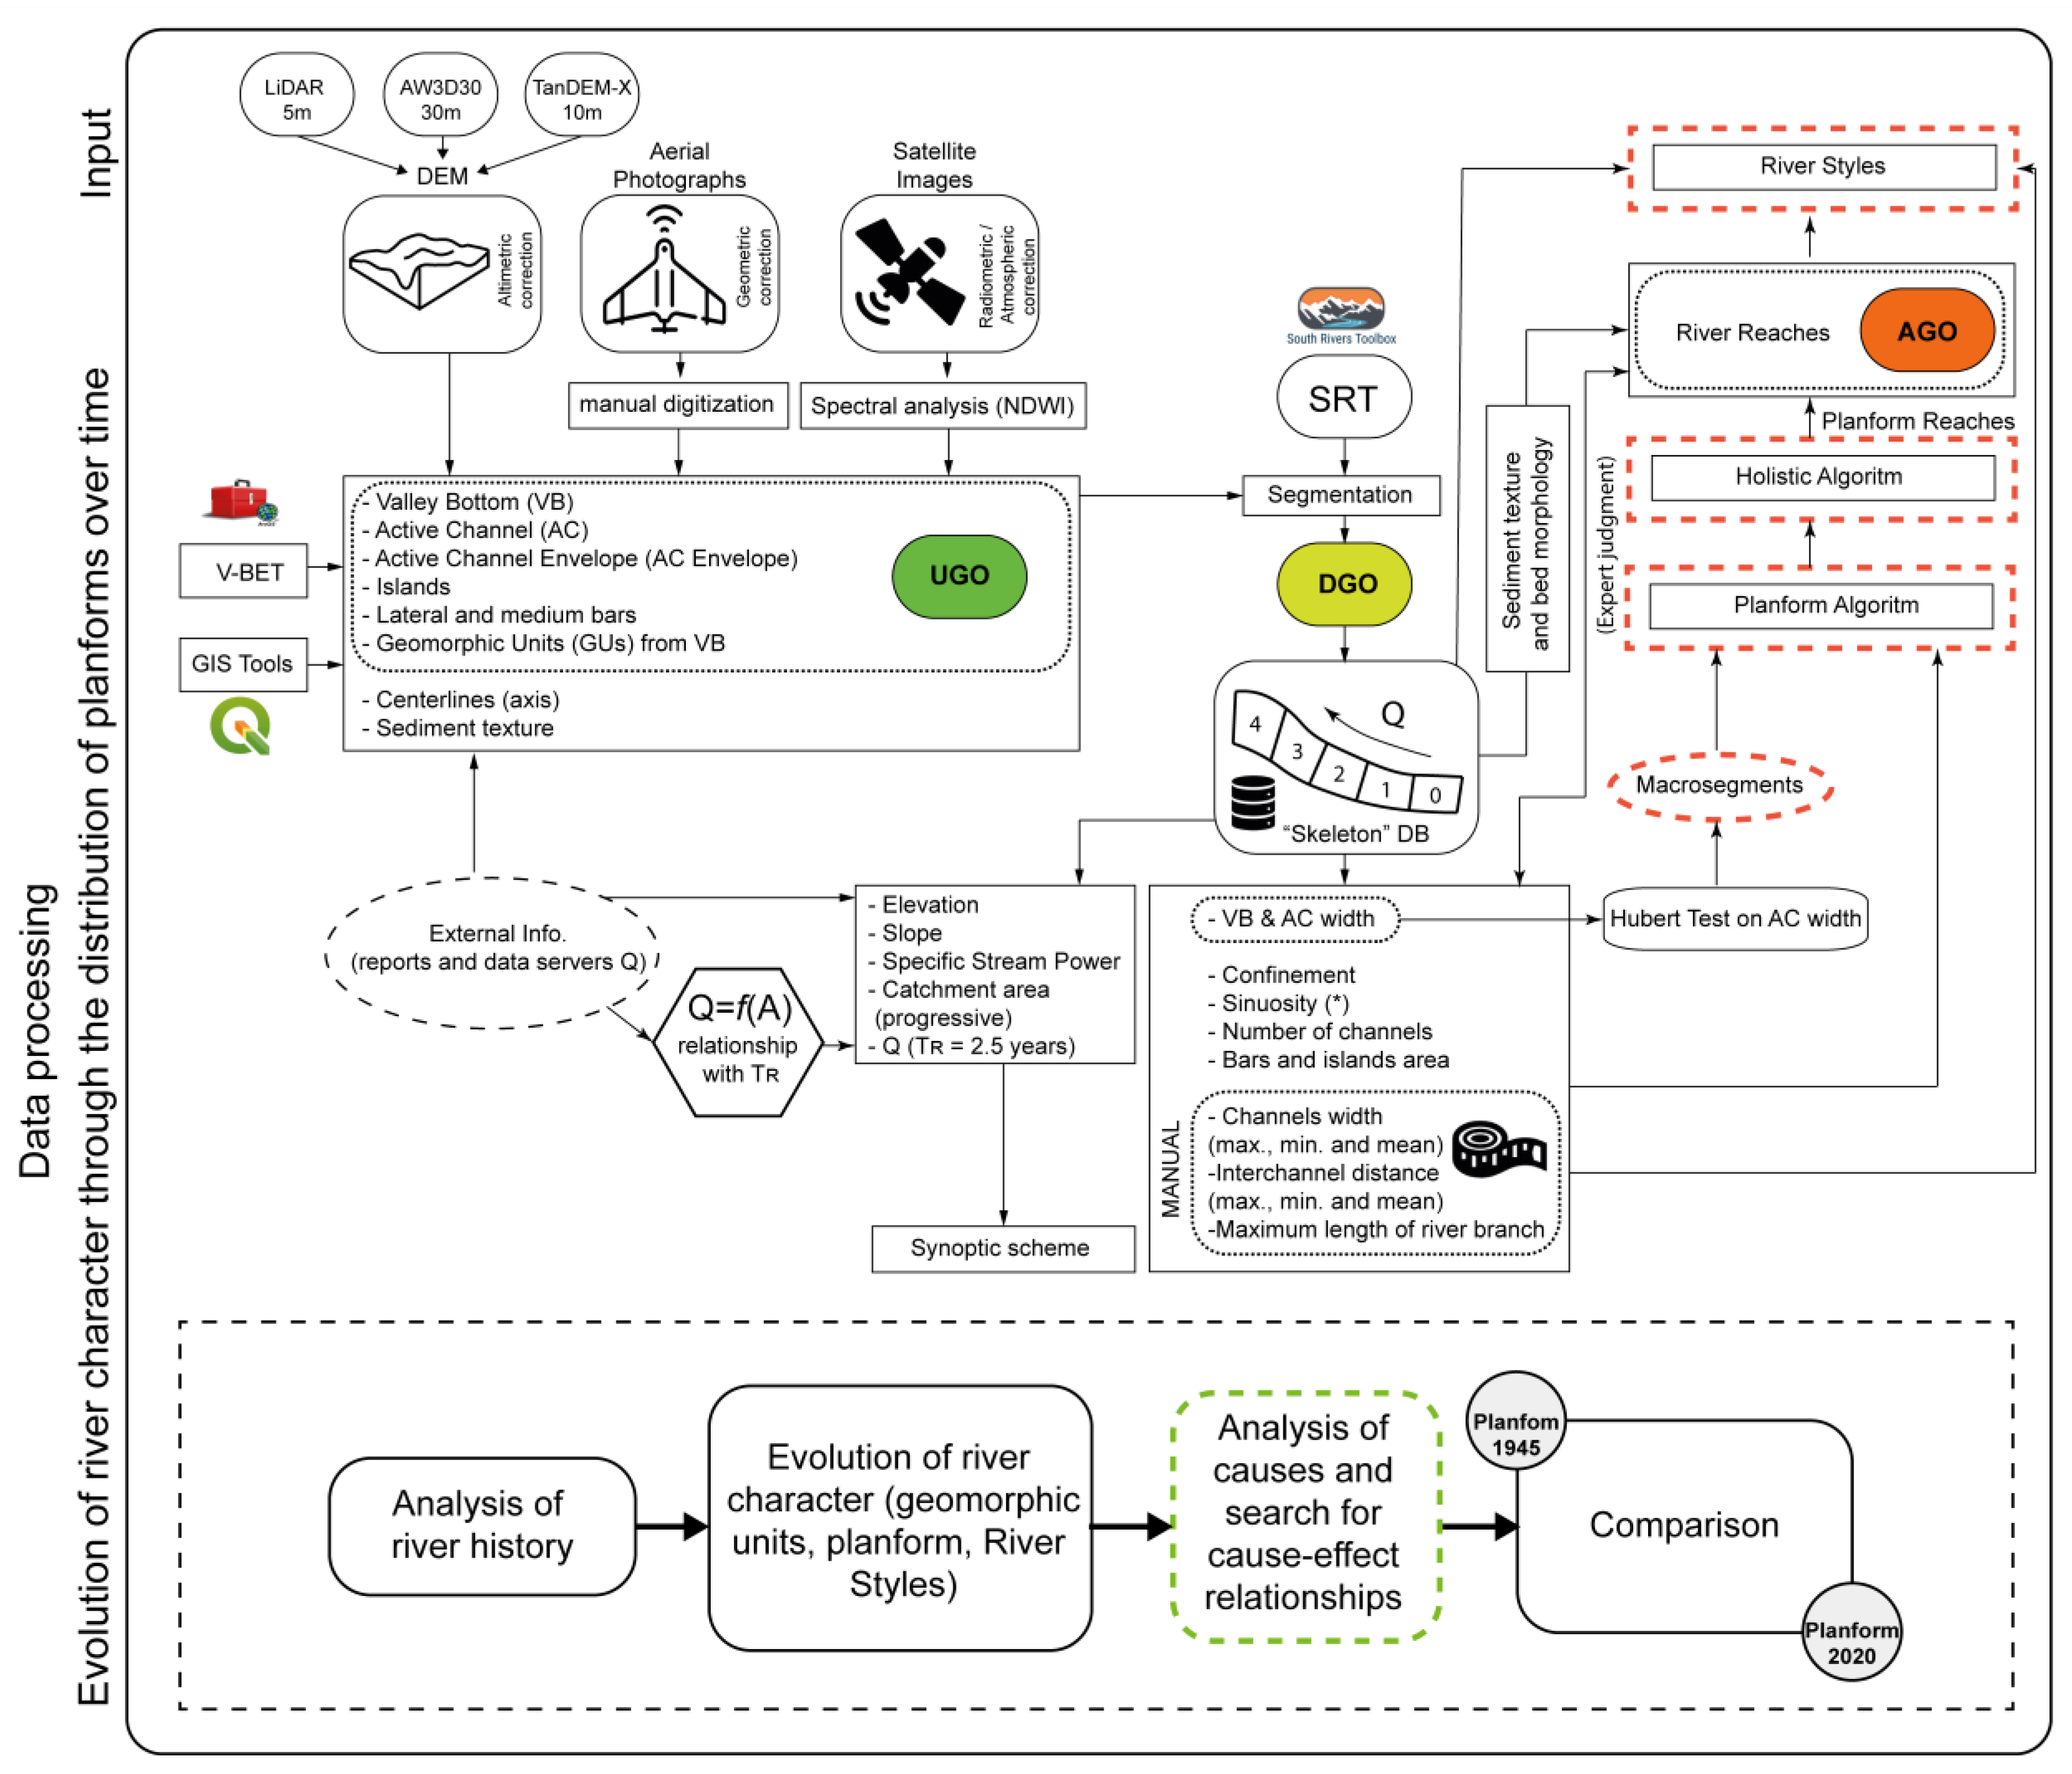
The process we referred to in order to carry out a geomorphological characterization and analysis of a generic river is illustrated in
Figure 2. It adopts the approach of disaggregation and aggregation of geographical objects, inspired by the work of Alber and Piégay [
25]. This consists of extracting the geomorphological characteristics of a watershed by first disaggregating Unit Geographic Objects (UGO) (the valley bottom, the active channel, its envelope, and their axis, as well as the geomorphic units) obtained from temporal satellite images and DEM and then aggregating the obtained data (DGO: Disaggregated Geographical Objects) according to other criteria, particularly for each river reach, thereby obtaining new Aggregated Geographic Objects (AGUs; for instance, a reach with a uniform width). The Centerline for Active Channel and Valley Bottom (Floodplain) was obtained following the methodology explained by [
14].
This methodology was implemented using the South Rivers Toolbox (SRT) within the QGIS platform (
https://vosores.github.io/SouthRiversToolbox/web/plugins.xml—accessed on 5 July 2023). SRT is an add-on we developed within the framework of an Innova Chile-CORFO project (19BP-117424) for Public Goods for Adaptation to Climate Change, which incorporates some of its own tools and others taken from the Fluvial Corridor Toolbox in QGIS 3.20 [
26]. It is utilized to semi-automatically extract metrics and key characteristics in a river system [
14].
In this application to the Andalién River, we simplified the scheme of
Figure 2 in particular by achieving just the synoptic description and the identification of the reaches, without going into the full River Styles identification and by identifying planform types through expert judgment (rather than through the automatic planform recognition algorithm), given the shortness of the studied stretch.
The active channel comprises the connected low water channels, including side and mid-channel bars (vegetated or not), but excluding islands if present; the active channel envelope is the set of low water channels plus bars. Satellite imagery during high and low water periods was used to extract bars, islands, active channel. To obtain the active channel envelope, first, it was delineated for the high-water period by manual digitizing with GIS tools or semi-automatically; the land emerging within the active channel envelope is classified as islands, while that emerging in low water, once excluded the islands, is considered as bars. Many other GU can be identified within the channel as well as within the floodplain (like natural levees, ridges, paleochannels, and wetlands), but we did not consider them here as we did not go into the full River Styles characterization.
The floodplain is one of the most important fluvial geographical features of a watershed as it delineates areas of maximum flooding during high-water periods and/or zones of possible river migration or avulsion. Lower slopes in the river’s vicinity result in a larger floodplain polygon. Floodplain delineation can be performed with different methods and tools. For this study, the ArcGIS V-BET add-on developed by Gilbert et al. [
27] was used. A floodable area was delineated using HEC-RAS 4.0 software [
28] in the lower part of the river, which served as a guide for accurate delineation and validation using aerial imagery of the 2006 extreme precipitation event (this model was created with a 20-year return period). The delineation and validation was particularly crucial in the Collao area, where the study conducted by Rojas et al. [
29] served as a reference, delimiting the affected area for the 2006 event. The effective floodplain was then obtained from the topographic floodplain, by trimming the parts protected by artificial infrastructures like roads and railways or defense works (dykes, levees) that indeed limit flooding and migration.
Disaggregated geographic objects are the result of the segmentation of a unitary geographic object, which is performed every certain length, depending on the length and width of the river. The disaggregation was performed both on the floodplain (an UGO element) and on the active channel envelope. The floodplain and the active channel envelope was divided (discretized) into equal-length sections along its respective centerline. This process was executed using the Segmentation tool in SRT, requiring the polygon, its centerline, and the selected step size in its input. The outcome is the segmented UGO, comprising all DGOs organized in the attribute table, displaying their respective identifiers along with cumulative distances, arranged from downstream to upstream or vice versa. This structure, once filled with the values of the metrics described below, constituted what we call the “skeleton” of the river, i.e., a specific geographic database along the river(s).
2.2.4. Metrics
The metrics calculated for characterization along the river are described in
Table 1.
2.3. A Proposal for Time Evolution Using the New QGIS SRT Tool
Lateral migration rates (annual average) were determined by analyzing the centerlines of two active channels. In this study, we calculated migration rates during distinct periods: 1945–1955, 1955–1978, 1978–1992, 1992–2009, and 2009–2020. Refer to
Figure 3 for a detailed description of the steps involved in calculating migration rates along the active channel’s centerlines across various dates.
Prior to analysis, active channel envelopes were obtained from satellite images by spectral analysis and the NDWI spectral index. Permanent water and geomorphic units were manually cleaned. The active channel envelope on aerial photographs was manually digitized in its entirety based on expert judgment. To maintain consistency, the historical image time series were co-registered with stable elements from 1945 to 2020, removing differences due to scene projections.
Step 1 involves projecting the centerlines of Time 1 and Time 2 onto a plane. It is crucial that both lines share identical start and end points, requiring adjustments such as cutting lines or the entire time series to equalize distances. This guarantees that the sections under evaluation maintain a consistent linear distance.
In Step 2, we merged the Time 1 and Time 2 centerlines into a single .shp file using the QGIS “merge” tool. We edited the file to close the lines at both ends, then “polygonized” it to create a polygonal topology representing the total river displacement areas for the two dates. Enter an attribute table field for the “orientation” of the displacement, assigning 1 for displacement to the right and −1 for displacement to the left with respect to the centerline of Time 1.
In step 3, a new centerline through the center of the change polygons was essential. However,
Figure 3 reveals occasional intersections of polygons resulting in a complete cancellation. To overcome this problem, a 2 m buffer was created, forming nearly identical polygons, and allowing the construction of a continuous, seamless centerline.
In Step 4, a new centerline was crafted for the change polygons derived from the buffer. Initially, the “buffer” polygon underwent conversion into a new line file. Editing this new line vector involved trimming the ends to yield two continuous, parallel lines. Subsequently, the “Locate Point Along Lines” tool segmented both lines using equidistant points spaced at 20 m intervals with a 0.20 offset. The “Voronoi Polygons” tool then generated polygons from these points, shaping the centerline. Following a debugging process for this central line, the “Line Smooth” tool was employed to enhance the line, resulting in a more accurate and refined outcome. Note the importance of sequencing the centerline. If not already sequenced, we employed the sequence tool in the Fluvial Corridor Toolbox in ArcMap for the next step. Refer to Albert and Piegay [
25] for detailed instructions.
Finally, in Step 5, we utilized the centerline obtained in the previous step on the change polygons from Step 2. To calculate the annual average lateral migration rate, we began by segmenting the change polygons with the Segmentation tool in the SRT 1.0.2 program. Then, we employed the Width Valley Bottom tool in the SRT program to determine the average width within each DGO segment in the change polygons. We displayed the attribute table, created a new field linked to the annual lateral migration rate, and used the “Field Calculator” tool. We divided the width value for each DGO by the difference in years between the two centerlines (T1 vs. T2) and multiplied the result by the orientation field. After this process, we used the “Graphics” tool in the SRT program to generate a continuous graph illustrating channel displacements for the two dates. Alternatively, we exported the data to an Excel sheet for users to create their customized graphs as needed.
3. Results and Discussion
3.1. Morphological Characterization of the Andalién River Basin (Year 2020)
Figure 4 presents key metrics derived from the Andalién River, spanning from its upstream to downstream sections. In
Figure 4A, variations in both catchment area and elevation are depicted.
Figure 4B illustrates the floodplain (Valley Bottom) width along the Andalién River, revealing an increasing trend towards the river mouth. This widening is closely associated with the slope (depicted in
Figure 4D) and the specific stream power (shown in
Figure 4E). Notably, the river’s slope is nearly negligible in the lower and mouth sections, in contrast to the upper portion where steeper slopes prevail. This disparity correlates with the specific stream power values, which were higher in the confined upper region, as evidenced in
Figure 4B.
Consequently, this suggests that the upper stretch (across the range from kilometer 0 to kilometer 13) of the river possesses a greater potential for specific sediment entrainment. Subsequently, in the intermediate zone, there is a reduction in the specific stream power to moderate levels. This decrease implies a decrease in sediment transport capacity, which leads to sediment deposition. Simultaneously, the floodplain widens, signaling the beginning of river deconfinement. Finally, in the lower section that hosts the Rocuant–Andalién wetland, the slopes approach zero and the specific stream power decreases significantly. Consequently, sediment deposition from upstream intensifies, leading to the maximum expansion of the floodplain. This culmination causes the deconfinement of the Andalién River (
Figure 4E).
3.2. Morphological Changes in the Active Channel Envelope between 1945 and 2020
The comparative analysis between 1945 and 2020 was conducted using historical aerial photos, focusing on the middle and lower portions of the Andalién River basin. The study area, depicted in
Figure 1A, spans approximately 11 km. This specific section, highlighted for its characteristic features, is primarily unconfined and situated in close proximity to the urban expansion of Concepción city, as illustrated in
Figure 4E. The study delves into morphological changes in the Andalién River, examining four key parameters: (i) the planform type, (ii) macro-sinuosity index, (iii) surface of Geomorphic Units (GUs), and (iv) variations in the width of the active channel envelope.
3.2.1. Planform Type
While the South Rivers Toolbox workflow demonstrates the feasibility of semi-automated planform typology characterization, minimizing the reliance on expert judgment (
Figure 2), our study section necessitated a preference for planform typology identification based on expert criteria. To achieve this, we initially examined the distribution of the primary geomorphic units along the active channel envelope for two change scenarios. The first assessment involved a mosaic of aerial photographs from 1945, and the second utilized a mosaic of Planet Scope images from 2020.
Figure 5 illustrates the key outcomes of the comparative analysis. Notably, in 1945, four Planform types were identified (according the planform archetypes proposed by [
15]), with the primary ones being Multiple Island Braided, Single Straight, Transitional Swallowing, and Single Sinuous. Conversely, in 2020, only three classes were observed: Multiple Anabranching, Transitional Wandering, and Single Straight. Furthermore, there was a noticeable decrease in the floodplain area in 2020. A comparative analysis indicates that prior to the commencement of river channelization efforts in October 2012, the floodplain was substantially more extensive. The observed variance of approximately 631 hectares translated to a 33% of reduction in the floodplain area for this specific study section.
When quantifying the distribution of each planform typology in the comparison spanning 1945 to 2020, the estimated percentages for 1945 were as follows: Multiple Island Braided (52%), Single Sinuous (11%), Single Straight (18%), and Transitional Swallowing (19%). In contrast, the analysis for the year 2020 revealed the following percentages: Multiple Anabranching (17%), Transitional Wandering (73%), and Single Straight (10%). A detailed examination of the changes highlights a decrease in the prevalence of multi-channel planform types, dropping from 52% to 17%. Conversely, transitional planform types exhibited the opposite trend, increasing from 19% to 73%. Additionally, single-channel planform types also witnessed a reduction, declining from 29% to 10% (
Figure 5).
3.2.2. Macrosinuosity Index
To calculate macrosinuosity index, it is essential to have homogeneous reaches for each river section. Following the methodology described in
Section 2.2.4, these reaches were calculated by interpolating planform types with sediment texture changes. This interpolation, according to our approach, produced reach-scale sections on which we could calculate what we call macrosinuosity. In other words, the sinuosity index was calculated by dividing the central axis of the defined section by the linear distance joining the separation points of that section (
Figure 6). Results from our comparative study spanning 1945 to 2020 revealed the following key findings. In 1945, nine reaches were identified and classified, while in 2020, seven reaches underwent classification. To determine macrosinuosity, we integrated a form of “Constrained Sinuosity”, which involves assessing the position of the active channel envelope axis concerning the Valley Bottom or floodplain, following the methodology proposed by Brierly and Fryirs [
12].
In 1945, the sinuosity characteristics of various river reaches were as follows: Reach S1 displayed a straight sinuosity (1.04), while Reaches S2 and S3 were classified as having constrained sinuosity. Reach S4 exhibited a straight sinuosity (1.03) and Reach S5 featured a low sinuosity (1.19). Following this, Reach S6 reverted to a straight sinuosity (1.05), and Reaches S7 and S8 were characterized by a low sinuosity, with values ranging from 1.05 to 1.19. Notably, Reach S9 stood out as the only section classified as sinuous (1.38). In the context of the year 2020, commencing with Reaches S1 and S2 near the river’s mouth, they demonstrated a straight sinuosity, varying from 1.01 to 1.04. Reaches S3 and S4 were classified as having constrained sinuosity. Following this, Reach S5 reverted to a straight sinuosity (1.01), succeeded by Reach S6, characterized by constrained sinuosity. Ultimately, Reach S7 presented a low sinuosity (1.05) (
Figure 6).
In terms of quantifying the sinuosity across the fluvial continuum, the percentage distribution revealed noteworthy trends. The prevalence of straight sinuous reaches remained consistently similar, ranging from 32% to 35%. However, there was an increase in the occurrence of constrained sinuosity, varying from 39% to 62%. This increase seemed to be mainly attributed to the reduction in floodplain area. Conversely, the percentage of low sinuosity reaches experienced a decline from 21% to 3%. It is crucial to highlight that only one reach in 1945 was classified as sinuous, constituting 8% of the total.
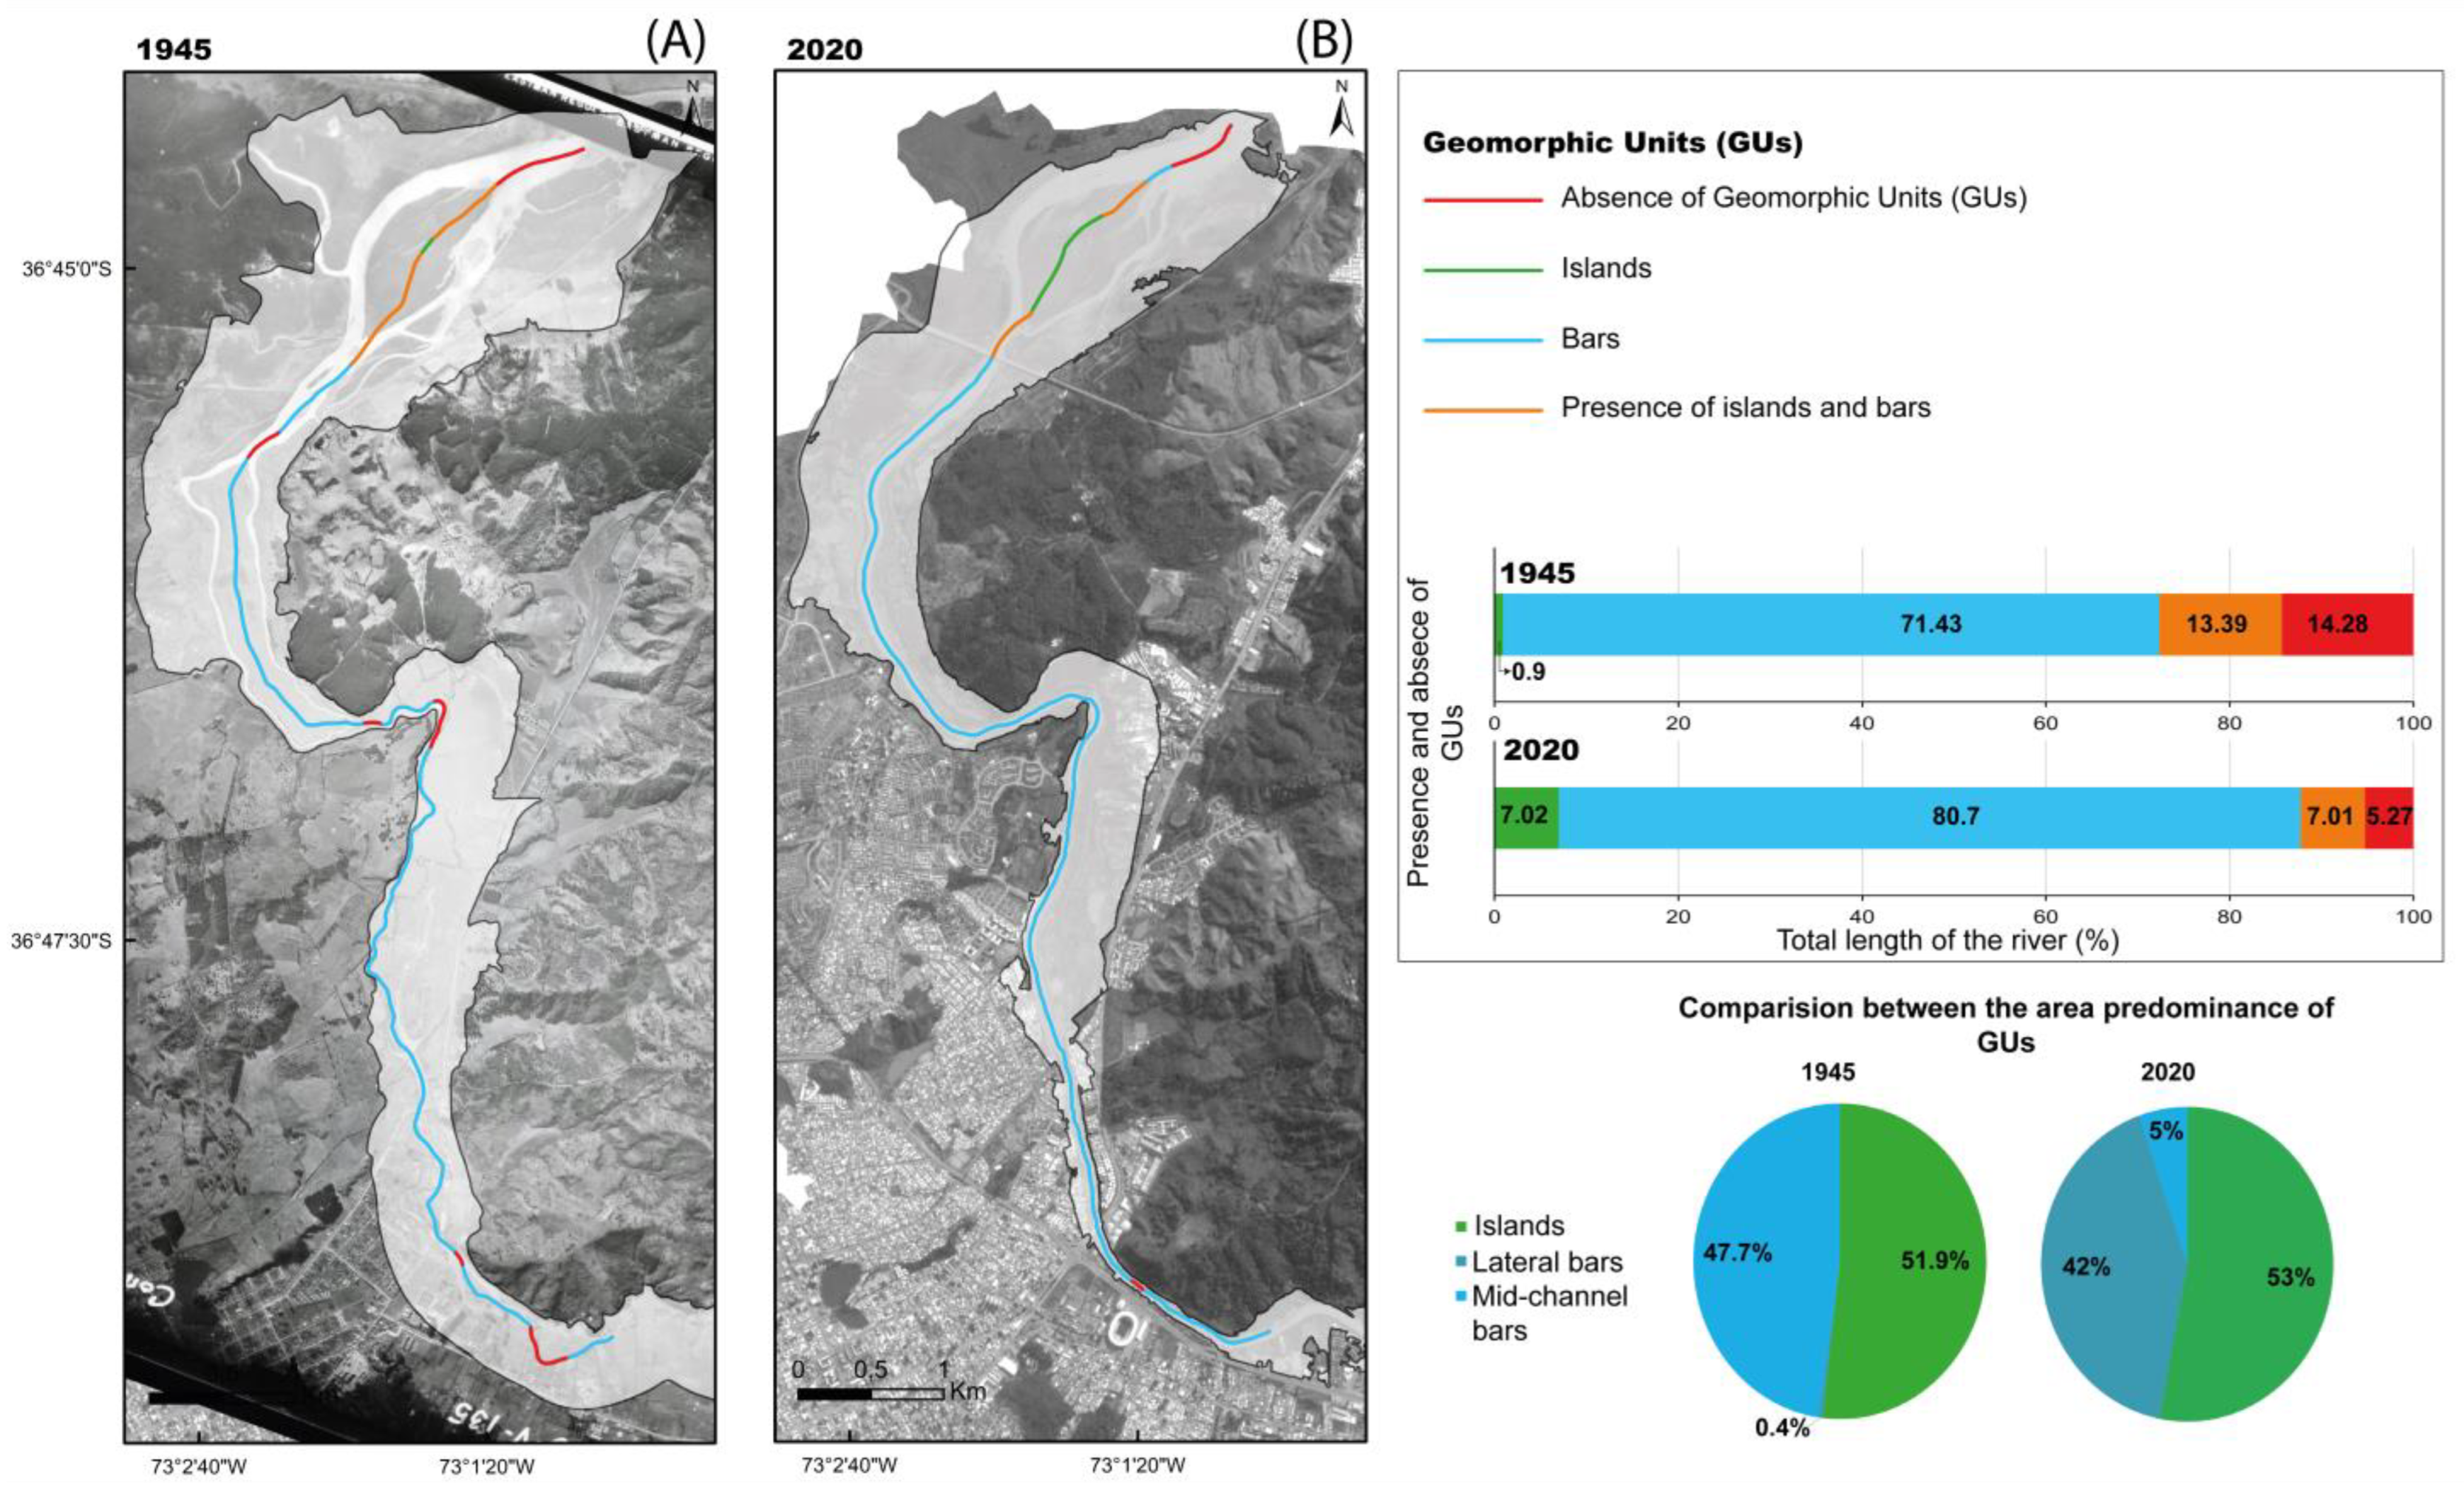
3.2.3. Geomorphic Units
Figure 7 illustrates the great expansion and growth of the city of Concepción for almost 75 years, aggressively invading the Andalién River floodplain. These human-induced modifications have markedly disrupted the river’s self-regulation, leading to heightened sedimentation in certain regions and reshaping the riverbeds and geomorphic units throughout its continuum.
The distribution of geomorphic units along the active channel for the year 1945 is outlined as follows: 14.3% of sectors exhibited an absence of geomorphic units; 0.9% showed the sole presence of islands, and 71.4% indicated the presence of bars, encompassing both lateral and middle bars. Additionally, 13.4% of sectors exhibited the simultaneous presence of islands and bars. In the 2020 scenario, the percentages were reported along the section as follows: 5.3% of sectors lacked geomorphic units; 7% featured only islands; bars, including sidebars and middle bars, accounting for 80.7%, and the joint presence of islands and bars was reported at 7% (
Figure 7). Overall, when assessing the percentage changes in surface area of geomorphic units from 1945 to 2020, notable trends emerged. The area occupied by islands declined substantially from 48% to a mere 5%, contrasting with an increase in lateral bars, surging from 0.4% to nearly 42%. Simultaneously, median bars experienced a decline from 48% to 5%.
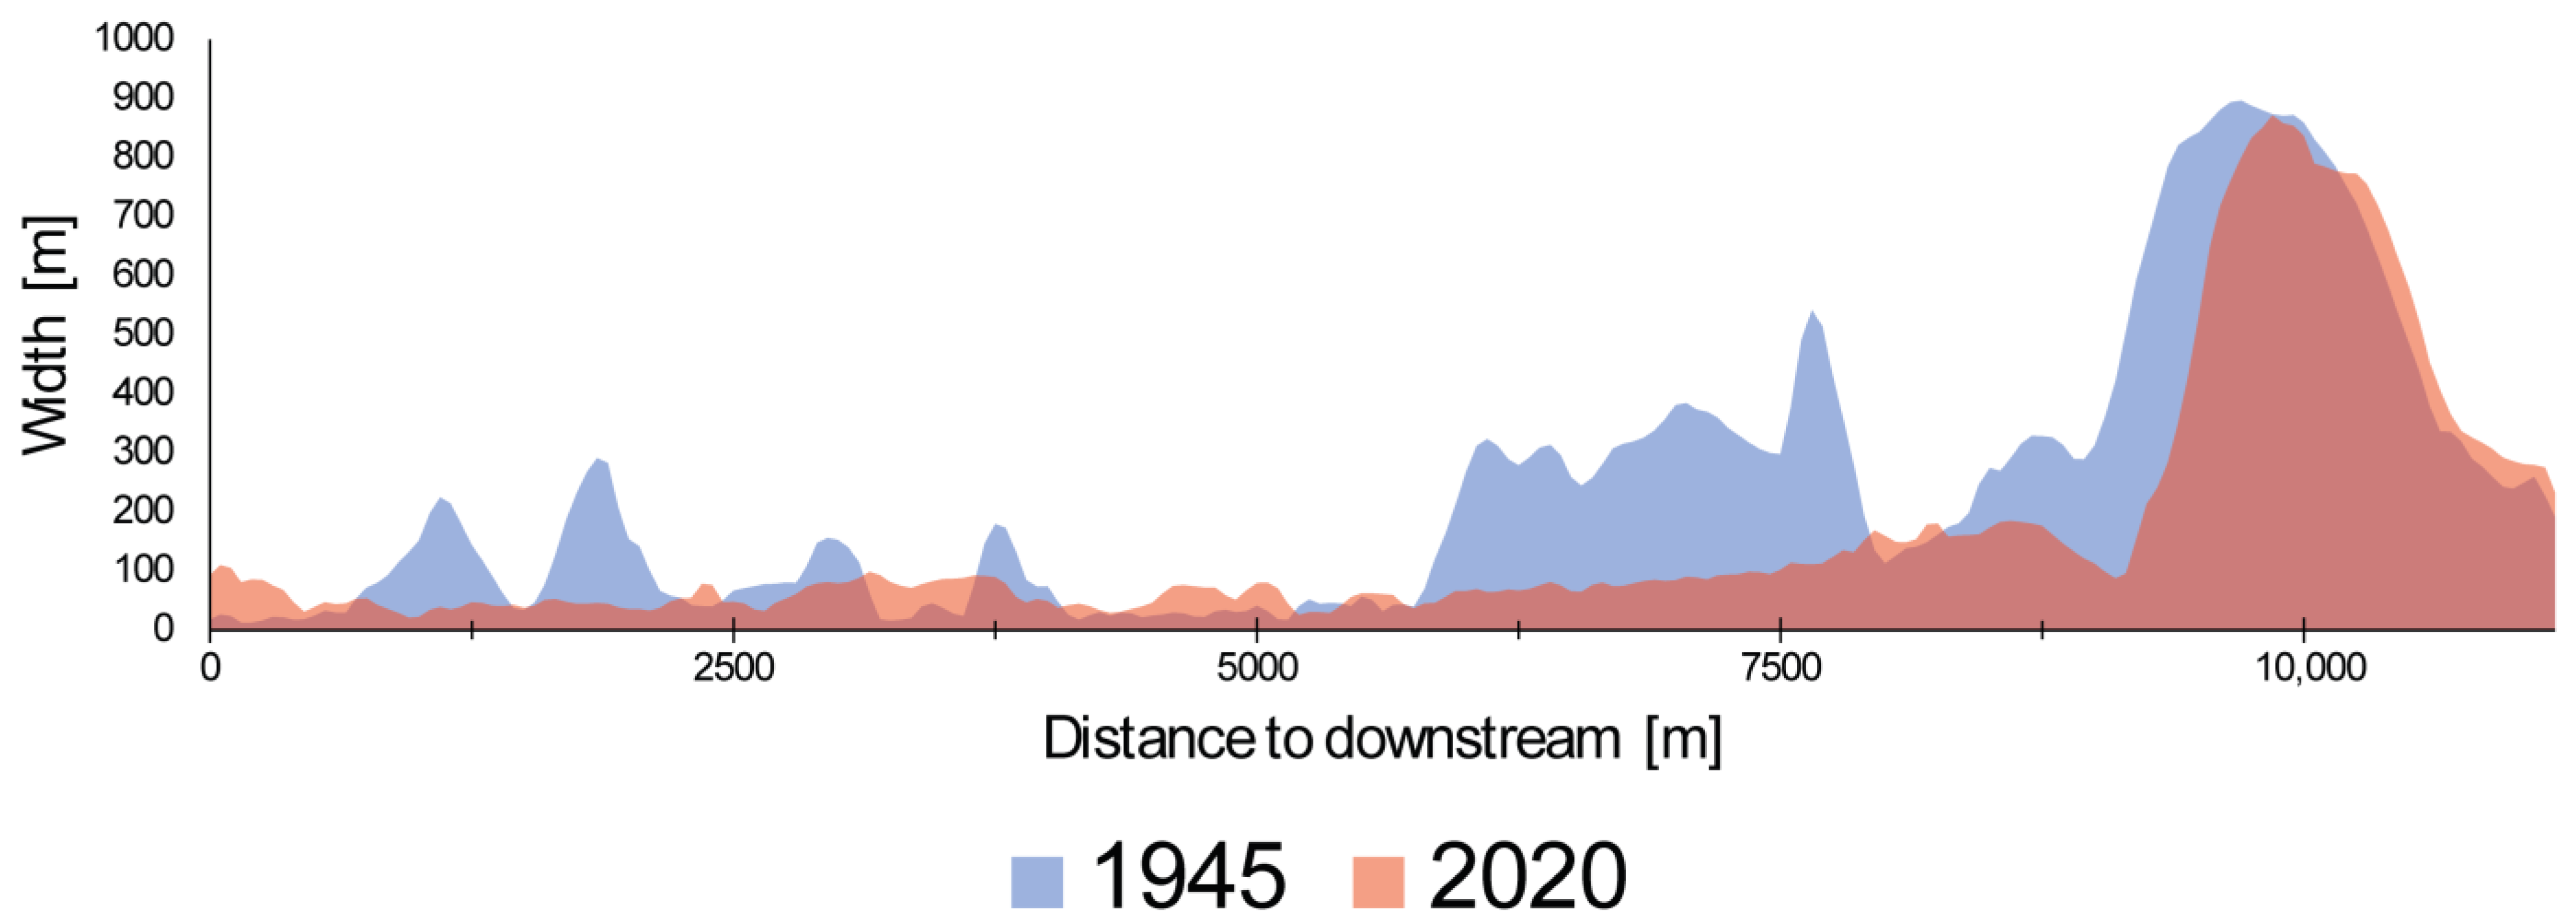
3.2.4. Active Channel Envelope Width
In the Andalién River, there was a notable reduction in the mean width of the active channel envelope over most of the study reach, especially accentuated from the middle reach to the mouth, a striking transformation illustrated in
Figure 8. When calculating the mean width of the active channel envelope, a notable 32% reduction in channel width was observed. This percentage coincides with the reduction in floodplain width documented between 1945 and 2020 (33%). Specifically, the average width of the 11 km study section measured approximately 237 m in 1945, while in 2020 it averaged 161 m in the same section evaluated.
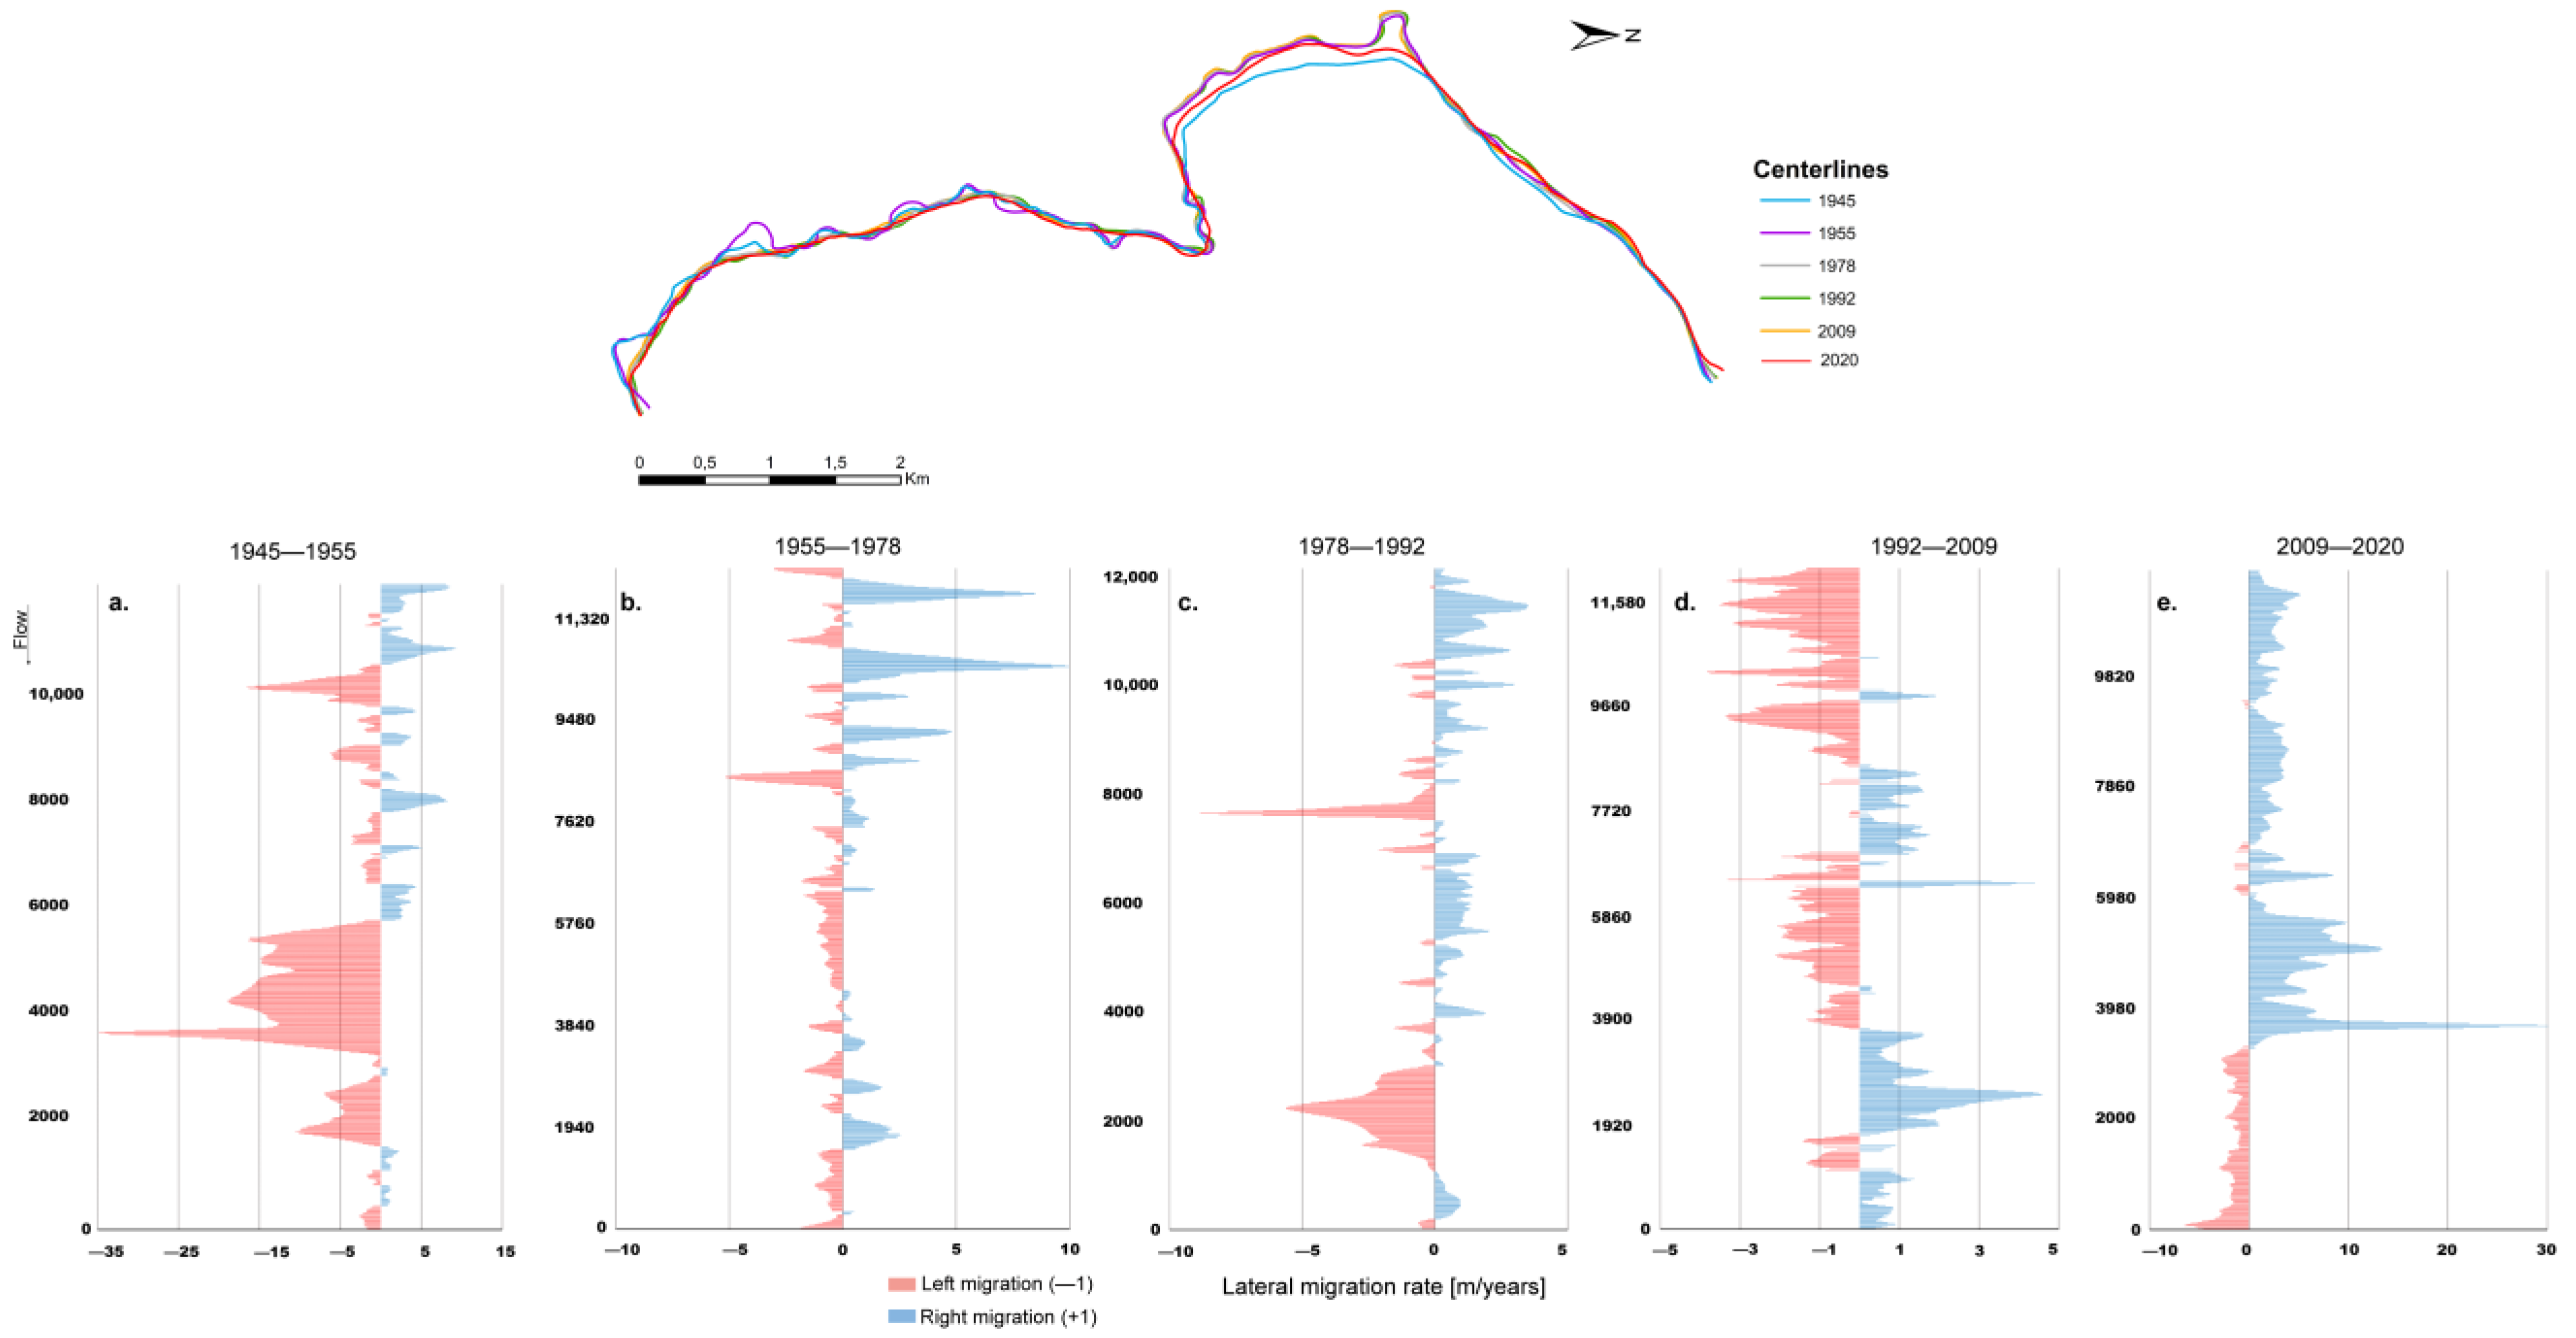
3.3. Lateral Migration Rates Using the QGIS Tool
In this analysis, we assessed mean channel migration distances over various historical periods (1945–1955; 1955–1978; 1978–1992; 1992–2009 and 2009–2020) along the studied river section. Lateral migration is quantified as the change in channel position at the centerlines across different times. The average migration rate was calculated based on the polygons formed by consecutive centerlines, segmented every 20 m. Utilizing the South Rivers Toolbox Plugin in QGIS, systematic separation distances were estimated. At the attribute level, distances were calibrated based on orientation (left or right bank) relative to the direction of the centerline (Time 1 or oldest centerline). The displacement value was then divided by the number of years to derive an annual average displacement (in units of m·yr
−1), as elaborated in
Section 2.3.
The most important lateral displacement changes occurred during the 1945–1955 and 2009–2020 comparisons. In 1945, the Andalién River flowed freely without confinement, allowing its waters to migrate unrestricted across the floodplain. However, the scenario shifted by 1955 as Concepción city’s urbanization encroached upon the Andalién River, resulting in its confinement.
Figure 9a highlights a notable fluctuation in migration rates between kilometer 6 and 3, measured from the upstream outlet. This region corresponded to the upstream area near the river’s mouth, where, in 1945, the Andalién River bifurcated into two channels, forming a substantial middle bar that vanished by 1955.
During the 1945–1955 period, important channel separations were predominantly observed on the right bank, reaching values approaching 35 m·yr
−1. Conversely, changes on the left bank remained below 8 m·yr
−1, with the most pronounced displacements occurring in the lower part of the Andalién River basin, near the zone of very low slope, where the terrain becomes nearly flat. It is crucial to note an approximate 10-year gap between each scene, as illustrated in
Figure 7A. In summary, the areas in which the river experienced the greatest degree of migration across its floodplain coincided with the period in which the urban area began to expand towards the Andalién River, subsequently limiting the river’s lateral migration capacity (
Figure 10A–F).
Figure 9b depicts the annual migration rates of the channel between 1955 and 1978, highlighting the specific sectors where the river exhibited the most notable migration within its floodplain. Notably, during this timeframe, two river sectors, influenced by anthropic interventions stemming from urban expansion and the construction of Route R-146, are evident. These sectors experienced an average annual migration rate of approximately 10 m, resulting in the river becoming confined to these specific areas by 1978.
In
Figure 9c, the annual migration rates of the channel between 1978 and 1992 are illustrated, highlighting sectors where the river experienced heightened migration within its floodplain. Notably, during this period, the river exhibited lower migration rates compared to other timeframes, except for a specific sector where a 10 m change occurred due to urbanization, notably towards the right bank.
Figure 9d illustrates the annual migration rates of the river channel between 1992 and 2009, highlighting the sectors with the highest migration within the floodplain. Throughout this period, migration rates consistently ranged between 0 and 5 m, indicating minimal variation compared to other time frames. This stability is attributed to the urbanization constituted in the sectors adjacent to the river within its floodplain.
Figure 9e depicts the annual channel migration rates from 2009 to 2020, highlighting the sectors where the river experienced the most migration within its floodplain. Notably, in October 2012, the Directorate of Hydraulic Works initiated the channelization of the Andalién River, covering a substantial portion of the lower basin. This involved reinforcing the riverbanks with concrete in specific areas and constructing defenses and embankments to safeguard neighboring properties from flooding. During this period, lateral migration rates surpassed those of previous periods, ultimately leading to the confinement of the Andalién River. This measure aimed to prevent a recurrence of the severe flooding witnessed in 2006.
Between 2009 and 2020, notable channel separations were primarily evident on the left bank, with values reaching nearly 30 m·yr
−1. This sector features a meander cut-off, as illustrated in
Figure 11A–F, where the remnants of the river’s secondary channel vanished due to the channelization efforts initiated in 2012.
4. Discussion
The morphological characterization of river basins is crucial for understanding the dynamic interaction between natural processes and human activities. The results of this study provided valuable insight into the morphological changes that occurred in the Andalién river basin over time from 1945 to the present, highlighting the complex interactions between geomorphological processes and anthropogenic interventions.
The current morphological characterization of the Andalién river basin revealed variations in key metrics along the river course. The upper reach of the river had steeper slopes and higher specific stream power values, indicating a greater sediment entrainment potential. This characterization allowed us to determine the specific zones which are more sensitive to channel modification, particularly in river reaches partially confined and unconfined. In contrast, the lower reach, particularly the Rocuant–Andalién wetland area, experienced a reduction in slopes and in their specific current power values, leading to an intensification of sediment deposition and floodplain expansion.
In addition, comparative analysis of morphological changes in the active channel envelope between 1945 and 2020 revealed notable changes in the classified planform archetypes and geomorphic units. The reduction in the floodplain area and the predominance of islands, together with the increase in lateral bars, triggered a change in the active channel from a sinuous to a quasi-straight pattern, highlighting the impact of anthropogenic activities, particularly urban expansion, and the location of hydraulic protection works along the river. Thus, the observed decrease in the mean width of the active channel envelope reflects alterations in channel morphology due to, among other things, human interventions and natural processes. In a retrospective view the evaluation of lateral migration rates over historical periods further clarified the influence of human activities on channel dynamics. Urbanization and construction activities caused important changes in channel morphology, with notable variations in migration rates over different periods. The most important changes in the Andalien river channel were identified in two specific time periods, i.e., 1945–1955 and 2009–2020, with variations of up to 35 and 30 m/year, respectively. The changes determined in the 1945–1955 period are mainly associated with the beginning of urban development in the Andalien river corridor, while in the most recent period the changes are conditioned to the modifications of the channel due to the location of hydraulic works in 2012. Consequently, the “Dirección de Obras Hidráulicas—DOH” has decided to fully channel the lower part of the Andalién River to mitigate the risk of catastrophic flooding events, such as the one experienced in 2006. A substantial decrease of approximately 32% in the active channel’s extent was observed, closely mirroring the 33% change identified in the two floodplain models.
The findings of this work are consistent with the previous studies on Andalién river basin morphology and geomorphic processes [
5,
21,
29], which highlighted the impact of urbanization, land use changes, and channel modifications on river morphology and dynamics [
21]. For example, studies by Rojas et al. [
5] and Amaya et al. [
6] highlighted the role of human activities in altering channel morphology and sediment transport processes. In addition, the observed changes in planform types and geomorphic units are consistent with studies on river evolution and sediment dynamics, as has been demonstrated by [
11,
30,
31].
Finally, the Andalién River represents a clear example of how human pressure on river corridors can alter the natural balance of the riverbed and its behavior in the face of extreme precipitation events, as was recorded in the 2006 event. In this context of extreme climatic variability, it is important to know which sections of the river are most vulnerable to flood risk. The methodology developed in this work allows the determination of these zones through a retrospective analysis and based on recent remote sensing technologies that enable a synoptic analysis of the watershed. This type of approach provides timely and accurate information to support decision-making by the institutions responsible for river management.
5. Conclusions
This study has shown how using the South Rivers toolbox in QGIS the extraction of geomorphological features can be performed very quickly in a semi-automatic way, taking the Andalién River as study case. The tool also allows for exploring the time evolution by extracting useful information from a series of satellite images and altimetric data.
Concerning specifically the case of the Andalién River, our study provides valuable insights for future management strategies. Using remote sensing and GIS techniques, this research tracked the spatial evolution of an 11 km stretch over 75 years (1945–2020). The analysis revealed morphological changes in anthropogenic intervention and land use alterations, such as the following: (i) in 1945, the river used to freely migrate within its floodplain, but urbanization led to increased confinement over the years; (ii) by 2020, the lower part was channelized, and the middle part is currently being further confined due to ongoing urban development.
Our study should be considered, however, as a first approximation. Indeed, to understand why the apparent morphological changes occurred, detailed topo-bathymetric surveys and granulometric characterizations, acquired before and after the relevant changes were detected, are necessary. With that information, it could be possible to evaluate the changes in the effective discharge and to explain the evolution of the geomorphic units in the planform.
The assessment of the morphological evolution in response to changes in land use and river training works marks the first comprehensive analysis of the Andalién River. In the era of climate variability, this study can support the responsible public entities to improve their planning and management process by considering the importance of maintaining natural geomorphic processes by preserving a wide fluvial corridor and restoring a more natural morphological configuration of the riverbed.
Author Contributions
Conceptualization, S.Y. and A.G.C.N.; methodology, S.Y. and A.G.C.N.; software, S.Y., C.G., A.C. and J.E.; validation, H.P., J.V.-B., G.V. and A.G.C.N.; formal analysis, S.Y. and C.G.; investigation, C.G. and S.Y.; resources, S.Y.; data curation, S.Y. and C.G.; writing—original draft preparation, S.Y. and G.V.; writing—review and editing, A.G.C.N., C.G., A.C., J.V.-B., H.P., G.V. and S.Y.; visualization, A.C., C.G., J.E. and S.Y.; supervision, H.P.; project administration, S.Y.; funding acquisition, S.Y. and J.V.-B. All authors have read and agreed to the published version of the manuscript.
Funding
This research received no external funding.
Institutional Review Board Statement
Not applicable.
Informed Consent Statement
Not applicable.
Data Availability Statement
All raw data can be provided by the corresponding authors upon request.
Acknowledgments
We would like to thank Planet for providing the RapidEYE and Planet Scope (nanosatellite) images used in this study free of charge. We express our gratitude to Octavio Rojas from the Universidad de Concepción for generously supplying us with the historical time series of photographs captured along the Andalién River. Also, thanks to the TanDEM-X DEM GEOL08450 project for providing the high spatial resolution terrain elevation model. Likewise, thanks to the South Rivers Toolbox project (19BP-117424) funded by CORFO and to exchanges within the framework of the ANR-22-CE03-0005 GloUrb project with the University of Lyon (H2O′ Lyon) in France. Finally, we thank the three reviewers for their comments, which greatly improved this article.
Conflicts of Interest
The authors declare no conflict of interest.
References
- De Expertos, G.I.; Climático, S.E.C. Entrega Concluyente del Quinto Informe de Evaluación: El Cambio Climático Amenaza con Impactos Irreversibles y Peligrosos, pero Existen Opciones para Limitar sus Efectos. 2014. Available online: https://archive.ipcc.ch/pdf/ar5/prpc_syr/11022014_syr_copenhagen_es.pdf (accessed on 12 June 2023).
- Miller, J.D.; Kim, H.; Kjeldsen, T.R.; Packman, J.; Grebby, S.; Dearden, R. Assessing the impact of urbanization on storm runoff in a peri-urban catchment using historical change in impervious cover. J. Hydrol. 2014, 515, 59–70. [Google Scholar] [CrossRef]
- Arriagada, L.; Rojas, O.; Arumí, J.L.; Munizaga, J.; Rojas, C.; Farias, L.; Vega, C. A new method to evaluate the vulnerability of watersheds facing several stressors: A case study in mediterranean Chile. Sci. Total Environ. 2019, 651, 1517–1533. [Google Scholar] [CrossRef] [PubMed]
- Martínez-Retureta, R.; Aguayo, M.; Stehr, A.; Sauvage, S.; Echeverría, C.; Sánchez-Pérez, J.-M. Effect of land use/cover change on the hydrological response of a southern center basin of Chile. Water 2020, 12, 302. [Google Scholar] [CrossRef]
- Rojas, O.; Mardones, M.; Rojas, C.; Martínez, C.; Flores, L. Urban growth and flood disasters in the coastal river basin of south-central Chile (1943–2011). Sustainability 2017, 9, 195. [Google Scholar] [CrossRef]
- Álvez, A.; Espinosa, P.; Castillo, R.; Iglesias, K.; Bañales-Seguel, C. An Urgent Dialogue between Urban Design and Regulatory Framework for Urban Rivers: The Case of the Andalién River in Chile. Water 2022, 14, 3444. [Google Scholar] [CrossRef]
- Romero, H.; Vásquez, A.; Fuentes, C.; Salgado, M.; Schmidt, A.; Banzhaf, E. Assessing urban environmental segregation (UES). The case of Santiago de Chile. Ecol. Indic. 2012, 23, 76–87. [Google Scholar] [CrossRef]
- Nones, M. Remote sensing and GIS techniques to monitor morphological changes along the middle-lower Vistula river, Poland. Int. J. River Basin Manag. 2021, 19, 345–357. [Google Scholar] [CrossRef]
- Smith, M.J.; Pain, C.F. Geomorphological mapping. In The SAGE Handbook of Geomorphology; SAGE Publications: London, UK, 2011; pp. 142–153. [Google Scholar]
- Bizzi, S.; Demarchi, L.; Grabowski, R.C.; Weissteiner, C.; Van de Bund, W. The use of remote sensing to characterise hydromorphological properties of European rivers. Aquat. Sci. 2016, 78, 57–70. [Google Scholar] [CrossRef]
- Piégay, H.; Arnaud, F.; Belletti, B.; Bertrand, M.; Bizzi, S.; Carbonneau, P.; Dufour, S.; Liébault, F.; Ruiz-Villanueva, V.; Slater, L. Remotely sensed rivers in the Anthropocene: State of the art and prospects. Earth Surf. Process. Landf. 2020, 45, 157–188. [Google Scholar] [CrossRef]
- Brierley, G.J.; Fryirs, K.A. Geomorphology and River Management: Applications of the River Styles Framework; John Wiley & Sons: Hoboken, NJ, USA, 2013. [Google Scholar]
- Nardini, A.; Yepez, S.; Zuniga, L.; Gualtieri, C.; Bejarano, M.D. A Computer Aided Approach for River Styles—Inspired Characterization of Large Basins: The Magdalena River (Colombia). Water 2020, 12, 1147. [Google Scholar] [CrossRef]
- Yépez, S.; Salas, F.; Vargas, J.; Osores, V.; Rodriguez, R. Morphological characterization using South Rivers Toolbox in the Duqueco river: A support tool for river management. In Proceedings of the XIth Scientific Assembly of the International Association of Hydrological Sciences (IAHS 2022); Copernicus Meetings, Montpellier, France, 29 May–3 June 2022. [Google Scholar]
- Nardini, A.; Brierley, G. Automatic river planform identification by a logical-heuristic algorithm. Geomorphology 2021, 375, 107558. [Google Scholar] [CrossRef]
- Nardini, A.; Yépez, S.; Bejarano, M.D. A computer aided approach for river styles—Inspired characterization of large basins: A structured procedure and support tools. Geosciences 2020, 10, 231. [Google Scholar] [CrossRef]
- Nardini, A.; Yépez, S.; Mazzorana, B.; Ulloa, H.; Bejarano, M.D.; Laraque, A. A systematic, automated approach for river segmentation tested on the Magdalena River (Colombia) and the Baker River (Chile). Water 2020, 12, 2827. [Google Scholar] [CrossRef]
- Nardini, A.; Yépez, S.; Rogeliz, C. Caracterización Geomorfológica River Styles en la Cuenca del rio Magdalena: Caso Estudio Magdalena y caja de Herramientas para la Aplicación Automatizada a la Cuenca. GeoMagda ToolBOX. 2019. Available online: https://www.researchgate.net/publication/338585023_Manual_ToolBOX_GeoMagda_Caracterizacion_geomorfologica_River_Styles_en_la_Cuenca_del_rio_Magdalena_Caso_estudio_Magdalena_y_caja_de_herramientas_para_la_aplicacion_automatizada_a_la_cuenca_nombre_cort (accessed on 15 December 2023).
- Vidal, C.; Romero Aravena, H. Efectos Ambientales de la Urbanización de las Cuencas de los ríos Bíobío y Andalién sobre los Riesgos de Inundación y Anegamiento de la Ciudad de Concepción; Pontificia Universidad Católica de Chile: Santiago, Chile, 2010. [Google Scholar]
- DGA. Observatorio Georreferenciado. Available online: https://snia.mop.gob.cl/observatorio/ (accessed on 1 December 2023).
- Link, O.; Brox-Escudero, L.M.; González, J.; Aguayo, M.; Torrejón, F.; Montalva, G.; Eguibar-Galán, M.Á. A paleo-hydro-geomorphological perspective on urban flood risk assessment. Hydrol. Process. 2019, 33, 3169–3183. [Google Scholar] [CrossRef]
- Escalona, E. Modelación Hidrológica de los ríos Andalién y Duqueco Mediante el Modelo GR4J; Universidad de Concepción: Concepción, Chile, 2021. [Google Scholar]
- Alvarez-Garreton, C.; Mendoza, P.A.; Boisier, J.P.; Addor, N.; Galleguillos, M.; Zambrano-Bigiarini, M.; Lara, A.; Puelma, C.; Cortes, G.; Garreaud, R. The CAMELS-CL dataset: Catchment attributes and meteorology for large sample studies—Chile dataset. Hydrol. Earth Syst. Sci. 2018, 22, 5817–5846. [Google Scholar] [CrossRef]
- McFeeters, S.K. Using the normalized difference water index (NDWI) within a geographic information system to detect swimming pools for mosquito abatement: A practical approach. Remote Sens. 2013, 5, 3544–3561. [Google Scholar] [CrossRef]
- Alber, A.; Piégay, H. Spatial disaggregation and aggregation procedures for characterizing fluvial features at the network-scale: Application to the Rhône basin (France). Geomorphology 2011, 125, 343–360. [Google Scholar] [CrossRef]
- Dunesme, S.; Rousson, C. fct-qgis, Version 1.0.11; Computer Software. 2023. Available online: https://github.com/tramebleue/fct-qgis (accessed on 1 September 2023).
- Gilbert, J.T.; Macfarlane, W.W.; Wheaton, J.M. The Valley Bottom Extraction Tool (V-BET): A GIS tool for delineating valley bottoms across entire drainage networks. Comput. Geosci. 2016, 97, 1–14. [Google Scholar] [CrossRef]
- Arrau Ingeniería. Estudio de Factibilidad y Diseño Definitivo de las obras de Regulación y Retención de Sedimentos en río Andalién, Región del Biobío; Private document; Dirección de Obras Hidráulicas Gobierno de Chile: Santiago, Chile, 2012. [Google Scholar]
- Vilches, O.R.; Flores, M.M.; Quezada, C.R.; Reyes, C.M.; Flores, L.F. Desastres por inundaciones fluviales en un área de expansión urbana: Curso inferior de la cuenca del río Andalién-Chile central (1943–2011). In Proceedings of the III Congresso da Sociedade de Análise de Risco Latino Americana SRA-LA, São Paulo, Brazil, 10–13 May 2016. [Google Scholar]
- Leopold, L.B.; Wolman, M.G. River Channel Patterns: Braided, Meandering, and Straight; US Government Printing Office: Washington, DC, USA, 1957.
- Wolman, M.G.; Miller, J.P. Magnitude and frequency of forces in geomorphic processes. J. Geol. 1960, 68, 54–74. [Google Scholar] [CrossRef]
Figure 1.
(A–C) Andalién river basin and the study stretch; (D) Andalién river hydrograph from 1960 to 2022; (E) seasonal variation curves at the “Río Andalién Camino a Penco” station for different exceedance probabilities and (F) Ombrothermic diagram of the Andalién river basin.
Figure 1.
(A–C) Andalién river basin and the study stretch; (D) Andalién river hydrograph from 1960 to 2022; (E) seasonal variation curves at the “Río Andalién Camino a Penco” station for different exceedance probabilities and (F) Ombrothermic diagram of the Andalién river basin.
Figure 2.
Unveiling the evolution of the character of the Andalién River through a time-coded planform analysis workflow. Note: The Planform and Holistic algorithms were omitted in this study due to the study stretch’s limited extent, with expert judgment being the chosen approach instead. UGO (Units Geographic Objects); DGO (Discrete Geographic Objects); AGO (Aggregate Geographic Objects); and SRT (South Rivers Toolbox). Note: The steps indicated by red dashed boxes were not implemented in our analysis.
Figure 3.
Calculation of lateral migration rate (annual average) in channels with the South Rivers Toolbox—a step-by-step approach. Positive values = shifts to the right bank; negative values = shifts to the left bank.
Figure 3.
Calculation of lateral migration rate (annual average) in channels with the South Rivers Toolbox—a step-by-step approach. Positive values = shifts to the right bank; negative values = shifts to the left bank.
Figure 4.
Synoptic scheme showing spatial evolution of local metrics along the Andalién River in the year 2020, showing: (A) the catchment area and elevation; (B) the degree of river confinement; (C) the symmetry of the width of the Valey Bottom; (D) the slope and the smoothed slope and (E) the Specific Stream Power index.
Figure 5.
Comparison of changes in Planform types for the years 1945 and 2020. The lines in color depict the longitudinal extent of each Planform type, while the colored bars represent the percentage quantification.
Figure 5.
Comparison of changes in Planform types for the years 1945 and 2020. The lines in color depict the longitudinal extent of each Planform type, while the colored bars represent the percentage quantification.
Figure 6.
Evolution of macrosinuosity changes in the study section of the Andalién River (1945 versus 2020). Notice that not only the active channel envelope changed (owing to river training works), but also the effective floodplain itself (owing to urbanization).
Figure 6.
Evolution of macrosinuosity changes in the study section of the Andalién River (1945 versus 2020). Notice that not only the active channel envelope changed (owing to river training works), but also the effective floodplain itself (owing to urbanization).
Figure 7.
Surface area change (%) of the geomorphic units; mid-channel bars, lateral bars, and set of islands. The centerlines correspond to the central axes of the active channel envelopes in the years 1945 (A) and 2020 (B). Note the remarkable urban growth within the Andalién River floodplain over nearly 75 years.
Figure 8.
Changes in the width active channel envelope.
Figure 8.
Changes in the width active channel envelope.
Figure 9.
Evolution of the centerline of the active channel envelope across historical scenarios: 1945–1955 (a), 1955–1978 (b), 1978–1992 (c), 1992–2009 (d), and 2009–2020 (e).
Figure 9.
Evolution of the centerline of the active channel envelope across historical scenarios: 1945–1955 (a), 1955–1978 (b), 1978–1992 (c), 1992–2009 (d), and 2009–2020 (e).
Figure 10.
Average annual lateral migration rate of the channel during the period from 1945 to 1955. (A) is a sketch showing changes in the centerline of the active channel envelope between 1945 and 1955 in the indicated area; (B,C) aerial photographs of the study section in 1945 and 1955, respectively; (D) is a sketch illustrating changes in the centerline of the active channel envelope between 1945 and 1955 in a downstream stretch; (E,F) aerial photographs of the study section in 1945 and 1955, respectively for the downstream stretch.
Figure 11.
Average annual lateral migration rate of the channel during the period from 2009 to 2020. (A) is a sketch showing changes in the centerline of the active channel envelope between 2009 and 2020 in the indicated area; (B,C) satellite images of the study section in 2009 and 2020, respectively; (D) is a sketch illustrating changes in the centerline of the active channel envelope between 2009 and 2020 in a downstream stretch; (E,F) satellite images of the study section in 2009 and 2020, respectively for the downstream stretch.
Table 1.
List of metrics obtained through the South Rivers toolbox and others.
Table 1.
List of metrics obtained through the South Rivers toolbox and others.
| Metrics |
|---|
Floodplain width
(Valley Bottom) | It is measured with the Width Valley Bottom tool of the SRT every 100 m. This tool calculates the average width along each VB segment; i.e., it provides a width value for each DGO of the segmented VB. |
Width of the active
channel and envelope | These are calculated with the same tool just mentioned, by using in input the polygon of the active channel or the envelope, their respective centerline and disaggregation length. For this study, a 20 m step was used to obtain more detailed results. It is important to note that the centerline of the polygon should be sequenced to one end of the line (i.e., from upstream to downstream), so that the coding of the DGOs is sequential. |
Slope and Elevation
analysis | This step implies obtaining elevation data along the active channel centerline. This is achieved through ArcGIS’s Spatial Analyst Tool, which, using a DEM as input, generates a point network with elevation information and cumulative distance from upstream to downstream. To ascertain elevations for the middle and lower sections of the Andalién River, high-resolution LIDAR DEMs were employed, free from tree or building interference. For the upper part, TanDEM-X was utilized. Elevation and accumulated distance data were then transferred to Excel to rectify altimetry values surpassing upstream values. Given the presence of flat regions and possible elevation errors in the DEM data along the river, a smoothing process was necessary to minimize distortions and produce a more realistic slope profile. We used ReachAverage function of the HydroTool in Excel, as conducted in [17], which requires input data such as elevation, cumulative distance, a smoothing distance, and a smoothing parameter. These single values required iteration to achieve optimal results. |
| Catchment area | The catchment’s total area and contributor areas along the river was determined using ArcGIS’s Hydrology tools with a DEM as input. Elevations were obtained by creating a network of points every 20 m along the drainage network, associated with catchment area data. Data validation in Excel ensures that downstream area values do not surpass upstream values. |
| Stream Power | This is a measure of energy dissipation in a riverbed that quantifies the rate of energy delivered per unit stream length, a useful element for studying sediment transport [17]. |
| Specific Stream Power | It is the ratio of the Stream Power and the channel width. In this study, the width employed corresponded to the active channel width during the high-water period (bankfull). |
| Local Sinuosity | Defined as the ratio of the curvature length (σ) to the segment length (δ) along the inflection line, it was calculated locally on the active channel’s centerline using the SRT Planform Metrics tool. This tool employs input data such as the centerline polyline, along with three parameters: maximum amplitude (θ), maximum distance between inflection points (λ), and maximum angle in degrees. The tool identifies inflection points, where the polyline changes concavity, and applies quality control to address closely spaced inflection points. The final results are averaged within each DGO to determine the local sinuosity. It has to be noted, however, that sinuosity is a very delicate parameter and actually what makes sense for geomorphological purposes is the “macro-sinuosity” (addressed in a following point) which is determined on the reaches; but this may require some iterations as the reaches themselves are determined based on the planform types which in turn depend on sinuosity (this issue is dealt with in previous papers [12,13]). |
| Planform | Planform categorizes river reaches based on features like number of low water channels, presence and area of islands, side bars, point bars, middle bars, active channel width, and sinuosity. The planform type can be determined by the method developed by Nardini and Brierley [15]. For our study, focused on a short river section, we opted to simply rely on expert judgment. |
| Reaches | These are river portions virtually geomorphologically uniform based on their planform type and bed material texture, according to [14]. Utilizing the QGIS Intersection tool and visual validation, sequential stretches are derived from the intersection of these two layers [15]. |
| Confinement | Confinement expresses the lack of lateral migration freedom due to the boundaries of the valley bottom (floodplain). |
| The cause of confinement | This is determined by the intersection of the valley bottom contour and a map obtained through visual interpretation using satellite images, temporary aerial images, and a DEM, which classifies the types of elements that can block river flooding, classified as infrastructure, planform, or valley. Infrastructure-related confinement is due to the presence of roads, railways or dikes and levees among others. Planform-related confinement indicates the presence of geo-forms left in the floodplain by geomorphic processes (e.g., terraces and fans), while valley-related confinement is associated with the presence of geological valley margin. |
| Macrosinuosity | It is calculated similarly to the local sinuosity metric described above, but over the reaches. This involves segmenting the centerline of the active channel to obtain separate segments and creating a junction line by generating a segmented straight polyline between the boundary points. |
| Bed material texture | This key attribute for River Style classification requires, in general, in situ recognition (visual classification or sampling), except for coarse sediments that—when not submerged—can be identified from aerial photos (OpenLayers Plugin—QGIS). For our study, the available information was definitely scarce, and we just used high-resolution images and secondary information from previous work in the river. |
| Disclaimer/Publisher’s Note: The statements, opinions and data contained in all publications are solely those of the individual author(s) and contributor(s) and not of MDPI and/or the editor(s). MDPI and/or the editor(s) disclaim responsibility for any injury to people or property resulting from any ideas, methods, instructions or products referred to in the content. |
© 2024 by the authors. Licensee MDPI, Basel, Switzerland. This article is an open access article distributed under the terms and conditions of the Creative Commons Attribution (CC BY) license (https://creativecommons.org/licenses/by/4.0/).

 ,
, 


