Article

Spatial-Temporal Evolution and Influencing Factors of Animal Husbandry Carbon Emissions: A Case Study of Shandong Province, China

1
Key Laboratory of Low-Carbon Green Agriculture in Northeastern China, Ministry of Agriculture and Rural Affairs, Beijing 100125, China
2
Department of Animal Science, College of Animal Science and Veterinary Medicine, Heilongjiang Bayi Agricultural University, Daqing 163316, China
*
Author to whom correspondence should be addressed.
Sustainability 2024, 16(9), 3640; https://0-doi-org.brum.beds.ac.uk/10.3390/su16093640
Submission received: 27 February 2024 / Revised: 24 April 2024 / Accepted: 25 April 2024 / Published: 26 April 2024

Abstract

:
To further study the spatial distribution and dynamic evolution of carbon emissions from animal husbandry in Shandong Province, the panel data of 16 prefecture-level cities in Shandong Province from 2001 to 2022 were used to measure the carbon emissions of animal husbandry and the carbon emission intensity of animal husbandry. Based on the combination of space, kernel density estimation, and LMDI decomposition model, the spatial and temporal evolution of carbon emissions from animal husbandry in Shandong Province and its driving factors were investigated. The results show that: (1) The total amount of animal husbandry carbon emissions in Shandong Province showed a fluctuating downward trend, with a decrease of 10.10% during the investigation period, showing a peripheral-agglomeration distribution pattern. The carbon emission intensity showed a gradual downward trend, with an average annual decline of 7.47%, showing stepped distribution characteristics of high in the west and low in the east. (2) The difference in carbon emissions of animal husbandry among cities in Shandong Province increased first and then decreased, and the growth distribution was basically in the form of “bimodal”, showing a polarization pattern. (3) The intensity effect has the most obvious inhibitory effect on the carbon emission of animal husbandry; the effect of agricultural structure changes from a promoting effect to an inhibiting effect. The inhibitory effect of the industrial structure effect is second only to the intensity effect; the economic effect has the greatest promoting effect; and the promotion effect of the population size effect is small.

1. Introduction

The global warming trend is continuing, and all regions of the world are facing unprecedented changes in the climate system, resulting in a range of problems such as melting glaciers, rising sea levels, more frequent extreme weather events, and so on. CO2, CH4, and N2O are the main gases contributing to global warming, and their contribution to the greenhouse effect is close to 80% [1]. Since they absorb long-wave heat radiation and raise surface temperatures, these gases are known as greenhouse gases. However, greenhouse gases are divided into many categories other than carbon dioxide, and emissions such as methane and nitrous oxide are collectively referred to as carbon emissions when converted to carbon dioxide emissions [2]. The set of greenhouse gases that require regulation includes carbon dioxide (CO2), methane (CH4), nitrous oxide (N2O), hydrofluorocarbons (HFCs), perfluorocarbons (PFCs), and sulfur hexafluoride (SF6) [3]. This is stipulated in the Kyoto Protocol adopted at the Third Conference of the Parties to the United Nations Framework Convention on Climate Change held in Kyoto, Japan in 1997. According to the 2022 emissions estimates from the Emissions Database for Global Atmospheric Research (EDGAR version 7), global greenhouse gas emissions increased by 1.4% compared to 2021 to 53.8 Gt CO2-eq. These figures are 2.3% higher than the 52.6 Gt CO2-eq emissions recorded in 2019 [4]. In recent years, agriculture has been responsible for about 9–14% of the global greenhouse gas emissions (mainly CO2, CH4, and N2O) [5]. The proportion of GHG emissions stemming from agricultural production activities in China is estimated to range between 16–17% [6], which is higher than the global average of carbon emissions from agricultural production activities, and under the guidance of the dual-carbon target, the agricultural sector also needs to accelerate its carbon emission reduction. The reduction of emissions from Chinese agriculture still faces a large amount of harmful greenhouse gas emissions from animal husbandry. Agricultural production processes mainly emit three types of greenhouse gases: methane, nitrous oxide, and carbon dioxide. Methane mainly comes from the intestinal fermentation of ruminant digestion by livestock, livestock manure, and rice fields, etc.; nitrous oxide mainly comes from fertilizer use, straw returning to the field, livestock manure, etc.; and carbon dioxide mainly comes from energy consumption [7,8]. As an important part of agriculture, animal husbandry accounts for more than two-thirds of agricultural carbon emissions in the breeding process [9], compared with some other countries, although the level of industrialization of China’s livestock industry as well as the pressure of agricultural environmental protection has not been so great. The pressure of carbon emission reduction will increase day by day, and the carbon emission reduction of ruminants (beef cattle, dairy cattle, meat goat industry) will be paid more attention by the state. In June 2022, the Ministry of Agriculture and Rural Affairs National Development and Reform Commission issued the “Implementation Program of Agricultural and Rural Emission Reduction and Carbon Sequestration”, which explicitly focuses on energy saving and emission reduction in the crop industry, emission reduction and carbon sequestration in the livestock industry, and other tasks [10]. The program aims to endorse precision feeding technology, enhance breed improvement, increase livestock production, and improve the nutritional value of their feed. Additionally, it seeks to decrease the intensity of methane emissions from ruminants. There is also a focus on optimizing the utilization of livestock manure resources and reducing methane and nitrous oxide emissions associated with their management. The reduction of carbon emissions is of utmost importance in achieving carbon neutrality. Hence, ensuring high-quality green and low-carbon development within the livestock sector is indispensable.
Currently, there has been significant scholarly research conducted both domestically and internationally on the subject of carbon emissions stemming from animal husbandry. This research has primarily concentrated on assessing the measurement, spatial, and temporal dynamics, as well as the factors that influence carbon emissions in the realm of animal husbandry. Concerning the methodologies employed for carbon emission accounting within the livestock industry, China’s breeding sector predominantly incorporates two distinct categories, which are delineated based on the extent of their accounting. The first category centers on carbon emissions measurement methodologies that specifically target a section of the production chain with high emission rates, while the second category encompasses carbon footprint accounting methodologies that encompass the entirety of the production chain. The former includes the OECD method, the IPCC factor method [11], and the mass balance method, while the latter includes the input-output (I-O) method and the life cycle assessment (LCA) method, with the IPCC factor method and the LCA method being more widely used. Rehman A. et al. [12] studied the greenhouse gas (GHG) emissions from agricultural activities in Pakistan, which were investigated utilizing the IPCC coefficient method. The results revealed that GHG emissions attributed to livestock constituted a significant proportion, surpassing 50%, of the total GHG emissions originating from the agricultural sector. Lesschen et al. [13] conducted an estimation of the greenhouse gas (GHG) emissions arising from various agricultural commodities within the livestock sector across EU countries. Their investigation revealed that raw cow’s milk products and beef constitute considerable contributors to the overall GHG emissions in this sector. Life cycle assessment (LCA) is considered to be a scientific and reliable method for assessing greenhouse gas mitigation measures in animal husbandry [14]. It is based on the IPCC coefficient method and is used to assess the entire life cycle. All outputs and inputs related to activities, services, processes, or products have an indirect or direct impact on the environment [2,3,4,5,6,7,8,9,10,11,12,13,14,15]. This method extends the measurement chain of GHG emissions and makes the measurement of GHG emissions more comprehensive. In animal husbandry, direct emissions from raising livestock (including intestinal fermentation) and indirect emissions originating from activities upstream (such as the supply of feed and other inputs) and downstream segments (including post-partum transport, processing and packaging of fresh products) are covered, excluding retail and household segments [16]. Weiss F. [17] employed the LCA method to study the greenhouse gas emissions from the livestock sector in 27 EU countries. Xu et al. [18] employed LCA and the spatial Durbin model to investigate the influence of industrial agglomeration on the carbon emissions of dairy farming. Xue et al. [19] utilized the LCA approach to investigate the assessment and analysis of carbon emission reduction and stock between the biogas-centered circular economy model and the conventional linear model. The researchers focused on conducting a comprehensive evaluation of the carbon emission reduction stock and its associated impact through the application of the LCA methodology. On the other hand, in terms of influencing factors, various researchers mainly analyzed through the LMDI model, spatial econometric model, etc. Some scholars have shown that the increase in economy and population in less developed countries and developing countries is a factor that promotes the growth of carbon emissions, while the improvement of efficiency is a restraining factor [20,21]. Cai et al. [22] argued that the environmental and economic factors of each province in China drove the decline of the GHG emission intensity factor of China’s livestock industry. Hao et al. [9] argued that the industrial structure, population, and income level of farmers had a significant contribution to the carbon emission of animal husbandry. Several factors have been identified as key determinants of the pollution emissions of the livestock industry, including economic development, industrial structure, breeding technology, production efficiency, and population size. These factors have been the subject of extensive research, with numerous studies conducted in this area [23,24]. Dai et al. [25] argued that economic growth and population have a positive impact on carbon emissions, while technological progress, changes in agricultural structure, and changes in the national industrial structure hurt carbon emissions. Moreover, the implementation of economic incentive policies can facilitate farmers’ selection of mitigation strategies about feed management, breeding management, and livestock management, ultimately leading to a reduction in CH4 emissions [26,27].
The above studies have enriched the system and framework of livestock carbon emission research and provided references for the formulation of livestock carbon emission reduction policies. However, the current literature concerning carbon emissions from animal husbandry in Shandong Province, China is limited, with a majority of existing studies focusing on the national and provincial levels. Moreover, the majority of research on carbon emissions from animal husbandry is conducted within the broader context of agriculture, with fewer studies specifically targeting animal husbandry as a research subject. This paper exclusively addresses the issue of carbon emissions from animal husbandry. Shandong Province is a large province of China’s livestock industry; the industry is large, the foundation is relatively strong, and there is a high level of large-scale farming; meat, egg, and milk production; slaughtering and processing capacity; livestock exports; and other key indicators for many years in the country first [28]. However, concurrently, the escalating demand for meat, eggs, milk, and other livestock products fosters the rapid expansion of livestock farming [29,30,31,32]. Consequently, the breeding process generates a significant quantity of noxious gases replete with ammonia, sulfide, methane, and other detrimental constituents that contaminate the farm and its surrounding atmosphere. This pollution impairs the physical and mental well-being of farm workers, further exacerbating the environmental predicament of greenhouse gases and other issues associated with livestock farming [33,34]. Throughout the life cycle of livestock farming, many aspects contribute to GHG emissions such as CO2, CH4, and N2O [35]. Therefore, understanding the spatial–temporal evolution and influencing factors of livestock carbon emissions in Shandong Province is of great importance for the rational formulation of livestock carbon emission reduction policies. However, there are relatively few studies that have investigated the spatial–temporal evolution and influencing factors of livestock carbon emissions in the provincial area. Among them, Shi et al. [36] used the kernel density estimation method to investigate the regional differences in livestock carbon emissions and the dynamic evolution of their distribution, but there are problems such as insufficient research on the internal dynamics of the distribution of regional livestock carbon emissions and strong subjectivity. Based on the utilization of the life cycle assessment (LCA) method for assessing carbon emissions in animal husbandry across various cities, this study aims to examine the spatial distribution characteristics of carbon emissions in this sector through the introduction of carbon emission intensity. Additionally, this study intends to employ the kernel density estimation method to investigate the spatial and temporal changes in animal husbandry carbon emissions in Shandong Province. To offer a foundation for the implementation of energy conservation and emission reduction measures in animal husbandry practices within Shandong Province and to further promote environmentally friendly low-carbon development, the study adopts the Logarithmic Mean Divisia Index (LMDI) decomposition model to analyze the contributing factors from five dimensions: intensity effect, agricultural structure effect, industrial structure effect, economic level effect, and population size effect.

2. Materials and Methods

2.1. Calculation of Animal Husbandry Carbon Emissions

Based on the study by Dai et al. [37,38] this study categorized the carbon emissions generated during the life cycle of livestock production into three subsystems according to the characteristics of the livestock production chain, i.e., the feed grain transport system, the energy consumption system, and the gastrointestinal fermentation and manure management system. In this study, all carbon emissions were converted to CO2-eq according to global warming potential (GWP).

2.1.1. Feed Grain Input System

The system consists of two segments: growing feed grains and processing and transporting them. Concentrated feeds such as soya, maize, and wheat are the main sources of feed for livestock, and as roughage is a by-product of the first processing, it produces negligible carbon emissions and is therefore not considered in this study. Cultivated feed grains such as corn, soybeans, and wheat must be processed through a variety of techniques to become animal feed, and the carbon emissions associated with this process should also be considered within the livestock system. The formula for calculating the CO2 emissions from growing, processing, and transporting feed grains is as follows:
E TZ = i = 1 n Q T · t · q i · ef j 1
E TY = i = 1 n Q T · t · q i · ef j 2
where: ETZ is the CO2 emission caused by the cultivation of feed grain; ETY is the CO2 emission from feed grain processing and transportation; QT is the annual output of T-type livestock products.; t is the consumption coefficient of unit livestock products; qi is the proportion of grain in the feed formula of class i livestock. efj1 is the CO2 equivalent emission coefficient of type j grain, and efj2 is the CO2 equivalent emission coefficient of type j grain processing and transportation (Table 1).

2.1.2. Energy Consumption System

The system includes two links: the energy consumption of livestock rearing and slaughtering and processing. Livestock will consume a large amount of energy such as electricity and coal, which will directly or indirectly cause carbon emissions during the rearing process [43]. The amount of CO2 generated by livestock production can be calculated using the following formula:
E TW = i = 1 n NAPA i · cos t ie price e · ef e + i = 1 n NAPA i · cos t ic price c · ef c
where: ETW is the CO2 emission caused by the energy consumption of livestock production; i is the category of livestock breeding; NAPAi is the annual production of category i livestock; costie is the electricity expenditure per head (only) of type I livestock; pricee is the unit price of electricity for livestock breeding; efe is the CO2 emission coefficient of power consumption; costic is the expenditure of coal per head (only) of livestock in category i; pricec is the unit price of coal for livestock breeding; efc is the CO2 emission coefficient of coal consumption (Table 1).
It is also necessary to consider the energy consumption associated with the slaughtering and processing of livestock. Livestock must be disinfected, packaged, and processed into livestock products to be sold as commodities in the market. Carbon emissions will also be generated in this process. The calculation formula is as follows:
E TR = i = 1 n Q T · MJ u e n ef e
where: ETR is the CO2 emission from livestock slaughtering and processing; QT is the annual output of T-type livestock products; MJu is the energy consumption of slaughtering and processing of animal products per unit of u; en is the calorific value of one degree of electricity; efe is the CO2 emission coefficient of power consumption (Table 1).

2.1.3. Gastrointestinal Fermentation and Feces Management System

The gastrointestinal tract of livestock functions under anaerobic conditions, and the rumen microbiota of ruminants is responsible for the production of CH4 through the digestion of plant feeds [44,45]. The calculation of methane emissions from gastrointestinal fermentation in livestock is as follows:
E TD = i = 1 n APP i · ef i 1
where: ETD is the CH4 emission from gastrointestinal fermentation of livestock; i is the category of livestock breeding; APPi is the annual average feeding amount of i-type livestock; efi1 is the CH4 emission factor of gastrointestinal fermentation of livestock (Table 2).
The degradation of livestock manure under anaerobic conditions will produce CH4 gas [27,48,49]. Concurrently, the nitrogen present in the manure will undergo nitrification and denitrification, with the nitrogen present in the protein in the manure being converted into N2O gas [50,51]. Therefore, the carbon emissions of the manure management system are divided into the following two parts.
E TQ = i = 1 n APP i · ef i 2
E TK = i = 1 n APP i · ef i 3
where: ETQ and ETK are CH4 and N2O emissions from livestock manure management systems, respectively. i is the category of livestock breeding; APPi is the annual average feeding amount of i-type livestock; efi2 and efi3 are CH4 and N2O emission factors of livestock manure management systems (Table 2).

2.1.4. Total Animal Husbandry Carbon Emissions

According to the LCA method, the total GHG emissions from the livestock sector are calculated using the formula:
E Total = E TZ + E TY + ( E TD · GWP CH 4 + E TQ · GWP CH 4 + E TK · GWP N 2 O ) + E TW + E TR
where: ETotal is the total carbon emissions of animal husbandry life cycle measured by CO2 equivalent; ETZ, ETY, ETD, ETW, and ETR represent the production of feed grain planting, feed grain processing and transportation, livestock gastrointestinal fermentation, livestock breeding energy consumption, livestock slaughtering and processing, respectively. ETQ and ETK are CH4 and N2O emissions from the fecal management system; GWP CH 4 is the global warming potential of CH4; GWP N 2 O is the global warming potential.

2.2. Kernel Density Estimation

Kernel density estimation is a non-parametric test commonly used to describe the distribution of variables. In this paper, Stata17 software was used to analyze the time trend of carbon emissions from livestock production in Shandong Province, China, using the kernel density estimation method. The formula is shown below:
f x = 1 nh i = 1 n K x x i h
In this study, where n represents the number of observed samples, h signifies the bandwidth, xi denotes the carbon emissions of animal husbandry in city i, and k (−) denotes the kernel function or weight function. When the exact form of the function cannot be determined, the Gaussian kernel function is considered more advantageous compared to other kernel functions. Consequently, the Gaussian kernel function is employed in this research to examine the dynamic evolution of carbon emissions from animal husbandry in Shandong Province and to evaluate the overall distribution of such emissions. The formula for the Gaussian kernel function is provided below:
K x = 1 2 π e x 2 2
Kernel density estimation generally analyzes the dynamic evolution of the probability distribution of random variables by comparing the shape and position of the kernel density curve. In general, if the density function curve as a whole shifts to the left or right over time, it indicates that the overall level of the variables being studied is increasing or decreasing. A shift to the right indicates an increase in value and a shift to the left indicates a decrease in value. A “sharp and narrow” peak shape indicates that the gap between regions is not large, whereas a “flat and wide” peak shape indicates that the gap between regions is gradually widening [52].

2.3. Kaya’s Constant Equation LMDI Decomposition Model

The Kaya equation mathematically links carbon emissions from human social activities to economic, political, and demographic factors and is expressed as follows, based on the basic form of the equation and drawing on existing research [53]:
CO 2 = CO 2 E × E GDP × GDP P × P
The formula comprises four variables: CO2 represents carbon emissions, E energy consumption, GDP the gross domestic product, and P the total population at the end of the year. The formula decomposes carbon emissions into emission intensity, energy intensity, GDP per capita, and total population.
The LMDI method can be employed to address the issue of zero values and residuals in the decomposition process [54], so many scholars use LMDI to study the influencing factors in depth. Therefore, according to the influencing factors of livestock carbon emissions, based on the Kaya identity, this study quantitatively decomposes the factors influencing livestock carbon emissions from the aspects of emission intensity, agricultural structure, industrial structure, economic development, and population size. The formula is as follows:
C ar = C ar LS × LS AGRI × AGRI GDP × GDP P × P = EI · CI · INS · PG · P
In the formula, Car is carbon emissions from livestock, LS is the value of livestock production, AGRI is the total value of agriculture, forestry, livestock, and fisheries, GDP is gross domestic product, and P is the total population. The following abbreviations are used in this text: additionally, EI represents the intensity effect, CI represents the agricultural structure effect, INS represents the industrial structure effect, PG represents the economic effect, and P represents the population size effect. The selection of these five effects for decomposition is based on multiple considerations. Firstly, previous studies have shown that technological progress in the livestock sector can reduce carbon emissions while improving production efficiency. This intensity effect, which reflects technological progress, plays a crucial role in reducing carbon emissions in the livestock sector. Secondly, the implementation of regulations for livestock environments has promoted the scaling process of livestock breeding, as well as the adjustment of agricultural structure. This adjustment could exacerbate the conflict between crop farming and animal husbandry in terms of supply and demand of resources, increase carbon emissions from livestock breeding, and alter the boundary of the agriculture–animal husbandry combination, potentially reducing carbon emissions from animal husbandry to some extent. Moreover, agricultural productivity is typically lower than that of the secondary and tertiary industries. As a large number of agricultural workers move to other sectors, the productivity per unit of agricultural labor also changes. Consequently, alterations in the industrial structure have a significant impact on the carbon emissions of animal husbandry. Additionally, changes in household income and population size directly affect the demand for livestock products. Livestock product supply is adjusted according to changes in demand, resulting in changes to animal husbandry carbon emissions.
The LMDI method comprises two forms of decomposition: “product decomposition” and “additive decomposition”. Although the two forms differ, the final decomposition results are consistent. This paper employs the “additive decomposition” method, using 2001 as the base year with its carbon emission recorded as C0. CT represents the total greenhouse gas emission in the T year, and the greenhouse gas emission increment in the T year is △CTOT, which is calculated using the following formula:
C TOT = C T C 0
The LMDI model’s additive decomposition form is used to obtain specific expressions for the total effects.
C TOT = ES + EI + SI + CI + AI
Formula (14) includes the following variables: ΔES for the strength effect, ΔEI for the effect of agricultural structure, ΔSI for the effect of industrial structure, ΔCI for the economic level effect, and ΔAI for the population size effect.
Let W =   C i T C i 0 lnC i T lnC i 0 . The following are the expressions for the effects of each decomposition factor:
ES = W × ln ES T ES 0
EI = W × ln EI T EI 0
SI = W × ln SI T SI 0
CI = W × ln CI T CI 0
AI = W × ln AI T AI 0

2.4. Indicators and Data Sources

This study focuses on livestock that provide animal food, such as meat, eggs, and milk. Specifically, it includes pigs, cattle, sheep, and poultry. Livestock species that provide industrial raw materials, such as wool, skin, and bone, are not included due to missing data. This study covers the entire process of livestock farming, including feed grain acquisition, livestock breeding, product processing, and transport. This paper utilizes data from 16 provincial cities in Shandong Province, China, spanning from 2001 to 2022. The data on cattle, pigs, sheep, poultry, milk, pork, beef, mutton, poultry, and eggs are sourced from the “Statistical Yearbook of Shandong Province” for the relevant years. Meanwhile, the data on grain consumption, main product output, electricity cost, and coal cost for each type of livestock are obtained from the “National Agricultural Product Cost-Benefit Information Compilation” for the relevant years. Any missing values have been supplemented using the mean interpolation method. The data of animal husbandry output value, agriculture, forestry, animal husbandry and fishery output value are from the “Shandong Statistical Yearbook” over the years; GDP and total population data at the end of the year come from the “Shandong Statistical Yearbook” over the years (Figure 1). The vector data of administrative divisions in Shandong Province of China involved in this paper are from the National Basic Geographic Information Center. The map of Shandong Province of China is drawn by ArcMap10.8 software, and the map number is GS (2023) 2627.

3. Results

3.1. Total Carbon Emissions and Spatial Distribution of Animal Husbandry in Shandong Province

According to the previous literature, Shandong Province is divided into three regions based on topography, landforms, and geographic characteristics of its cities [55]. Laiwu City will be abolished in 2019 and will be under the jurisdiction of Jinan City. The Shandong region is divided into three main areas: the Peninsular region, which includes Qingdao, Yantai, Weihai, Weifang, Rizhao, and Dongying; the Central Shandong region, which includes Jinan, Laiwu, Tai’an, Zibo, and Linyi; and the West Shandong region, which mainly includes Liaocheng, Dezhou, Binzhou, Heze, Jining, and Zaozhuang.
Table 3 illustrates that in 2022, the cities with the highest carbon emissions from animal husbandry were Linyi, Weifang, Heze, Dezhou, and Liaocheng. The total carbon emissions for these cities are 461.31, 419.36, 411.81, and 357. In 2022, the cities with the lowest total carbon emissions from animal husbandry are Weihai, Zaozhuang, Zibo, Rizhao, and Tai’an. Their carbon emissions are 80.75, 82.38, 104.75, 118.42, and 1520 10kt/CO2-eq, respectively. Overall, from 2001 to 2022, the carbon emissions of animal husbandry in Shandong Province (city) showed a fluctuating downward trend, but there were great differences in the increase and decrease of carbon emissions in various prefecture-level cities, from 4379.33 10kt/CO2-eq in 2001 to 3936.95 10kt/CO2-eq in 2022, a decrease of 10.10%. Among them, compared with 2001, the cities with decreased carbon emissions were concentrated in Jinan, Qingdao, Weifang, Jining, Tai’an, Dezhou, and Liaocheng, which decreased by 48.61%, 42.73%, 7.65%, 24.16%, 28.86%, 25.96%, and 22.95%, respectively. The carbon emissions of livestock husbandry in the remaining eight cities represented by Yantai and Dongying showed different degrees of increase.
Considering the long sample examination period, this paper selects six representative years, 2001, 2005, 2009, 2013, 2017, and 2022, respectively, to make a trend judgement on the growth distribution of carbon emissions from animal husbandry, and analyze the spatial distribution of carbon emissions from animal husbandry in Shandong Province. As shown in Figure 1, the distribution of carbon emissions from animal husbandry in various prefecture-level cities in Shandong Province is peripheral-agglomeration. From 2001 to 2022, the regions with more carbon emissions from animal husbandry in Shandong Province are mainly concentrated in the peninsula and western Shandong, including Weifang, Dezhou, Heze, Jining, and other prefecture-level cities, which are all areas with agriculture as the main industry. In these three cities, animal husbandry production is very developed, especially in pig and cattle breeding. In the meantime, the emission of carbon from animal husbandry in Linyi City, situated in the central region of Shandong Province, has increased significantly. This indicates a concentration of carbon emissions from animal husbandry in the “peripheral” prefecture-level cities towards the “central” zone. Shandong Province has a relatively large share of carbon emissions from winter wheat and summer maize in the soil use of farmland for planting. This is because winter wheat and maize are the main grain crops planted in Shandong Province, with a large planting area. The ploughing method and the level of fertilizer application have a greater impact on soil carbon emissions. The increasing level of agricultural mechanization and scaling in Shandong Province has resulted in a corresponding increase in fertilizer and pesticide inputs, leading to a significant rise in carbon emissions. In general, the greater the extent to which the government introduces environmental regulation policies for the livestock industry, the lower the carbon emissions from the livestock industry. Tian et al. [56] demonstrated that environmental regulation hurts carbon emissions from the livestock sector in China, but the low level of impact may be because the government has not introduced regulatory policies specifically targeting carbon emissions from the livestock sector. The deceleration in the expansion of carbon emissions from the livestock sector in Shandong Province, China, between 2001 and 2022 can be attributed, at least in part, to the intensification of environmental regulation. It is noteworthy that Shandong Province represents one of the primary production hubs for livestock products in China. As living standards and dietary habits have improved, there has been a significant increase in the demand for meat, eggs, milk, and other livestock products. To meet the market demand for high-quality livestock products, Shandong Province has expanded the scale of breeding. The stockpile of pigs, cows, sheep, and poultry has steadily increased in Shandong Province. The production capacity of these animals is highly dispersed, and the industrial structure is mostly based on free-range farmers. This has resulted in a significant amount of manure and urine generation from livestock. Livestock excrement is produced in large quantities, and its comprehensive utilization rate is insufficient. This directly results in an increase in carbon emissions from the livestock sector.

3.2. Carbon Emission Intensity and Spatial Distribution of Animal Husbandry in Shandong Province

This paper introduces carbon emission intensity as an indicator to measure the level of carbon emissions from the livestock industry in Shandong Province, which is obtained from the ratio of carbon emissions from the livestock industry in each region to the gross domestic product of the livestock industry in that region (i.e., the GDP of the livestock industry) [57], i.e., the amount of carbon emissions released by each unit of GDP of the output. Carbon emission intensity is the most direct indicator of the relationship between economic development and carbon emissions in a region [58]. Theoretically, the smaller the value of carbon emission intensity, the better; it represents the same amount of GDP output caused by the reduction of carbon emissions increase, but also indicates that with the economic development, the economic structure and the level of science and technology is more and more progressive [59]. The carbon emission intensity of animal husbandry can intuitively reflect the differences in the level of development of low-carbon animal husbandry between regions.
To investigate the change in carbon emission intensity of animal husbandry in each city of Shandong Province from 2001 to 2022, we calculated the carbon emission intensity and rate of change of animal husbandry by combining the gross domestic product of animal husbandry in each prefecture-level city (refer to Table 4). Overall, the carbon emission intensity of animal husbandry in Shandong Province (city) from 2001 to 2022 shows a clear downward trend, decreasing by 80.40% from CNY 6.69 t/million in 2001 to CNY 1.31 t/million in 2022, with an average annual decrease of 7.47%. Relative to 2001, the cities with the largest decreases in carbon emission intensity are Dezhou, Tai’an, and Jinan, with decreases of 87.70%, 85.69%, and 84.56%, respectively, which is consistent with the trend of the results of the study by Cao Hailin [60]. Compared with 2001, the carbon emission intensity of animal husbandry in each city decreased in 2022, which means that the carbon emission per unit of animal husbandry output value is decreasing, and the carbon efficiency of animal husbandry production is improved. From the perspective of the average value of carbon emission intensity of animal husbandry, Heze City has the highest carbon emission intensity, which is CNY 2.09 t/ten thousand higher than the average of Shandong Province. The primary reason for this is that the carbon emissions generated by livestock breeding in Heze City account for a significant proportion of the total. Furthermore, the problems of high input, high pollution, and unsustainable development of animal husbandry are prominent, resulting in a high carbon emission intensity. Nevertheless, the total amount of carbon emissions is not the sole determining factor in the carbon emission intensity of the animal husbandry industry. Weifang and Jining, which are also significant cities for livestock farming, exhibit a low carbon emission intensity for the animal husbandry industry. This is because these cities have a larger value in the animal husbandry industry, which has a diluting effect on the carbon emissions of the animal husbandry industry to a certain extent. Carbon emissions from animal husbandry in Dezhou City primarily result from livestock waste treatment and land use changes related to animal husbandry. These factors contribute to an increase in carbon emissions from animal husbandry in Dezhou City. However, the average carbon emission intensity ranks second, likely due to the low output value of animal husbandry in the region. Weihai City has lower carbon emissions, and its carbon emission intensity is also lower. From the perspective of growth rate, the negative average annual growth rate between 2001 and 2022 means that the carbon emissions per unit of output in the production process of animal husbandry are decreasing. The changing trend of carbon emission and carbon emission intensity shows that the green and low-carbon development policy of animal husbandry in Shandong Province has a significant effect, and the development mode of animal husbandry is transforming to ecological green and low-carbon transformation and upgrading.

3.3. Kernel Density Estimation of Animal Husbandry Carbon Emissions

Figure 2 illustrates the kernel density estimation of carbon emissions from the livestock sector in Shandong Province. This analysis is designed to investigate the dynamic evolution of carbon emissions from the livestock sector. (1) From 2001–2022, the kernel density plot of carbon emissions from animal husbandry in Shandong Province shifted to the right along the horizontal axis. The range of the rightward shift first expanded and then narrowed down. This indicates that during this period, there were significant differences between the cities with high emissions from animal husbandry in Shandong Province and those with low emissions. Each city went through the process of expanding and then narrowing down. (2) The height of the main peak of the kernel density curve of carbon emissions from animal husbandry in Shandong Province experienced a decrease first and then an increase from 2001–2022, which reflected that the difference between the carbon emissions of animal husbandry in 16 cities in Shandong Province increased first and then decreased during the study period. (3) From the peak point of view, the carbon emissions of animal husbandry in 16 prefectures and cities in Shandong Province from 2001–2022 showed a “double peak” shape, which reflected that although the regional differences in the carbon emissions of animal husbandry in 16 prefectures and cities in Shandong Province continued to expand during the 22 years, the differences among the cities were mainly characterized by polarization. The reason for this situation is that regional differences in factors affecting carbon emissions from animal husbandry, such as the structure of agricultural production and the level of development of agricultural modernization, are not obvious in the period examined. The different positioning and comparative advantages of various regions in Shandong Province in economic development, and the differences in economic structure and carbon emissions between large-scale farming and free-range farming may be the main reasons for the polarization characteristics of animal husbandry carbon emissions in Shandong Province from 2001–2022.

3.4. Decomposition of Influencing Factors of Animal Husbandry Carbon Emissions

This study employs the LMDI model to assess the contribution of each influencing factor in determining carbon emissions from animal husbandry in 16 prefecture-level cities between 2001 and 2022. Furthermore, it examines the various factors that influence carbon emissions from animal husbandry, considering both temporal and regional perspectives.
Table 5 shows that economic level has the most significant effect on animal husbandry carbon emissions, with a positive impact. Between 2001 and 2022, this effect caused a cumulative increase of 8980.57 10kt/CO2-eq, reaching the approaching point in 2004. The steady growth of the economy and people’s income in Shandong Province has led to an increase in demand for meat, eggs, milk, and other livestock products. As a result, animal husbandry in the province must expand its farming scale to meet this demand. However, this expansion has also resulted in increased carbon emissions from animal husbandry in Shandong Province. The promotion of animal husbandry carbon emissions remains the most significant factor affecting this effect. Therefore, it is necessary to further strengthen carbon emission reduction efforts in the future.
The intensity effect has a significant impact on reducing carbon emissions from the animal husbandry industry, resulting in a cumulative reduction of 6740.97 10kt/CO2-eq from 2001 to 2022. This reduction is attributed to the carbon emission reduction policy implemented in the animal husbandry industry, particularly after the introduction of key policies in recent years. From 2001 to 2006, China implemented several measures to reduce carbon emissions from livestock, resulting in a cumulative reduction of 1793.79 10kt/CO2-eq over this period. Following the introduction of the Pollutant Emission Standards for Livestock Farming in 2001 and the issuance of the Ministry of Agriculture’s Guidance on Promoting the Modernization of Livestock Farming Practices in 2004, carbon emissions were reduced by 2172.79 10kt/CO2-eq in 2006–2007. Between 2007 and 2014, China established clear requirements for controlling livestock pollution. However, the promotion of emission reduction policies during this period was slow and inconsistent [61]. Despite this, these policies still managed to suppress carbon emissions by a cumulative total of 4121.62 10kt/CO2-eq. From 2015 to 2022, the state and governments at all levels enacted various strict environmental protection laws and regulations for livestock farming and transformed industrialized livestock farming to ecological livestock farming, and the overall trend of intensity effect inhibition was enhanced, and a cumulative carbon emission reduction of 825.55 10kt/CO2-eq was achieved in this period.
The effect of the industrial structure is the second most important factor in reducing the growth of carbon emissions from livestock, with a cumulative reduction of 2826.13 10kt/CO2-eq of carbon emissions. The total production value of agriculture, forestry, animal husbandry, and fisheries in 2022 is about five times higher than in 2001. However, the proportion of agricultural output to Shandong Province’s GDP is declining at a much more pronounced rate. This is mainly because with the deepening of urbanization and industrialization, the comparative rate of return of agricultural labor and capital input has decreased significantly, and the continuous outflow of agricultural production factors has made it possible for agriculture to achieve large-scale and intensive production, thus significantly increasing the output of unit factors and significantly reducing the carbon emissions of agricultural production. It should be pointed out that the suppression of the industrial structure effect cannot fully explain the improvement of agricultural production efficiency. To some extent, it also shows that the growth of carbon emissions in secondary and tertiary industries is accelerating and that the process of reducing carbon emissions in non-agricultural industries needs to be accelerated.
The impact of agricultural structure on the incremental carbon emissions of livestock production alternates between positive and negative from 2001 to 2022. The Opinions on Accelerating the Development of Modern Animal Husbandry issued between 2001 and 2006, clarified relevant policies, suppressed a small amount of carbon emissions during that period, and promoted 336.37 10kt/CO2-eq of carbon emissions only in 2007–2014. This increase was mainly due to the increase in the number of livestock holdings and their output value as a percentage of the output value of agriculture, forestry, animal husbandry and fishing. Between 2015 and 2022, the livestock industry significantly reduced its carbon emissions by 454.66 10kt/CO2-eq through changes in agricultural structure. This reduction shows a downward trend with some fluctuations. To comprehensively promote the high-quality development of animal husbandry and accelerate the transformation and upgrading of the industry, Shandong Province has put forward four major deployments. These include promoting livestock breeding to scale, transforming and upgrading animal husbandry to be more intensive and intelligent, upgrading animal husbandry facilities, integrating the entire processing and management chain, and promoting the development of ecological modes to transition to green and low-carbon practices. To enhance the economic efficiency of the animal husbandry industry, it is important to promote energy conservation and reduce consumption in livestock farming. This can be achieved by promoting clean farming techniques such as water-saving and food-saving methods. Additionally, it is necessary to allocate and improve manure treatment facilities, control odor emissions, and promote the resourceful use of farming waste. The advancement of technology in animal husbandry can significantly reduce energy consumption per unit of GDP and achieve carbon emission reduction. This progress inhibits the impact of agricultural structure on livestock carbon emissions.
The contribution of population scale to carbon emissions from animal husbandry is relatively small, with a cumulative increase of 486.62 10kt/CO2-eq of carbon emissions from 2001 to 2022. From 2001 to 2006, the total population of Shandong Province grew at an average annual rate of 0.59%. During this period, urbanization accelerated, leading to a concentration of the population in cities. Improved living standards and increased consumption demands drove the development of the livestock industry, resulting in a cumulative increase of 135.81 10kt/CO2-eq of carbon emissions due to the population scale effect. From 2007 to 2014, the total population size at the end of each year grew at an average annual rate of 0.66%. During this period, the annual population size effect was approximately 300,000 t, resulting in a cumulative increase of 204.84 10kt/CO2-eq of carbon emissions. However, in the period from 2015 to 2022, the average annual growth rate of the total population size at the end of the year slowed to 0.42%, with a significant decrease in the population growth rate in 2015. During this period, the population growth rate has slowed down, and people’s environmental awareness has improved. This has led to a gradual transformation of livestock production methods and an increase in efficiency, which has weakened the driving role of the population-scale on greenhouse gas emissions. The cumulative increase in carbon emissions from the population scale effect over this period was therefore 145.98 10kt/CO2-eq.
The Figure 3 shows that only Jinan, Qingdao, and Dezhou had carbon emission reductions exceeding 100 10kt/CO2-eq in the animal husbandry industry among the 16 cities and municipalities in Shandong Province, compared to the base period. Weifang, Jining, Tai’an, and Liaocheng cities had carbon emission reductions of less than 100 10kt/CO2-eq, while other cities and municipalities had a cumulative increase in carbon emissions of between 0.15 and 141.73 10kt/CO2-eq. Different from the influencing factors of Shandong Province, the intensity effect and industrial structure effect of each city plays a certain role in carbon emission reduction. The regional economic development level and population scale effect promote the increase of animal husbandry carbon emissions. However, the contribution of agricultural industrial structures to carbon emission reduction in different cities is quite different. The emission reduction of agricultural structure effect in Weifang is 103.41 10kt/CO2-eq, while that in Tai’an is only 0.61 10kt/CO2-eq. Dezhou and Heze promoted the increase in carbon emission reduction, which were 140.95 10kt/CO2-eq and 174.57 10kt/CO2-eq, respectively. Analyze the four cities of Weifang, Tai’an, Dezhou, and Heze. Although these cities are the main pig-producing areas in Shandong Province, their large-scale pig-raising enterprises are still dominated by extra provinces, and their production methods are small and medium-sized. By 2022, the GDP of animal husbandry in the four cities is expected to increase by 3.42, 4.97, 6.02, and 5.83 times, respectively, compared to 2001. This growth rate is higher than that of Jinan (3.33) and Qingdao (2.33). Additionally, the GDP of agriculture, forestry, animal husbandry, and fishery is expected to increase by 4.29, 5.44, 4.73, and 3.99 times, respectively, compared to 2001. It is worth noting that there is an apparent gap in carbon emission reduction. The expansion of livestock farming in Dezhou and Heze has led to an increase in carbon emissions. To achieve structural carbon reduction, it is urgent to optimize the structural effect of agriculture.

4. Conclusions and Policy Recommendations

4.1. Conclusions

The spatial–temporal evolution of livestock carbon emissions in Shandong Province and the analysis of driving factors were investigated by measuring livestock carbon emissions in Shandong Province from 2001 to 2022, combining spatial and non-parametric estimation methods, and the following conclusions were drawn:
(1)
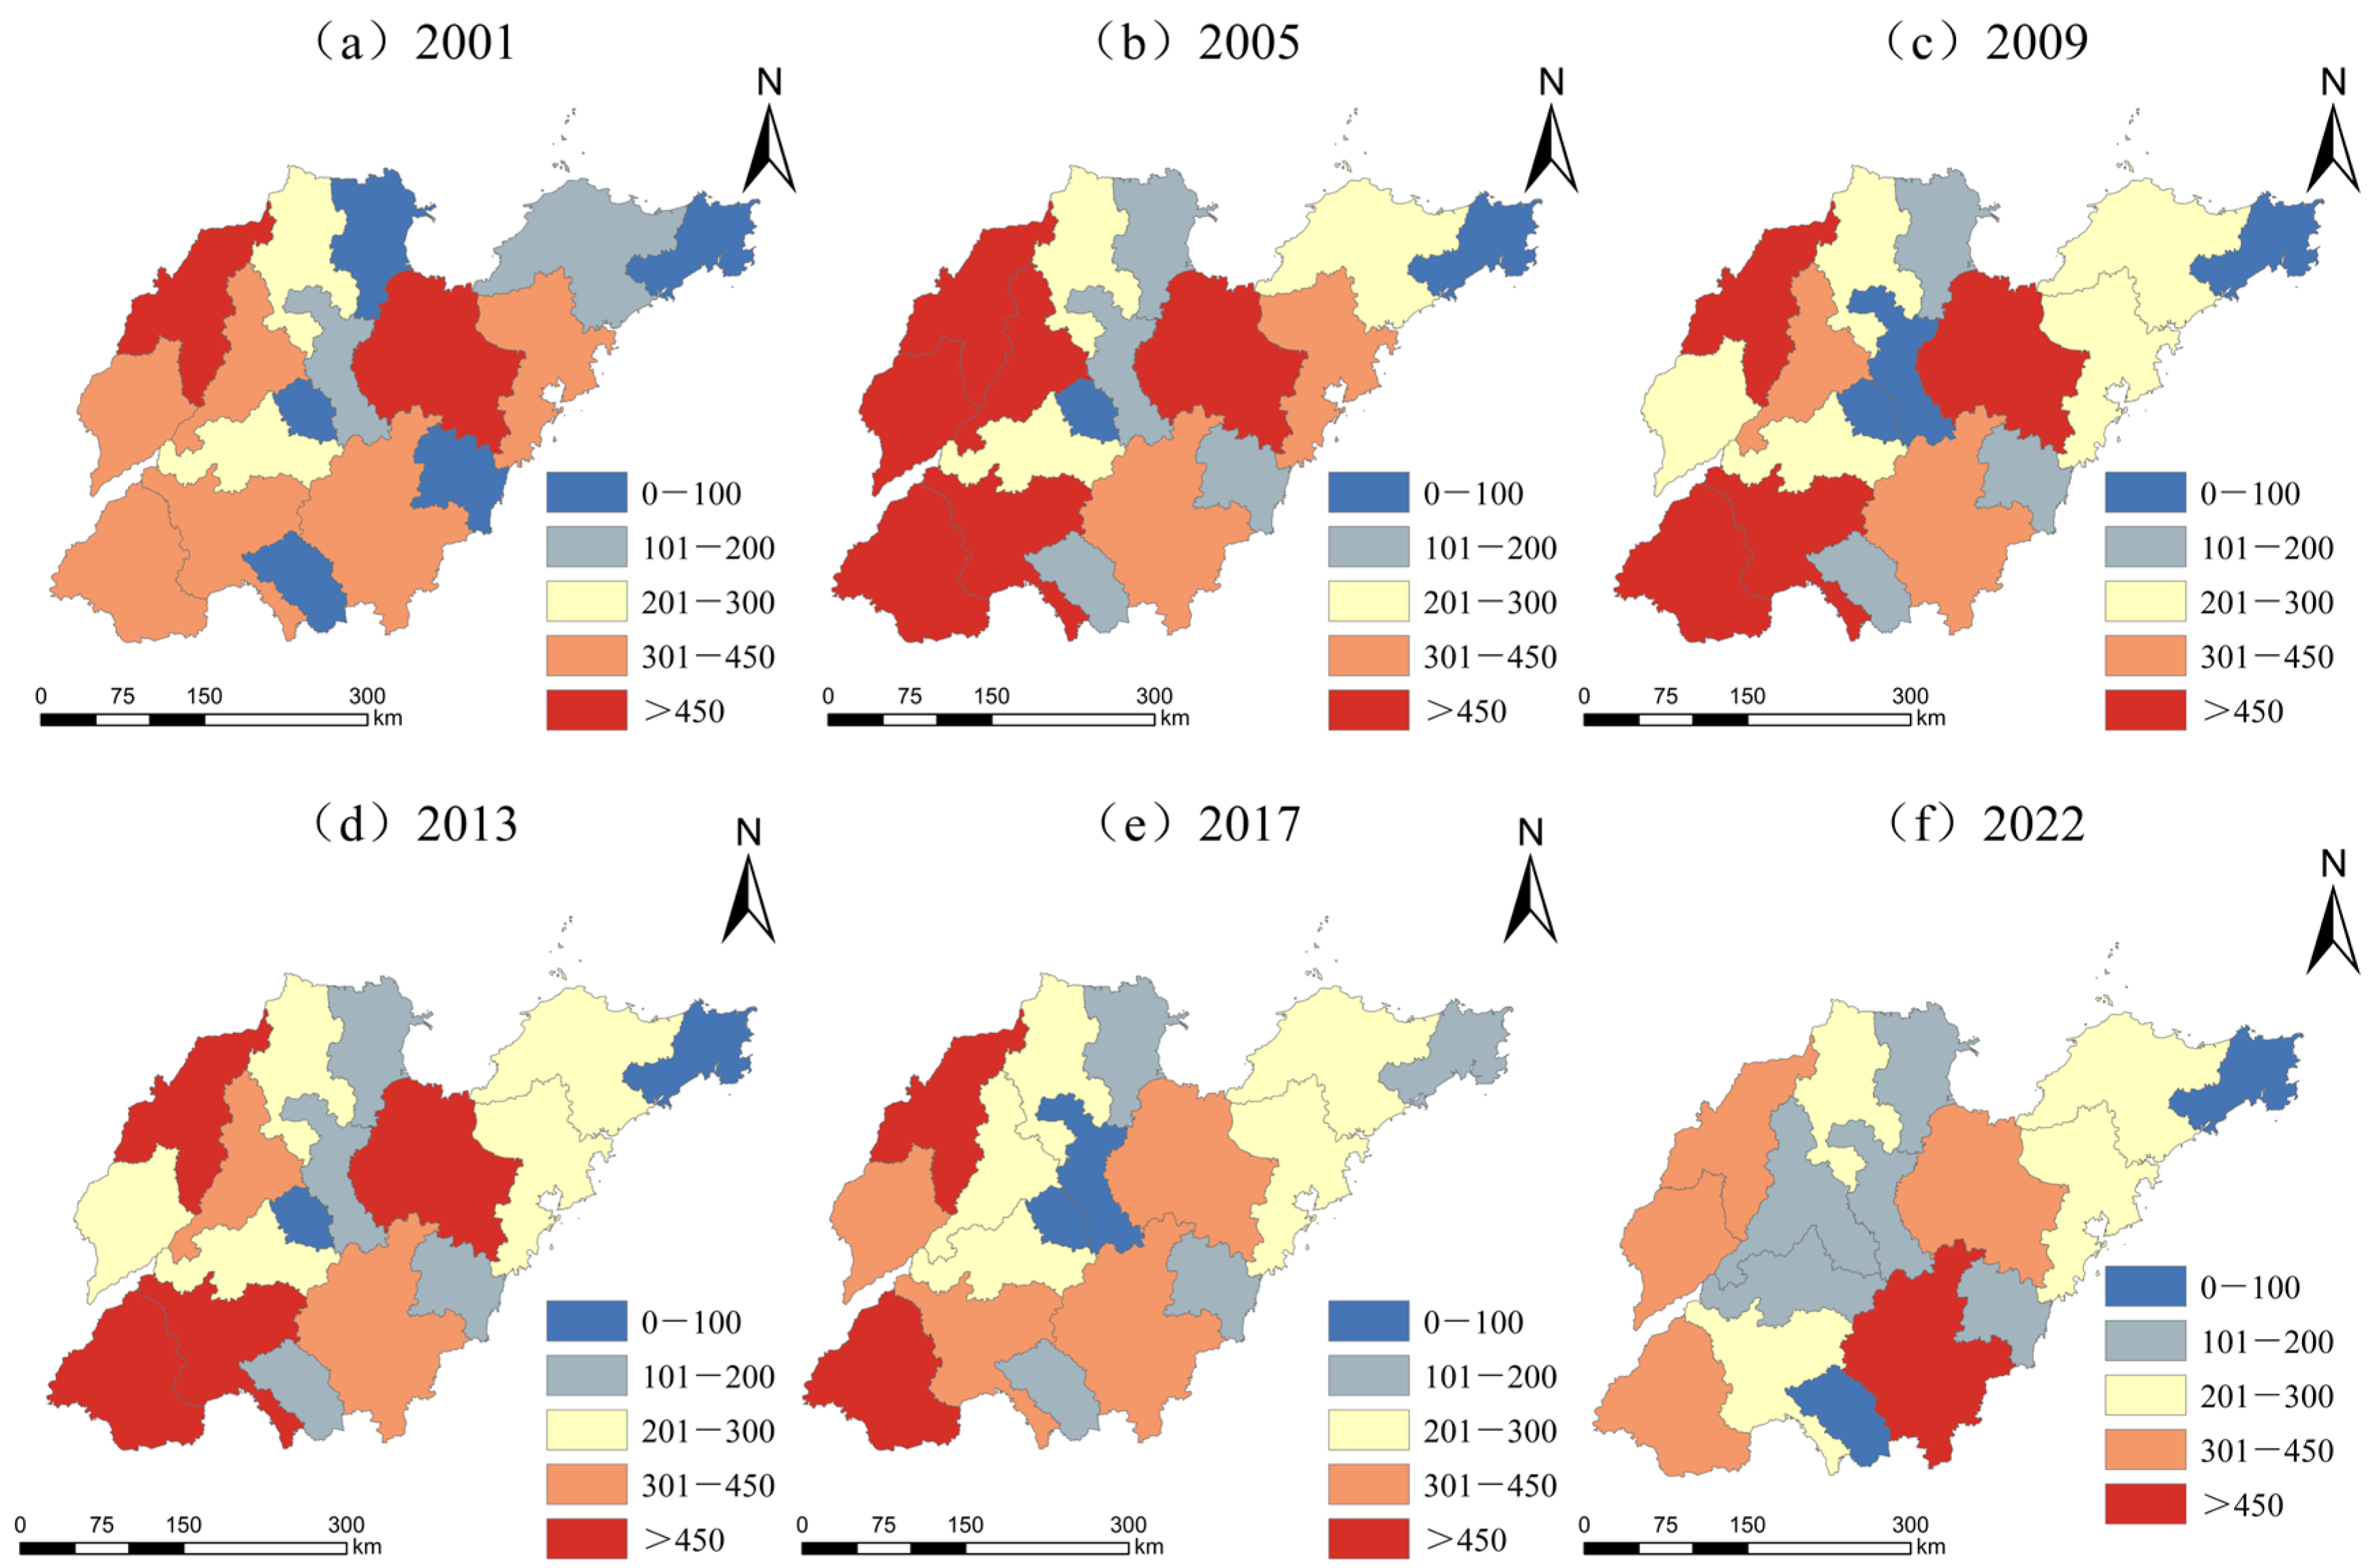
The carbon emission of animal husbandry in Shandong Province (city) shows a fluctuating downward trend, decreasing by 10.10%, but there are large differences in the increase and decrease of carbon emission by prefecture-level city, showing a distribution pattern of “periphery-agglomeration”. From 2001 to 2022, the carbon emissions of animal husbandry in Shandong Province are mainly concentrated in the peninsula and the west of Luzhong region. From 2001 to 2022, the carbon emissions from animal husbandry in Shandong Province are mainly concentrated in the western region represented by Liaocheng, Dezhou, and Heze, the peninsula region represented by Yantai and the central region of Shandong Province.
(2)
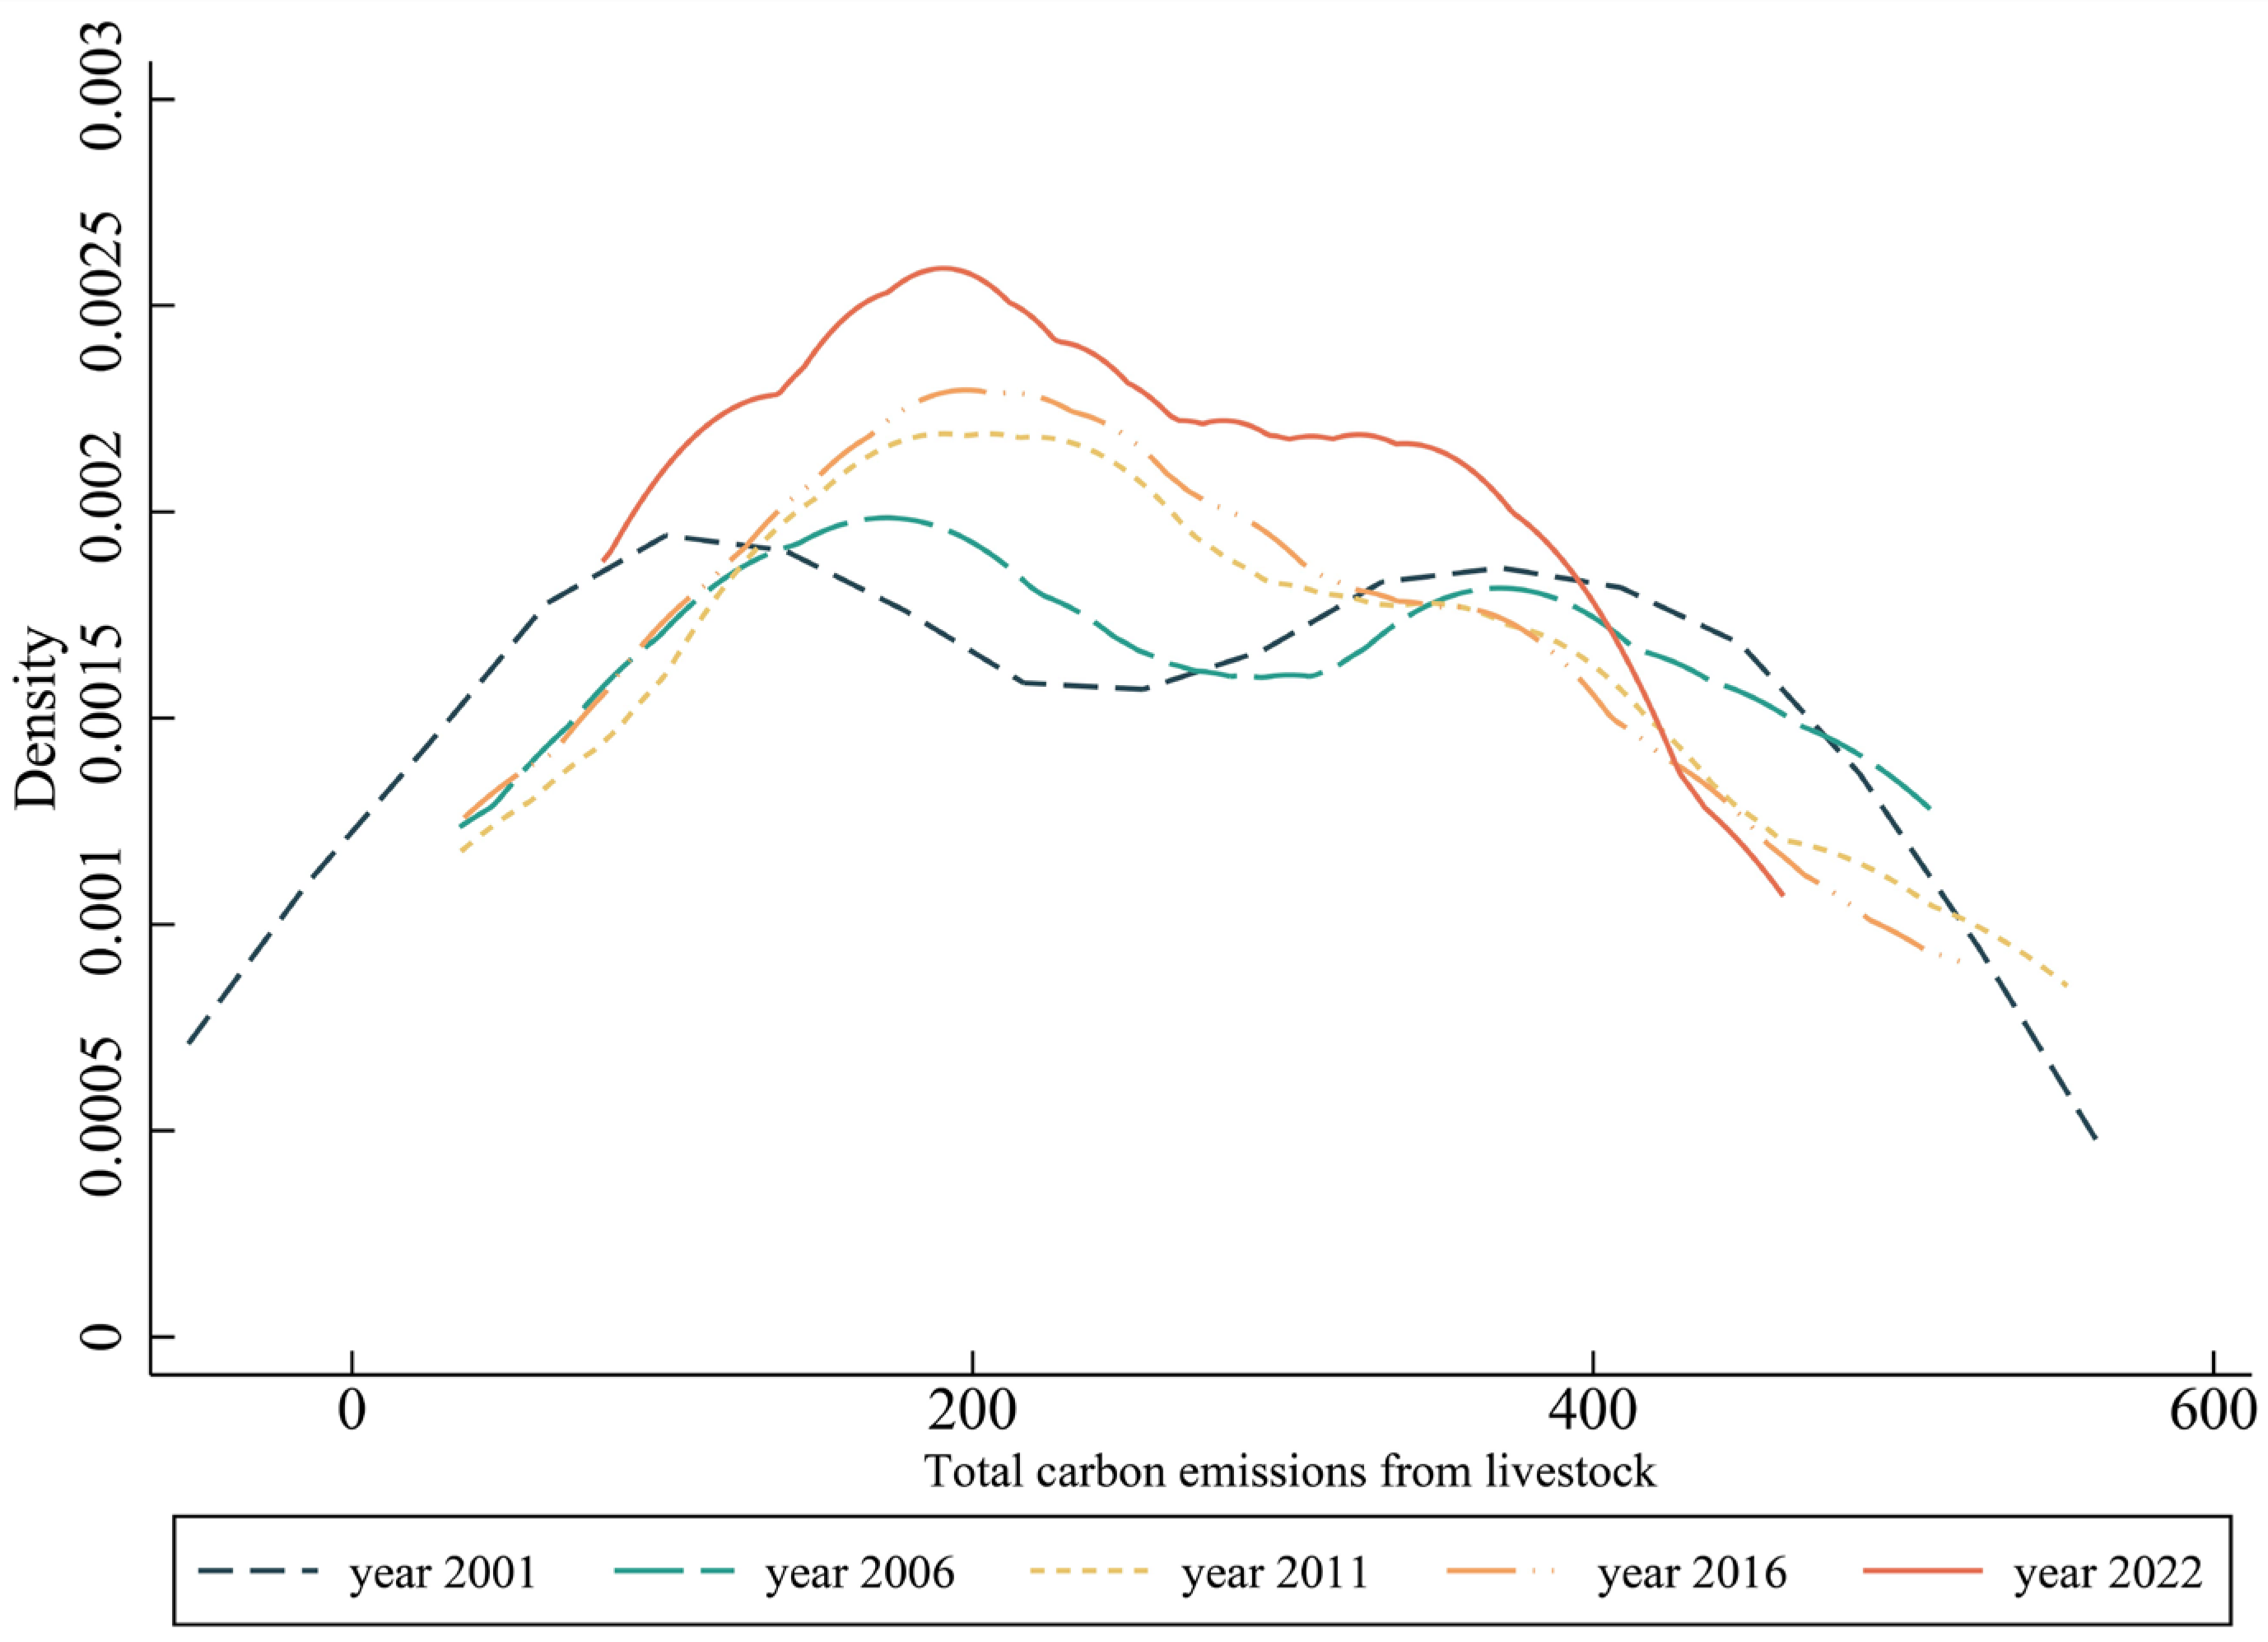
The carbon emission intensity of the livestock industry in Shandong Province shows a decreasing trend, from CNY 6.69 t/million in 2001 to CNY 1.31 t/million in 2022, a decrease of 7.47%. During the study period, there is a big difference among the cities in Shandong Province, and the carbon emission intensity shows a different degree of decrease, among which the carbon emission intensity in the western and central regions is significantly higher than that in the peninsular region, and the carbon emission intensity of the livestock industry in 16 cities and towns in Shandong Province shows a more obvious ladder-like distribution of “high in the west and low in the east”. From the dynamic evolution of the kernel density curve, the difference between high- and low-emission cities in the animal husbandry industry in Shandong Province is obvious, and they have experienced the process of expansion and contraction. The difference in livestock carbon emissions between cities in Shandong Province first increases and then decreases, with the distribution of growth basically in a “bimodal” pattern, and the differentiation between cities mainly in a polarized pattern.
(3)
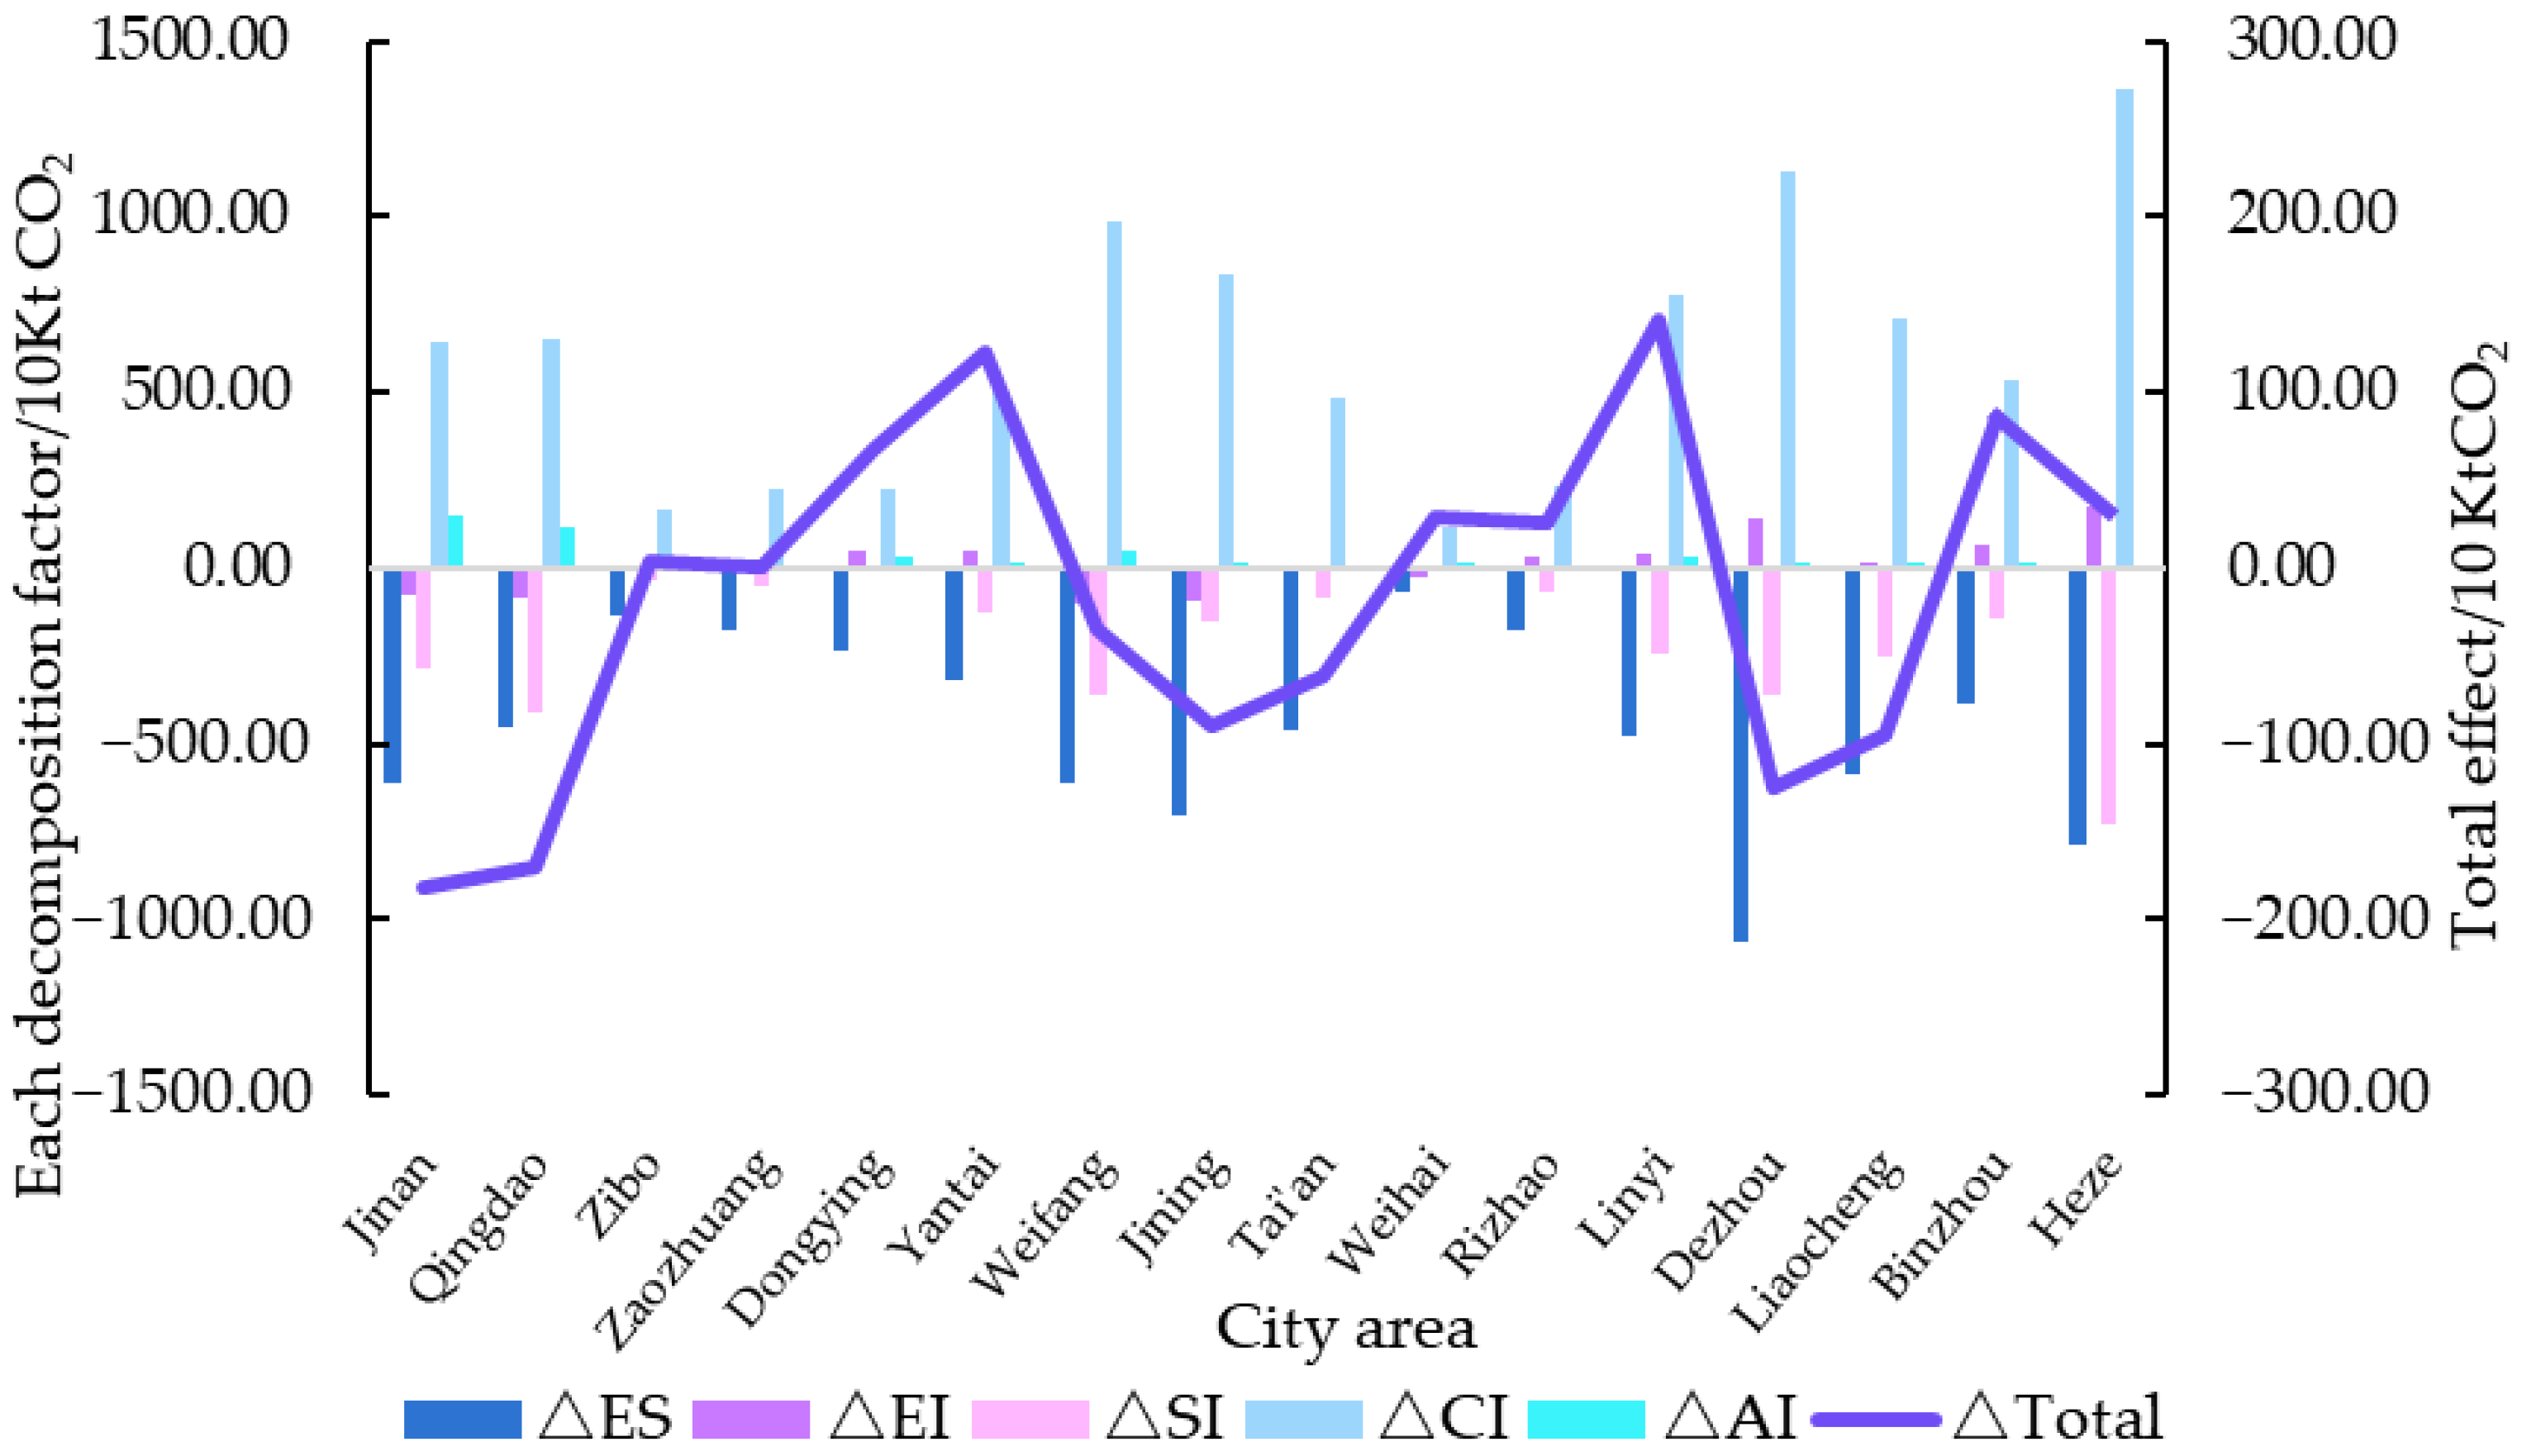
The carbon emissions of animal husbandry in Shandong Province are affected by a variety of factors, of which the intensity effect, the agricultural structure effect, and the industrial structure effect all have an inhibiting effect on carbon emissions from animal husbandry, and the three have achieved a cumulative total of 6740.97 10kt/CO2-eq, 342.47 10kt/CO2-eq, and 2826.13 10kt/CO2-eq of carbon emission reduction, which reduces carbon emissions to a certain extent. The economic level effect and the population scale effect are the main influences on the increase in carbon emissions from the livestock sector in Shandong Province, and they show positive driving effects in all years except for a slight decrease in the population size effect in 2022, which cumulatively leads to an increase in emissions of 9467.19 10kt/CO2-eq. The intensity effect and the industry structure effect are the main factors inhibiting the increase in carbon emissions from the livestock sector in all regions and municipalities. Due to the improvement in production efficiency, all regions have achieved carbon emission reduction from animal husbandry to a certain extent. However, the contribution of agricultural industry structure to carbon emission reduction in different municipalities was not consistent, while the economic effect and population scale effect contributed to a large extent to the increase of carbon emissions from animal husbandry in all municipalities in Shandong Province.

4.2. Policy Proposal

Based upon the above conclusions, the following policy recommendations are obtained: (1) Accelerate the pace of green breeding of livestock, and guide farmers to adopt clean production. Based on fully considering the land consumption capacity of each region and controlling local production capacity, we should strengthen the awareness of emission reduction of livestock breeding subjects, improve the use of manure resources, and further promote moderate-scale planting and breeding combined with family farms. Increase subsidies for the construction of livestock manure treatment facilities, and encourage livestock farmers to reduce, reuse, and recycle production methods. (2) It should increase the scientific research inputs of leading livestock enterprises in such areas as breed improvement and optimization of feed ratios and encourage enterprises to carry out clean technology innovations to reduce livestock manure at the source. In addition, the Government should create conditions to encourage and support the organized development of pig production, transform the results of clean technology innovation by enterprises into practical results, and guide farmers to carry out vertical cooperation in clean production. (3) The development of low-carbon livestock farming should be promoted according to local conditions. Localities should conduct targeting analyses and overall layouts of functional support facilities for important livestock in the region according to the internal structure of the local livestock industry and the level of agricultural development. For example, Dezhou, Jining, and Binzhou should focus on technological progress and optimization of agricultural structure to promote ruminant carbon emission reduction; Linyi, Weifang, and Heze should focus on cleaner production methods and improved manure treatment to promote pig farming carbon emission reduction. (4) Promote carbon emission reduction of animal husbandry. Cities in Shandong Province should combine the local resource endowment conditions, on the premise of ensuring that the total output of animal husbandry is not affected, give full play to their comparative advantages, actively adjust the industrial structure of animal husbandry, explore the key factors affecting the carbon emission of animal husbandry, maximize the reduction of carbon emissions from animal husbandry and realize the stable development of animal husbandry.
Measuring carbon emissions in this paper is constrained by data availability, for example, the average cost of coal and electricity produced by cattle breeding, which leads to some bias in the calculation results. Future research can adopt more precise methods, such as using more data or conducting specific analyses based on data from prefecture-level cities to obtain more accurate results; in addition, this paper only considers the above five influencing factors that cause carbon emissions from the livestock industry in Shandong Province and does not incorporate other influencing factors, which need to be more fully considered and improved in the next study.

Author Contributions

Conceptualization, Formal analysis, and Writing—review and editing, C.W.; Conceptualization, Methodology, Validation, Writing—original draft, and Manuscript preparation, Y.S.; Software development, Data curation, and Writing—review and editing, Y.H. and J.L.; Writing—review and editing, Y.Q. All authors have read and agreed to the published version of the manuscript.

Funding

This research received no external funding.

Institutional Review Board Statement

Not applicable.

Informed Consent Statement

Not applicable.

Data Availability Statement

The data used to support the findings of this study are available from the corresponding author upon reasonable request.

Acknowledgments

We extend our heartfelt appreciation to our mentors for their invaluable insights during each group meeting. We are also grateful to all the lab members for their contributions and engaging discussions during these sessions.

Conflicts of Interest

The authors declare that they have no known competing financial interests or personal relationships that could have appeared to influence the work reported in this paper.

References

  1. Fan, Z.; Qi, X.; Zeng, L.; Wu, F. Accounting of greenhouse gas emissions in the Chinese agricultural system from 1980 to 2020. Acta Eeologica Sin. 2022, 42, 9470–9482. [Google Scholar] [CrossRef]
  2. Cheng, M.; Yao, W. Trend prediction of carbon peak in China’s animal husbandry based on the empirical analysis of 31 provinces in China. Environ. Dev. Sustain. 2022, 26, 2017–2034. [Google Scholar] [CrossRef]
  3. Eggleston, S.; Buendia, L.; Miwa, K.; Ngara, T.; Tanabe, K.; Paustian, K.; Amstel, A.; Management, M.; Dong, H.; Hatfield, J.; et al. 2006 IPCC Guidelines for National Greenhouse Gas Inventories; IPCC: Geneva, Switzerland, 2006. [Google Scholar]
  4. EDGAR—Emissions Database for Global Atmospheric Research. 2023. Available online: https://edgar.jrc.ec.europa.eu/report_2023 (accessed on 23 April 2024).
  5. Rosenzweig, C.; Mbow, C.; Barioni, L.; Benton, T.; Herrero, M.; Krishnapillai, M.; Liwenga, E.; Pradhan, P.; Rivera-Ferre, M.; Sapkota, T.; et al. Climate change responses benefit from a global food system approach. Nat. Food 2020, 1, 94–97. [Google Scholar] [CrossRef] [PubMed]
  6. Liu, Y.; Yuan, Z.; Guo, L.; Sun, B.; Kong, W.; Tang, S. Carbon footprint of crop production and its spatial distribution characteristics in China. Chin. J. Appl. Ecol. 2017, 28, 2577–2587. [Google Scholar] [CrossRef]
  7. Jin, S.; Lin, Y.; Niu, K. Green transformation of agriculture driven by low carbon: Characteristics of China’s agricultural carbon emission and its emission reduction path. Reform 2021, 5, 29–37. [Google Scholar]
  8. Kamyab, H.; Saberikamarposhti, M.; Hashim, H.; Yusuf, M. Carbon dynamics in agricultural greenhouse gas emissions and removals: A comprehensive review. Carbon Lett. 2023, 34, 265–289. [Google Scholar] [CrossRef]
  9. Hao, D.; Wang, R.; Gao, C.; Song, X.; Liu, W.; Hu, G. Spatial-Temporal Characteristics and Influence Factors of Carbon Emission from Livestock Industry in China. Int. J. Environ. Res. Public Health 2022, 19, 14837. [Google Scholar] [CrossRef] [PubMed]
  10. Huo, L.; Yao, Z.; Zhao, L.; Luo, J.; Zhang, P. Current status and system construction of emission reduction and carbon sequestration standards in China’s agriculture and rural areas. Trans. Chin. Soc. Agric. Environ. Sci. 2023, 42, 242–251. [Google Scholar] [CrossRef]
  11. Wie, Z.; Wie, K.; Liu, J.; Zhou, Y. The relationship between agricultural and animal husbandry economic development and carbon emissions in Henan Province, the analysis of factors affecting carbon emissions, and carbon emissions prediction. Mar. Pollut. Bull. 2023, 193, 115134. [Google Scholar] [CrossRef]
  12. Rehman, A.; Ma, H.; Ozturk, I.; Ahmad, M. Examining the carbon emissions and climate impacts on main agricultural crops production and land use: Updated evidence from Pakistan. Environ. Sci. Pollut. Res. Int. 2022, 29, 868–882. [Google Scholar] [CrossRef]
  13. Lesschen, J.; Berg, M.; Westhoek, H.; Witzke, H.; Oenema, O. Greenhouse gas emission profiles of European livestock sectors. Anim. Feed Sci. Technol. 2011, 166, 16–28. [Google Scholar] [CrossRef]
  14. Rivera, A.; Güereca, L.; Lozano, M. Environmental impact of beef production in Mexico through life cycle assessment. Resour. Conserv. Recycl. 2016, 109, 44–53. [Google Scholar] [CrossRef]
  15. Zhuang, M.; Gongbuzeren; Li, W. Greenhouse gas emission of pastoralism is lower than combined extensive/intensive livestock husbandry: A case study on the Qinghai-Tibet Plateau of China. J. Clean. Prod. 2017, 147, 514–522. [Google Scholar] [CrossRef]
  16. Wisser, D.; Özkan, Ş.; Lanzoni, L. Pathways to Lower Emissions: A Global Assessment of the Greenhouse Gas Emissions and Mitigation Options from Livestock Agrifood Systems; FAO: Rome, Italy, 2023. [Google Scholar] [CrossRef]
  17. Weiss, F.; Leip, A. Greenhouse gas emissions from the EU livestock sector: A life cycle assessment carried out with the CAPRI model. Agric. Ecosyst. Environ. 2012, 149, 124–134. [Google Scholar] [CrossRef]
  18. Xu, J.; Wang, J.; Wang, T.; Li, C. Impact of industrial agglomeration on carbon emissions from dairy farming—Empirical analysis based on life cycle assessmsent method and spatial durbin model. J. Clean. Prod. 2023, 406, 137081. [Google Scholar] [CrossRef]
  19. Xue, Y.; Luan, W.; Wang, H.; Yang, Y. Environmental and economic benefits of carbon emission reduction in animal husbandry via the circular economy: Case study of pig farming in Liaoning, China. J. Clean. Prod 2019, 238, 117968.1–117968.8. [Google Scholar] [CrossRef]
  20. Zhao, C.; Liu, Y.; Yan, Z. Effects of land-use change on carbon emission and its driving factors in Shaanxi Province from 2000 to 2020. Environ. Sci. Pollut. Res. Int. 2023, 30, 68313–68326. [Google Scholar] [CrossRef]
  21. Lamb, W.; Wiedmann, T.; Pongratz, J.; Andrew, R.; Crippa, M.; Olivier, J.; Wiedenhofer, D.; Mattioli, G.; Khourdajie, A.; House, J.; et al. A review of trends and drivers of greenhouse gas emissions by sector from 1990 to 2018. Environ. Res. Lett. 2021, 16, 073005. [Google Scholar] [CrossRef]
  22. Cai, T.; Xia, F.; Yang, D.; Huo, J.; Zhang, Y. Decomposition of factors affecting changes in non-CO2 greenhouse gas emission intensity of China’s livestock sector based on the concept of “environment–food–economy”. Sci. Total Environ. 2019, 691, 611–620. [Google Scholar] [CrossRef]
  23. Zhang, M.; Bai, C.; Zhou, M. Decomposition analysis for assessing the progress in decoupling relationship between coal consumption and economic growth in China. Resour. Conserv. Recycl. 2018, 129, 454–462. [Google Scholar] [CrossRef]
  24. Chai, J.; Du, M.; Liang, T.; Sun, X.; Yu, J.; Zhang, Z. Coal consumption in China: How to bend down the curve? Energy Econ. 2019, 80, 38–47. [Google Scholar] [CrossRef]
  25. Dai, X.; Wu, X.; Chen, Y.; He, Y.; Wang, F.; Liu, Y. Real Drivers and Spatial Characteristics of CO2 Emissions from Animal Husbandry: A Regional Empirical Study of China. Agriculture 2022, 12, 510. [Google Scholar] [CrossRef]
  26. Kumari, S.; Fagodiya, R.; Hiloidhari, M.; Dahiya, R.; Kumar, A. Methane production and estimation from livestock husbandry: A mechanistic understanding and emerging mitigation options. Sci. Total Environ. 2020, 709, 136135. [Google Scholar] [CrossRef] [PubMed]
  27. Herrero, M.; Henderson, B.; Havlík, P.; Thornton, P.; Conant, R.; Smith, P.; Wirsenius, S.; Hristov, A.; Gerber, P.; Gill, M.; et al. Greenhouse gas mitigation potentials in the livestock sector. Nat. Clim. Chang. 2016, 6, 452–461. [Google Scholar] [CrossRef]
  28. Liu, R. Spatial-Temporal Characteristics and Prediction of Livestock Manure Pollution Load in Shandong Province. Master’s Thesis, Shandong Normal University, Jinan, China, 2018. [Google Scholar]
  29. Tilman, D.; Clark, M. Global diets link environmental sustainability and human health. Nature 2014, 515, 518–522. [Google Scholar] [CrossRef] [PubMed]
  30. Lin, J.; Hu, Y.; Cui, S.; Kang, J.; Xu, L. Carbon footprints of food production in China (1979–2009). J. Clean. Prod. 2015, 90, 97–103. [Google Scholar] [CrossRef]
  31. Hawkins, J.; Ma, C.; Schilizzi, S.; Zhang, F. China’s changing diet and its impacts on greenhouse gas emissions: An index decomposition analysis. Aust. J. Agric. Resour. Econ. 2017, 62, 45–64. [Google Scholar] [CrossRef]
  32. Popp, A.; Calvin, K.; Fujimori, S.; Havlik, P.; Humpenöder, F.; Stehfest, E.; Bodirsky, B.; Dietrich, J.; Doelmann, J.; Gusti, M.; et al. Land-use futures in the shared socio-economic pathways. Glob. Environ. Chang. 2015, 42, 331–345. [Google Scholar] [CrossRef]
  33. Zhang, L.; Reaihan, E.; Ali, M.; Lin, H.; Zhang, S.; Jin, S.; Zhu, Z.; Hu, J.; Yao, Y.; Sun, Y.; et al. Livestock and poultry manure management from the perspective of carbon neutrality in China. Front. Agric. Sci. Eng. 2023, 10, 341–362. [Google Scholar] [CrossRef]
  34. Huong, L.; Madsen, H.; Anh, L.; Ngoc, P.; Dalsgaard, A. Hygienic aspects of livestock manure management and biogas systems operated by small-scale pig farmers in Vietnam. Sci. Total Environ. 2014, 470–471, 53–57. [Google Scholar] [CrossRef]
  35. Bertrand, S.; Barnett, J. Standard method for determining the carbon footprint of dairy products reduces confusion. Anim. Front. 2011, 1, 14–18. [Google Scholar] [CrossRef]
  36. Shi, R.; Irfan, M.; Liu, G.; Yang, X.; Su, X. Analysis of the Impact of Livestock Structure on Carbon Emissions of Animal Husbandry: A Sustainable Way to Improving Public Health and Green Environment. Front. Public Health 2022, 10, 835210. [Google Scholar] [CrossRef]
  37. Dai, X.; Li, J.; He, Y.; Wang, F. Regional equity and efficiency of carbon emissions of China’s livestock industry in 2000–2020. Resour. Sci. 2023, 45, 62–76. [Google Scholar] [CrossRef]
  38. Sun, Y.; Yang, C.; Wang, M.; Xiong, X.; Long, X. Carbon Emission Measurement and Influencing Factors of China’s Beef Cattle Industry from a Whole Industry Chain Perspective. Sustainability 2022, 14, 15554. [Google Scholar] [CrossRef]
  39. Xie, H.; Chen, X.; Yang, M.; Zhao, H.; Zhao, M. Ecological footprint analysis of livestock products in China. Acta Ecol. Sin. 2009, 29, 3264–3270. [Google Scholar]
  40. Tan, Q. Greenhouse gas emission in China’s agriculture: Situation and challenge. China Popul. Resour. Environ. 2011, 21, 69–75. [Google Scholar]
  41. Meng, X.; Cheng, G.; Zhang, J.; Wang, N.; Zhou, H. Spatial and temporal characterization of greenhouse gas emissions over the whole life cycle of animal husbandry in China. China Environ. Sci. 2014, 34, 2167–2176. [Google Scholar]
  42. Sun, Y.; Liu, J.; Ma, Z. Evaluation of greenhouse gas emissions from scale dairy farm1. Trans. Chin. Soc. Agric. Eng. 2010, 26, 296–301. [Google Scholar]
  43. Li, Y.; Wang, J.; Yang, L. Analysis of spatial and temporal characteristics of agricultural carbon emissions in Hunan Province based on county scale. Chin. J. Agric. Resour. Reg. Plan. 2022, 43, 75–84. [Google Scholar]
  44. Zhu, Z.; Wang, Y.; Yan, T.; Zhang, Z.; Wang, S.; Dong, H. Greenhouse gas emissions from livestock in China and mitigation options within the context of carbon neutrality. Front. Agric. Sci. Eng. 2023, 10, 226–233. [Google Scholar] [CrossRef]
  45. Mizrahi, I.; Wallace, R.; Moraïs, S. The rumen microbiome: Balancing food security and environmental impacts. Nat. Rev. Microbiol. 2021, 19, 553–566. [Google Scholar] [CrossRef] [PubMed]
  46. Zheng, B.; Liang, H.; Wan, W.; Liu, Z.; Zhu, J.; Wu, Z. Spatial-temporal pattern and influencing factors of agricultural carbon emissions at the county level in Jiangxi Province of China. Trans. Chin. Soc. Agric. Eng. 2022, 38, 70–80. [Google Scholar] [CrossRef]
  47. Yao, C.; Qian, S.; Mao, Y.; Li, Z. Decomposition of impacting factors of animal husbandry carbon emissions change and its spatial differences in China. Trans. Chin. Soc. Agric. Eng. 2017, 33, 10–19. [Google Scholar] [CrossRef]
  48. Kafle, G.; Chen, L. Comparison on batch anaerobic digestion of five different livestock manures and prediction of biochemical methane potential (BMP) using different statistical models. Waste Manag. 2016, 48, 492–502. [Google Scholar] [CrossRef]
  49. Tauseef, S.; Premalatha, M.; Abbasi, T.; Abbasi, S. Methane capture from livestock manure. J. Environ. Manag. 2013, 117, 187–207. [Google Scholar] [CrossRef] [PubMed]
  50. Misselbrook, T.; Webb, J.; Chadwick, D.; Ellis, S.; Pain, B. Gaseous emissions from outdoor concrete yards used by livestock. Atmos. Environ. 2001, 35, 5331–5338. [Google Scholar] [CrossRef]
  51. Chen, D.; Li, Y.; Grace, P.; Mosier, A. N2O emissions from agricultural lands: A synthesis of simulation approaches. Plant Soil 2008, 309, 169–189. [Google Scholar] [CrossRef]
  52. He, Q.; Zhang, J. Research on the Dynamic Evolution and Driving Factors of Agricultural Carbon Emissions in Major Grain-Producing Areas. Ecol. Econ. 2023, 39, 123–128+162. [Google Scholar]
  53. Hu, W.; Zhang, J.; Wang, H. Study on the characteristics and influencing factors of agricultural carbon emissions in China. Stat. Decis. 2020, 36, 56–62. [Google Scholar] [CrossRef]
  54. Ang, B. LMDI decomposition approach: A guide for implementation. Energy Policy 2015, 86, 233–238. [Google Scholar] [CrossRef]
  55. Cui, K. Research on the Analysis of Rural Regional Economic Differences and Coordinated Development in Shandong Province. Master’s Thesis, Shandong University of Technology, Jinan, China, 2023. [Google Scholar]
  56. Tian, S.; Zheng, W.; Zhou, L. Analysis on the characteristics and causes of environmental Kuznets curve of low-carbon aquaculture in China. Resour. Sci. 2012, 34, 481–493. [Google Scholar]
  57. Su, B.; Ang, B. Demand contributors and driving factors of Singapore’s aggregate carbon intensities. Energy Policy 2020, 146, 111817. [Google Scholar] [CrossRef]
  58. Zhu, B.; Wang, K.; Chevallier, J.; Wang, P.; Wei, Y. Can China achieve its carbon intensity target by 2020 while sustaining economic growth? Ecol. Econ. 2015, 119, 209–216. [Google Scholar] [CrossRef]
  59. Zhao, B. Research on Carbon Emission Measurement and Spatial-Temporal Evolution in Henan Province. Master’s Thesis, Henan University, Kaifeng, China, 2014. [Google Scholar]
  60. Cao, H. Study on the Calculation and Influencing Factors of Animal Husbandry Carbon Emissions in Shandong Province. Master’s Thesis, Jilin Agricultural University, Changchun, China, 2023. [Google Scholar]
  61. Chen, Q.; Zhang, Y. The evolution of China’s animal husbandry carbon emission reduction policy-based on the analysis of 452 policy texts. J. Huazhong Agric. Univ. (Soc. Sci. Ed.) 2022, 1, 10–23. [Google Scholar]
Figure 1. Changes in total animal husbandry carbon emissions in Shandong Province in 2001, 2005, 2009, 2013, 2017, and 2022 (unit: 10kt/CO2-eq).
Sustainability 16 03640 g001
Figure 2. Kernel density estimation of animal husbandry carbon emissions in Shandong province (unit: 10kt/CO2-eq).
Sustainability 16 03640 g002
Figure 3. Decomposition results of influencing factors of animal husbandry carbon emissions in cities of Shandong Province from 2001 to 2022 (unit: 10kt/CO2).
Sustainability 16 03640 g003
Table 1. Carbon emission coefficients of each system boundary.
SystemLinkSymbolEmission CoefficientValuesUnitReference Source
Feed grain inputFeed grain cultivationefj1CO2-Equivalent Emission
Factor of Corne
1.50t/tXie et al., (2009) [39]
CO2-Equivalent Emission
Factor of Wheat
1.22t/t
Feed grain transport and processingefj2CO2-Equivalent Emission
Factor of Corn
0.0102t/tTan et al., (2011) [40]
CO2-Equivalent Emission
Factor of Soybean
0.1013t/t
CO2-Equivalent Emission
Factor of Wheat
0.0319t/t
Energy consumptionLivestock rearingefeCO2 Emission Factor of
Electricity Consumption
0.9734t/MW·hMeng et al., (2014) [41]
PriceeBreeding electricity unit price0.4275CNY/KW·h
efcCoal combustion CO2 emission factor1.98t/tSun et al., (2010) [42]
PricecUnit price of coal800CNY/t
Livestock products processingMJuEnergy consumption for processing pork products3.76MJ/kgMeng et al., (2014) [41]
Energy consumption for processing beef products4.37MJ/kg
Energy consumption in the processing of mutton products10.4MJ/kg
Energy consumption in the processing of poultry meat products2.59MJ/kg
Energy consumption in the processing of milk products1.12MJ/kg
Energy consumption in the processing of poultry and egg products8.16MJ/kg
eElectric heating value3.60MJ/KW·h-
Other conversion factors GWP CH 4 CH4 Global warming potential21-Meng et al., (2014) [41]
GWP N 2 O N2O Global warming potential310
Table 2. Carbon emission factors of gastrointestinal fermentation and manure management system of livestock.
SpeciesCH4 [kg/(Head·a)]N2O [kg/(Head·a)]Reference Source
Gastrointestinal FermentationManure Management
Cattle52.903.310.85Zheng et al., (2022) [46]
Mule10.000.901.39Yao et al., (2017) [47]
Donkey10.000.901.39
Horse18.001.641.39
Pig1.003.500.53
Sheep5.000.160.33
Rabbit0.2540.080.02
Poultry0.000.020.02
Note: a represents the year of the livestock feeding cycle.
Table 3. Changes in total animal husbandry carbon emissions in Shandong Province.
RegionTotal Animal Husbandry Carbon Emissions (Unit: 10kt/CO2-eq)Rate of Change
200120032006200920112013201620192022
Shandong 4379.334908.104738.053783.273899.284085.604312.773840.093936.95−10.10
Jinan372.15 435.12 437.69 323.89 329.12 340.47 318.54 241.91 191.26 −0.49
Qingdao399.50 437.44 429.86 257.95 259.05 257.11 234.45 228.05 228.81 −0.43
Zibo100.05 118.60 87.43 89.05 102.05 104.77 92.17 93.60 104.75 0.05
Zaozhuang82.23 102.47 126.48 119.85 132.89 137.65 141.70 89.88 82.38 0.00
Dongying89.77 111.55 133.80 135.64 156.85 161.34 105.79 127.68 156.70 0.75
Yantai160.26 204.80 254.00 233.67 237.71 228.98 252.32 303.99 283.18 0.77
Weifang454.12 485.58 466.93 456.45 508.91 522.66 519.89 433.79 419.36 −0.08
Jining371.98 446.89 407.11 414.81 448.56 460.02 337.34 304.18 282.09 −0.24
Tai’an211.12 265.40 228.72 236.14 266.15 286.25 285.55 187.38 150.20 −0.29
Weihai51.03 66.64 79.16 84.02 92.86 98.84 98.80 99.26 80.75 0.58
Rizhao93.00 105.07 109.15 99.04 116.97 120.90 135.88 134.30 118.42 0.27
Laiwu27.68 34.65 34.71 32.65 35.18 35.74 36.11 ---
Linyi319.58 352.55 327.70 348.47 378.06 382.99 402.88 418.07 461.31 0.44
Dezhou482.28 565.03 510.72 511.05 552.79 599.16 507.62 461.83 357.10 −0.26
Liaocheng412.75 452.02 282.80 256.68 281.61 283.84 297.37 286.66 318.05 −0.23
Binzhou204.94 238.03 230.62 243.24 279.81 272.12 236.68 255.66 290.82 0.42
Heze379.49 477.20 492.95 451.83 473.92 500.89 493.79 541.73 411.81 0.09
Note: Laiwu City was incorporated into Jinan City in 2019; the change rate is the proportion of animal husbandry carbon emissions in 2022 compared with 2001 (rate of change (unit: %)).
Table 4. Changes in carbon emission intensity of animal husbandry in Shandong Province.
RegionCarbon Emission Intensity of Animal Husbandry (Unit: t/104 CNY)Rate of ChangeAAGR
200120032006200920112013201620192022AVG
Shandong6.695.904.082.251.801.731.701.591.312.76 −80.40−7.47
Jinan7.27 7.14 5.16 3.21 2.42 2.18 1.91 1.67 1.12 3.27 −84.56−8.51
Qingdao5.27 5.09 3.99 2.22 1.66 1.57 1.34 1.36 1.29 2.44 −75.44−6.47
Zibo5.36 5.22 2.97 2.56 2.00 1.86 1.49 1.54 1.36 2.52 −74.65−6.33
Zaozhuang5.11 4.82 3.64 3.45 2.06 1.94 1.67 1.42 1.13 2.57 −77.90−6.94
Dongying7.86 7.13 5.06 3.36 2.71 2.50 1.57 1.65 1.33 3.44 −83.09−8.11
Yantai4.53 4.62 3.74 2.60 1.98 1.79 1.60 1.59 1.22 2.50 −73.04−6.05
Weifang4.60 4.42 3.25 2.22 1.96 1.79 1.58 1.51 1.24 2.36 −73.02−6.05
Jining5.43 4.92 3.31 2.62 1.97 1.87 1.21 1.17 0.93 2.41 −82.81−8.04
Tai’an6.03 5.85 3.67 2.58 1.98 1.76 1.50 1.25 0.86 2.61 −85.69−8.84
Weihai2.94 3.12 2.34 1.67 1.48 1.31 1.16 1.45 1.23 1.80 −57.97−4.04
Rizhao5.06 4.92 4.17 1.97 2.02 1.91 1.87 1.58 0.97 2.55 −80.88−7.58
Laiwu5.00 4.93 3.81 1.50 1.25 1.25 1.11 --- --
Linyi5.57 5.21 3.61 2.65 2.65 2.49 2.17 1.94 1.52 2.92 −72.65−5.99
Dezhou11.54 11.16 6.05 3.54 3.06 2.93 2.23 2.10 1.42 4.50 −87.70−9.50
Liaocheng9.47 8.76 3.98 2.83 2.45 2.34 2.00 2.00 1.63 3.65 −82.78−8.04
Binzhou7.83 7.29 5.43 3.23 2.67 2.28 1.77 2.22 1.57 3.57 −79.90−7.36
Heze10.05 9.35 6.14 4.41 4.01 3.75 3.47 3.29 1.87 4.85 −81.38−7.69
Note: Laiwu City was incorporated into Jinan City in 2019; the change rate is the proportion of animal husbandry carbon emissions in 2022 compared with 2001 (rate of change (unit: %); AVG (%) stands for average value; AAGR (%) stands for average annual growth rate).
Table 5. Decomposition of Factors for Changes in Carbon Emissions from Animal Husbandry in Shandong Province, 2001–2022 (unit: 10kt/CO2).
StagesYearΔESΔEIΔSIΔCIΔAIΔTotal
One2001–200224.75161.97−342.94453.7720.53318.07
2002–2003−625.76169.47288.35355.9622.68 210.70
2003–2004−1099.39162.14−123.31939.8829.22 −91.45
2004–2005−939.0169.18−459.92791.3233.65 −504.78
2005–2006845.62−786.93−416.74754.5029.73 426.18
2001–2006−1793.79−224.17−1054.563295.43135.81358.72
Two2006–2007−2172.79383.33−93.49722.0125.74 −1135.21
2007–2008−860.23376.83−56.31626.1119.46 105.87
2008–2009109.57−274.82−82.37301.1621.02 74.56
2009–2010−89.92−167.84−150.48487.7444.00 123.51
2010–2011−808.42386.01−135.98516.0234.88 −7.49
2011–201213.60−51.24−112.26363.4217.82 231.34
2012–2013−186.97−238.80−18.72383.4216.05 −45.03
2013–2014−126.46−77.10−94.37259.4925.87 −12.57
2007–2014−4121.62336.37−743.983659.37204.84−665.02
Three2014–2015−137.2566.32−216.67325.3324.20 61.92
2015–2016148.37125.30−353.18211.7845.56 177.82
2016–2017163.51−230.01−269.34 274.1125.76 -35.97
2017–201829.43−235.24−120.11218.9718.52 -88.44
2018–2019−314.13−149.55−112.25216.1311.53 -348.27
2019–2020−570.7043.6376.1894.2521.36 -335.27
2020–2021−108.8512.63−42.39474.111.81337.30
2021–2022−35.93−87.7410.18211.08−2.7694.83
Cumulative total−6740.97−342.47−2826.138980.57486.62−442.38
Disclaimer/Publisher’s Note: The statements, opinions and data contained in all publications are solely those of the individual author(s) and contributor(s) and not of MDPI and/or the editor(s). MDPI and/or the editor(s) disclaim responsibility for any injury to people or property resulting from any ideas, methods, instructions or products referred to in the content.

