Article

Assessing Consumer Implications of Reduced Salmon Supply and Environmental Impact in North America

1
Agri-Food Analytics Lab, Dalhousie University, Halifax, NS B3H 4R2, Canada
2
Faculty of Management, Dalhousie University, Halifax, NS B3H 4R2, Canada
3
Department of Biology, University of Toronto, Mississauga, ON L5L1C6, Canada
4
Faculty of Agriculture, CRC in Sustainable Aquaculture, Dalhousie University, Halifax, NS B3H 4R2, Canada
5
Faculty of Arts, University of Manitoba, Winnipeg, MB R3T 2N2, Canada
6
Department of Economics, Bangabandhu Sheikh Mujibur Rahman Science and Technology University, Gopalganj 8100, Bangladesh
*
Author to whom correspondence should be addressed.
Sustainability 2024, 16(9), 3629; https://0-doi-org.brum.beds.ac.uk/10.3390/su16093629
Submission received: 18 March 2024 / Revised: 17 April 2024 / Accepted: 22 April 2024 / Published: 26 April 2024

Abstract

:
This study investigates the impact of the Canadian government’s decision to reduce the supply of farm-raised salmon in British Columbia (BC) on domestic prices, the level of imports, and the environment. By drawing upon data from diverse sources, this study employs the SARIMAX model to forecast future trends in salmon prices up to 2026. The forecasted results reveal that retail salmon prices will exhibit greater unpredictability and a predicted price increase of over CAD 30 per kilogram by 2026. In addition, increased consumption of imported salmon due to BC farm closure is expected to contribute to heightened carbon emissions and result in job losses within rural and indigenous communities. In short, BC salmon farm closure carries profound consequences for both the environment and market dynamics.

1. Introduction

The aquaculture sector in British Columbia (BC) stands out as a global exemplar of conscientious seafood cultivation practices [1]. Salmon farming, introduced in the early 1970s, thrives in the cool, well-flushed waters of BC, particularly in regions like the Broughton Archipelago and the West Coast Sounds. These geographic features, coupled with BC’s prime location on Canada’s west coast, position it as a commercial crossroads between the Asia-Pacific region and North America. With aquaculture accounting for 60% of Canada’s overall salmon production in quantity and value, the industry wields significant influence over both provincial and national economies [2]. Consequently, the salmon industry in BC strengthens Canada’s position as the fourth-largest producer globally, trailing only behind Norway, Chile, and the UK.
According to a comprehensive report published by the BC Salmon Farmers’ Association (BCSFA) in autumn 2020, the BC salmon farming sector generated CAD 1.9 billion in economic activity. This translated to an infusion of CAD 721 million into Canada’s Gross Domestic Product (GDP) and provided employment to 7560 Canadian citizens. However, salmon farming in BC is undergoing closure, which has a multifaceted historical context shaped by environmental concerns, economic interests, and governmental responses. Salmon farming in the region has been a contentious issue for decades, with its economic benefits counterbalanced by environmental impacts, including disease transmission to wild salmon populations, pollution from waste, and the spread of sea lice [3]. The collapse of wild salmon populations in the early 2000s heightened scrutiny of the industry, leading to inquiries such as the Cohen Commission, which identified salmon farms as a potential threat to wild salmon stocks [3].
In recent years, public concern and activism surrounding salmon farming in BC have grown significantly, with Indigenous communities, environmental organizations, and citizens calling for stricter regulations or even the cessation of the industry due to its environmental impacts [4]. This pressure culminated in the provincial government’s decision. In a significant development on 17 December 2020, the former Minister of Fisheries, Oceans, and the Canadian Coast Guard, Bernadette Jordan (the current minister is Diane Lebouthillier), issued a declaration outlining the federal government’s intent to gradually phase out existing salmon farming installations within the Discovery Islands (DI) region [5,6]. A lack of social license was cited as the reason for the decision.
The closure of salmon farms in the Discovery Islands in 2022 reduced salmon farming in BC by 24% [7], and the further transition plan includes reduction in current licenses by up to 50%. While the decision has been welcomed by environmentalists and Indigenous groups, concerns have been raised about the economic impact on coastal communities that rely on the industry for employment and income [8] and its significant and far-reaching impact on the North American marketplace. Farm-raised salmon, the most popular seafood choice of Canadians, has long been BC’s top agri-food export and has one of the lowest carbon footprints of animal proteins [9,10]. The direct consequence of curtailing the remaining 65,800 tonnes of farmed salmon production is the triggering of substantial economic disruptions and food insecurity. Specifically, the BC salmon farming sector will face an annual economic loss of CAD 1.2 billion across Canada, a CAD 447 million decrease in GDP contributions, the elimination of over 4690 job opportunities, and a resulting reduction in family incomes of CAD 266 million annually.
This development should be seen in the context of a global salmon market characterized by historically high levels of demand. The impending reduction in domestic supply has the potential to exacerbate this already heightened demand, a situation with multifaceted repercussions. Canada’s imports of salmon have increased rapidly since 2021; Canada imported approximately 20,000 tonnes more salmon in 2022 than in previous years, generating 58,000 more tonnes of CO2—equal to the emissions of 80,000 vehicles/year [11]. Price stability or volatility depends on a complex interplay of factors, including domestic production, global supply chains, currency exchange rates, government policies, and market dynamics. An increase in imports has the potential to contribute to greater retail price fluctuations in Canada, which, in turn, might influence the overall domestic demand for salmon. It was estimated that higher salmon imports in 2022 generated approximately 9.9 million tonnes of CO2, which was more than in 2020. The average Canadian vehicle releases 4.6 tonnes of CO2 into the atmosphere every year. The estimated increase in CO2 emissions released by the increased imports is equal to the emissions released by 2,152,000 vehicles a year in Canada [12,13].
Hence, the closure of BC salmon farms highlights their significant influence on environmental and market dynamics. Therefore, it is imperative to undertake a comprehensive examination and meticulous analysis of the implications of this decision for consumers. Given these considerations, the primary objective of this study is to discern the impact of curtailing the supply of BC farm-raised salmon on consumer pricing dynamics within the North American market. Three fundamental objectives underpin this study: (i) to discern and evaluate the intricate correlation between BC salmon farming and consumer pricing dynamics within the Canadian market; (ii) to scrutinize the multifaceted ramifications that result from the constrained operations of BC salmon farming under prevailing market conditions and investigate the dynamics governing consumer pricing within the broader North American context; and (iii) to investigate the prospective consequences associated with the reduction in the Canadian salmon supply and the concomitant expansion of the carbon footprint within the North American market.
This study concludes that the decision to close BC farms reverberates far beyond the boundaries of supply and demand. It has brought about transformative effects on salmon supply, consumer pricing dynamics, and market conditions while exacting a toll on environmental conditions through the upsurge in carbon emissions resulting from increased salmon imports in North America. The convergence of these multifaceted challenges underscores the intricate interplay between economic, environmental, and market forces, prompting a re-valuation of the strategies and policies governing the aquaculture industry.
The remainder of this study is organized as follows. Section 2 presents an overview of the existing literature on aquaculture and its implications for food security. Section 3 outlines the methodology and data employed in this research. Section 4 presents the results and discussion. Section 5 focuses on the forecasting of the main variables, and Section 6 concludes the study.

2. Literature Review

Food security, a fundamental aspect of human well-being, encompasses not only the quantitative dimension of food availability but also the nuanced aspects of accessibility and the temporal consistency of both availability and access [14]. With the global population projected to surge to 9.8 by 2050, representing a substantial increase in food demand, the imperative for sustainable food production practices becomes ever more pressing. It will necessitate a corresponding rise in food consumption by a margin of 60% to 100% [15,16]. In the face of this challenge, aquaculture emerges as a beacon of sustainable promise, poised to contribute significantly to the pursuit of food security, encompassing broader socio-economic dimensions beyond mere sustenance.
Currently, aquaculture stands as the leading sector in global food production, playing a pivotal role in ensuring food security for millions [17,18]. Fish, a primary product of aquaculture, nourish 3.3 billion people globally, accounting for a significant 20% of their animal protein intake. Notably, per capita fish consumption has witnessed a remarkable upsurge, from a modest 9 kg in 1961 to a substantial 20.5 kg in 2018, highlighting its growing significance in diets worldwide [17,18].
With its lower ecological footprint compared to terrestrial animal farming, aquaculture emerges as a sustainable alternative for meeting the rising demand for animal-derived protein [19,20,21,22,23]. Moreover, seafood products, particularly those from aquaculture, offer essential nutrients and fatty acids crucial for human health, which are often lacking in terrestrial alternatives [24,25,26,27,28,29].
In the broader context of sustenance, fisheries and aquaculture remain steadfast pillars, providing sustenance, nutritional strength, economic stimulus, and livelihoods to vast populations worldwide [24,27,29,30]. With its growing trajectory, aquaculture distinguishes itself by demonstrating a lower ecological footprint compared to alternative sources of animal-derived food. In some regions, domestic aquaculture directly enhances food security through internal consumption, while in others, its contribution takes an indirect path, fostering economic prosperity through export-oriented growth [23,31].
In the specific context of salmon aquaculture, the interplay of economic prosperity and food security becomes evident. For instance, Canada’s reliance on salmon consumption reflects a dynamic blend of domestic sustenance and export-driven growth [32]. Over the past decade, while Canada’s salmon exports remained stable, domestic demand surged, leading to an increase in imports to meet the shortfall [32]. This trend underscores the critical role of salmon aquaculture in supporting both internal food security objectives and economic prosperity through trade [33].
Aligned with this trend, Canadian protein consumption from fish and seafood reached 8.5% in 2019, surpassing other meat proteins such as pork (6.2%) and all other meats (6.1%) [34]. Hence, aquaculture, particularly salmon farming, stands as a multifaceted solution to the challenges of food security, offering sustainable production practices, nutritional benefits, and economic opportunities. As nations navigate the complexities of meeting their food needs in a rapidly changing world, the role of aquaculture, including salmon farming, remains indispensable in shaping a secure and resilient food future.

3. Methodology and Data

In this paper, we employ machine learning models, specifically the SARIMAX model, to predict salmon prices using historical data from Canada and the U.S. The data were preprocessed for consistency, and the SARIMAX model was selected for its effectiveness in incorporating seasonality and exogenous variables. We analyzed the model’s performance using the Mean Absolute Error (MAE) to measure the accuracy of the predictions. This approach provides a clear, data-driven basis for forecasting salmon market conditions.

3.1. Machine Learning in Salmon Price Prediction

Predicting salmon prices is fundamentally a time-series task, and machine learning approaches are renowned for their power and flexibility [35]. These methods encompass advanced supervised learning algorithms, such as regression models [36], facilitating the forecasting of salmon prices, a critical endeavor for market participants [37]. The extensive application of machine learning models to predicting salmon prices has provided valuable insights and opportunities to the salmon industry [38,39]. However, research in this area remains relatively scarce. Bloznelis [37] conducted short-term salmon price forecasting of Norwegian-farmed Atlantic salmon prices, achieving accurate predictions up to five weeks ahead using methods like k-nearest neighbor and vector error correction.
In a recent study by Bjørnstad et al. (2023) [40], four forecasting models—Autoregressive Integrated Moving Average (ARIMA), Seasonal Autoregressive Integrated Moving Average (SARIMA), Seasonal Autoregressive Integrated Moving Average Exogenous (SARIMAX), and Long Short-Term Memory (LSTM)—were developed and tested on historical data, with the SARIMAX model outperforming others due to its consideration of seasonality. The process of predicting salmon prices using machine learning models involves analyzing historical data from Canada and the U.S. to gain data-driven insights into the salmon market’s dynamics. Subsequently, following McHugh et al. [41], this study, leveraging the SARIMAX model, aims to develop a forecasting tool to predict future salmon prices and market conditions.
SARIMAX, a robust time-series forecasting model, combines the capabilities of ARIMA with exogenous variables, proving particularly effective in predicting prices and other time-dependent data. By summarizing statistical information for each exogenous variable, SARIMAX characterizes price dynamics comprehensively. The accuracy of the SARIMAX model is evaluated using metrics like the Mean Absolute Error (MAE), which measures the mean absolute difference between predicted values and actual values in a dataset. A lower MAE indicates a better fit of the model to the data. However, it is important to note that MAE is presented on the same scale as the target prediction, and there is no universal rule for an ideal MAE score—it must be interpreted within the context of the specific dataset being analyzed.

3.2. Data

This study draws data from diverse sources, enabling a comprehensive examination of salmon production and market conditions in both Canada and the United States. Government repositories like Statistics Canada [42], the BC Government [43], the U.S. Census Bureau, and the Department of Fisheries and Oceans Canada [44] were utilized, alongside non-conventional sources such as gray literature and popular media outlets like CBC News and documents from the BC Farmers Association. Additional insights into salmon transition strategies in BC were gathered from the Global Salmon Production and Market Update by Kontali and Nielsen’s Salmon Retail Sales Report in the United States.
For Atlantic salmon production, a publicly available dataset spanning 1991–2021 from Statistics Canada was used to analyze historical trends and project future patterns. Retail salmon price data from January 2017 to April 2022 was sourced from Statistics Canada, which facilitated the scrutiny of historical price trends and the construction of a forecasting model. Concurrently, salmon sales data were obtained from Nielsen’s salmon retail sales report, covering the years 2017 to 2022. To comprehensively understand consumer demand in both Canada and the U.S., a dataset pertaining to Canadian seafood consumption from 2017 to 2022 from Nourish Food Marketing was compiled.
Insights into market distribution were collected through data on Atlantic salmon trade volume and supply from the Government of Canada’s online trade records and the U.S. Census Bureau, spanning 2019 to 2022. Supplementary information sources, such as Kontali’s Global Salmon Production and Market Update, enhanced the understanding of salmon market dynamics in North America.

4. Results and Discussion

4.1. Global Atlantic Salmon Production and Canada Share

To gain a comprehensive understanding of the scale and capacity of salmon aquaculture in Canada, particularly within the province of BC, we conducted a detailed analysis of historical data pertaining to salmon production. Our investigation reveals a notable trend: Canada’s share of global salmon production has exhibited a downward trajectory, starting at 5.3% in 2019 and consistently declining to 4.9% in 2020. This proportion remained stable in both 2021 and 2022 (see Table 1). It is worth noting that BC plays a pivotal role in this context, as it significantly contributes to the global salmon market.
Salmon production and its associated economic value in Canada have generally followed an upward trajectory over the years, despite experiencing marginal declines in 2004, 2014, and 2022. Nonetheless, these brief setbacks were swiftly rectified as production levels rebounded in the subsequent year. In the contemporary context, the dynamics of salmon production and its corresponding economic worth have shown a degree of volatility. Specifically, from 2017 to 2021, salmon production fluctuated within the range of 120,553 tonnes to 120,186 tonnes. Concurrently, the monetary value of this production witnessed a decline, decreasing from CAD 1.05 million in 2017 to CAD 0.99 million in 2021. These trends warrant closer examination and analysis within the context of Canada’s salmon industry (see Figure 1).

4.2. Retail Price of Salmon

In line with global and Canadian production trends, it is crucial to understand the historical affordability dynamics of salmon. Figure 2, without adjusting for inflation’s impact on food affordability, offers a comprehensive view of the average monthly retail price per kilogram from January 2017 to June 2023. The data reveals a volatile pattern in salmon pricing, marked by numerous fluctuations throughout the year.
Of particular note are the highest price points for salmon (all types), observed around May 2022, reaching a peak of CAD 29.16 per kilogram, and similarly in May 2023, hitting a comparable peak at CAD 29.09. These fluctuations underscore the significant volatility in the salmon market, prompting further examination within the context of economic analysis and consumer behavior. It is important to emphasize that importing a food commodity, such as salmon, introduces additional variables and can contribute to increased volatility in retail prices [47,48]. Price stability or volatility depends on a complex interplay of factors, including domestic production, global supply chains, currency exchange rates, government policies, and market dynamics.

4.3. Market Distribution

In the global Atlantic salmon trade, Canada ranks as the second-largest supplier to the United States, with Chile occupying the top position. A clear trend in this trade landscape is the declining trend in salmon exports from Canada. From 2019 to 2022, there was a notable drop of 18% in the volume of salmon Canada exported to the United States. By 2022, Canada’s share of the U.S. salmon market had contracted to 14%. This decline in Canadian salmon exports to the United States holds considerable significance and warrants a thorough analysis in the field of international trade studies (see Figure 3).
The United States serves as the primary recipient of Canadian Atlantic salmon exports, with the second-largest portion allocated for domestic consumption. As illustrated in Figure 4, the decrease in salmon production led to a reduction in export volume from 2019 through 2022. Concurrently, there has been a notable capacity to adequately satisfy domestic demand (see Figure 4).

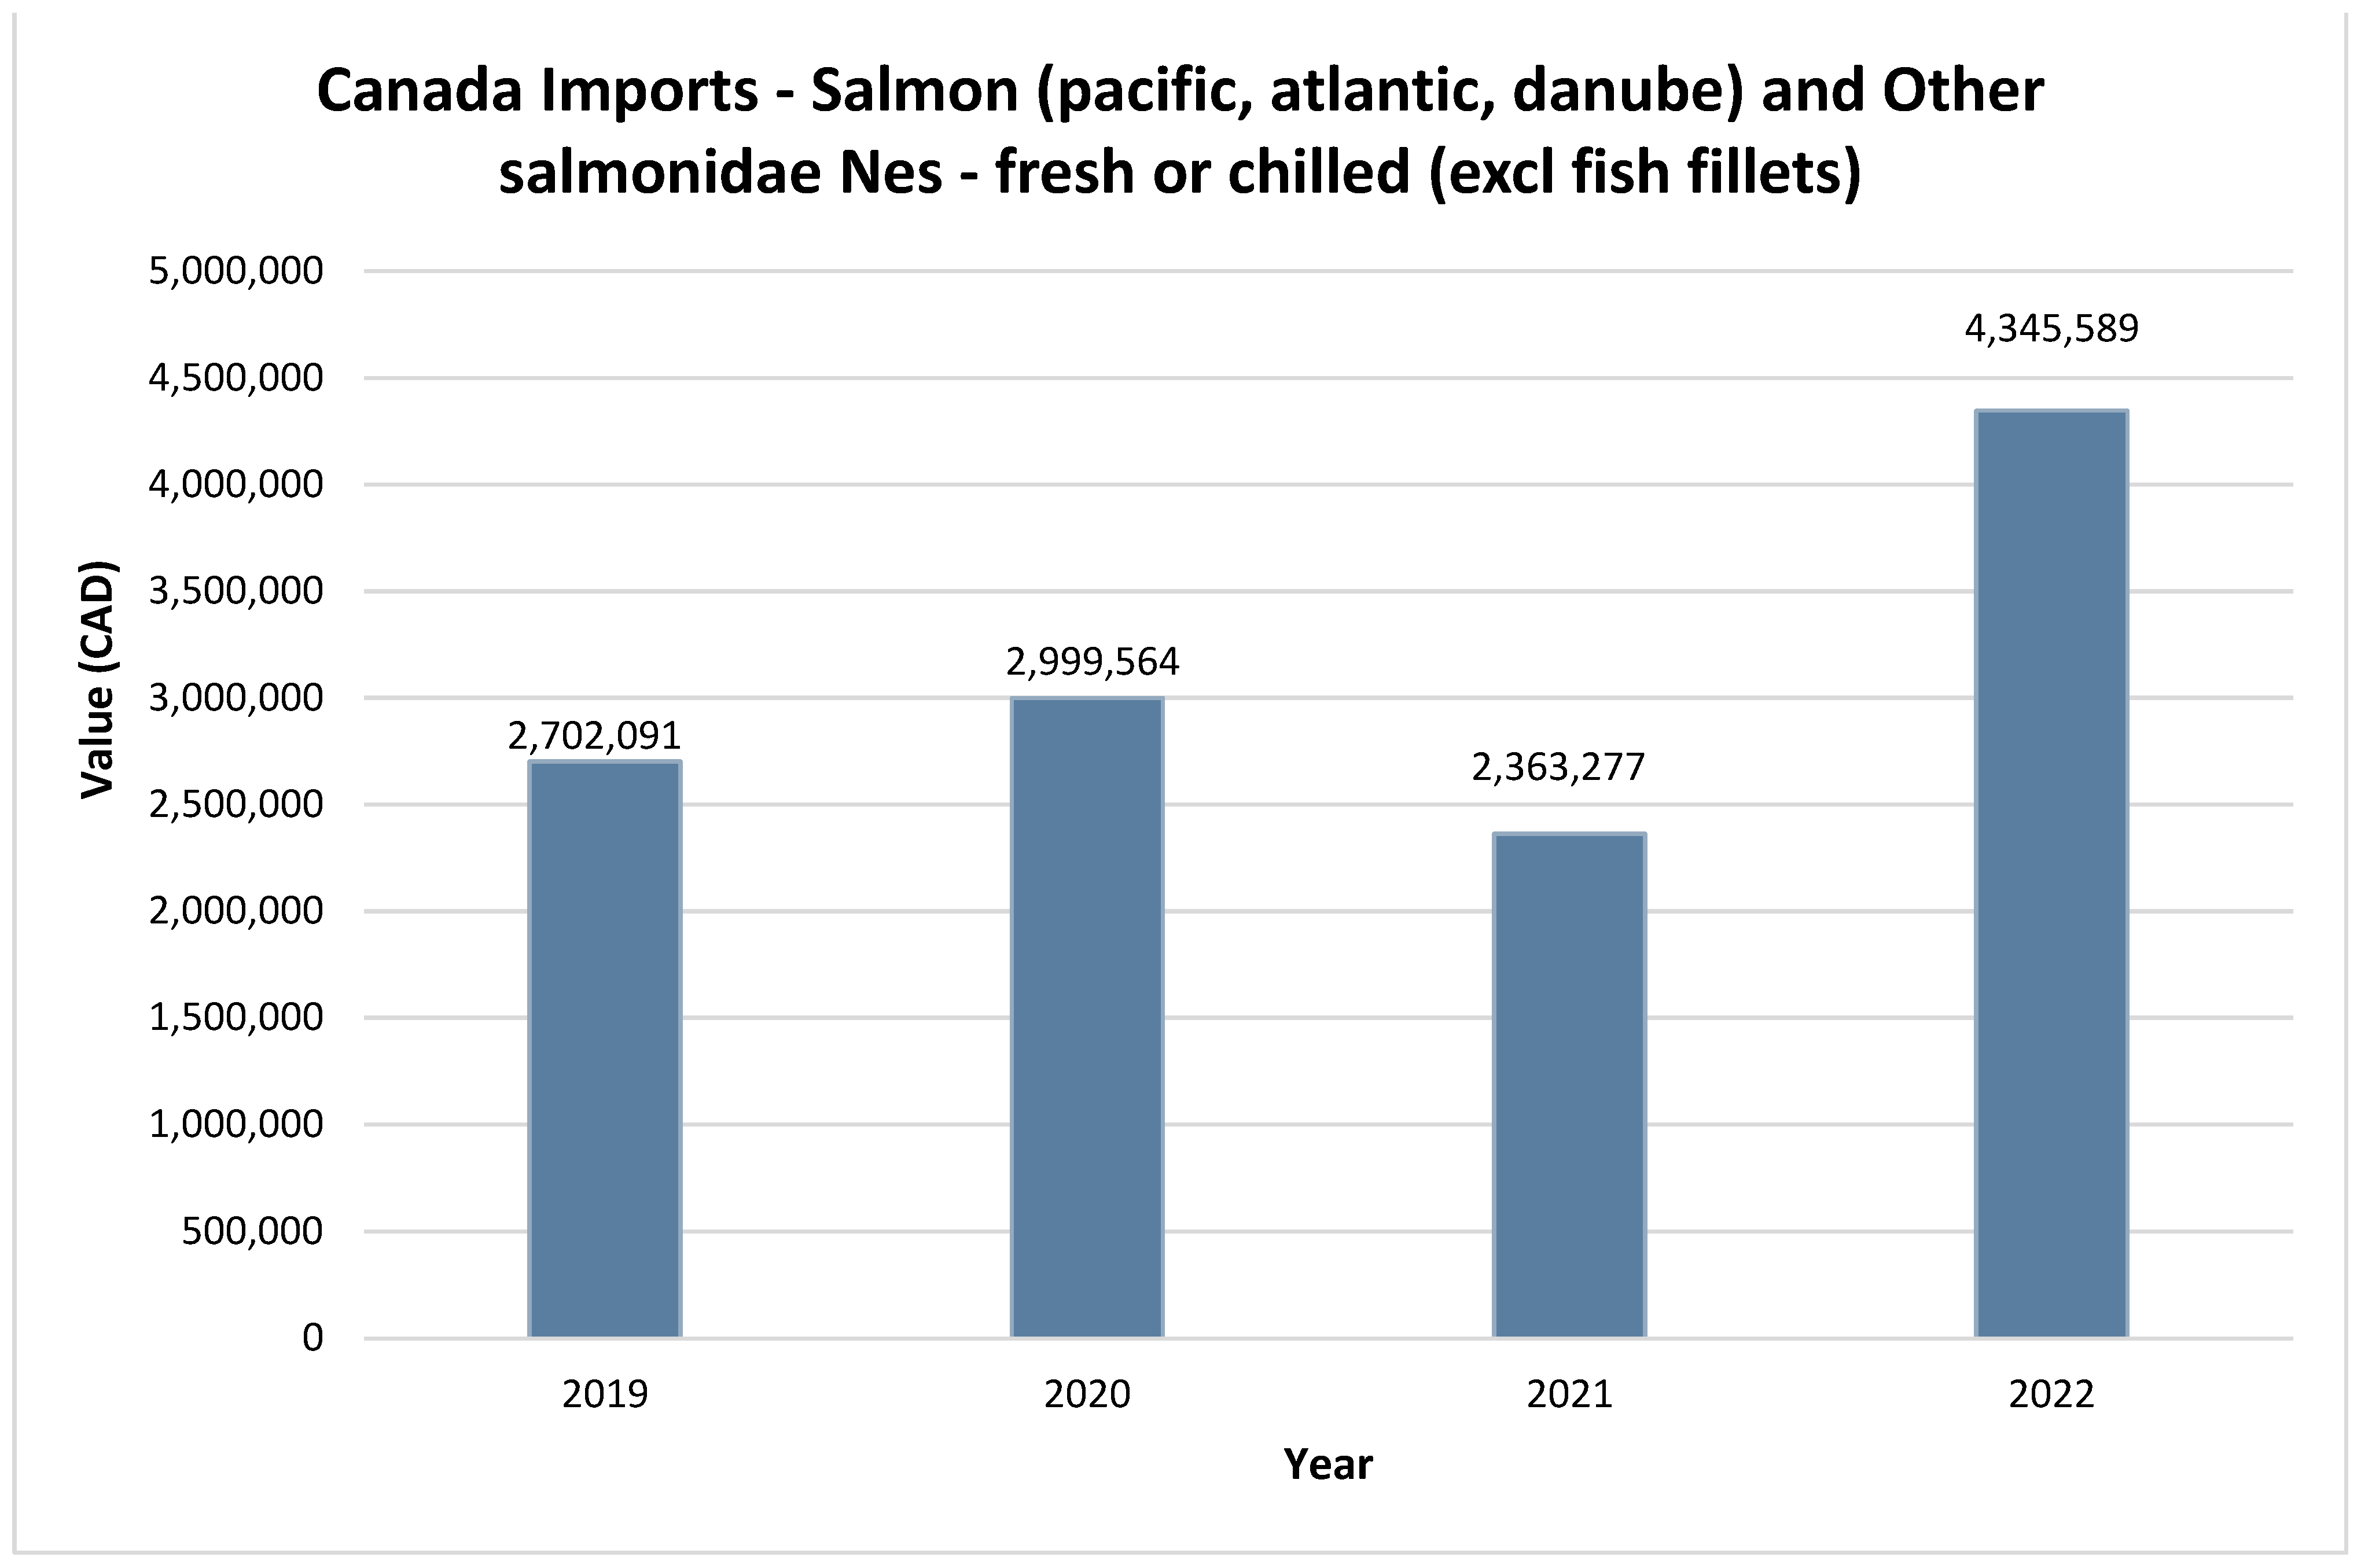
4.4. Market Shares of Salmon (Imports)—Canada

During the period from 2019 to 2022, the importation of salmon exhibited a substantial upward trajectory. In specific terms, the volume of salmon imports surpassed the 2 million mark in 2019 and witnessed a significant surge, exceeding 4 million units by the year 2022. This pronounced increase in salmon imports underscores a notable trend in international trade dynamics, warranting scholarly scrutiny and analysis within the context of this study (see Figure 5). Given the limited data availability on Atlantic salmon imports, the analysis encompasses the volume of Pacific, Atlantic, and Danube Salmonidae imports.

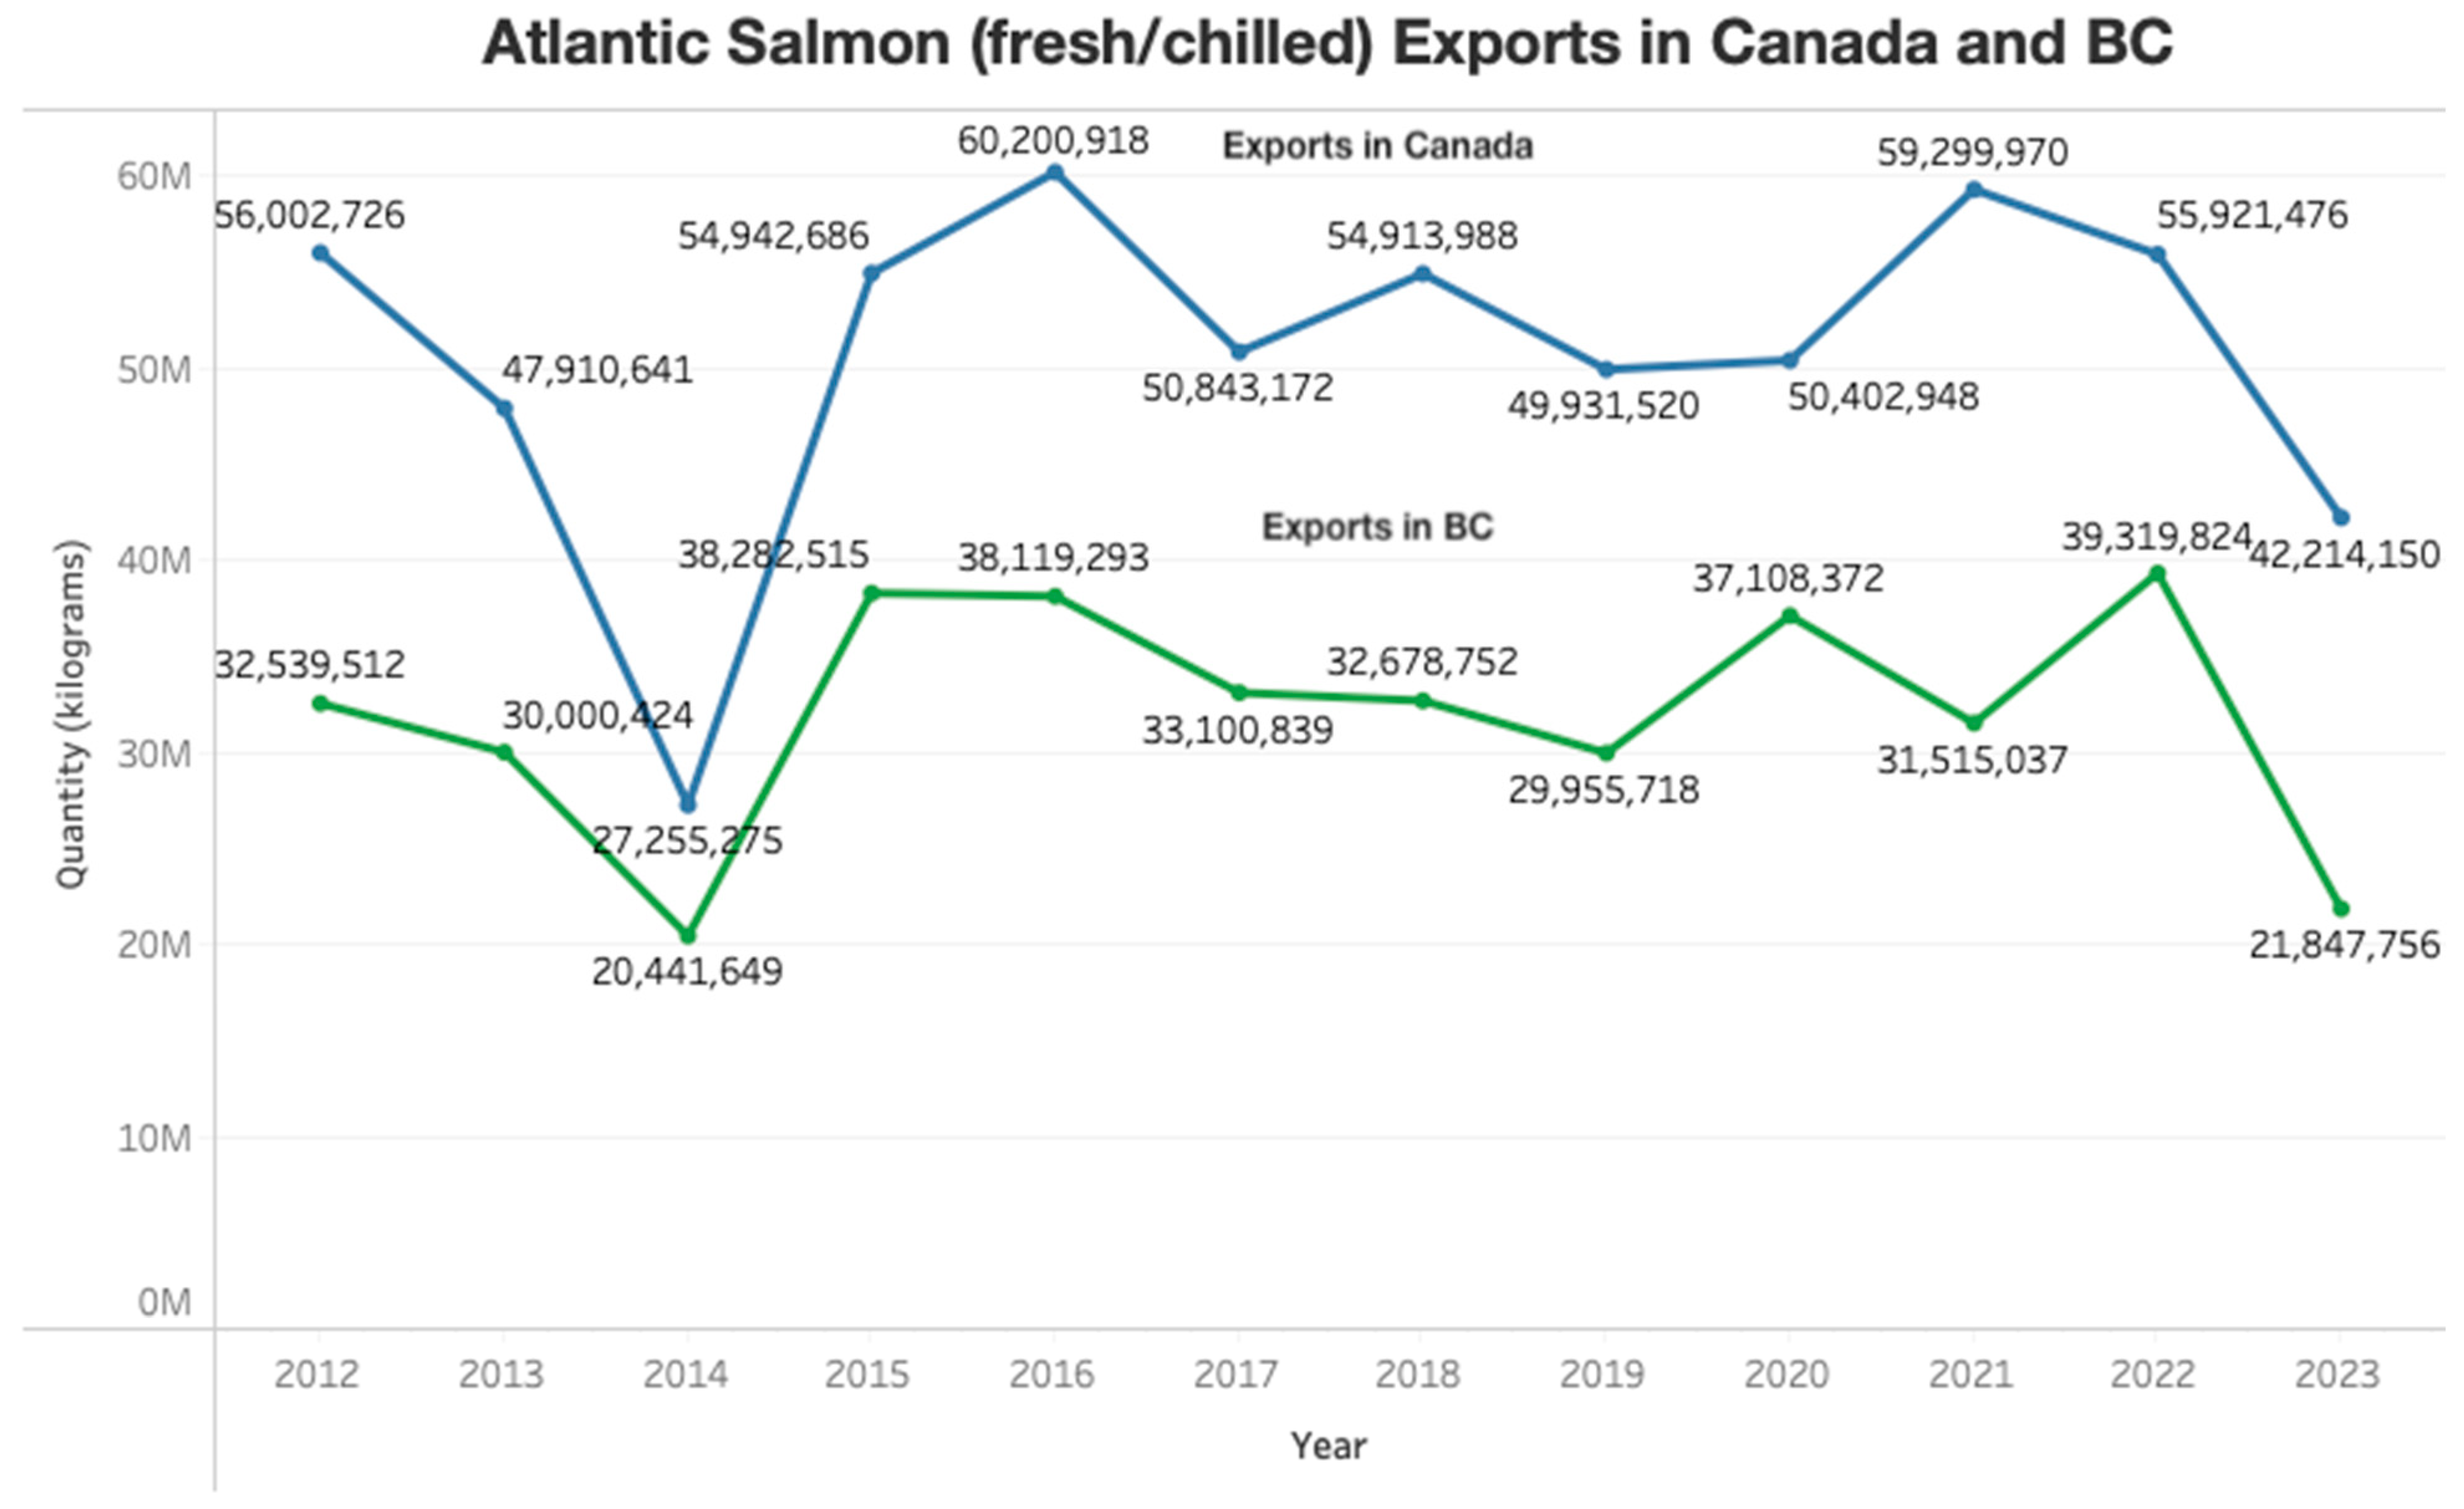
4.5. Farmed Atlantic Salmon Supply in Canada and BC

Figure 6 presents the exports of farmed Atlantic salmon from 2012 (January–August) to 2023 (January–August). The blue line represents Canadian exports, while the green line represents exports specifically from the BC region. Notably, from 2021 to 2023, exports in Canada decreased from 59,300 tonnes to 42,214 tonnes. Similarly, exports from BC mirrored this trend, with quantities dropping from 31,515 tonnes to 21,848 tonnes. The graph clearly demonstrates the interdependence of Canadian exports of farmed Atlantic salmon on BC exports.

4.6. Canadian Farmed Atlantic Salmon Supply, World versus USA

Between 2021 and 2023, the global supply of farmed Atlantic salmon has exhibited a substantial contraction, characterized by a pronounced decline in both quantity and value. Specifically, the total volume of Atlantic salmon supplied to international markets has experienced a substantial reduction, decreasing from 59,300 tonnes to 42,214 tonnes from August 2021 to August 2023. Concomitantly, exports of farmed Atlantic salmon to the United States, a critical market in this context, have declined from 56,697 tonnes to 40,816 tonnes. This marked reduction in export volume to the United States underscores a substantial shift in the dynamics of the international Atlantic salmon trade landscape (see Figure 7).

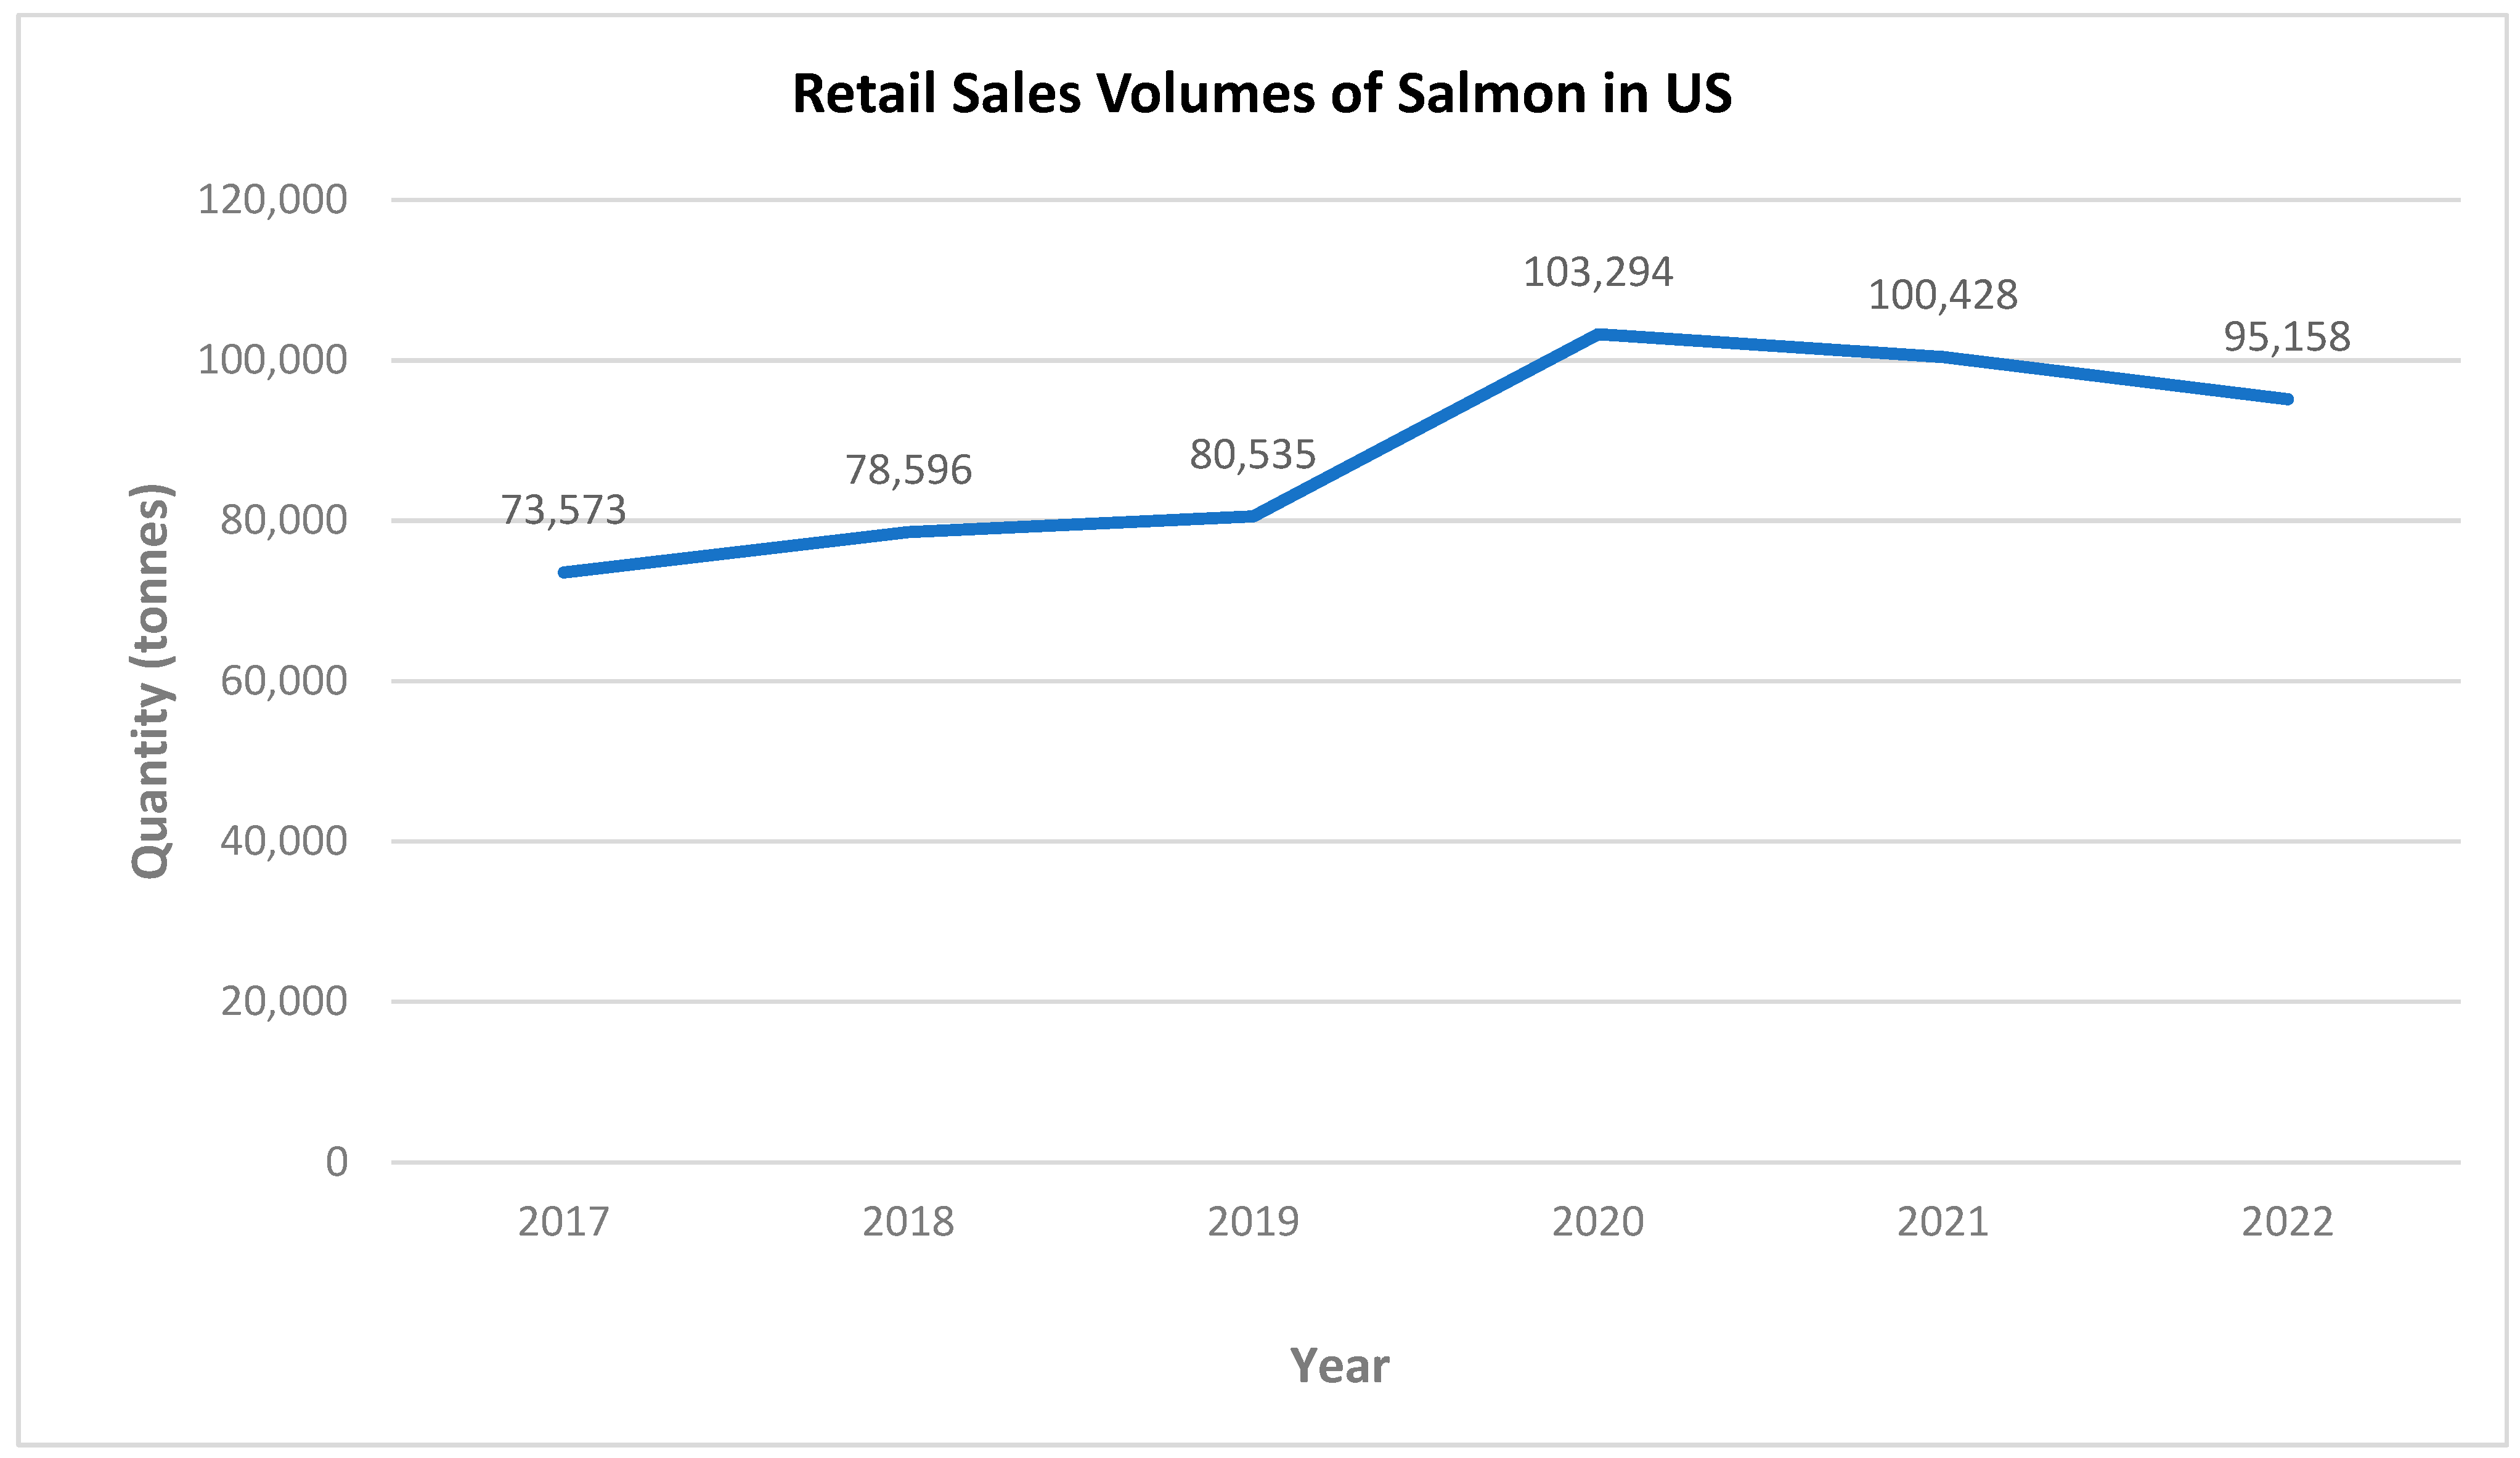
4.7. Salmon Sales and Consumer Demand

The trajectory of salmon retail sales exhibited a significant upward trend from 2017 through 2020. Nevertheless, in the subsequent years, there has been a consistent and discernible decline in sales, resulting in a volume of 95,158 metric tonnes recorded in 2022 (see Figure 8).

4.8. Seafood Consumption in Canada

Studies show that fish and seafood hold a prominent place in the Canadian diet. A survey conducted in 2023 (Colombo and Charlebois (2023), unpublished) revealed that 86.7% of Canadians regularly include fish and seafood in their meals. The primary reason to eat seafood is nutrition (64%), rather than affordability (21%). In terms of regional feeding preferences, BC tops the list, with the highest preference for fish and seafood consumption every week (45.8%). In contrast, Quebec has the lowest weekly consumption rate (27.2%) (refer to Figure 9).
Household income significantly influences preferences for farmed fish. Households with incomes exceeding CAD 150,000 showed the highest preference (53.3%), followed by those in the CAD 35,000–CAD 74,999 bracket at 50.2%, and the CAD 75,000–CAD 149,000 bracket at 48.6% [50].
Another survey conducted by Osmond [51] reported that 55% of Canadians would be more inclined to consume farm-raised salmon if they were fed an environmentally friendly diet. Table 2 clearly demonstrates that among various meat protein food sources, chicken consumption demonstrated the most pronounced increase, with a notable growth of 1.3% from 2019 to 2022, followed by beef and fish or fish dishes. While there was a marginal decline of 0.6% in fish consumption in 2019, this trend was not observed for other food sources. Conversely, poultry (including chicken), pork, and various meats exhibited an upward trajectory in consumption.

4.9. Canadian Average Eating per Capita of Fish/Seafood

In 2022, the average per capita consumption of meat protein in Canada amounted to 575 instances annually. Conversely, there was a reduction in the frequency of fish and seafood consumption, declining from 61 occasions per year to 54. Notably, in 2022, the specific consumption of salmon registered a relatively modest figure, with individuals partaking in this particular fish variety only 11 times within the same interval (see Table 3).

5. Forecasting

The global seafood industry, driven by evolving consumer preferences, shifting market dynamics, and environmental factors, is experiencing a profound transformation. Within this intricate tapestry, salmon, often referred to as the “pink gold” of the sea, holds paramount significance due to its economic and nutritional values and substantial contribution to international trade. In recent years, the salmon industry has witnessed pricing fluctuations driven by supply chain disruptions, environmental concerns, regulatory changes, and consumer demand. The inherent volatility of salmon prices necessitates a thorough understanding of the underlying dynamics to inform strategic decisions made by stakeholders, ranging from producers and distributors to policymakers and consumers. This section aims to forecast salmon prices up to 2026, serving as an indispensable tool for policymakers addressing sustainability, trade, and food security challenges while also empowering consumers to make informed dietary and purchasing decisions based on anticipated price trends.

5.1. Forecasting the Monthly Average Retail Price of Salmon up to 2026

This section introduces the forecasting model to predict salmon prices from June 2023 to May 2026, built on historical data from January 2017 to June 2022, using the SARIMAX model, a widely recognized approach in time series forecasting. The forecasting model projected salmon prices for a period of 7 years, spanning from 2023 to 2026, utilizing data from January 2017 to May 2023. The model is illustrated in Figure A1, Table A1 and Table A2 in Appendix A. The prediction suggests that salmon prices will experience more frequent fluctuations and a predicted price increase of over CAD 30 per kilogram by 2026 (nominal). This increase is anticipated to intensify with the reduction in the volume of salmon production in the future.
An important observation from the forecasting model is the presence of a discernible seasonal pattern. This recurring pattern follows a 12-month cycle, with salmon prices exhibiting consistent fluctuations over time. Seasonality in time series data is a well-documented phenomenon characterized by systematic variations at regular intervals, influenced by various factors such as vacations, climatic conditions, and holidays.
To evaluate the model’s performance, the dataset is split into two segments. Of the total 77 observations, the initial 30 serve as the training dataset, while the remaining 30 constitute the test dataset. The forecasted salmon price values closely align with the actual price values in the training dataset, with minimal differences observed. The model’s performance is deemed satisfactory, as indicated by a Mean Percentage Error (MPE) metric value of 1.28. MPE is a commonly used evaluation metric for time-series forecasting models, where a value closer to zero signifies superior performance in forecasting future trends.

5.2. Carbon Footprint

In recent years, there has been a discernible shift in the dynamics of the salmon trade, marked by a reduction in exports and a simultaneous surge in imports, particularly from 2019 to 2022. While this transition signifies multifaceted economic dynamics, it is crucial to highlight its environmental ramifications, particularly concerning carbon emissions.
Most of the salmon consumed by Canadians came from BC. However, reduced production has led to increased salmon imports to meet domestic consumption demands. Canada is now importing more salmon from different parts of the world, with import quantities rapidly rising since 2021. Canada imported approximately 86,300 and 86.387 tonnes of salmon in 2021 and 2022, respectively, which is about 20,000 tonnes more than in previous years. The imports include various forms of salmon, including fresh, preserved/prepared, frozen, and canned, primarily sourced from Norway, the United Kingdom, Chile, China, Mexico, and Iceland (see Table A3 in the Appendix A). It is estimated that the salmon imports from these countries generated approximately 84.56 million tonnes of CO2 emissions per kilometer in 2021 and 86.3 million tonnes in 2022, which is approximately 9.9 million tonnes more than in 2020.
The average Canadian vehicle releases 4600 kg of CO2 into the atmosphere every year. The estimated increase in CO2 emissions (from 2020) released by the increased imports is equal to the emissions released by 2,152,000 vehicles a year in Canada. Table 4 provides the estimates of carbon footprints generated by the distance between the countries by airplane transport. Imports from China and Chile produce the highest number of emissions, as the distance is far from Canada compared to other countries.
In 2019, the export of 83,180 tonnes of farmed salmon in BC, valued at CAD 771 million, significantly contributed to the creation of 353 million meals enriched with high-quality protein while minimizing CO2 emissions [52]. Indeed, salmon emerged as an exemplar of environmentally conscious protein sourcing, generating a mere 0.6 g of CO2 emissions in 2019 in BC. In stark contrast, other conventional meat sources such as chicken, pork, and beef accounted for 0.88 g, 1.3 g, and 5.92 g of CO2 emissions, respectively (as depicted in Figure 10).
Unfortunately, the years following 2019 have seen a decrease in salmon consumption in Canada, paralleled by an upswing in the consumption of other types of meat alternatives. This shift, indicative of evolving dietary preferences, carries environmental implications. Importantly, the increased demand for other protein sources necessitates higher production, which is associated with higher carbon emissions. Therefore, the heightened demand for alternative protein sources in Canada inadvertently exacerbates the carbon footprint generated by meat production.
This nuanced interplay between shifting dietary preferences, trade dynamics, and carbon emissions underscores the importance of comprehending the intricate relationship between global trade and environmental sustainability. As Canada navigates this transition in its dietary landscape, it becomes imperative to consider not only environmental but also socio-economic factors when formulating trade and consumption policies. This recalibration of priorities is essential for mitigating the environmental consequences associated with changes in protein consumption patterns.

6. Conclusions

The closure of 19 salmon farms in British Columbia (BC) has significantly impacted the sustainable supply of salmon to consumers in both Canada and the United States. This reduction in production is reflected in historical trends, showing declining production volumes and market values since 2019. Historically dominant in the North American salmon market, Canada has seen its market share steadily decline since 2019. This coincides with noticeable shifts in consumer behavior, including rising retail prices and reduced demand for salmon. Beyond economic concerns, these reductions in salmon production and supply chain disruptions have environmental consequences, as decreased salmon production leads to increased imports and a higher carbon footprint associated with North American consumption patterns.
As discussed, increased imports may amplify retail price fluctuations in Canada, influencing domestic demand for salmon. This shift reflects North Americans’ gradual move toward alternative sources of meat protein, affecting both dietary preferences and carbon emissions. Conversely, reduced Canadian availability has driven the U.S. to seek salmon from alternative suppliers, such as Norway and Chile, inadvertently increasing carbon emissions linked to salmon imports. Projections suggest a further decline in Canadian salmon production, affecting both global and domestic markets, GDP, and salmon consumption patterns in North America. Canada, once a leader in aquaculture, now faces the challenge of meeting growing market demand. While forecasting future retail salmon prices in Canada presents a formidable challenge, predictive models suggest intensified price fluctuations with decreased domestic production.
Hence, the closure of BC farming facilities extends beyond supply and demand dynamics, triggering transformative effects on salmon supply, consumer pricing, and market conditions while also contributing to increased carbon emissions from salmon imports in North America. This convergence of challenges underscores the intricate interplay between economic, environmental, and market forces, prompting a revaluation of strategies and policies governing the aquaculture industry.
However, the methodology for predicting salmon prices and analyzing market dynamics acknowledges a few limitations. For example, the assumption of stationarity in time-series forecasting may not accurately reflect real-world market behavior. Additionally, some studies referenced in the methodology have narrow timeframes or focus on specific regions, potentially limiting generalizability. Moreover, the complexity of market dynamics, influenced by various interconnected factors, may not be fully captured in the analysis. Future studies could address these limitations by conducting sensitivity analyses, exploring alternative modeling techniques, or incorporating additional data sources to enhance the accuracy of salmon price predictions and market analyses.

Author Contributions

Contributions of the authors are as follows: Conceptualization: S.C. (Sylvain Charlebois) and S.C. (Stefanie Colombo); Methodology: K.P.G.; Software: K.P.G.; Validation: K.P.G.; Formal Analysis and Investigation: K.P.G.; Resources, Data Curation, and Writing—Original Draft Preparation: K.P.G.; Writing, Review and Editing: S.S., K.P.G. and B.S. All authors have read and agreed to the published version of the manuscript.

Funding

This research was funded by the Agri-Food Analytics Lab of Dalhousie University.

Informed Consent Statement

Not applicable.

Data Availability Statement

Data will be available upon request.

Acknowledgments

All the authors are thankful to Dalhousie University, Agri-Food Analytics Lab for all the funds.

Conflicts of Interest

The authors declare no conflict of interest.

Appendix A

Table A1. Forecasting salmon prices per kilogram from January 2024 to December 2026.
DateForecasted PriceDateForecasted PriceDateForecasted Price
24 January29.0625 January29.6526 January30.23
24 February28.6725 February29.2526 February29.84
24 March29.1225 March29.7126 March30.29
24 April28.625 April29.1826 April29.77
24 May29.7625 May30.3426 May30.92
24 June29.4325 June30.0126 June30.59
24 July28.7925 July29.3726 July29.96
24 August27.8625 August28.4426 August29.02
24 September28.525 September29.0826 September29.66
24 October27.0525 October27.6426 October28.22
24 November28.4125 November28.9926 November29.58
24 December27.2325 December27.8226 December28.4
Figure A1. Forecasting salmon prices per kilogram from January 2024 to December 2026. The projections indicate a potential fluctuation in salmon prices from 2024 to 2026, as depicted by the shaded gray area in the graph. By 2026, the upper-bound price projection exceeds $35 per kilogram, while the lower-bound projection falls to $20.
Sustainability 16 03629 g0a1
Table A2. Statistical summary of salmon pricing forecasting model (SARIMAX results).
VariableCoefficientz-Statistics
AR(1)−0.445 ***
(0.136)
−3.264
MA.S(12)−1.000
(1166.307)
−0.001
σ20.897
(1046.328)
0.001
AIC158.842
BIC164.637
Jarque-Bera1.180
Note: *** denotes significance at the 1% level.
Table A3. Imports of salmon (all types) to Canada from Jan 2020 to August 2023.
Country2020202120222023 (Until August)
USA38,302,33349,327,23147,256,25325,944,836
Chile15,804,69616,434,88215,522,16213,655,955
Norway2,244,7823,837,2134,610,5372,931,071
China3,912,0983,287,3343,745,7252,126,420
Mexico555,8615,201,5957,480,2365,898,253
Iceland251,567777,4981,828,093732,743
United Kingdom359,778882,171917,462433,171
Lithuania450,538614,487689,109249,751
Thailand1,369,9931,649,4771,018,263495,149
Poland615,508806,309385,082144,016
New Zealand151,218469,326108,54387,521
Netherlands172,60398,55991,27465,690
Sweden31,55736,66158,25562,695
Italy85952,96767,90431,685
Türkiye077618,03889,910
Denmark67,101108,581261,189113,595
Canada213,181161,847230,96762,330
Ireland172,54235,571593814,181
France74,746198317794,369
Faroe Islands19,12328,84361,35111,915
Panama332,051490,781740,35851,325
Colombia337413,85856,3924064
Japan108,28019,15181664492
Brazil0063574240
Trinidad and Tobago0884883,1883026
Viet Nam1912,41518,4191145
Sri Lanka002844417
Iran45134891655
Germany9527368138,3381170
Guyana009441350
Portugal105350301229844
Morocco0200,016016
Australia021255
Benin0002
Korea, South011200
Argentina237,345481,388468,9320
Bangladesh0000
Belarus11242800
Cameroon04700
Costa Rica001910
Ecuador408210677270
Egypt0100
Finland0200
Ghana090200
Greenland045300
Honduras011,61013150
Hong Kong0200
India0000
Indonesia44,08920,5832260
Israel3491000
Kenya0000
Latvia365613,67627,2870
Mauritania435100,000350
Mozambique0000
Nigeria203710
Peru1588111,90330,5660
Philippines0016880
Russian Federation874,604969,688539,1490
Saudi Arabia0000
Senegal10180
Singapore3000
Spain40,84819,4555420
Switzerland1334048390
Taiwan440600
United Republic of Tanzania063500
Togo12,318090
Tunisia002100
Ukraine011556480
Total imports Quantity66,445,26186,300,38186,386,89053,323,007
Source: Statistics Canada data retrieved from CATSNET Analytics, AAFC.

References

  1. Government of British Colombia. Salmon Aquaculture in British Colombia. Available online: https://www2.gov.bc.ca/assets/gov/environment/natural-resource-stewardship/environmental-assessments/eao-project-reviews/salmon-aquaculture-summary-report.pdf (accessed on 16 October 2023).
  2. Government of Canada. Farmed Salmon. Species Farmed in Canada. Available online: https://www.dfo-mpo.gc.ca/aquaculture/sector-secteur/species-especes/salmon-saumon-eng.htm (accessed on 16 October 2023).
  3. Cohen, B.I. Cohen Commission of Inquiry into the Decline of Sockeye Salmon in the Fraser River—Final Report. 2012. Available online: https://publications.gc.ca/site/eng/432516/publication.html (accessed on 20 October 2023).
  4. Saksida, S.M.; Greba, L.; Morrison, D.; Revie, C.W. Sea Lice on Wild Juvenile Pacific Salmon and Farmed Atlantic Salmon in the Northernmost Salmon Farming Region of British Columbia. Aquaculture 2011, 320, 193–198. [Google Scholar] [CrossRef]
  5. Jiménez, R.Á.; British Columbia Announces next Step in Transitioning from Open-Net Pen Aquaculture. Weare Aquaculture. 2022. Available online: https://weareaquaculture.com/news/22902 (accessed on 16 October 2023).
  6. RIAS Inc. Consequences of the Decision to Shut down Salmon Farming in the Discovery Islands; RIAS Inc.: Framingham, MA, USA, 2021. [Google Scholar]
  7. Fish Farming Expert. Dismay as Canadian Government Refuses to Reinstate BC Salmon Farm Licences. 2023. Available online: https://www.fishfarmingexpert.com/bernadette-jordan-british-columbia-discovery-islands/dismay-as-canadian-government-refuses-to-reinstate-bc-salmon-farm-licences/1490793#:~:text=TheDecember2020decisionto,healthysalmon%2CsaidtheBCSFA (accessed on 17 October 2023).
  8. Pauly, D.; Zeller, D. Catch Reconstructions Reveal That Global Marine Fisheries Catches Are Higher than Reported and Declining. Nat. Commun. 2016, 7, 10244. [Google Scholar] [CrossRef]
  9. Hognes, E.S.; Ziegler, F.; Sund, V. Carbon Footprint and Area Use of Farmed Norwegian Salmon; SINTEF: Oslo, Norway, 2011. [Google Scholar]
  10. Farmery, A.K.; Gardner, C.; Green, B.S.; Jennings, S.; Watson, R.A. Domestic or Imported? An Assessment of Carbon Footprints and Sustainability of Seafood Consumed in Australia. Environ. Sci. Policy 2015, 54, 35–43. [Google Scholar] [CrossRef]
  11. Fisheries and Oceans Canada. Canada Fish and Seafood Trade. Available online: https://www.dfo-mpo.gc.ca/ea-ae/economic-analysis/Canada-Fish-Seafood-trade-commerce-poisson-fruits-de-mer-eng.html (accessed on 23 October 2023).
  12. The Globe and Mail. New Fisheries Minister Wades into Bitter Row over Closing of Salmon Farms. 2023. Available online: https://www.theglobeandmail.com/politics/article-new-fisheries-minister-wades-into-bitter-row-over-closing-of-salmon/ (accessed on 23 October 2023).
  13. Logan, C. Tale of Two Coasts: How Canada’s Approach to Salmon Farming Differs from East to West. National Observer. 2023. Available online: https://www.nationalobserver.com/2023/10/10/tale-two-coasts-how-canadas-approach-salmon-farming-differs-east-west (accessed on 16 October 2023).
  14. FAO. The State of Food Insecurity in the World 2014: Strengthening the Enabling Enviroment for Food Security and Nutrition; FAO: Rome, Italy, 2014. Available online: https://www.fao.org/3/i4030e/i4030e.pdf (accessed on 20 October 2023).
  15. Grafton, R.Q.; Williams, J.; Jiang, Q. Food and Water Gaps to 2050: Preliminary Results from the Global Food and Water System (GFWS) Platform. Food Secur. 2015, 7, 209–220. [Google Scholar] [CrossRef]
  16. Tilman, D.; Balzer, C.; Hill, J.; Befort, B.L. Global Food Demand and the Sustainable Intensification of Agriculture. Proc. Natl. Acad. Sci. USA 2011, 108, 20260–20264. [Google Scholar] [CrossRef]
  17. Ahmed, N.; Thompson, S.; Turchini, G.M. Organic Aquaculture Productivity, Environmental Sustainability, and Food Security: Insights from Organic Agriculture. Food Secur. 2020, 12, 1253–1267. [Google Scholar] [CrossRef]
  18. FAO. The State of World Fisheries and Aquaculture 2020; FAO: Rome, Italy, 2020. [Google Scholar] [CrossRef]
  19. Gephart, J.A.; Henriksson, P.J.G.; Parker, R.W.R.; Shepon, A.; Gorospe, K.D.; Bergman, K.; Eshel, G.; Golden, C.D.; Halpern, B.S.; Hornborg, S.; et al. Environmental Performance of Blue Foods. Nature 2021, 597, 360–365. [Google Scholar] [CrossRef]
  20. Garlock, T.; Asche, F.; Anderson, J.; Bjørndal, T.; Kumar, G.; Lorenzen, K.; Ropicki, A.; Smith, M.D.; Tveterås, R. A Global Blue Revolution: Aquaculture Growth Across Regions, Species, and Countries. Rev. Fish. Sci. Aquac. 2020, 28, 107–116. [Google Scholar] [CrossRef]
  21. Hilborn, R.; Banobi, J.; Hall, S.J.; Pucylowski, T.; Walsworth, T.E. The Environmental Cost of Animal Source Foods. Front. Ecol. Environ. 2018, 16, 329–335. [Google Scholar] [CrossRef]
  22. Froehlich, H.E.; Runge, C.A.; Gentry, R.R.; Gaines, S.D.; Halpern, B.S. Comparative Terrestrial Feed and Land Use of an Aquaculture-Dominant World. Proc. Natl. Acad. Sci. USA 2018, 115, 5295–5300. [Google Scholar] [CrossRef] [PubMed]
  23. MacLeod, M.J.; Hasan, M.R.; Robb, D.H.F.; Mamun-Ur-Rashid, M. Quantifying Greenhouse Gas Emissions from Global Aquaculture. Sci. Rep. 2020, 10, 11679. [Google Scholar] [CrossRef]
  24. Golden, C.D.; Koehn, J.Z.; Shepon, A.; Passarelli, S.; Free, C.M.; Viana, D.F.; Matthey, H.; Eurich, J.G.; Gephart, J.A.; Fluet-Chouinard, E.; et al. Aquatic Foods to Nourish Nations. Nature 2021, 598, 315–320. [Google Scholar] [CrossRef]
  25. Sharif, M.; Zafar, M.H.; Aqib, A.I.; Saeed, M.; Farag, M.R.; Alagawany, M. Single Cell Protein: Sources, Mechanism of Production, Nutritional Value and Its Uses in Aquaculture Nutrition. Aquaculture 2021, 531, 735885. [Google Scholar] [CrossRef]
  26. Dawood, M.A.O.; Koshio, S. Application of Fermentation Strategy in Aquafeed for Sustainable Aquaculture. Rev. Aquac. 2020, 12, 987–1002. [Google Scholar] [CrossRef]
  27. Smith, M.D.; Roheim, C.A.; Crowder, L.B.; Halpern, B.S.; Turnipseed, M.; Anderson, J.L.; Asche, F.; Bourillón, L.; Guttormsen, A.G.; Khan, A.; et al. Sustainability and Global Seafood. Science 2010, 327, 784–786. [Google Scholar] [CrossRef]
  28. Hua, K.; Cobcroft, J.M.; Cole, A.; Condon, K.; Jerry, D.R.; Mangott, A.; Praeger, C.; Vucko, M.J.; Zeng, C.; Zenger, K.; et al. The Future of Aquatic Protein: Implications for Protein Sources in Aquaculture Diets. One Earth 2019, 1, 316–329. [Google Scholar] [CrossRef]
  29. Filipski, M.; Belton, B. Give a Man a Fishpond: Modeling the Impacts of Aquaculture in the Rural Economy. World Dev. 2018, 110, 205–223. [Google Scholar] [CrossRef]
  30. FAO. The State of World Fisheries and Aquaculture: Contributing to Food Security and Nutrition for All; FAO: Rome, Italy, 2016; Available online: https://www.fao.org/3/i5555e/i5555e.pdf (accessed on 20 October 2023).
  31. Anderson, J.L.; Asche, F.; Garlock, T.; Chu, J. Aquaculture: Its Role in the Future of Food. In World Agricultural Resources and Food Security; Emerald Publishing Limited: Bingley, UK, 2017; pp. 159–173. [Google Scholar] [CrossRef]
  32. Fisheries and Oceans Canada. Outlook to 2027 for Canadian Fish and Seafood. 2018. Available online: https://waves-vagues.dfo-mpo.gc.ca/library-bibliotheque/40732836.pdf (accessed on 16 October 2023).
  33. Government of Canada. Pacific Aquaculture Transition—What We Heard Report Phases 1 and 2; Government of Canada: Ottawa, ON, Canada, 2023.
  34. Nourish Food Marketing. Canadian Consumption of Seafood; Nourish Food Marketing: Toronto, ON, Canada, 2022. [Google Scholar]
  35. Tsoumakas, G. A Survey of Machine Learning Techniques for Food Sales Prediction. Artif. Intell. Rev. 2019, 52, 441–447. [Google Scholar] [CrossRef]
  36. Landwehr, N.; Hall, M.; Frank, E. Logistic Model Trees. Mach. Learn. 2005, 59, 161–205. [Google Scholar] [CrossRef]
  37. Bloznelis, D. Short-term Salmon Price Forecasting. J. Forecast. 2018, 37, 151–169. [Google Scholar] [CrossRef]
  38. Gladju, J.; Kamalam, B.S.; Kanagaraj, A. Applications of Data Mining and Machine Learning Framework in Aquaculture and Fisheries: A Review. Smart Agric. Technol. 2022, 2, 100061. [Google Scholar] [CrossRef]
  39. Hwang, Y. Data-Driven Agricultural Market Prediction. 2019. Available online: https://s-space.snu.ac.kr/bitstream/10371/150949/1/000000154117.pdf (accessed on 18 October 2023).
  40. Bjørnstad, H.; Halvorsen, Ø.L.; Rognås, V.C.J. Forecasting the Price of Salmon Using Machine Learning Algorithms, Norwegian University of Science and Technology. 2023. Available online: https://ntnuopen.ntnu.no/ntnu-xmlui/handle/11250/3071433?locale-attribute=en (accessed on 20 October 2023).
  41. McHugh, C.; Coleman, S.; Kerr, D.; McGlynn, D. Forecasting Day-Ahead Electricity Prices with A SARIMAX Model. In Proceedings of the 2019 IEEE Symposium Series on Computational Intelligence (SSCI), Xiamen, China, 6–9 December 2019; IEEE: New York, NY, USA, 2019; pp. 1523–1529. [Google Scholar] [CrossRef]
  42. Statistics Canada. Monthly Average Retail Prices for Selected Products, Table: 18-10-0245-01. Available online: https://www150.statcan.gc.ca/t1/tbl1/en/tv.action?pid=1810024501 (accessed on 17 October 2023).
  43. British Columbia Government. Sector Snapshot 2019: B.C. Seafood. 2020. Available online: https://www2.gov.bc.ca/assets/gov/farming-natural-resources-and-industry/agriculture-and-seafood/statistics/industry-and-sector-profiles/sector-snapshots/sector_snapshot_2019_-_seafood.pdf (accessed on 21 October 2023).
  44. Fisheries and Oceans Canada. Aquaculture in British Columbia. Available online: https://www.pac.dfo-mpo.gc.ca/aquaculture/index-eng.html (accessed on 23 October 2023).
  45. Kontali. Global Salmon Production and Market Update: Systemizing the World of Aquaculture and Fisheries. 2023. Available online: https://edge.kontali.com/ (accessed on 23 October 2023).
  46. Statistics Canada. Aquaculture, Production and Value; Statistics Canada: Ottawa, ON, Canada, 2023. [CrossRef]
  47. Valdés, A. Net Food-Importing Developing Countries: Who They Are, and Policy Options for Global Price Volatility. 2012. Available online: https://www.files.ethz.ch/isn/152811/net-food-importing-developing-countries-who-they-are-and-policy-options-for-global-price-volatility.pdf (accessed on 16 October 2023).
  48. Gouel, C. Trade Policy Coordination and Food Price Volatility. Am. J. Agric. Econ. 2016, 98, 1018–1037. [Google Scholar] [CrossRef]
  49. Nielsen. Retail Trend of Atlantic Salmon: Retail Scan Numbers for Seafood in the US; Nielsen: New York, NY, USA, 2023. [Google Scholar]
  50. Charlebois, S.; Colombo, S. Canadians Cast Their Nets of Preference: New Study Reveals Insights into Seafood Choices and Sustainability. Agri. Food, 2023; Unpublished. [Google Scholar]
  51. Osmond, A.T.Y.; Charlebois, S.; Colombo, S.M. Exploratory Analysis on Canadian Consumer Perceptions, Habits, and Opinions on Salmon Consumption and Production in Canada. Aquac. Int. 2023, 31, 179–193. [Google Scholar] [CrossRef]
  52. RIAS Inc. Economic And Financial Impacts of Minister Murray’s Transition Plan for BC Salmon Farms; RIAS Inc.: Ottawa, ON, Canada, 2023. [Google Scholar]
Figure 1. Salmon production and value in Canada. Data Source: Statistics Canada [46].
Sustainability 16 03629 g001
Figure 2. Monthly average retail price for salmon (per kilogram) from January 2017 to June 2023. Data Source: Statistics Canada [46].
Sustainability 16 03629 g002
Figure 3. Market shares of Atlantic salmon in the USA. Data Source: Kontali [45].
Sustainability 16 03629 g003
Figure 4. Market shares of Atlantic salmon (exports)—Canada. Data Source: Kontali [45].
Sustainability 16 03629 g004
Figure 5. Market shares of Salmon (Imports)—Canada. Data source: Government of Canada Trade Data Online.
Sustainability 16 03629 g005
Figure 6. Farmed Atlantic salmon (fresh/chilled) exports in Canada and BC (January–August 2012, to January–August 2023). Data source: Government of Canada Trade Data Online.
Sustainability 16 03629 g006
Figure 7. Farmed Atlantic salmon (fresh/chilled) export quantity and value in Canada to the world and to the USA (January–August 2012, to January–August 2023). Data source: Government of Canada Trade Data Online.
Sustainability 16 03629 g007
Figure 8. The retail sales volumes of Salmon in the USA from 2017 to 2022. Data Source: Nielsen [49].
Sustainability 16 03629 g008
Figure 9. Seafood preference and consumption.
Sustainability 16 03629 g009
Figure 10. Carbon dioxide equivalent (e.g., CO2eq—one gram of CO2) per typical edible protein (2019). Data source: Kontali [45].
Sustainability 16 03629 g010
Table 1. Atlantic salmon production, North America, Canada, US, and BC share (in tonnes).
YearGlobal Atlantic
Salmon Production
North America
Harvest Quantity
Canada ShareUSA ShareBC Share
20192,577,900158,300137,50020,80081,500
20202,712,600156,800136,80020,00087,000
20212,896,000161,000142,00019,00079,000
20222,865,700151,000131,50019,50081,500
Data Source: Kontali [45].
Table 2. Overall protein consumption by Canadians.
2019202020212022
Chicken29.5%30.7%30.3%30.8%
Beef12.6%13.2%13.0%12.2%
Fish/Fish Dishes8.5%7.9%8.5%7.9%
Pork6.2%6.5%6.5%6.3%
Turkey1.7%1.6%1.4%1.2%
All other Meat6.1%6.7%6.2%6.7%
Other Protein (meat alternative)35.4%33.4%34.1%34.9%
Table 3. Average number of occasions per capita of fish/seafood consumption.
2019202020212022
Meat Protein585569586575
Fish/Seafood61566254
Fish/Fish Dishes44424540
Salmon Fillet/Steaks13121311
Seafood/Seafood Dishes17141714
Data source: Nourish Food Marketing [34].
Table 4. Estimated carbon footprints from imports of salmon from the six dominant countries to Canada from 2021 to 2023 (August).
Salmon SupplierDistance from Border to the Border (km)Kg CO2—eq/Tonne kmEstimated in Million Tonnes CO2 Emissions km (2020)Estimated in Million Tonnes CO2 Emissions km (2021)Estimated in Million Tonnes CO2 Emissions km (2022)Estimated in Million Tonnes CO2 Emissions km (Until August 2023)
Norway1190702.51.5772.69563.23892.0591
UK28491681.80.6051.48361.5430.7285
Chile66863946.862.37864.865261.26353.8973
China47452800.9810.95779.207810.49175.9561
Mexico18081067.270.59335.55157.98346.295
Iceland1647972.230.24460.75591.77730.7124
Total CO2 emissions Produced76.355684.559686.297369.6484
Note: Distance is calculated using Distance Calculator: https://distancecalculator.globefeed.com/ (accessed on 21 October 2023). Carbon emissions are calculated using: The Dalhousie seafood carbon emission tool: http://seafoodco2.dal.ca/ (accessed on 21 October 2023).
Disclaimer/Publisher’s Note: The statements, opinions and data contained in all publications are solely those of the individual author(s) and contributor(s) and not of MDPI and/or the editor(s). MDPI and/or the editor(s) disclaim responsibility for any injury to people or property resulting from any ideas, methods, instructions or products referred to in the content.

