Article

Biodiversity-Centric Habitat Networks for Green Infrastructure Planning: A Case Study in Northern Italy

1
Di4A-Department of Agricultural Food Environmental and Animal Sciences, University of Udine, 33100 Udine, Italy
2
DISTAL-Department of Agricultural and Food Sciences, University of Bologna, 40127 Bologna, Italy
3
NBFC National Biodiversity Future Center, 90133 Palermo, Italy
4
For-Nature S.r.l., Via Ciconi 26, 33100 Udine, Italy
*
Author to whom correspondence should be addressed.
Sustainability 2024, 16(9), 3604; https://0-doi-org.brum.beds.ac.uk/10.3390/su16093604
Submission received: 25 February 2024 / Revised: 10 April 2024 / Accepted: 16 April 2024 / Published: 25 April 2024
(This article belongs to the Special Issue Biodiversity Management in Sustainable Landscapes)

Abstract

:
Green infrastructure (GI) networks comprising multiple natural and artificial habitats are important tools for the management of ecosystem services. However, even though ecosystem services are deeply linked with the state of biodiversity, many approaches to GI network planning do not explicitly consider the ecological needs of biotic communities, which are often threatened by anthropic activities even in presence of protected areas. Here, to contribute in fill this gap, we describe an easy-to-apply, biodiversity-centric approach to model an ecological network as a backbone for a GI network, based on the ecological needs of a range of representative species. For each species, ideal habitats (nodes) were identified, and crossing costs were assigned to other habitat types depending on their compatibility with the species ecology. Corridors linking the nodes were then mapped, minimizing overall habitat crossing costs. We applied the method to the Isonzo–Vipacco river area in Northern Italy, highlighting a potential ecological network where nodes and corridors occupied 27% and 11.8% of the study area, respectively. The prospective of its conflicts with anthropic activities and possible solutions for its implementation was also discussed. Our method could be applied to a variety of situations and geographic contexts, being equally useful for supporting the protection of entire biocenoses or of specific sensitive species, as well as enhancing the ecosystem services they provide.

1. Introduction

Agricultural intensification and urbanization are massively reshaping landscapes, causing widespread destruction and fragmentation of natural and semi-natural habitats [1] and leading to a worldwide decline in biodiversity [2,3]. Anthropic activities are also sources of chemical and sensory pollution [4,5] and determinants of biological invasions of exotic species that can outcompete or otherwise damage native ones [6,7]. Nature conservation is important not only because of the intrinsic value of biodiversity itself, but also for the many ecosystem services linked with it. It is a well-established fact that many wild taxa are pivotal providers of services such as pollination, biological control, water purification, soil quality enhancement, climate regulation and more [8,9,10].
Green infrastructures (GIs) are among the most important tools used to counteract the adverse effects of landscape changes on ecosystem services [11]. GIs are defined as “networks of natural and semi-natural areas, planned at a strategic level and with other environmental elements, designed and managed so as to provide a broad spectrum of ecosystem services” [12]. This means that not only protected areas, but also small natural and semi-natural elements (grass strips, meadows, hedgerows), as well as artificial ecosystems (gardens, urban parks, low-input agriculture), can act as nodes (here used as synonymous with core areas) in a landscape GI network designed to sustain biodiversity and improve ecosystem services [13].
Several different approaches to the planning of GIs exist [14], most of which tend to directly focus on improving specific ecosystem services [15,16]. Approaches based on biodiversity conservation and enhancement are less common, but should be considered of paramount importance for GIs, given the aforementioned link between biodiversity and ecosystem services [17]. Healthy, complex, and diverse biotic communities are known to be much more resilient providers of a wider range of ecosystem services if compared to simplified ones [18,19]. As a consequence, conservation actions aimed at improving multiple services simultaneously should focus on preserving entire communities.
In this respect, the fact that any given area can host hundreds or thousands of different species with wildly different ecological needs represents a significant challenge in conservation biology. The concept of umbrella species can often lighten this burden by allowing conservation managers to focus on one or a few carefully selected sensitive species, with the conservation actions aimed at them also automatically benefitting a wider array of other species occupying the same habitat [20,21]. The same concept could also be implemented in GI planning; indeed, by selecting a number of species with varying ecologies, it would be possible to build an ecological network [22] capable of also protecting a much wider array of other species that share the ecological needs of the selected ones [23].
Planning and implementing GI and ecological networks is particularly important for areas that simultaneously host a high level of biodiversity and are subjected to significant anthropic pressures. Despite its relatively small area, Italy has probably the highest level of biodiversity in Europe [24]. This rich biological heritage, threatened by dramatic landscape transformations [25], would clearly benefit from an improvement in connectivity between habitat resources. Protected areas such as the Natura 2000 network are thought to be insufficient for the protection of a considerable portion of biodiversity [26], thus highlighting the need for GI networks to safeguard and connect other, usually neglected areas such as small semi-natural elements and low-input agricultural fields. In the context of Italy, the Friuli Venezia Giulia region seems to be particularly interesting from this point of view; owing to its biogeographic location, geomorphology, and socio-ecological history, this region in fact hosts one of the widest arrays of habitat types in the country [27], which in turn support a high level of biodiversity.
When planning a GI or ecological network, it is important to consider and fully exploit the geomorphology of the territory under analysis, which might present natural features enabling connectivity in some areas. A typical example of such facilitations is represented by rivers and other elements of the hydrographic network, which are known to connect aquatic and terrestrial ecosystems as well as different parts of the territory [28,29], especially if properly managed. A GI at the landscape scale should be designed to include the hydrographic network with both the function of conservation, due to the riparian habitats linked, and the function of support to connectivity, due to its pervasiveness in the landscape.
The main goal of this study, as part of the larger Interreg GREVISLIN project (https://2014-2020.ita-slo.eu/it/grevislin, accessed on 19 April 2024), was the definition of an ecological network model as a backbone for a GI network, aimed at enhancing landscape connectivity in the Isonzo–Vipacco river basins in the Friuli Venezia Giulia region, Italy. We focused on the maintenance of the basic conditions for biodiversity conservation in the long run, namely natural habitat availability and habitat connectivity. In this paper, we describe the employed network modelling approach, highlighting its features and the issues that should be addressed when implementing it, with a focus on the challenges posed by urbanized areas, agriculture, and other prevalent anthropic pressures.

2. Materials and Methods

The main goal of our study was to define the ecological network aimed at enhancing landscape connectivity for biodiversity in the catchment area of the Isonzo and Vipacco rivers (and neighboring Municipalities). The GREVISLIN Project placed great emphasis on the protection of endangered species linked with river habitats, and especially on the endangered Lepidoptera Lycaena dispar (Haworth) and Maculinea teleius (Bergsträsser), as well as on their preferred habitat type, the lowland wet meadows and hay meadows [30,31]. In many parts of Europe, the populations of these two butterflies are declining, and consequently, they are of great conservation interest [32,33,34].

2.1. Study Area

The study area (35.525 ha, lat 45.87119; long 13.52218) was defined by the administrative boundaries of 23 municipalities that are crossed by the Isonzo and Vipacco rivers, or are in their immediate surroundings (Table S1, Figure 1). In the case of very large municipalities, only the area directly influenced by the river (the hydraulic/flood risk area) was considered (Table S1). The spatial analyses described here and in following sections were carried out in QGIS 3.4.15, with the projection system being RDN2008/UTM zone 33N (EPSG:6708).
The area is rich in biodiversity representative of four different biogeographical areas: Po Valley, Illyrian-Balk, and Mediterranean in connection with the Alpine system. The related habitats are mainly concentrated along the rivers and arranged in a north–south direction, while in the east–west direction, they are reduced and fragmented due to anthropic land use change. This includes both agricultural activities (including intensive agriculture based on the irrigation system) and the expansion of urban, commercial, and industrial settlements. The floodplain areas are characterized by tree formations dominated by black poplar (Populus nigra L.) while the riverbed hosts willow thickets of Salix eleagnos Scop. and Salix purpurea L., often contaminated by invasive exotic species (e.g., Robinia pseudacacia L., Amorpha fruticosa L. and Reynoutria japonica Houtt.). In the Karst area, downy oak (Quercus pubscens Willd.) and black hornbeam (Ostrya carpinifolia Scop.) formations can be found, while in the alluvial plain, residual strips of mesophilic woods represent a fragmented but very important hot spot of biodiversity [35].

2.2. Ecological Network

The ecological network was designed using a habitat-species based model considering both flora and fauna. Habitat categorization and mapping was based on CORINE BIOTOPES [36]—specifically, on the pre-existing CORINE BIOTOPES habitat map (2017, 1:25.000) of Friuli Venezia Giulia obtained from the IRDAT regional environmental and territorial data catalogue (http://irdat.regione.fvg.it/, accessed on 12 November 2019). This habitat categorization is based on the features of local biotic communities, and especially on the features of vegetation; natural and semi-natural habitats were classified more in detail, while anthropic habitats are divided in larger macro-categories [37]. The study area included 75 different CORINE BIOTOPES habitat categories.

2.3. Selection of Target Species and Habitats

We based the ecological network on the habitat preferences of selected focus species representative of the biocenosis of the study area. The criteria for the selection of the target species were defined by a panel of expert botanists, zoologists, and conservationists affiliated with the Natural Reserve of the Isonzo River Mouth and the University of Udine. The adopted criteria are reported in Table S2.
As for animals, we selected 17 species (8 insects and 9 vertebrates, see Table S3) including L. dispar and M. teleius. Given the centrality of river-related habitats in the area, 12 of these species are semi-aquatic or at least linked with water-rich environments. Nonetheless, we also included 5 species linked with different, drier habitats, to ensure a more complete representation of the ecological needs of the local fauna of the area. All of the selected species are of conservation interest, are either threatened or declining because of anthropic impacts, and have a very low mobility. The reasoning behind these choices is that a network calibrated for the protection of such vulnerable, low-mobility species would also adequately protect the less vulnerable and more mobile ones [21].
Plants represent a different challenge, as they occupy a very different niche in the ecosystem (often as habitat builders) and, moreover, they are sessile organisms, which means that they can only move from habitat to habitat during sexual reproduction exchange (e.g., pollination) or through colonization events in the form of propagules. Thus, we used a different, habitat-focused approach. Based on the existing literature [38,39] and expert opinion, 13 habitat categories (Table S4) were deemed representative of 107 vulnerable and ecologically diverse focal plant species for the studied area. The focal habitats themselves were thus used to build the networks, rather than the individual plant species.

2.4. Assigning Habitat Crossing Costs

For each animal species, a crossing cost was assigned to each CORINE BIOTOPES (2017) habitat type depending on the ecology and habitat preferences of the animal. Costs ranged from 1 (the preferred habitat types) to 100 (extremely hostile habitat types, tending to act as barriers), and were assigned based on the existing literature [40,41,42,43,44] and expert opinion of local zoologists (including co-authors MDL and PZ).
A similar procedure was applied to the focal plant habitats by assuming that, while plants and their habitats cannot move, they can expand more or less easily depending on the features of neighboring habitats. Costs (from 1 to 100) were thus lower for habitats that were very similar to the focal habitats in terms of vegetation composition and successional stage (value scores: 2–50 if the habitat is within the dynamic contacts, 51–70 if the habitat is within floristic affinities, 71–100 for habitats considered biological barriers). Once again, the available literature [38,39] and local experts (including co-author FB) were consulted for cost assignment. The assigned costs for animal species and focal habitats are reported in the dedicated Supplementary Excel file.

2.5. Building the Ecological Network

For each animal species and focal plant habitat, we generated a raster (10 × 10 m per pixel) based on the CORINE BIOTOPES habitat map of the region, using the habitat crossing costs as a discriminatory variable (Figure S1a). Raster maps were created in QGIS and then imported into Graphab 1.2.3 [45] to be used for the generation of movement graphs.
These graphs are based on Least Cost Path Analysis [46]: ideal habitats (cost: 1) act as nodes, and they are connected by non-oriented links that minimize the overall crossing cost between each couple of nodes, calculated as the sum of the costs of all pixels crossed by the link (Figure S1b). Given the high number of links in these graphs, we re-elaborated the graph of each species and habitat into a Minimum Spanning Tree (MST) [47]. MSTs are open graphs connecting all the nodes at the minimum possible overall cost, resulting in the most favorable link between each couple of nodes in terms of Euclidean distance and crossing cost (Figure S1c). No minimum size threshold was applied for the selection of nodes.
The MST links calculated for all species and habitats were merged in a single shapefile, as were the MST nodes (Figure S2a,b). A grid (cell size: 50 × 50 m) was overlapped to the MST links to overcome the one-dimension of lines, and only cells crossed by at least one link were selected (Figure S2c). The link length index (TLL), as sum of all the length of links in each cell, was calculated. Cells showing TLL above the average value of the study area were deemed part of Level I corridors, while cells encompassing a below-average total link length were considered as Level II corridors. A buffer of 50 m was then applied to the cells, generating corridors with a minimum width of 150 m, aimed at reducing external disturbance and enhancing the connectivity role of the corridors. Very short corridors (including less than 10 cells in contact with each other) were removed.
In addition to that, we also highlighted stepping stones, defined as isolated or discontinuous habitat patches that are relatively suitable to host one or more of the target species, acting as facilitators in their dispersal. For each species/habitat, they were identified as all habitat patches with a crossing cost inferior to 30, and crossed by at least one link. Habitats that were already identified as nodes for at least one of the focal species or plant habitats were not considered in stepping stones selection. The resulting system of nodes, corridors, and stepping stones represented the ecological network model for the study area.

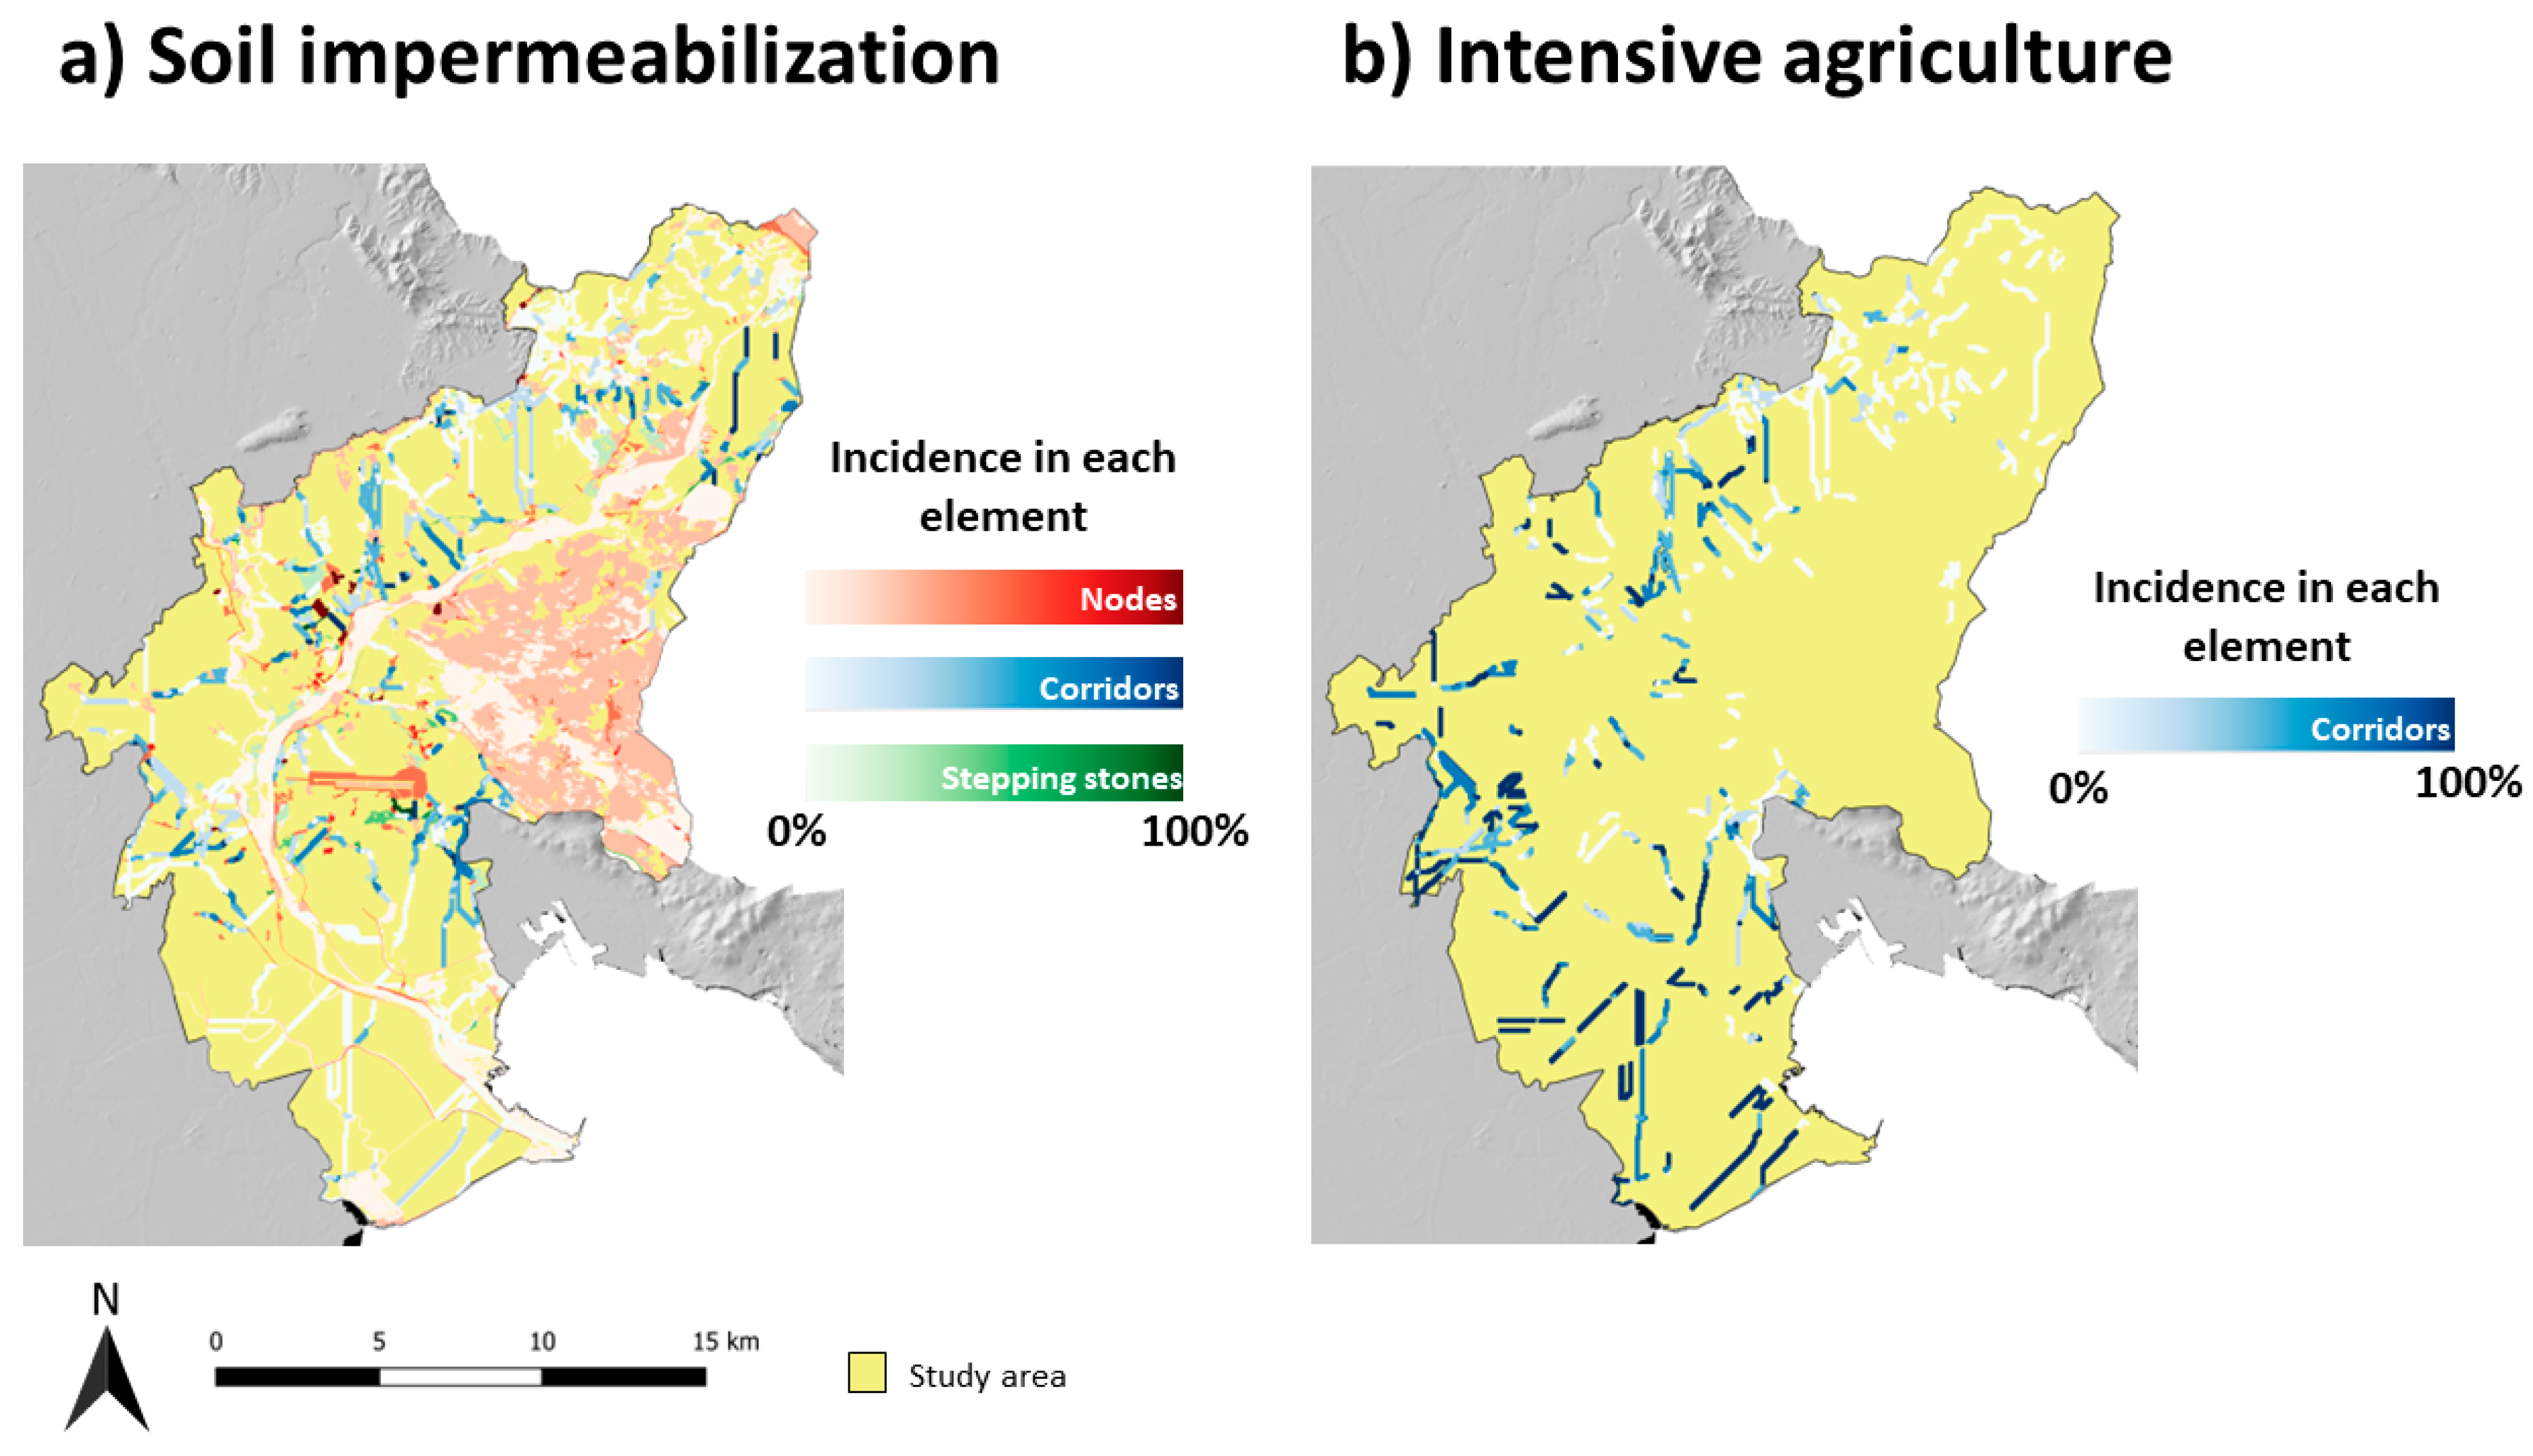
2.6. Anthropic Impacts

The ecological network model highlights habitats favorable to biodiversity and ways to connect them. However, in anthropized landscapes, sources of anthropogenic disturbance are widespread, and interferences with the ecological network are inevitable. In QGIS, the following CORINE 2017 habitat categories were selected as representing sources of varying intensities of one or more types of anthropic impacts (habitat destruction and fragmentation, invasive species, chemical and physical pollution):
(1)
Intensive agriculture (CORINE code 82.1);
(2)
Intensive agricultural areas with semi-natural patches (CORINE codes 82.2 and 82.3);
(3)
Permanent crops (CORINE codes 83.11, 83.15, 83.21, 83.31 and 83.321);
(4)
Habitats dominated by invasive plant species (CORINE codes 83.324, 87.2a, and 87.2b).
While agriculture in general is a major cause of biodiversity loss [1], extensive and low-input agricultural areas can be relatively biodiversity-rich. This is particularly true for those species that evolved in open habitats once maintained by now-extinct large herbivores, and now maintained by low-input agricultural activities and livestock [48]. Extensive agricultural areas, if properly managed, can indeed represent favorable habitats for many wild species [49], to the point that they were considered nodes for one of the species in our network, the European green lizard Lacerta viridis (Laurenti). For these reasons, we only focused on intensive agriculture when mapping agricultural impacts in our study.
Urbanized areas (urban and industrial) were mapped using the National Land Consumption Map (2018) raster file about soil sealing, provided by the Italian Institute for Environmental Protection and Research (ISPRA https://groupware.sinanet.isprambiente.it/uso-copertura-e-consumo-di-suolo/library/consumo-di-suolo, accessed on 12 November 2019). The choice was dictated by the higher spatial resolution of this map (10 m) and by the fact that it also mapped sealed soil within natural areas, allowing us to evaluate urbanization impact within the nodes and the stepping stones of the ecological networks.
Linear traffic-based barriers were included in the analysis using the road and highway graph (2014, 1:25.000) and the railway graph (2000, 1:25.000) for the Friuli Venezia Giulia region. We only considered high-traffic roads (controlled-access highways, state highways, regional roads, provincial roads) and railways. The shapefiles of both graphs were downloaded from the IRDAT platform of the Region website (http://irdat.regione.fvg.it/consultatore-dati-ambientali-territoriali/home?language=it, accessed on 12 November 2019). Data on linear barriers linked with aquatic habitats (i.e., dams and weirs) and water intake structures were provided by the regional Information System for Soil Protection (SIDS) and the regional land register of water use (http://www.regione.fvg.it/rafvg/cms/RAFVG/ambiente-territorio/valutazione-ambientale-autorizzazioni-contributi/FOGLIA11/#id3, accessed on 12 November 2019), respectively.
The calculated pressure indices in ecological network elements were as follows:
-
The percentage area of sealed soil (i.e., urban areas) within nodes, corridors, and stepping stones;
-
The percentage area of corridors covered by other impactful land use types (intensive agriculture, intensive agriculture with seminatural residuals, perennial crops, alien vegetation);
-
The total length and density of linear barriers within corridors, nodes, and stepping stones.

3. Results

3.1. Ecological Network Infrastructure Features

The ecological network for the Isonzo–Vipacco area is represented in Figure 2. The nodes covered 27.0% of the studied area and were represented by 48 CORINE habitat categories. A large portion of the nodes was represented by the downy oak forests in the San Martino del Carso and Doberdò del Lago area, which act as nodes for the stag beetle Lucanus cervus L., and as potential stepping stones for other target animal species. A significant portion of the nodes was concentrated along the rivers or in the immediately surrounding areas. Other, smaller nodes were scattered across most of the study area.
The corridors covered 11.8% of the studied area and connected most of the nodes, with roughly 45% of the corridor area being represented by level I corridors (Table 1). The stepping stones covered 4.9% of the study area (34.5% of stepping stones overlaps with corridors) and were represented by 10 habitat types.

3.2. Anthropic Pressures

Overall, soil sealing covered 19.1% of corridor area, 8.7% of stepping stone area and 6.1% of node area (Table 1, Table S5). In the corridors, the most widespread source of impact was intensive agriculture (32.3% of corridor area) followed by soil impermeabilization, perennial crops (15.0%), intensive agricultural areas with semi-natural patches (11.0%), and areas dominated by alien plant species (6.7%) (Table 1, Table S6). Additionally, 53.4% of the area of stepping stones was represented by intensive agricultural areas with semi-natural residuals.
As for the density of roads and railways, it was consistently higher in corridors (14.5 m/ha–16.0 m/ha in level I corridors and 13.2 m/ha in level II corridors) if compared with stepping stones (5.3 m/ha) and nodes (4.5 m/ha) (Table 1, Table S7). Additionally, overall density of dams and weirs in nodes is 0.2 m/ha (Table 1, Table S8). As for water management, the study area includes 24 water intake structures used for supply of drinking water, power production purposes and irrigation, 11 of which are on the Isonzo, with 8 on the Vipacco, and 5 on secondary waterways.
Anthropic pressures were differentially distributed within the network. The incidence of anthropic impacts in each studied municipality is reported in Tables S5–S8, which show a wide variability among municipalities, ranging from areas where the pressures are high and widespread (such as in Gorizia) to less impacted areas (such as in Savogna d’Isonzo). In corridors, soil sealing was more widespread in the central and northern parts of the study area if compared with the southern part, and it was particularly prevalent in the area of the airport (Ronchi dei Legionari) and in the municipalities of Villesse (presence of shopping centers), Gradisca d’Isonzo and Gorizia (provincial capital) (Figure 3a). Stepping stones, on the other hand, were particularly interested by soil impermeabilization in the central sections of the study area. Intensive agriculture areas within corridors had an opposite distribution if compared with soil sealing, with most affected corridors being in the central and southern sections of the study area (Figure 3b).

4. Discussion

Our study introduced and applied a biodiversity-centric approach to the planning of GI networks, starting from their basic component—the ecological network. Being tailored on the ecological needs of a variety of threatened and/or sensitive species, our method is likely to improve the potential of GI networks for biodiversity conservation at large [23], especially if compared with other approaches based on less objectively defined concepts such as a limited number of specific ecosystem services, which are often lacking a clear method for ensuring biodiversity conservation [50]. This difference might be critical, especially when considering the central role that biodiversity has in providing ecosystem services [11]. A potential limitation is represented by the fact that, in our methodology, habitat crossing scores are heavily dependent on the opinion of individual experts and their knowledge of local biodiversity, which of course entails a degree of subjectivity. It must be remembered, however, that experience-based local ecological expert knowledge is increasingly considered pivotal in enhancing the efficacy of conservation planning [51].
By using this methodology, we mapped the most important habitats for the conservation of biodiversity in the study area, also highlighting potential corridors and stepping stones connecting said habitats and taking into account the ecological needs of a wide array of vulnerable species. A focal element in this network is the Isonzo river itself, as one would expect given its centrality in the ecology and geomorphology of this area, and the large number of wetland-linked target species that were chosen as a consequence.
Urban–industrial development inside nodes appears to be a relatively minor problem, which is unsurprising given that habitats chosen as nodes were suitable for vulnerable target species, and are consequently often habitats of high ecological value. Exceptions include, for instance, artificial habitat patches such as quarries or canals, which are potentially useful habitats for the water snake Natrix tessellata (Laurenti) and other aquatic species. Another example are habitats included in large grey infrastructure, such as meadows neighboring the Trieste–Friuli Venezia Giulia Airport (Figure 3a).
Stepping stones, while not ideal habitats for the target species, can play a relevant role for biodiversity because of their low crossing cost for the selected species, and the relatively low incidence of soil sealing and related impacts. On the other hand, soil sealing is much more widespread in the corridors, which will thus require a more careful management.
The percentage of soil sealing and other impactful land uses remains similar even when considering separately level I and level II corridors, even though level I corridors have a higher incidence of alien vegetation areas and intensive agricultural areas with semi-natural residuals, but a lower incidence of intensive agriculture (Table 1). Intensive agriculture, in fact, represents a particularly damaging source of impacts [52], and as such, species links tend to avoid it when possible. Agricultural areas can, however, also be relevant for ecological network creation. For instance, more than half of the stepping stones in the study area are represented by agricultural areas with semi-natural residuals, which are potentially useful for the European green lizard, but also for many other species [53].
Given the extension of the proposed network, a cooperative effort between interested municipalities would be ideal to fully implement it. In this regard, the ecological network of the recently approved Regional Landscape Plan, may be a useful reference in the Friuli Venezia Giulia region, given the lack of specific planning tools for the creation of GI networks. However, the modular nature of the network itself allows a degree of freedom to individual municipalities, which might have restrictions in terms of funding or practical impediments (such as existing grey infrastructures) to the implementation of certain sections of the network. The conservation of nodes, and especially level I nodes, should be the first priority, followed by the realization of level I and (if possible) level II corridors, and finally by the enhancement of stepping stones.
The realization of corridors (and, to a lesser degree, the enhancement of stepping stones) would require a variety of different strategies and interventions, also depending on the environmental context and the ecological requirements of the species that are most likely to be found in said context. In agricultural areas, for instance, actions that are considered generally beneficial for ecological connectivity, biodiversity, and ecosystem services include the preservation of small natural habitat fragments (such as hedgerows, grassy strips, and small woods) [54,55], crop diversification [56], the creation of artificial wildlife-friendly habitats in or around fields such as flower strips and specific cover crops [57] and the reduction in impactful practices such as pesticide use or conventional tillage [58,59]. Given the distribution of intensive agriculture within corridors in our study area, municipalities in the southern part of the area will have to pay particular attention to these measures.
Urban and industrial environments (such as the city of Gorizia in our case study) present a different and even more difficult challenge, given their high population density, the level of soil sealing and, more generally, the much more drastic transformations of the environment. There are, however, many ways of improving connectivity and biodiversity conservation even in such environments. These include the correct management of gardens and parks [60], establishing some areas within them where wild vegetation is preserved from excessive mowing, selectively removing invasive plant species, using native wildlife-friendly plant species as ornamentals, installing artificial shelters for small vertebrates and arthropods, and reducing the use of pesticides and fertilizers. Similar measures should be applied also to smaller green areas such as flower beds, tree rows, and green roofs, which could act as precious stepping stones furtherly increasing ecological connectivity across urban areas [61]. When undertaking such actions, even private gardens and green areas can play a pivotal role [62], and thus, environmental education and awareness campaigns aimed at citizens become of prime importance.
A unique challenge linked to urbanization and soil sealing is represented by roads and highways, as vehicular traffic causes wildlife mortality as well as disturbance that discourages migrations and connectivity [63,64]. Tunnels and bridges allowing animals to cross roads unperturbed can relieve the problem [65], especially for groups that need to move periodically during their life cycle, such as amphibians [66].

5. Conclusions

Being based on a habitat map and knowledge about the habitat needs of focus species, our biodiversity-centric approach to GI network planning is a simple-to-implement tool that could be applied to a variety of situations and geographical contexts. Our case study focused on ecological network mapping as strategy to organize local resources to favor biodiversity, a goal that would be desirable in many other areas, and that would also be likely to benefit the provision of ecosystem services. Networks aimed at protecting entire communities might be less efficient at protecting single specialized species. However, the multi-species approach is widely applied in ecological connectivity studies [67,68], and some scholars highlight that unseen biodiversity must be included in systematic conservation planning approaches [69]. Additionally, it would be possible to apply the very same method to a more restricted number of endangered or sensitive species that require particular attention, thus planning a network tailored to their specific conservation needs. Since the study area is in contact with the border of Slovenia, it would be useful to plan a consistent cross-border GI network; this would require the setting of a future framework to promote the application of the method tested in this study to the territory of the neighboring country as well. In all cases, the modularity of the planned ecological network allows for a high degree of freedom in its implementation in case resources are not sufficient for the ideal scenario of realizing a cross-border network, or even the entire Italian section of the network.
In conclusion, this approach might complement and improve the way in which present and future GI networks are conceived.

Supplementary Materials

The following supporting information can be downloaded at: https://0-www-mdpi-com.brum.beds.ac.uk/article/10.3390/su16093604/s1, Figure S1: Generation of Minimum Spanning Trees; Figure S2: Mapping of the corridors for the ecological network; Table S1: Municipalities of the studied area; Table S2: Criteria for target species selection; Table S3: Focus animal species; Table S4: Focus plant habitats; Table S5: Soil sealing in the network; Table S6: Other anthropic impacts in the corridors; Table S7: Terrestrial linear barriers; Table S8: Aquatic linear barriers. Excel: Crossing costs for focal species and habitats.

Author Contributions

Conceptualization, F.L. and M.S.; Methodology, F.L. and M.S.; Formal Analysis, F.L.; Investigation, F.L., F.B., E.P. and M.D.L.; Resources, M.S.; Data Curation, F.L.; Writing—Original Draft Preparation, F.L.; Writing—Review and Editing, F.L., F.B., L.P., M.D.L., E.P., P.Z. and M.S.; Visualization, F.L.; Supervision, M.S.; Project Administration, M.S.; Funding Acquisition, M.S. All authors have read and agreed to the published version of the manuscript.

Funding

This study was funded by Regione Friuli Venezia Giulia (GREVISLIN INTERREG Italia-Slovenia Project—Green infrastructures for the conservation and improvement of the condition of habitats and protected species along the rivers, WP3.1, CUP number: G76I18000080007) [https://www.ita-slo.eu/en/grevislin (accessed on 20 February 2024)].

Institutional Review Board Statement

Not applicable.

Informed Consent Statement

Not applicable.

Data Availability Statement

Data will be made available upon request.

Conflicts of Interest

Author Matteo De Luca was employed by the company For-Nature S.r.l. The remaining authors declare that the research was conducted in the absence of any commercial or financial relationships that could be construed as a potential conflict of interest.

References

  1. Tscharntke, T.; Klein, A.M.; Kruess, A.; Steffan-Dewenter, I.; Thies, C. Landscape Perspectives on Agricultural Intensification and Biodiversity—Ecosystem Service Management. Ecol. Lett. 2005, 8, 857–874. [Google Scholar] [CrossRef]
  2. Flynn, D.F.B.; Gogol-Prokurat, M.; Nogeire, T.; Molinari, N.; Richers, B.T.; Lin, B.B.; Simpson, N.; Mayfield, M.M.; DeClerck, F. Loss of Functional Diversity under Land Use Intensification across Multiple Taxa. Ecol. Lett. 2009, 12, 22–33. [Google Scholar] [CrossRef] [PubMed]
  3. Gámez-Virués, S.; Perović, D.J.; Gossner, M.M.; Börschig, C.; Blüthgen, N.; de Jong, H.; Simons, N.K.; Klein, A.-M.; Krauss, J.; Maier, G.; et al. Landscape Simplification Filters Species Traits and Drives Biotic Homogenization. Nat. Commun. 2015, 6, 8568. [Google Scholar] [CrossRef] [PubMed]
  4. Halfwerk, W.; Slabbekoorn, H. Pollution Going Multimodal: The Complex Impact of the Human-Altered Sensory Environment on Animal Perception and Performance. Biol. Lett. 2015, 11, 20141051. [Google Scholar] [CrossRef] [PubMed]
  5. Conway, G.R.; Pretty, J.N. Unwelcome Harvest: Agriculture and Pollution; Cambridge University Press (CUP): Cambridge, UK, 2013. [Google Scholar]
  6. Gutiérrez, J.L.; Jones, C.G.; Sousa, R. Toward an Integrated Ecosystem Perspective of Invasive Species Impacts. Acta Oecologica 2014, 54, 131–138. [Google Scholar] [CrossRef]
  7. Boscutti, F.; Lami, F.; Pellegrini, E.; Buccheri, M.; Busato, F.; Martini, F.; Sibella, R.; Sigura, M.; Marini, L. Urban Sprawl Facilitates Invasions of Exotic Plants across Multiple Spatial Scales. Biol. Invasions 2022, 24, 1497–1510. [Google Scholar] [CrossRef]
  8. Isbell, F.; Calcagno, V.; Hector, A.; Connolly, J.; Harpole, W.S.; Reich, P.B.; Scherer-Lorenzen, M.; Schmid, B.; Tilman, D.; van Ruijven, J.; et al. High Plant Diversity Is Needed to Maintain Ecosystem Services. Nature 2011, 477, 199–202. [Google Scholar] [CrossRef]
  9. Allan, E.; Manning, P.; Alt, F.; Binkenstein, J.; Blaser, S.; Blüthgen, N.; Böhm, S.; Grassein, F.; Hölzel, N.; Klaus, V.H.; et al. Land Use Intensification Alters Ecosystem Multifunctionality via Loss of Biodiversity and Changes to Functional Composition. Ecol. Lett. 2015, 18, 834–843. [Google Scholar] [CrossRef] [PubMed]
  10. Power, A.G. Ecosystem Services and Agriculture: Tradeoffs and Synergies. Philos. Trans. R. Soc. Lond. B Biol. Sci. 2010, 365, 2959–2971. [Google Scholar] [CrossRef]
  11. Jato-Espino, D.; Capra-Ribeiro, F.; Moscardó, V.; del Pino, L.E.B.; Mayor-Vitoria, F.; Gallardo, L.O.; Carracedo, P.; Dietrich, K. A Systematic Review on the Ecosystem Services Provided by Green Infrastructure. Urban. For. Urban. Green. 2023, 127998. [Google Scholar] [CrossRef]
  12. European Commission. Communication from the Commission to the Council, The European Parliament, The Economic and Social Committee and the Committee of Regions—Green Infrastructure (GI)—Enhancing Europe’s Natural Capital; Kluwer Law International BV: Alphen aan den Rijn, The Netherlands, 2013; Volume 1. [Google Scholar]
  13. da Silva, J.M.C.; Wheeler, E. Ecosystems as Infrastructure. Perspect. Ecol. Conserv. 2017, 15, 32–35. [Google Scholar] [CrossRef]
  14. Mell, I.C. Aligning Fragmented Planning Structures through a Green Infrastructure Approach to Urban Development in the UK and USA. Urban. For. Urban. Green. 2014, 13, 612–620. [Google Scholar] [CrossRef]
  15. Ferreira, J.C.; Monteiro, R.; Silva, V.R. Planning a Green Infrastructure Network from Theory to Practice: The Case Study of Setúbal, Portugal. Sustainability 2021, 13, 8432. [Google Scholar] [CrossRef]
  16. Parker, J.; de Baro, M.E.Z. Green Infrastructure in the Urban Environment: A Systematic Quantitative Review. Sustainability 2019, 11, 3182. [Google Scholar] [CrossRef]
  17. Snäll, T.; Lehtomäki, J.; Arponen, A.; Elith, J.; Moilanen, A. Green Infrastructure Design Based on Spatial Conservation Prioritization and Modeling of Biodiversity Features and Ecosystem Services. Environ. Manag. 2016, 57, 251–256. [Google Scholar] [CrossRef] [PubMed]
  18. Srivastava, D.S.; Bell, T. Reducing Horizontal and Vertical Diversity in a Foodweb Triggers Extinctions and Impacts Functions. Ecol. Lett. 2009, 12, 1016–1028. [Google Scholar] [CrossRef] [PubMed]
  19. Balvanera, P.; Pfisterer, A.B.; Buchmann, N.; He, J.-S.; Nakashizuka, T.; Raffaelli, D.; Schmid, B. Quantifying the Evidence for Biodiversity Effects on Ecosystem Functioning and Services. Ecol. Lett. 2006, 9, 1146–1156. [Google Scholar] [CrossRef]
  20. Ward, M.; Rhodes, J.R.; Watson, J.E.M.; Lefevre, J.; Atkinson, S.; Possingham, H.P. Use of Surrogate Species to Cost-Effectively Prioritize Conservation Actions. Conserv. Biol. 2020, 34, 600–610. [Google Scholar] [CrossRef] [PubMed]
  21. Roberge, J.-M.; Angelstam, P. Usefulness of the Umbrella Species Concept as a Conservation Tool. Conserv. Biol. 2004, 18, 76–85. [Google Scholar] [CrossRef]
  22. Hilty, J.A.; Lidicker, W.Z., Jr.; Merenlender, A.M. Corridor Ecology: The Science and Practice of Linking Landscapes for Biodiversity Conservation; Island Press: Washington, DC, USA, 2012. [Google Scholar]
  23. APAT. Gestione Delle Aree Di Collegamento Ecologico Funzionale—Indirizzi e Modalità Operative per l’Adeguamento Degli Strumenti. 2003. Available online: https://www.isprambiente.gov.it/contentfiles/00003500/3500-gestecolog-funz.pdf (accessed on 12 November 2019).
  24. Ministry for the Environment Land and Sea. Italy’s Fifth National Report to the Convention on Biological Diversity; Ministry for the Environment Land and Sea: Roma, Italy, 2013. [Google Scholar]
  25. Falcucci, A.; Maiorano, L.; Boitani, L. Changes in Land-Use/Land-Cover Patterns in Italy and Their Implications for Biodiversity Conservation. Landsc. Ecol. 2007, 22, 617–631. [Google Scholar] [CrossRef]
  26. Maiorano, L.; Falcucci, A.; Garton, E.O.; Boitani, L. Contribution of the Natura 2000 Network to Biodiversity Conservation in Italy. Conserv. Biol. 2007, 21, 1433–1444. [Google Scholar] [CrossRef]
  27. Poldini, L.; Oriolo, G.; Vidali, M.; Tomasella, M.; Stoch, F.; Orel, G. Manuale Degli Habitat Del Friuli Venezia Giulia. Strumento a Supporto Della Valutazione d’impatto Ambientale (VIA), Ambientale Strategica (VAS) e d’incidenza Ecologica (VIEc); Region. Autonoma Friuli Venezia Giulia–Direz. Centrale Ambiente e Lavori Pubblici–Servizio Valutazione Impatto Ambientale; Univ. Studi Trieste–Dipart. Biologia: Trieste, Italy, 2006. [Google Scholar]
  28. Tockner, K.; Schiemer, F.; Ward, J.V. Conservation by Restoration: The Management Concept for a River-Floodplain System on the Danube River in Austria. Aquat. Conserv. 1998, 8, 71–86. [Google Scholar] [CrossRef]
  29. Ward, J.V.; Tockner, K.; Schiemer, F. Biodiversity of Floodplain River Ecosystems: Ecotones and Connectivity1. Regul. Rivers Res. Manag. 1999, 15, 125–139. [Google Scholar] [CrossRef]
  30. Nowicki, P.; Marczyk, J.; Kajzer-Bonk, J. Metapopulations of Endangered Maculinea Butterflies Are Resilient to Large-scale Fire. Ecohydrology 2015, 8, 398–405. [Google Scholar] [CrossRef]
  31. Balletto, L.; Bonelli, S.; Cassulo, L. Mapping the Italian Butterfly Diversity for Conservation. In Studies on the Ecology and Conservation of Butterflies in Europe Vol. 1. General Concepts and Case Studies; Kühn, E., Feldmann, R., Thomas, J.A., Settele, J., Eds.; Pensoft Publ. Co.: Sofia, Bulgaria; Moscow, Russia, 2005; pp. 71–76. [Google Scholar]
  32. Lai, B.-C.G.; Pullin, A.S. Phylogeography, Genetic Diversity and Conservation of the Large Copper Butterfly Lycaena Dispar in Europe. J. Insect Conserv. 2004, 8, 27–36. [Google Scholar] [CrossRef]
  33. Santovito, A.; Audisio, M.; Bonelli, S. A Micronucleus Assay Detects Genotoxic Effects of Herbicide Exposure in a Protected Butterfly Species. Ecotoxicology 2020, 29, 1390–1398. [Google Scholar] [CrossRef]
  34. Nowicki, P.; Witek, M.; Skórka, P.; Settele, J.; Woyciechowski, M. Population Ecology of the Endangered Butterflies Maculinea Teleius and M. Nausithous and the Implications for Conservation. Popul. Ecol. 2005, 47, 193–202. [Google Scholar] [CrossRef]
  35. Assessorato alle infrastrutture e Territorio Regione Friuli Venezia Giulia. Piano Paesaggistico Regionale del Friuli Venezia Giulia. In Scheda Ambito Di Paesaggio 8: Alta. Pianura Friulana e Isontina; 2018; Available online: https://www.regione.fvg.it/rafvg/export/sites/default/RAFVG/ambiente-territorio/pianificazione-gestione-territorio/FOGLIA21/allegati/BUR/18_SO25_1_DPR_111_19_ALL19.pdf (accessed on 4 December 2023).
  36. Moss, D.; Wyatt, B.K. The CORINE Biotopes Project: A Database for Conservation of Nature and Wildlife in the European Community. Appl. Geogr. 1994, 14, 327–349. [Google Scholar] [CrossRef]
  37. Directorate-General for Environment (Europaean Commission). CORINE Biotopes Manual:A Method to Identify and Describe Consistently Sites of Major Importance for Nature Conservation. Volume III, Data Specifications, Part II.; Publications Office: Luxembourg, 1991. [Google Scholar]
  38. Rivas-Martinez, S. Notions on Dynamic-Catenal Phytosociology as a Basis of Landscape Science. Plant Biosyst.-Int. J. Deal. All Asp. Plant Biol. 2005, 139, 135–144. [Google Scholar] [CrossRef]
  39. Blasi, C. La Vegetazione d’Italia Con Carta Delle Serie Di Vegetazione in Scala 1:500.000; Palombi Editori: Roma, Italy, 2010. [Google Scholar]
  40. Tolman, T. Collins Field Guide—Butterflies of Britain and Europe; HarperCollins: New York, NY, USA, 2004. [Google Scholar]
  41. Massa, B.; Fontana, P.; Buzzetti, F.M.; Kleukers, R.; Baudewijn, O. Fauna d’ Italia—Vol XLVIII—Orthoptera; Edagricole: Bologna, Italy, 2012. [Google Scholar]
  42. Fanin, Y.; Tami, F.; Guzzon, C.; Candotto, S.; Merluzzi, P. Nuove Località Di Zeuneriana Marmorata (Fieber, 1853) (Insecta Orthoptera) in Friuli Venezia Giulia (Italia Nord-Orientale). Gortania. Bot. Zool. 2016, 37, 35–41. [Google Scholar]
  43. Paolucci, P. Le Farfalle Dell’Italia Nordorientale. Guida al Riconoscimento; Cierre Edizioni: Caselle, Italy, 2010. [Google Scholar]
  44. Di Nicola, M.; Cavigioli, L.; Luiselli, L. Anfibi & Rettili d’Italia; Belvedere: Latina, Italy, 2019. [Google Scholar]
  45. Foltête, J.-C.; Vuidel, G.; Savary, P.; Clauzel, C.; Sahraoui, Y.; Girardet, X.; Bourgeois, M. Graphab: An Application for Modeling and Managing Ecological Habitat Networks. Softw. Impacts 2021, 8, 100065. [Google Scholar] [CrossRef]
  46. Adriaensen, F.; Chardon, J.P.; De Blust, G.; Swinnen, E.; Villalba, S.; Gulinck, H.; Matthysen, E. The Application of ‘Least-Cost’ Modelling as a Functional Landscape Model. Landsc. Urban. Plan. 2003, 64, 233–247. [Google Scholar] [CrossRef]
  47. Pop, P.C.; Matei, O.; Sabo, C.; Petrovan, A. A Two-Level Solution Approach for Solving the Generalized Minimum Spanning Tree Problem. Eur. J. Oper. Res. 2018, 265, 478–487. [Google Scholar] [CrossRef]
  48. Baudron, F.; Giller, K.E. Agriculture and Nature: Trouble and Strife? Biol. Conserv. 2014, 170, 232–245. [Google Scholar] [CrossRef]
  49. Puig-Montserrat, X.; Stefanescu, C.; Torre, I.; Palet, J.; Fàbregas, E.; Dantart, J.; Arrizabalaga, A.; Flaquer, C. Effects of Organic and Conventional Crop Management on Vineyard Biodiversity. Agric. Ecosyst. Environ. 2017, 243, 19–26. [Google Scholar] [CrossRef]
  50. Salomaa, A.; Paloniemi, R.; Kotiaho, J.S.; Kettunen, M.; Apostolopoulou, E.; Cent, J. Can Green Infrastructure Help to Conserve Biodiversity? Environ. Plann C Gov. Policy 2017, 35, 265–288. [Google Scholar] [CrossRef]
  51. Joa, B.; Winkel, G.; Primmer, E. The Unknown Known—A Review of Local Ecological Knowledge in Relation to Forest Biodiversity Conservation. Land. Use Policy 2018, 79, 520–530. [Google Scholar] [CrossRef]
  52. Dudley, N.; Alexander, S. Agriculture and Biodiversity: A Review. Biodiversity 2017, 18, 45–49. [Google Scholar] [CrossRef]
  53. Duelli, P.; Obrist, M.K. Regional Biodiversity in an Agricultural Landscape: The Contribution of Seminatural Habitat Islands. Basic. Appl. Ecol. 2003, 4, 129–138. [Google Scholar] [CrossRef]
  54. Öckinger, E.; Smith, H.G. Semi-Natural Grasslands as Population Sources for Pollinating Insects in Agricultural Landscapes. J. Appl. Ecol. 2007, 44, 50–59. [Google Scholar] [CrossRef]
  55. Holland, J.M.; Douma, J.C.; Crowley, L.; James, L.; Kor, L.; Stevenson, D.R.W.; Smith, B.M. Semi-Natural Habitats Support Biological Control, Pollination and Soil Conservation in Europe. A Review. Agron. Sustain. Dev. 2017, 37, 31. [Google Scholar] [CrossRef]
  56. Beillouin, D.; Ben-Ari, T.; Malézieux, E.; Seufert, V.; Makowski, D. Positive but Variable Effects of Crop Diversification on Biodiversity and Ecosystem Services. Glob. Chang. Biol. 2021, 27, 4697–4710. [Google Scholar] [CrossRef] [PubMed]
  57. Kolkman, A.; Dopagne, C.; Piqueray, J. Sown Wildflower Strips Offer Promising Long Term Results for Butterfly Conservation. J. Insect Conserv. 2022, 26, 387–400. [Google Scholar] [CrossRef]
  58. Ndakidemi, B.; Mtei, K.; Ndakidemi, P.A. Impacts of Synthetic and Botanical Pesticides on Beneficial Insects. Agric. Sci. 2016, 7, 364–372. [Google Scholar] [CrossRef]
  59. Rowen, E.K.; Regan, K.H.; Barbercheck, M.E.; Tooker, J.F. Is Tillage Beneficial or Detrimental for Insect and Slug Management? A Meta-Analysis. Agric. Ecosyst. Environ. 2020, 294, 106849. [Google Scholar] [CrossRef]
  60. Kong, F.; Yin, H.; Nakagoshi, N.; Zong, Y. Urban Green Space Network Development for Biodiversity Conservation: Identification Based on Graph Theory and Gravity Modeling. Landsc. Urban. Plan. 2010, 95, 16–27. [Google Scholar] [CrossRef]
  61. Aronson, M.F.J.; Lepczyk, C.A.; Evans, K.L.; Goddard, M.A.; Lerman, S.B.; MacIvor, J.S.; Nilon, C.H.; Vargo, T. Biodiversity in the City: Key Challenges for Urban Green Space Management. Front. Ecol. Environ. 2017, 15, 189–196. [Google Scholar] [CrossRef]
  62. Goddard, M.A.; Dougill, A.J.; Benton, T.G. Scaling up from Gardens: Biodiversity Conservation in Urban Environments. Trends Ecol. Evol. 2010, 25, 90–98. [Google Scholar] [CrossRef] [PubMed]
  63. Schwartz, A.L.W.; Shilling, F.M.; Perkins, S.E. The Value of Monitoring Wildlife Roadkill. Eur. J. Wildl. Res. 2020, 66, 18. [Google Scholar] [CrossRef]
  64. Andersson, P.; Koffman, A.; Sjödin, N.E.; Johansson, V. Roads May Act as Barriers to Flying Insects: Species Composition of Bees and Wasps Differs on Two Sides of a Large Highway. Nat. Conserv. 2017, 18, 47–59. [Google Scholar] [CrossRef]
  65. Helldin, J.O.; Petrovan, S.O. Effectiveness of Small Road Tunnels and Fences in Reducing Amphibian Roadkill and Barrier Effects at Retrofitted Roads in Sweden. PeerJ 2019, 2019, e7518. [Google Scholar] [CrossRef] [PubMed]
  66. Glista, D.J.; Devault, T.L.; Dewoody, J.A. Vertebrate road mortality predominantly impacts amphibians. Herpetol. Conserv. Biol. 2008, 3, 77–87. [Google Scholar]
  67. Modica, G.; Praticò, S.; Laudari, L.; Ledda, A.; Di Fazio, S.; De Montis, A. Implementation of multispecies ecological networks at the regional scale: Analysis and multi-temporal assessment. J. Environ. Management. 2021, 289, 112494. [Google Scholar] [CrossRef] [PubMed]
  68. Liang, G.; Niu, H.; Li, Y. A multi-species approach for protected areas ecological network construc-tion based on landscape connectivity. Glob. Ecol. Conserv. 2023, 46, e02569. [Google Scholar] [CrossRef]
  69. Delso, Á.; Fajardo, J.; Muñoz, J. Protected area networks do not represent unseen biodiversity. Sci. Rep. 2021, 11, 12275. [Google Scholar] [CrossRef]
Figure 1. Map of the study area and its main features, including land use categories.
Sustainability 16 03604 g001
Figure 2. Map of the proposed ecological network, highlighting nodes, corridors (level I and II), and stepping stones.
Sustainability 16 03604 g002
Figure 3. Incidence of soil sealing (a) and intensive agriculture (b) in the elements of the proposed ecological network. Color intensity is linked with impact incidence: for each network element (individual nodes, corridors or stepping stones, respectively, in red, blue, and green) darker colors are linked with a higher % area subjected to either soil sealing or intensive agriculture. Perfect white represents lack of soil sealing or intensive agriculture in the network element.
Sustainability 16 03604 g003
Table 1. Total area of the nodes, corridors and stepping stones of the ecological network, with the % covered by each anthropic impact and the density of linear barriers. Stepping stone area overlapping with corridors is excluded. Information about anthropic impacts other than soil sealing were obtained from the CORINE habitat mapping, the same source we used to map nodes and stepping stones. As such, there is no overlapping and thus no information about the incidence of these other impacts in nodes and stepping stones, although it is assumed to be low.
NodesCorridors
(Level I)
Corridors
(Level II)
Corridors
(Total)
Stepping Stones
Area (ha)9605.11881.72295.84177.51139.9
Soil sealing (%)6.118.819.419.18.7
Intensive agriculture (%)NA27.936.032.3NA
Intensive agriculture with seminatural residuals (%)NA13.09.511.053.4
Perennial crops (%)NA15.015.015.0NA
Alien vegetation (%)NA8.55.36.7NA
Land-based linear barrier density (m/ha)4.51613.214.55.3
Water linear barrier density (m/ha)0.2NANANANA
Disclaimer/Publisher’s Note: The statements, opinions and data contained in all publications are solely those of the individual author(s) and contributor(s) and not of MDPI and/or the editor(s). MDPI and/or the editor(s) disclaim responsibility for any injury to people or property resulting from any ideas, methods, instructions or products referred to in the content.

