Article

Robust Enhancement of Direct Air Capture of CO2 Efficiency Using Micro-Sized Anion Exchange Resin Particles

1
National Laboratory of Solid-State Microstructures, Collaborative Innovation Center of Advanced Microstructures, School of Physics, Nanjing University, Nanjing 210093, China
2
Hexquare Technology Co., Ltd., Beijing 100089, China
3
State Key Laboratory of Control and Simulation of Power Systems and Generation Equipment, Department of Energy and Power Engineering, Tsinghua University, Beijing 100084, China
4
Department of Earth and Environmental Engineering, Columbia University, New York, NY 10027, USA
5
Lenfest Center for Sustainable Energy, The Earth Institute, Columbia University, New York, NY 10027, USA
6
Department of Chemical Engineering, Columbia University, New York, NY 10027, USA
*
Authors to whom correspondence should be addressed.
Sustainability 2024, 16(9), 3601; https://0-doi-org.brum.beds.ac.uk/10.3390/su16093601
Submission received: 12 March 2024 / Revised: 13 April 2024 / Accepted: 23 April 2024 / Published: 25 April 2024

Abstract

:
In the quest to mitigate carbon dioxide emissions, it becomes essential to address the existing atmospheric CO2. Effective and economical methodologies, particularly those without additional energy consumption, are crucial. Currently, a leading method is the direct capture of CO2 using ion exchange resins, which achieve the adsorption and desorption of carbon dioxide simply by using the humidity variations. This technology, though minimizing additional energy cost, still needs improvement in its efficiency in CO2 capture capacity and compared to other methods. In this work, we develop low-cost techniques to reduce the AmberLite™ IRA900 Cl (IRA-900) anion exchange resin to micro size, and observe significant performance enhancement on CO2 capture efficiency contingent on reducing the particle diameters. This performance disparity is attributed to the differential water adsorption capacities inherent in particles of diverse diameters. Our results reveal that smaller resin particles outperform their larger counterparts, exhibiting accelerated adsorption rates and expedited transitions from wet to dry states. Notably, these smaller particles display a quintupled enhancement in adsorption efficacy relative to non-treated particles and a marked increase in relative adsorption capacity. Upon treatment, IRA-900 demonstrates robust CO2 processing efficiency, achieving a peak adsorption rate of 1.28 g/mol·h and a maximum desorption rate of 1.18 g/mol·h. Also, the material is subjected to almost 100 cycles of testing, and even after 100 cycles, the resin particles maintain a capacity of 100%. Moreover, our material can be fully regenerated to 100% efficiency by simply immersing it in water. Simultaneously, storing it in water allows for the long-term maintenance of its performance without other treatment methods. A key observation is the resin’s sustained performance stability post extended exposure to humid conditions. These outcomes offer substantial practical implications, emphasizing the relevance of our study in practical environmental applications.

1. Introduction

Recent projections by the Intergovernmental Panel on Climate Change (IPCC) indicate a substantial increase in global CO2 emissions, estimated to reach 48–55 Gt/yr by 2050 [1]. This trend aligns with an expected surge in energy demands, potentially escalating by 40–150% compared to current levels [2]. Consequently, atmospheric CO2 concentrations could rise to 535–983 ppm by 2100, nearly doubling the current concentration of 406 ppm [3]. This significant rise in CO2 levels is anticipated to contribute to a global mean temperature increase ranging from 1.4 °C to 6.1 °C between 1990 and 2100 [4].
In light of these developments, the urgency for efficient ambient air CO2 capture methods has become a focal point of discussion [5,6]. Anion exchange resin particles, within the framework of carbon capture and utilization (CCU), have emerged as a promising solution for enhancing CO2 capture processes [7,8,9].
Historical carbon capture efforts predominantly targeted industrial emissions reduction [10]. However, to make substantial strides in climate change mitigation, there is a pressing need to develop methods that actively remove CO2 from the atmosphere [11,12,13,14,15,16]. Anion exchange resins, renowned for their versatility, tunable properties, and efficient reversible adsorption/desorption processes, offer a viable approach for ambient air CO2 capture [17,18].
Our study contributes to this evolving domain by evaluating the efficacy of anion exchange resin particles of varying sizes in capturing CO2 from ambient air. We investigate the adsorption characteristics and the influence of particle size on the efficiency of CO2 capture. The subsequent sections present our methodology, experimental results, and discussions, underscoring their significance in advancing technologies for effective climate change mitigation.

2. Moisture-Swing Sorption Model

This study introduces resin particles based on quaternary ammonium cations, specifically engineered for atmospheric carbon dioxide capture [19]. These particles exhibit a high efficiency in both the absorption and release of CO2, primarily driven by variations in ambient moisture. In dry conditions, the resin particles actively absorb CO2, while the presence of moisture triggers the desorption of CO2 [19,20,21,22]. This moisture-induced cyclic process presents a cost-effective approach for large-scale carbon dioxide capture, leveraging water as the principal driving force [3,19].
The research quantifies the actual water consumption for this moisture-swing carbon dioxide capture method, ranging from 12 to 37 moles of water per mole of CO2 captured [23]. Consideration is given to the use of seawater as a potential water source, factoring in the additional energy costs associated with current desalination technologies [24,25]. These costs are estimated to be between 2.4 and 9.6 kJ/mol CO2 [24]. Throughout the moisture-swing process, water functions as an energy carrier, wherein the free energy utilized in concentrating CO2 is released as water evaporates from the resin’s surface [11,26]. This evaporation process, although spontaneous, necessitates enthalpy which is supplied by the airflow through the drying sorbent [17,27].
A notable aspect of this process is the considerable difference between the air’s capacity to carry water and its CO2 content [28,29]. As a result, the drying phase of the process does not require additional structural support, allowing for its integration into existing infrastructure designed for air–CO2 contact. Furthermore, while the drying process is sequential to CO2 capture, it also exhibits potential for partial overlap, enhancing the efficiency of the overall system [23,27,30].
The fundamental mechanism underpinning the proposed CO2 capture method is governed by changes in ambient humidity, primarily involving the hydration and dehydration processes of ions within ion exchange resins [19,31]. Cations on the surface of an ion exchange resin (IER) play a pivotal role in disrupting the crystal structure of sodium carbonate (Na2CO3) [2,22]. This disruption fosters an environment conducive to the independent hydration of carbonate ions, leading to either a reduction or an increase in the number of water molecules within the hydration cloud of these ions. The resultant variation in hydration numbers is central to the moisture-driven CO2 adsorption and desorption process [32].
The process of CO2 adsorption and desorption can be delineated through a sequence of chemical reactions (Figure 1) [20]. These include the dissociation of water molecules, the formation of bicarbonate ions, the adsorption of CO2 onto hydroxide ions, and the subsequent release of CO2 and H2O from bicarbonate ions. For clarity and precision, these reactions are categorized into four distinct stages, as outlined in [Equations (1)–(4)]. Each stage encapsulates a specific aspect of the chemical interactions occurring within the resin, contributing to the overall efficiency of the CO2 capture process. This mechanistic understanding is essential for optimizing the design and operation of systems utilizing ion exchange resins for effective ambient air CO2 capture.
H2O ↔ H+ + OH
CO32− + H+ ↔ HCO3
OH + CO2 ↔ HCO3
HCO3 + HCO3 ↔ CO32− + CO2 + H2O
The activity of water in nanopores governs all ion interactions on the absorbent. Here, we hypothesize that a reduction in water activity leads to a decrease in the stability of the carbonate ions, which are then replaced by hydroxide and bicarbonate ions [Equation (5)]:
CO32− + nH2O ↔ HCO3 +OH + (n − 1) H2O
Under dry conditions (lower water activity, smaller n), this material acts as a stronger CO2 adsorbent, primarily due to the assistance of a greater number of hydroxide ions (OH) present. In wet conditions (higher water activity, larger n), its performance is relatively weaker. As water activity decreases, the equilibrium in [Equation (5)] shifts to the right, which might seem to contradict the law of mass conservation. However, the (n − 1) water molecules on the right side of the equation are not mere bystanders but actively participate in the reaction through hydration. The reduction in water activity within nanostructured pores is significantly more pronounced than what can be achieved in aqueous solutions.
Considering that the total equation of hydration water is represented by [Equation (6)], this finding helps explain the varying performance of this material as a CO2 adsorbent under different humidity conditions. It provides insights into the future applications of humidity-driven CO2 adsorbents. The chemical reaction shifts to the right with a smaller number of water molecules to produce more OH ions, which is beneficial for CO2 absorption. Conversely, it shifts to the left with a larger number of water molecules.
CO32−nH2O ↔ HCO3m1H2O+ OHm2H2O + (nm1m2 − 1)H2O

3. Materials and Methods

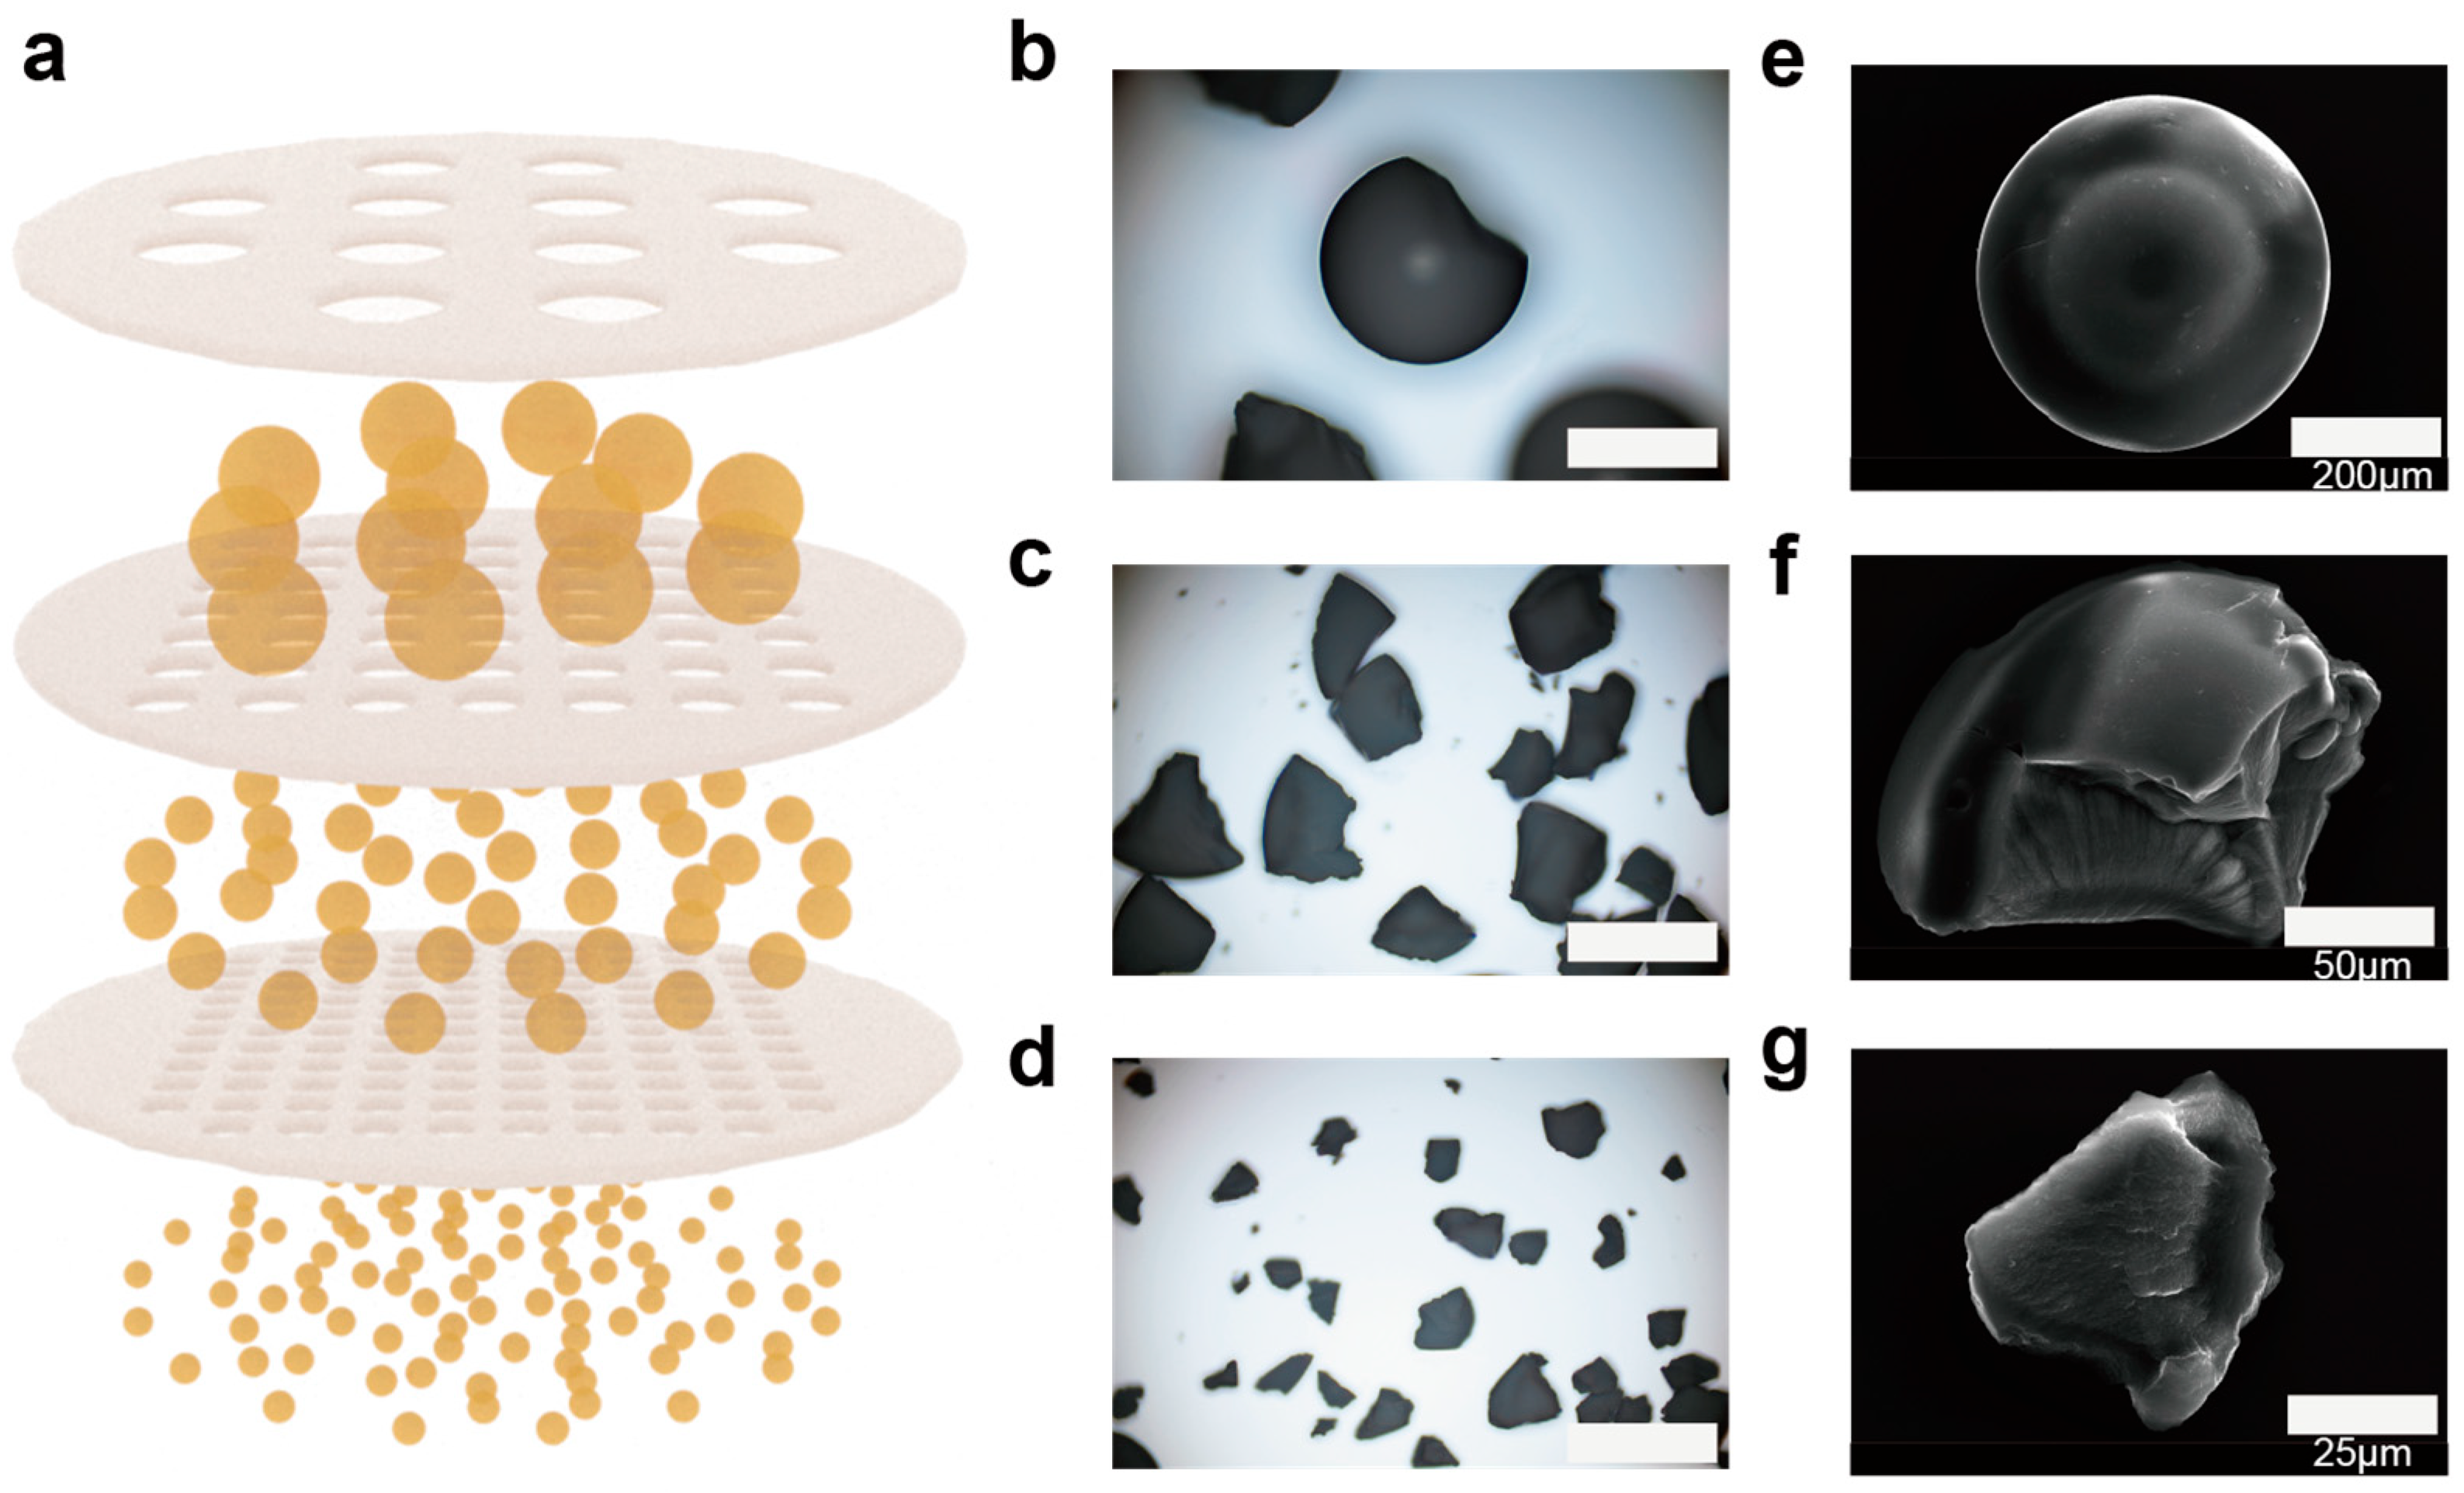
3.1. Preparation and Characterization of Amine-Based Anion Exchange Resins (IRA-900)

In the present study, we examine IRA-900, a variant of a strongly alkaline anion exchange resin. These resin particles, characterized by their distinct pale yellow hue, exhibit diameters within the range of 0.58 to 0.8 mm (Figure 2b,e). A precise chemical formula underpins their composition. To facilitate optimal ion exchange, an initial treatment protocol is implemented, involving the immersion of these particles in a 1 M solution of sodium carbonate. The methodology dictates that for each gram of resin, a volume of 500 mL of the sodium carbonate solution is employed. This immersion process spans a duration of 12 h and is executed over three distinct cycles to ensure uniform treatment.
Subsequent to this preparatory phase, a rigorous rinsing process is undertaken. This involves the use of deionized water, meticulously applied to purge any residual sodium carbonate from the resin’s surface. The necessity of this step is underscored by the potential impact of residual sodium carbonate on the integrity of subsequent experimental procedures, particularly those that assess the resin’s efficacy and reactivity.
The processed IRA-900 resin particles are sieved through a sieve and then placed in a drying cabinet for 48 h until they are completely dry (and saturated with carbon dioxide). Following this, 5 g of the particles are removed and placed in a grinder (brand) for 20 s. Subsequently, the powdered particle mixture is introduced into deionized water for thorough mixing and allowed to settle for 48 h, completely desorbing carbon dioxide. Different-sized sieves, with pore sizes of 0.0375 mm, 0.076 mm, 0.16 mm, 0.28 mm, 0.4 mm, and 0.58 mm, are used. The mixture of powdered particles is poured into the sieve with the smallest pore size (refer to Figure 2a), and by arranging sieves with progressively larger pore sizes below, five groups of resin particle powder within different diameter ranges are obtained. These five groups are as follows: (1), 0.0375–0.076 mm; (2), 0.076–0.16 mm; (3), 0.16–0.28 mm; (4), 0.28–0.4 mm; and (5), 0.4–0.58 mm. The resin particles of different diameters are each stored in deionized water.

3.2. Absorption−Desorption Experimental

In our study, we design an experimental setup for the adsorption and desorption of IRA-900 resin particles, focusing on their CO2 absorbent properties (Figure 3). The setup, incorporating humidity control, aimed to measure the half-life of the moisture-swing CO2 absorbent, defined as the duration for the absorbent to reach 50% of its capacity. The apparatus layout is detailed in the provided diagram.
CO2 concentration changes during adsorption are monitored using an infrared gas analyzer (IRGA) (Figure 3b). For desorption, a similar measurement approach is employed (Figure 3c). The adsorption process involves reducing humidity in the gas path using a dew point dehumidifier, allowing us to adjust the dew point temperature, typically set at 10 °C, and maintain relative humidity between 16% and 20%.
The inclusion of the IRGA facilitates the continuous monitoring of CO2 adsorption. The experimental setup’s airtightness is verified at various CO2 concentrations (8000 ppm, 5000 ppm, 3000 ppm, and 1000 ppm). At 5000 ppm, we observe a leakage rate of 30 ppm/h, and at 1000 ppm, it ranges from 1 to 5 ppm/h. This low leakage rate underscores the setup’s airtightness, crucial for ensuring experimental accuracy and minimizing ambient air interference.
To ensure the accuracy of our measurements during the adsorption and desorption of samples, humid fresh samples (0.01–0.02 g of IRA-900) are placed in quartz boats (Figure 3a), ensuring an even spread of the sample powder particles for full contact with the carrier gas. The quartz boats containing the samples are then placed inside a sample chamber. After an initial period of gas circulation in the system, we could visually observe a change in the color of the sample powder particles. This color change indicates the moisture content of the sample. Through multiple experiments, we found that the system’s relative humidity (RH) at around 35% marks the point when the sample began to adsorb CO2. During this phase, the system remains in a closed environment, isolating external influences on our experiment.
When we observe that the material had adsorbed to a significant extent, such as when the observable adsorption rate decreased (indicating a slowing of the CO2 concentration decrease), we initiate desorption experiments. At the start of the desorption experiments, we use nitrogen to sweep a bubbling bottle. The water in the bubbling bottle had been allowed to stand in ambient air for over a week to minimize its impact on CO2 absorption. A ball valve is switched to redirect the adsorption gas path to the desorption gas path.
The entire experimental apparatus maintains a gas flow rate of 0.8 L/min. The gas path volume for the adsorption route is approximately 1.0 L, allowing the system to complete one cycle in about one minute, ensuring rapid experiments and accurate test data. In contrast, the gas path volume for the desorption route is approximately 0.25 L, and the gas path circulates about three times within a minute. This design ensures the quick progression of the desorption phase and the accuracy of the test data.

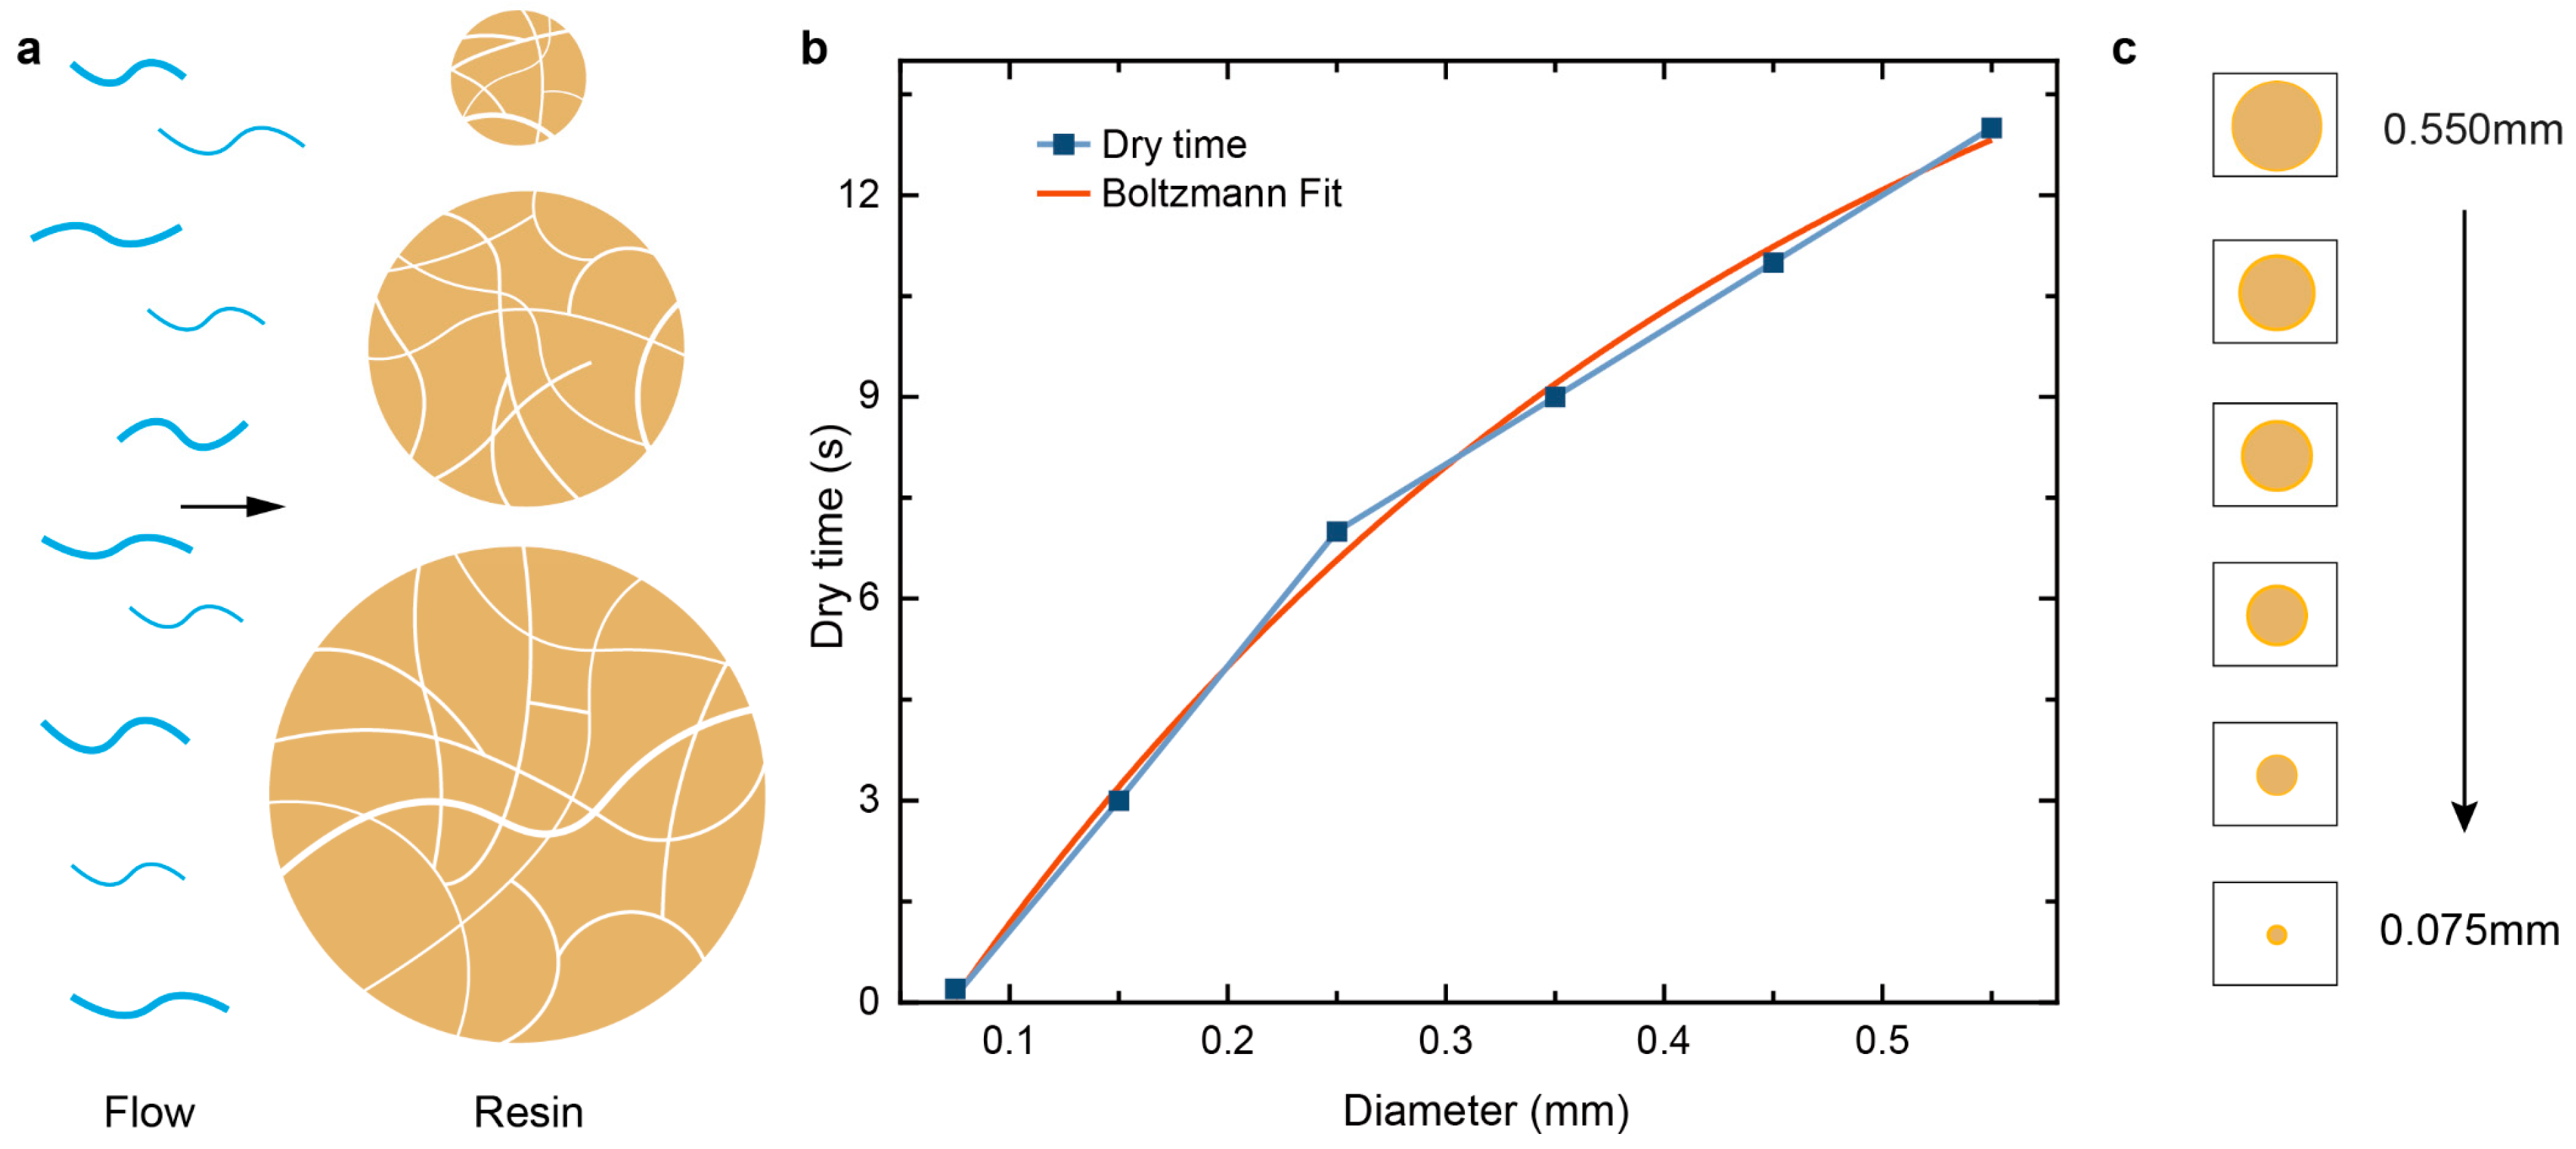
3.3. Adsorption of Water by Particles of Different Diameters

In the experimental assessment of material adsorption and desorption characteristics, a primary variable under consideration is ambient humidity. This study emphasizes the necessity to delineate the rate of hygroscopic adsorption across varying particle dimensions, as it potentially influences the temporal span requisite for a material’s transition from hydrated to anhydrous states during the desorption–adsorption cycle (refer to Figure 4c,d). Consequently, it is imperative to quantify the kinetics of moisture uptake by particles of diverse diameters at a fixed humidity level within a specified temporal frame.
A cohort of five particle groups, each representative of a distinct diameter range, is selected and arranged in weighing flasks (as illustrated in Figure 4d). These samples are subjected to a desiccation process in a drying cabinet for a duration of 24 h, ensuring exhaustive dehydration and the attainment of a CO2 adsorption equilibrium at a predetermined saturation point. Subsequently, the specimens are positioned on an analytical balance, and the alteration in mass, indicative of moisture acquisition, is meticulously recorded. Through this methodology, the moisture uptake per unit mass of the sample over time is computed, facilitating an evaluation of whether variations in particle diameter significantly impact hygroscopic adsorption characteristics. The resulting trend graph, derived from this experimental approach, elucidates the correlation between particle size and the rate of water adsorption.

4. Results and Discussion

4.1. Adsorption and Desorption Rates of Different Diameters

Through sieving, we divided particles of different diameters into six groups, with untreated particles mostly larger than 0.58 mm. In the initial adsorption–desorption tests, we observed relatively larger adsorption capacities for each group (refer to Figure 4a,e). This is primarily because, during subsequent desorption processes, moisture cannot entirely bind with carbonate ions in the material, possibly due to the time required for the complete internal binding of moisture to the material. We average the capacities from multiple adsorption tests, clearly observing that smaller resin particle sizes resulted in larger capacities. This is attributed to larger resin particles requiring more time for moisture to reach deeper into the material, resulting in smaller measured capacities. However, when given sufficient time, capacities measured for resin particles of different diameters become essentially identical.

4.2. Absorption Rates of Diverse Accumulations

As the diameter decreases, the resin particles’ relative surface area per unit weight increases, providing more contact area with air. Most importantly, it reduces the time required for moisture and CO2 to reach the material surface. We conduct a comparative test on six material components during the second adsorption, adsorbing the same amount of CO2 under the same test system. We measure the time taken for CO2 concentrations to decrease from 500 ppm to 150 ppm. Due to minimal differences in sample weights during measurement and to mitigate the impact of material mass on adsorption rates, we compare the product of mass and adsorption time as the relative adsorption rate (refer to Figure 4b). Smaller relative adsorption values indicate faster adsorption rates. As shown in the figure, a decrease in diameter corresponds to a significant increase in relative adsorption rates. Compared to untreated resin particles larger than 0.58 mm, the processed resin particles in the 0.0375–0.16 mm range exhibit a relative adsorption rate approximately five times faster.
In practical applications, the conversion of materials between adsorption and desorption requires a certain amount of time. The primary factor influencing the rate of this transition is the water content of the material, i.e., the environmental humidity. We conducted a statistical analysis of dozens of cyclic experiments for the six material groups, calculating the average time required to transition from higher humidity (desorption) to lower humidity (adsorption). It is evident that, at smaller diameters (less than 0.3 mm), the conversion time is significantly shorter than that of untreated IRA-900 (refer to Figure 4c). The drying-to-humidifying transition time is approximately one-third of the untreated material.
The experiments conducted above reveal that the material’s adsorption of water significantly impacts its adsorption of CO2. However, the relatively minor variations in the relative adsorption rates for the 0.0375–0.074 mm and 0.074–0.16 mm groups could potentially be attributed to the very small scale. Forces such as electrostatic or van der Waals forces may affect the adsorption and desorption rates between water and ion exchange resin surfaces, influencing the overall process. Therefore, we selected four groups of particles with diameters ranging from 0.074 to 0.58 mm and conducted tests to assess their water adsorption characteristics. After placing a certain amount of sample in a weighing bottle and allowing it to air dry for 48 h in a drying cabinet, we performed water adsorption tests. The change in sample weight after 15 min, compared to the initial weight, represents the amount of adsorbed water. Calculating ∆m/m provides the quantity of water adsorbed per unit mass of the sample (refer to Figure 4d). The results indicated that smaller particle diameters lead to higher water adsorption rates and greater affinity for water. Moreover, these smaller particles reach the critical humidity for material desorption more quickly during the desorption process.

4.3. Absorption Rates of Different Packing Densities

During the preliminary testing phase, we observed that the stacking arrangement of resin particles significantly influences the absorption rate. Therefore, we chose resin particles in the range of 0.074–0.16 mm to investigate the time required for absorbing the same amount of CO2 under different stacking densities. As shown in Figure 5, there are optical microscope images of two different stacking arrangements in the dry state, along with schematics of the modeled configurations.
Through testing, we found that in the case of sparse stacking (resin particles spread thinly on the inner wall of a quartz boat, refer to Figure 5c), the absorption of CO2 from 500 ppm to 150 ppm takes only about 6 min. In contrast, in the case of dense stacking (several layers of particles overlapping, forming a block-like structure in the dry state, as observed in the optical microscope images, refer to Figure 5d), the same absorption process requires about 20 min. It can be concluded that the stacking density directly affects the absorption rate. One possible reason is that the airflow within densely stacked particles is extremely slow (as indicated by the COMSOL simulation result of flow velocity < 0.00001 m/s, see Supplementary Materials). Therefore, in future practical applications, it is essential to ensure a certain airflow velocity within the material.
In the testing of particles with different diameters in Section 4.2, to ensure data accuracy, we uniformly adopt the sparse stacking method, i.e., spreading the sample thinly on the inner wall of a quartz boat (almost forming only one layer on the inner wall).

4.4. Multiple Tests of 0.078–0.16 mm Particles

Ensuring the applicability of the samples in real-life scenarios is imperative. The sustained high efficiency of adsorption and desorption rates over multiple cycles is crucial for practical use. To simulate real-world conditions, resin particles in the 0.074–0.16 mm range are selected for multiple adsorption–desorption cycles. After numerous cycles (refer to Figure 6a), a comparison is made to assess whether there is a decline in adsorption and desorption rates compared to the initial values. Each adsorption cycle starts with a system CO2 concentration of approximately 500 ppm, and the same concentration is targeted for desorption cycles. The CO2 concentration in the system is then compared after each adsorption/desorption cycle. The results from over 100 cycles demonstrated that the adsorption and desorption rates maintain high efficiency. The transition from 500 ppm to 350 ppm was achieved within 10 min (including the drying-humidification transition time) (refer to Figure 6c). During desorption, CO2 release from 500 ppm to around 1100 ppm occurred in approximately 10–15 min. After almost 100 cycles, the material maintained 100% adsorption capacity. After about 70 cycles, there is a slight decrease in the absorption rate; however, the stability of absorption capacity remains unchanged. The potential decrease in rate is likely attributed to a diminished ability of resin particles to bind with water. However, complete immersion in water is sufficient for regeneration, restoring the rate to its initial level and demonstrating its significant practical value.
After almost 100 cycles, our material consistently maintains its performance, establishing its suitability for practical applications. Moreover, even with a marginal decrease in efficiency after numerous cycles, complete regeneration can be achieved through immersion in water, resulting in a highly cost-effective process. In Table 1, a comparative analysis is conducted between our material and representative CO2-capturing substances, including MOFs, amine-based materials, activated carbon, nanomaterials, and NaOH. The data clearly demonstrate that our material sustains excellent efficiency throughout multiple cycles, surpassing certain materials like FS-PEI-33 that exhibit efficiency decline after a limited number of cycles. While specific MOF materials exhibit sustained efficiency through multiple cycles, they necessitate elevated temperatures for desorption, contributing to heightened energy consumption and associated costs. Conversely, our material only requires increased humidity for complete desorption. The notable absorption capacity and stability of our material, coupled with its cost-effective regeneration and desorption processes, position it as an exceptionally promising candidate for large-scale applications, as depicted in Figure 7, where our material outperforms others in efficiency after numerous cycles.

4.5. COMSOL Simulation

Through simulation using COMSOL software (version 5.3a), we simplified irregular resin particles of different diameters into two-dimensional spheres to facilitate a better comparison of simulated results. A parallel boundary was set with inlet air on the left side, according to the gas flow velocity between the resin particles in our experimental setup (refer to Supplementary Materials), estimated to be around 0.001 m/s. Outlet air was set on the right side, and the initial relative humidity (RH) in the ambient environment was set at 15%. The circular particle samples had an initial RH of 85%. Using the COMSOL software, we coupled the laminar flow, transport of water in air, and moist air heat transfer modules to simulate the time it takes for dry air to pass over the surface of samples with a certain humidity to reduce the sample’s relative humidity to a specific value.
Keeping other environmental factors constant, we vary the diameter of the sample materials in six groups (0.55 mm, 0.45 mm, 0.35 mm, 0.25 mm, 0.15 mm, and 0.10 mm), similar to the particle diameters in the experiment. By refining the mesh, we adjusted it to be extremely fine to ensure that the simulation results closely align with real-world conditions. Referring to Figure 8, it can be observed that as the sample diameter decreases, the relative humidity of the sample will decrease more rapidly. For instance, for a sample with a diameter of 0.55 mm, it takes about 13 s for the relative humidity to drop from 85% to around 15.5%, while for a sample with a diameter of 0.15 mm, it only takes about 3 s to achieve the same reduction. Remarkably, a sample with a diameter of 0.10 mm requires only about 0.2 s to decrease the relative humidity from 85% to around 15.5%. The simulation results indicate that as the sample diameter decreases, the rate of transition from wet to dry conditions significantly increases, impacting both absorption and desorption rates.
By comparing the simulated trends of individual particles with different diameters to the results obtained from our experimental tests, we observed a consistent pattern. In both cases, as the diameter of the resin particles decreased, the transition time from wet to dry conditions shortened. In the experiments (as shown in Figure 4c), the trend was not as pronounced for smaller diameters. We attribute this to the macroscopic effects of the combined action of several resin particles in the actual tests. It is possible that when multiple resin particles are arranged together, the airflow rate is constant, and thus the transition from wet to dry conditions does not occur simultaneously for all particles. In contrast, the simulation is a microscopic analysis focusing on individual particles. However, the overall trend aligns, indicating that our experimental results are consistent with theoretical simulations.

5. Conclusions

Through the conducted experiments, we observed that the variation in material diameter significantly influences the rate of CO2 adsorption/desorption through humidity oscillations. By subjecting six different material ranges to adsorption–desorption tests and delving into the relationship between materials and water adsorption under identical drying and humidifying conditions, we found that decreasing particle diameter substantially increases the adsorption and desorption rates. The fundamental reason lies in the rapid association and dissociation of water molecules with carbonate ions in the material. However, at smaller scales, the electrostatic interactions between water molecules and the material result in a slight reduction in rates. Therefore, we selected samples in the 0.074–0.16 mm range, characterized by fast adsorption rates and rapid drying-humidification transitions, to simulate the performance emphasized in practical usage. It is evident that even after multiple cycles, these samples maintained remarkably high efficiency. This holds significant potential for future practical applications. The next step involves exploring how to package and distribute the material to maximize its efficiency in real-world applications.

Supplementary Materials

The following supporting information can be downloaded at: https://0-www-mdpi-com.brum.beds.ac.uk/article/10.3390/su16093601/s1. Figure S1: A simple schematic diagram of the experimental gas path; Figure S2: The device leakage rates are 8000 ppm, 4500 ppm, and 3000 ppm respectively. The leakage rate at 3000 ppm is 5 ppm/h; Figure S3: After the humidifier circuit is replaced with tap water, perform approximately ten cycles; Table S1: The amine-based anion exchange resins, preparation method, particle size and CO2 adsorption.

Author Contributions

Conceptualization, S.L., X.S. and L.W.; Methodology, S.L., J.H., F.Z. and X.S.; Software, S.L.; Formal analysis, S.L., J.H., F.Z. and X.S.; Investigation, J.Z. and L.W.; Resources, J.Z. and L.W.; Data curation, X.S.; Writing—original draft, S.L.; Writing—review & editing, S.L., X.S. and L.W. All authors have read and agreed to the published version of the manuscript.

Funding

This research was funded by National Key Projects for Research and Development of China: Grant No. 2022YFA1204700, 2021YFA1400400; National Natural Science Foundation of China: Grant No. 12074173; Natural Science Foundation of Jiangsu Province: Grant No. BK20220066.

Institutional Review Board Statement

Not applicable.

Data Availability Statement

Data are contained within the article and Supplementary Materials.

Conflicts of Interest

Author Dr. Junqiang Hu and Dr. Fan Zhang were employed by the company the Hexquare Technology Co., Ltd. The remaining authors declare that the research was conducted in the absence of any commercial or financial relationships that could be construed as a potential conflict of interest.

References

  1. Pachauri, R.K.; Allen, M.R.; Barros, V.R.; Broome, J.; Cramer, W.; Christ, R.; Church, J.A.; Clarke, L.; Dahe, Q.; Dasgupta, P. Climate change 2014: Synthesis report. In Contribution of Working Groups I, II and III to the Fifth Assessment Report of the Intergovernmental Panel on Climate Change; IPCC: Geneva, Switzerland, 2014. [Google Scholar]
  2. Wang, X.; Song, J.; Chen, Y.; Xiao, H.; Shi, X.; Liu, Y.; Zhu, L.; He, Y.-L.; Chen, X. CO2 absorption over ion exchange resins: The effect of amine functional groups and microporous structures. Ind. Eng. Chem. Res. 2020, 59, 16507–16515. [Google Scholar] [CrossRef]
  3. Xu, J.; Shi, X.; Li, Q.; Wang, T.; Lackner, K.S. Kinetic analysis of an anion exchange absorbent for CO2 capture from ambient air. PLoS ONE 2017, 12, e0179828. [Google Scholar] [CrossRef]
  4. Solomon, S. Climate Change 2007-the Physical Science Basis: Working Group I Contribution to the Fourth Assessment Report of the IPCC; Cambridge University Press: Cambridge, UK, 2007; Volume 4. [Google Scholar]
  5. Lackner, K.S.; Brennan, S.; Matter, J.M.; Park, A.-H.A.; Wright, A.; Van Der Zwaan, B. The urgency of the development of CO2 capture from ambient air. Proc. Natl. Acad. Sci. USA 2012, 109, 13156–13162. [Google Scholar] [CrossRef] [PubMed]
  6. Li, J.; Li, L.; Wang, J.; Cabot, A.; Zhu, Y. Boosting Hydrogen Evolution by Methanol Oxidation Reaction on Ni-Based Electrocatalysts: From Fundamental Electrochemistry to Perspectives. ACS Energy Lett. 2024, 9, 853–879. [Google Scholar] [CrossRef]
  7. Keith, D.W. Why capture CO2 from the atmosphere? Science 2009, 325, 1654–1655. [Google Scholar] [CrossRef] [PubMed]
  8. Lackner, K.S. A guide to CO2 sequestration. Science 2003, 300, 1677–1678. [Google Scholar] [CrossRef]
  9. Lackner, K.S.; Aines, R.; Atkins, S.; AtKisson, A.; Barrett, S.; Barteau, M.; Braun, R.J.; Brouwer, J.; Broecker, W.; Browne, J.B. The promise of negative emissions. Science 2016, 354, 714. [Google Scholar] [CrossRef] [PubMed]
  10. Scott, V.; Gilfillan, S.; Markusson, N.; Chalmers, H.; Haszeldine, R.S. Last chance for carbon capture and storage. Nat. Clim. Chang. 2013, 3, 105–111. [Google Scholar] [CrossRef]
  11. Lackner, K.S. Capture of carbon dioxide from ambient air. Eur. Phys. J. Spec. Top. 2009, 176, 93–106. [Google Scholar] [CrossRef]
  12. Shi, X.; Xiao, H.; Azarabadi, H.; Song, J.; Wu, X.; Chen, X.; Lackner, K.S. Sorbents for the direct capture of CO2 from ambient air. Angew. Chem. Int. Ed. 2020, 59, 6984–7006. [Google Scholar] [CrossRef]
  13. Shi, X.; Lee, G.A.; Liu, S.; Kim, D.; Alahmed, A.; Jamal, A.; Wang, L.; Park, A.-H.A. Water-stable MOFs and hydrophobically encapsulated MOFs for CO2 capture from ambient air and wet flue gas. Mater. Today 2023, 65, 207–226. [Google Scholar] [CrossRef]
  14. Shi, X.; Lin, Y.; Chen, X. Development of sorbent materials for direct air capture of CO2. MRS Bull. 2022, 47, 405–415. [Google Scholar] [CrossRef]
  15. Shu, Q.; Haug, M.; Tedesco, M.; Kuntke, P.; Hamelers, H.V. Direct air capture using electrochemically regenerated anion exchange resins. Environ. Sci. Technol. 2022, 56, 11559–11566. [Google Scholar] [CrossRef] [PubMed]
  16. Singh, S.B.; De, M. Room temperature adsorptive removal of thiophene over zinc oxide-based adsorbents. J. Mater. Eng. Perform. 2018, 27, 2661–2667. [Google Scholar] [CrossRef]
  17. Sanz-Pérez, E.S.; Murdock, C.R.; Didas, S.A.; Jones, C.W. Direct capture of CO2 from ambient air. Chem. Rev. 2016, 116, 11840–11876. [Google Scholar] [CrossRef] [PubMed]
  18. Singh, S.B.; De, M. Carbon Dioxide Removal by Chemically and Thermally Reduced Graphene-Based Adsorbents. Korean J. Chem. Eng. 2024, 41, 783–796. [Google Scholar] [CrossRef]
  19. Wang, T.; Lackner, K.S.; Wright, A. Moisture Swing Sorbent for Carbon Dioxide Capture from Ambient Air. Environ. Sci. Technol. 2011, 45, 6670–6675. [Google Scholar] [CrossRef]
  20. Shi, X.; Xiao, H.; Lackner, K.S.; Chen, X. Capture CO2 from Ambient Air Using Nanoconfined Ion Hydration. Angew. Chem. 2016, 128, 4094–4097. [Google Scholar] [CrossRef]
  21. Song, J.; Zhu, L.; Shi, X.; Liu, Y.; Xiao, H.; Chen, X. Moisture swing ion-exchange resin-PO4 sorbent for reversible CO2 capture from ambient air. Energy Fuels 2019, 33, 6562–6567. [Google Scholar] [CrossRef]
  22. Shi, X.; Xiao, H.; Kanamori, K.; Yonezu, A.; Lackner, K.S.; Chen, X. Moisture-Driven CO2 Sorbents. Joule 2020, 4, 1823–1837. [Google Scholar] [CrossRef]
  23. Lackner, K. Thermodynamics of the humidity swing driven air capture of carbon dioxide. GRT LLC Tucson AZ 2008. [Google Scholar]
  24. Elimelech, M.; Phillip, W.A. The future of seawater desalination: Energy, technology, and the environment. Science 2011, 333, 712–717. [Google Scholar] [CrossRef] [PubMed]
  25. Gude, V.G. Desalination and sustainability–an appraisal and current perspective. Water Res. 2016, 89, 87–106. [Google Scholar] [CrossRef] [PubMed]
  26. Jungwirth, P.; Tobias, D.J. Specific ion effects at the air/water interface. Chem. Rev. 2006, 106, 1259–1281. [Google Scholar] [CrossRef] [PubMed]
  27. Lackner, K.S. The thermodynamics of direct air capture of carbon dioxide. Energy 2013, 50, 38–46. [Google Scholar] [CrossRef]
  28. Lawlor, D.W.; Cornic, G. Photosynthetic carbon assimilation and associated metabolism in relation to water deficits in higher plants. Plant Cell Environ. 2002, 25, 275–294. [Google Scholar] [CrossRef]
  29. Chaves, M. Effects of water deficits on carbon assimilation. J. Exp. Bot. 1991, 42, 1–16. [Google Scholar] [CrossRef]
  30. Socolow, R.; Desmond, M.; Aines, R.; Blackstock, J.; Bolland, O.; Kaarsberg, T.; Lewis, N.; Mazzotti, M.; Pfeffer, A.; Sawyer, K. Direct Air Capture of CO2 with Chemicals: A Technology Assessment for the APS Panel on Public Affairs; American Physical Society: Washington, DC, USA, 2011. [Google Scholar]
  31. Wang, T.; Lackner, K.S.; Wright, A.B. Moisture-swing sorption for carbon dioxide capture from ambient air: A thermodynamic analysis. Phys. Chem. Chem. Phys. 2013, 15, 504–514. [Google Scholar] [CrossRef]
  32. Shi, X.; Xiao, H.; Liao, X.; Armstrong, M.; Chen, X.; Lackner, K.S. Humidity effect on ion behaviors of moisture-driven CO2 sorbents. J. Chem. Phys. 2018, 149, 164708. [Google Scholar] [CrossRef]
  33. McDonald, T.M.; Lee, W.R.; Mason, J.A.; Wiers, B.M.; Hong, C.S.; Long, J.R. Capture of carbon dioxide from air and flue gas in the alkylamine-appended metal–organic framework mmen-Mg2 (dobpdc). J. Am. Chem. Soc. 2012, 134, 7056–7065. [Google Scholar] [CrossRef]
  34. Goeppert, A.; Czaun, M.; May, R.B.; Prakash, G.S.; Olah, G.A.; Narayanan, S. Carbon dioxide capture from the air using a polyamine based regenerable solid adsorbent. J. Am. Chem. Soc. 2011, 133, 20164–20167. [Google Scholar] [CrossRef] [PubMed]
  35. Kuwahara, Y.; Kang, D.Y.; Copeland, J.R.; Bollini, P.; Sievers, C.; Kamegawa, T.; Yamashita, H.; Jones, C.W. Enhanced CO2 adsorption over polymeric amines supported on heteroatom-incorporated SBA-15 silica: Impact of heteroatom type and loading on sorbent structure and adsorption performance. Chem. A Eur. J. 2012, 18, 16649–16664. [Google Scholar] [CrossRef]
  36. Kuwahara, Y.; Kang, D.-Y.; Copeland, J.R.; Brunelli, N.A.; Didas, S.A.; Bollini, P.; Sievers, C.; Kamegawa, T.; Yamashita, H.; Jones, C.W. Dramatic enhancement of CO2 uptake by poly (ethyleneimine) using zirconosilicate supports. J. Am. Chem. Soc. 2012, 134, 10757–10760. [Google Scholar] [CrossRef]
  37. Pang, S.H.; Lively, R.P.; Jones, C.W. Oxidatively-stable linear poly (propylenimine)-containing adsorbents for CO2 capture from ultradilute streams. ChemSusChem 2018, 11, 2628–2637. [Google Scholar] [CrossRef]
  38. Kumar, A.; Madden, D.G.; Lusi, M.; Chen, K.J.; Daniels, E.A.; Curtin, T.; Perry IV, J.J.; Zaworotko, M.J. Direct air capture of CO2 by physisorbent materials. Angew. Chem. Int. Ed. 2015, 54, 14372–14377. [Google Scholar] [CrossRef] [PubMed]
  39. Pang, S.H.; Lee, L.-C.; Sakwa-Novak, M.A.; Lively, R.P.; Jones, C.W. Design of aminopolymer structure to enhance performance and stability of CO2 sorbents: Poly (propylenimine) vs poly (ethylenimine). J. Am. Chem. Soc. 2017, 139, 3627–3630. [Google Scholar] [CrossRef]
  40. Lin, R.-B.; Xiang, S.; Zhou, W.; Chen, B. Microporous metal-organic framework materials for gas separation. Chem 2020, 6, 337–363. [Google Scholar] [CrossRef]
  41. Madden, D.G.; Scott, H.S.; Kumar, A.; Chen, K.-J.; Sanii, R.; Bajpai, A.; Lusi, M.; Curtin, T.; Perry, J.J.; Zaworotko, M.J. Flue-gas and direct-air capture of CO2 by porous metal–organic materials. Philos. Trans. R. Soc. A Math. Phys. Eng. Sci. 2017, 375, 20160025. [Google Scholar] [CrossRef]
  42. Keller, L.; Ohs, B.; Lenhart, J.; Abduly, L.; Blanke, P.; Wessling, M. High capacity polyethylenimine impregnated microtubes made of carbon nanotubes for CO2 capture. Carbon 2018, 126, 338–345. [Google Scholar] [CrossRef]
  43. Sayari, A.; Belmabkhout, Y. Stabilization of amine-containing CO2 adsorbents: Dramatic effect of water vapor. J. Am. Chem. Soc. 2010, 132, 6312–6314. [Google Scholar] [CrossRef]
  44. Li, P.; Liu, W.; Dennis, J.S.; Zeng, H.C. Synthetic architecture of MgO/C nanocomposite from hierarchical-structured coordination polymer toward enhanced CO2 capture. ACS Appl. Mater. Interfaces 2017, 9, 9592–9602. [Google Scholar] [CrossRef] [PubMed]
  45. Sepahvand, S.; Jonoobi, M.; Ashori, A.; Gauvin, F.; Brouwers, H.; Oksman, K.; Yu, Q. A promising process to modify cellulose nanofibers for carbon dioxide (CO2) adsorption. Carbohydr. Polym. 2020, 230, 115571. [Google Scholar] [CrossRef] [PubMed]
Figure 1. The reaction pathway of CO2 absorption/desorption on the nano-structural absorbent involves several states. Empty–Fresh State: Sorbent is in a dry condition with a few water molecules in the surroundings. Empty–Dry State: H2O splits into H+ ion and OH ion, ready to absorb CO2. H+ ion combines with CO32-- forming HCO3 ion. Equations (1) and (2) describe this process. Full–Dry State: The sorbent is fully loaded with CO2 in the dry condition. Equation (3) represents this fully loaded state. Equations (1)–(3) present the absorption process. Empty–Wet State: The regenerating absorbent releases CO2 in the wet condition. Equation (4) represents the desorption process.
Sustainability 16 03601 g001
Figure 2. Particle grinding and screening of different diameters. (a) Schematic illustration of screening resin particles within different diameter ranges. (b) Optical microscopy image of resin particles in the >0.58 mm range, scale bar 200 μm. (c) Optical microscopy image of resin particles in the 0.28–0.40 mm range. (d) Optical microscopy image of resin particles in the 0.074–0.16 mm range. (eg) SEM of resin particles in different range. (More in Supplementary Materials.)
Sustainability 16 03601 g002
Figure 3. Experimental setup schematic. (a) Comprehensive schematic of the experimental setup, including the sample chamber, infrared gas analyzer (IRGA), dehumidification pathway, humidification pathway, CO2 pathway, and purification section. (b) Schematic of the dehumidification and adsorption cycle apparatus. The gas enters the sample chamber through a condenser, readings are obtained by IRGA, and a micro air pump facilitates the circulation of the gas. (c) Schematic of the humidification and desorption cycle apparatus. Gas humidification is achieved through bubbling, passing through the sample chamber, IRGA for readings, and subsequent circulation facilitated by a micro air pump.
Sustainability 16 03601 g003
Figure 4. Different diameter resin particles’ adsorption and water adsorption statistics. (a) The capacity, obtained by averaging ten measurements of resin particles in different diameter ranges, reveals an increasing trend as the diameter decreases. (b) With the adsorption rate constant set at 1/min·g, an evident reduction in adsorption rate is observed with increasing diameter. (c) Continuous adsorption–desorption experiments for various diameter ranges record the time taken from desorption to the beginning of adsorption (transition from hydrated to anhydrous states during the desorption–adsorption cycle). Smaller diameters exhibit significantly shorter transition times. (d) Measuring the mass change ratio to the initial mass after moving four groups of resin particles of different ranges from a completely dry environment to a humid one for 15 min shows that in a humid environment, smaller diameter particles have relatively stronger water adsorption capabilities. (e) Conducting continuous adsorption–desorption tests for six different diameter particles, calculating the relative capacity, reveals that, apart from the first adsorption test, the capacity measured in subsequent tests remains stable. Smaller diameter particles show almost no impact on adsorption capacity with increasing cycle count.
Sustainability 16 03601 g004
Figure 5. Effect of different packing densities of resin particles with the same diameter range (0.074–0.16 mm) on adsorption rate. (a) Photo of sparsely arranged resin particles. (b) Photo of densely arranged resin particles. (c) Schematic diagram of sparsely arranged resin particles in simulation. (d) Schematic diagram of densely arranged resin particles in simulation. (e) Absorbing the same amount of CO2 in sparse arrangements takes approximately 6 min. (f) Absorbing to 150 ppm in densely arranged conditions takes around 20 min.
Sustainability 16 03601 g005
Figure 6. Results after approximately 100 cycles of simulating real-world applications with resin particles in the range of 0.074–0.16 mm: (a) Changes in the system CO2 concentration during the adsorption–desorption process. Each adsorption and desorption cycle starts from 500 ppm, ensuring reliability by maintaining consistent times around 10–20 min. It can be observed that, after a few initial cycles of instability, the amount of adsorption and desorption CO2 stabilizes in subsequent cycles. After about 70 cycles, there is a slight decrease in the absorption rate; however, the stability of absorption capacity remains unchanged. (b) Variation in system moisture content during the adsorption–desorption process. (c,d) An enlarged view of two specific cycles, illustrating that desorption begins immediately with increasing humidity, while adsorption takes some time to initiate due to the need for the material’s internal moisture reduction. Consecutive adsorption–desorption cycles at the initial stage of the experiment, within the first few dozen cycles. (e,f) The images of two consecutive cycles after a slowdown in absorption rate show that the efficiency and capacity of adsorption remain unchanged. The variation in adsorption rate may be attributed to the resin particles becoming less sensitive to the adsorption and desorption of water.
Sustainability 16 03601 g006
Figure 7. The capacity stability comparison of various sorbents through multiple cycles, with the number of cycles annotated on the graph.
Sustainability 16 03601 g007
Figure 8. COMSOL simulation results: (a) Schematic diagram of air flow through porous resin particles of various diameters. (b) Statistical analysis of simulation results for different diameters, fitted with Boltzmann distribution. (c) Illustration of simulated particle sizes from small to large. For detailed simulation outcomes refer to Supplementary Materials.
Sustainability 16 03601 g008
Table 1. DAC studies with different categories of materials and the material stability.
SorbentAdsorptionCapacity (mmol/g)Capacity StabilityRef.
IRA-900 (0.074–0.160 mm)500 ppm 25 °C 1 atm0.58100 cycles, 100%/
Mg-MOF-74400 ppm 25 °C 1 atm 0.14180 °C desorption, stable[33]
FS-PEI-33400 ppm 23 °C1.184 cycles, 96%[34]
Zr-SBA-15400 ppm 25 °C 1 atm0.854 cycles, 98%[35,36]
SBA-15 400 ppm 35 °C0.7650 cycles, stable,
110 °C desorption
[37]
HKUST-1400 ppm 25 °C 1 atm0.05140 °C desorption, stable[38]
PPI/Porous Silica 400 ppm 35 °C0.20–3.604 cycles, 88%[39]
Diamine/MOF25 °C 1 atm1.555 cycles, stable[40]
SIFSIX-3-Ni400 ppm 25 °C 1 atm0.18140 °C desorption, stable[41]
Carbon Nanotube30 °C 1 atm1.0710 cycles, 90%[42]
PE-MCM-41(−5 °C)–(+5 °C) RH 60–80% 0.403 cycles, 4%[43]
NaOH380 ppm 1 atm/900 °C regeneration, stable[26]
20 wt% MgO-RHA26 °C 10% CO2/N2 1 atm4.5610 cycles, 92%[44]
Poly HIPE/nano-TiO2/PEI-5075 °C CO2/H2O/N2 (1:1:8) 5.5950 cycles, 91%[45]
Disclaimer/Publisher’s Note: The statements, opinions and data contained in all publications are solely those of the individual author(s) and contributor(s) and not of MDPI and/or the editor(s). MDPI and/or the editor(s) disclaim responsibility for any injury to people or property resulting from any ideas, methods, instructions or products referred to in the content.

