Article

A Two-Stage Robust Pricing Strategy for Electric Vehicle Aggregators Considering Dual Uncertainty in Electricity Demand and Real-Time Electricity Prices

School of Mechanical Engineering, University of Shanghai for Science and Technology, Shanghai 200093, China
*
Author to whom correspondence should be addressed.
Sustainability 2024, 16(9), 3593; https://0-doi-org.brum.beds.ac.uk/10.3390/su16093593
Submission received: 12 March 2024 / Revised: 16 April 2024 / Accepted: 19 April 2024 / Published: 25 April 2024
(This article belongs to the Section Energy Sustainability)

Abstract

:
To enable the regulation and utilization of electric vehicle (EV) load resources by the power grid in the electricity market environment, a third-party electric vehicle aggregator (EVA) must be introduced. The strategy of EVA participation in the electricity market must be studied. During operation, the EVA faces a double uncertainty in the market, namely, electricity demand and electricity price, and must optimize its market behavior to protect its own interests. To achieve this goal, we propose a robust pricing strategy for the EVA that takes into account the coordination of two-stage market behavior to enhance operational efficiency and risk resistance. A two-stage robust pricing strategy that takes into account uncertainty was established by first considering day-ahead pricing, day-ahead electricity purchases, real-time electricity management, and EV customer demand response for the EVA, and further considering the uncertainty in electricity demand and electricity prices. The two-stage robust pricing model was transformed into a two-stage mixed integer programming by linearization method and solved iteratively by the columns and constraints generation (CCG) algorithm. Simulation verification was carried out, and the results show that the proposed strategy fully considers the influence of price uncertainty factors, effectively avoids market risks, and improves the adaptability and economy of the EVA’s business strategy.

1. Introduction

1.1. Motivation

China is currently in the accelerated development stage of new energy vehicles. It is projected that by 2030, the market capacity of electric vehicles in China will reach 60 million units [1]. Governments and enterprises worldwide have strongly supported the research and practical application of EV-related technologies [2,3]. As China’s electricity market reform deepens, the integration and control of large-scale electric vehicles under an open electricity market environment requires the involvement of a third party, known as electric vehicle aggregators (EVAs) or electric vehicle agents, to aggregate the distributed EV loads [4]. However, it is important to note that the involvement of a third party is necessary for the integration and control of large-scale electric vehicles in an open electricity market environment. The EVA participates in the electricity market on behalf of the EVs, indirectly enabling the interactions between individual EV users and the grid [5,6,7,8]. Therefore, it is crucial to study the operation model and strategy of the EVA when they act as a ‘bridge’ between EV users and the electricity market [9,10,11].

1.2. Background and Research Gaps

EVAs can optimize their market behavior by participating in load curtailment (LC), coordinating trading strategies in the day-ahead (DA) and real-time markets, and setting reasonable charging and discharging prices to improve their operating revenues. Setting reasonable charging prices can effectively guide vehicles to charge in an orderly manner, thus expanding the benefit space of EVAs [12,13,14]. Ref. [15] takes the maximum benefit of the charging station as the pricing strategy, analyzes the problems in the operation of the charging station, and develops a more reasonable and efficient scheduling strategy to achieve the coordinated control of the orderly charging of the power grid and maximize the operational benefits. Ref. [16] takes the user benefit priority as the goal, adopts real-time price and dynamic price demand functions to establish the charging price model, reduces the user charging cost, and realizes the maximization of user benefit. Ref. [17] models charging station profit maximization and EV owner cost minimization as the objective function and considers the default penalty measures and the initial service fee of the vehicle to guide the charging behavior of EVs. Ref. [18] considers the number of EVs accepted by charging stacks to construct a charging price change function that provides users with optimal charging choices and finally forms a complete guided pricing mechanism to ensure user satisfaction and charging demand. Ref. [19] establishes a master–slave game model between charging aggregators and users and uses an iterative algorithm to find the optimal pricing strategy for aggregators. However, the existing pricing models tend to simplify the impact of the market price of electric energy and cannot coordinate the EVA electricity purchase strategy with the demand response behavior of users. As a result, the existing pricing strategies can lead to loss-making market risks for EVAs.
Since the physical delivery of electricity occurs only in the real-time phase, and there is uncertainty in both real-time electricity consumption and real-time electricity price, EVAs are able to pre-purchase electricity in the day-ahead electricity market to avoid full real-time electricity price uncertainty and hedge the uncertainty in electricity consumption in the real-time electricity market by purchasing or selling electricity. Through a reasonable hedging approach, the aggregator is able to avoid the market risk associated with real-time price uncertainty and actual electricity consumption uncertainty [20,21]. Ref. [22] proposes a distributed edge computing framework for efficient vehicle-to-grid (V2G) technology. It employs a long short-term memory network, attention mechanisms, and data clustering for accurate prediction and improved grid stability. Real dataset experiments show up to 98.89% prediction accuracy. However, economic and uncertainty factors are not taken into account. In ref. [23], a polyhedral uncertainty set of real-time electricity price curves is constructed and a robust model is solved to obtain more conservative electricity purchase and sale decisions. Ref. [24] introduces a stochastic programming framework for optimizing the operation of a microgrid (MG) aggregator amidst various uncertainties. It integrates demand response aggregation via contractual agreements, enhancing benefits for both the aggregator and customers. Ref. [25] proposes a new electricity market clearing mechanism to coordinate distribution systems (DSs) and microgrids (MGs) amid increasing renewable energy integration and uncertainties. It formulates a bi-level robust economic dispatch model for DSs and MGs, employing a column and constraint generation algorithm for the solution. Ref. [26] presents a robust model for electric vehicle aggregators to optimally participate in various electricity markets amid uncertain prices. It introduces a stepwise bidding strategy to handle market price forecasting errors, employing scenario-based simulation to validate effectiveness using real market data. Ref. [27] presents a decision support tool for electric vehicle aggregators to optimize bidding strategies in electricity markets. The approach, based on two-stage stochastic programming with risk aversion modeled through conditional value-at-risk (CVaR), addresses uncertainties in real-time electricity prices, regulation service deployments, and EV owner behaviors. Ref. [28] presents a bilayer coordinated operation scheme for a multi-energy building microgrid (MEBM) to handle uncertainties. It optimizes day-ahead operations and finalizes hourly operations considering uncertainty realizations. Case studies demonstrate its effectiveness in achieving economic MEBM operation with computational efficiency and resilience to uncertainties. Ref. [29] proposes a new bidding strategy for aggregators of prosumers to make robust, network-secure decisions in electricity markets. It addresses the challenges of coordinating distributed energy resources (DERs) with the distribution system operator (DSO) amidst uncertainties. The strategy, preserving data privacy, employs the alternating direction method of multipliers (ADMM) to compute robust bids. The literature above employs deterministic probability distribution functions to characterize uncertainty. This method reduces the range of uncertainty, but it also raises the possibility that aggregators may not be able to provide the full market trading electricity during unfavorable conditions.

1.3. Contributions

Based on the above research, this paper proposes a two-stage robust pricing strategy for EVAs considering uncertainty. The main contributions of this paper are as follows:
(1)
A pricing model based on the master–slave game is developed to consider the demand response of electric vehicle users.
(2)
To reduce transaction risk in the aggregator market, different treatments for demand uncertainty and real-time electricity price uncertainty are adopted.
(3)
A two-stage optimization model for EVA participation in the day-ahead and intraday electricity markets is developed, and dispatch strategies for EVAs in these markets are formulated.
The rest of this article is arranged as follows. Section 2 describes the EVA operating model and pricing problems. The electric vehicle demand response model is given in Section 3. A two-stage robust optimization model is developed in Section 4. Section 5 is the solution method for the model. Section 6 presents the simulation and analysis. Section 7 concludes the paper and highlights future work.

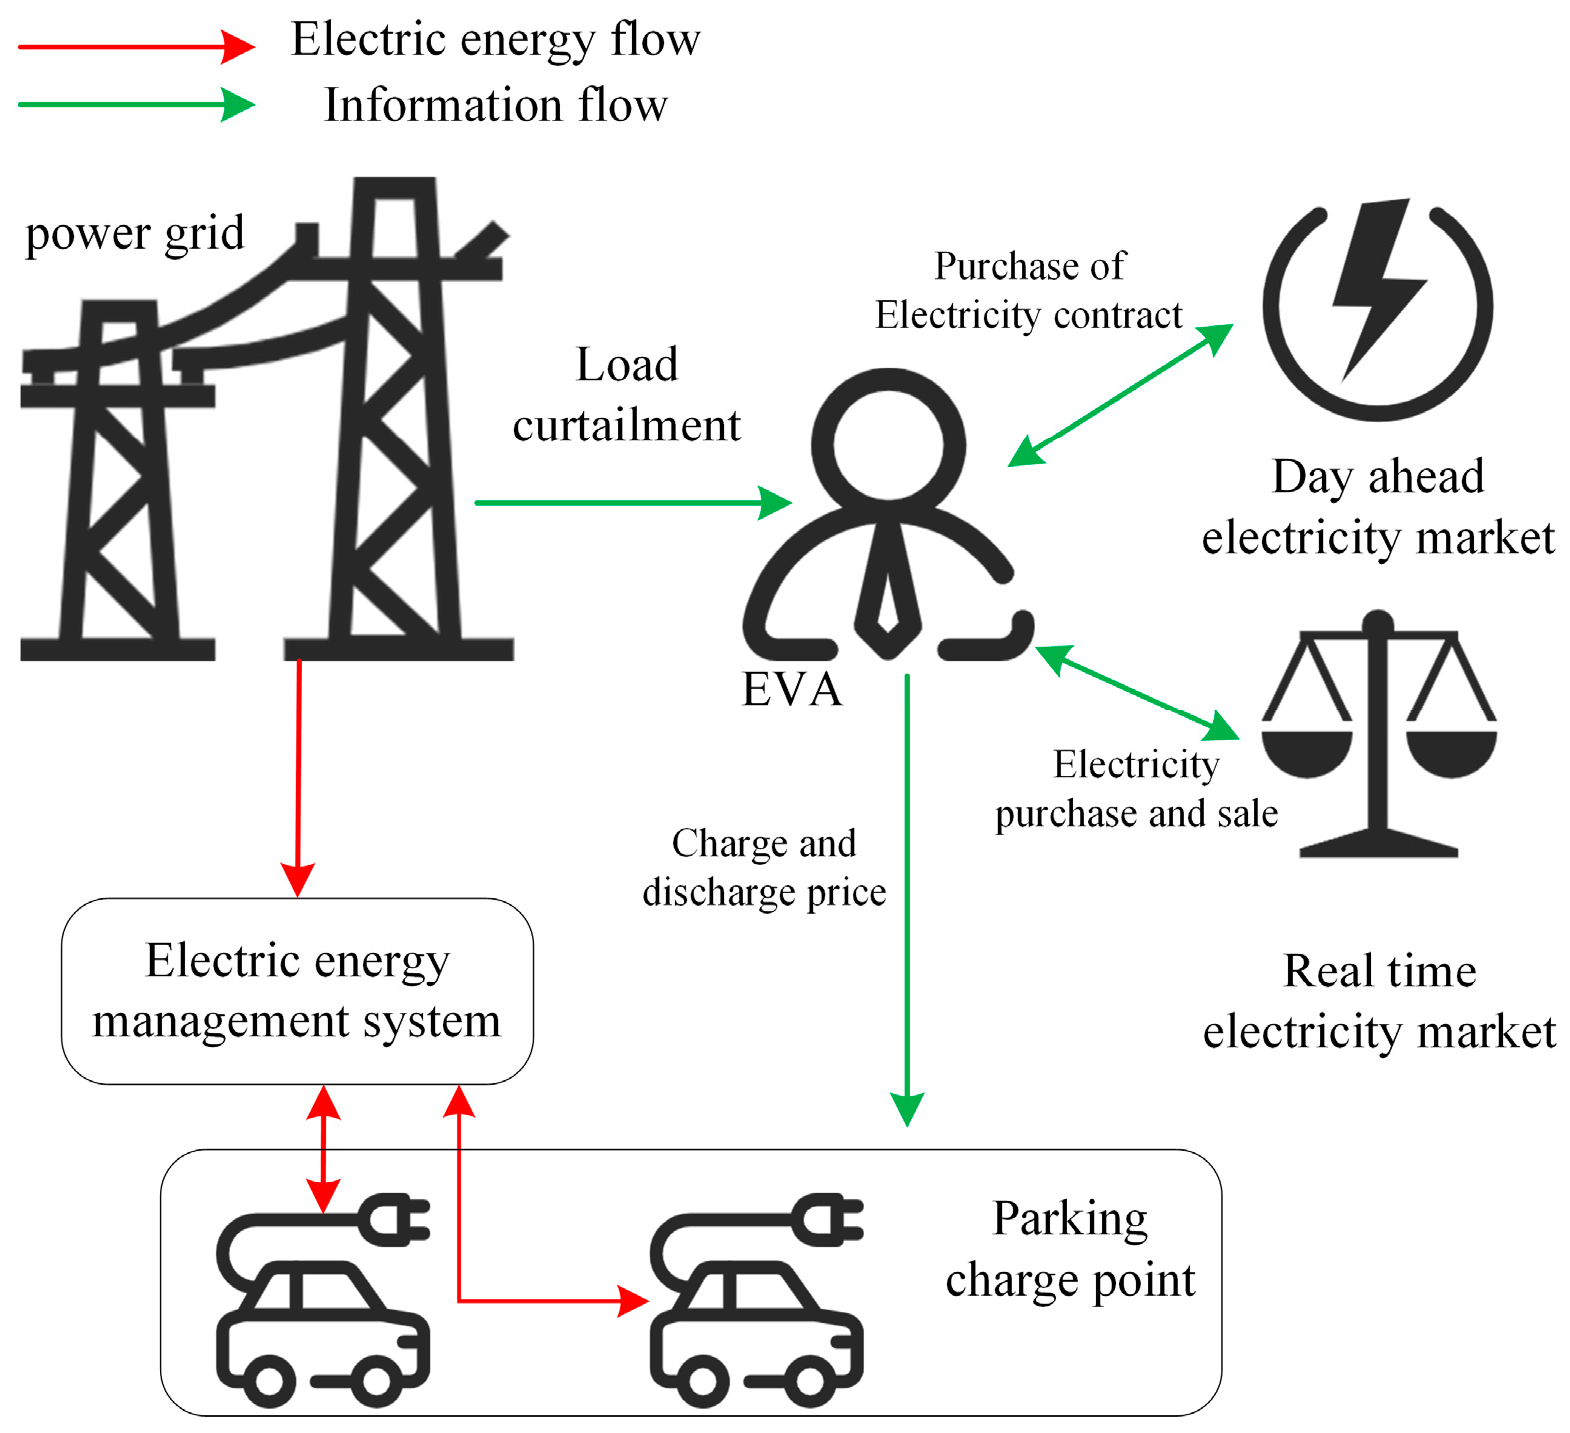
2. Description of EVA Operating Model and Pricing Problems

The EVA is essentially a load aggregator, and its operating model is shown in Figure 1.
The figure above illustrates that the EVA does not have its own generation capacity and must purchase electricity from the grid in the day-ahead and real-time electricity markets. Additionally, the EVA can participate in the next-day load curtailment by the distribution grid and receive compensation from the grid according to the EVA’s actual performance. Furthermore, the EVA charges and discharges prices to EV users to ensure that the electricity demand of EV users is met and that it receives income from them. The problem that the EVA has to consider is that the charge and discharge have to be released in advance, and the exact electricity demand of EV users cannot be predicted in advance, which makes it difficult to design charging and discharging in a targeted way. Recent research has shown that EVAs need to coordinate and optimize with DSOs to avoid distribution network problems [29], but the main objective of this paper was to optimize the market behavior of EVAs to improve their operational efficiency. Thus, coordination and optimization between DSOs and EVAs can be achieved through economic instruments to address distribution network-related issues. For instance, DSOs can influence the market behavior of EVAs by implementing various economic incentives or penalties. Additionally, this paper considers EVAs as independent market entities that are not directly controlled by DSOs. It is assumed that all market behaviors of EVAs comply with market rules. To address this, this paper takes into account the uncertainty of EV users’ electricity consumption and establishes a robust pricing model for EVAs, as shown in Figure 2, which is used to improve the operational efficiency of EVAs and avoid market risks.
The objective of the pricing model shown in Figure 2 is to maximize the expected income of the aggregator, and the decision variables include the day-ahead electricity purchase price and the charge and discharge prices, and must satisfy the constraints of the market trading rules and the electricity power balance constraints. This process involves fitting a curve to the day-ahead electricity price that describes the relationship between the day-ahead electricity purchase decision and the electricity purchase price, using an EV demand response model as a boundary condition that describes the mapping relationship between the charge and discharge price and the EV electricity plan. The load curtailment section includes information on the next day’s load curtailment period, maximum curtailment amount, and compensation price. The model uses real-time decision making as a subproblem to adjust the real-time stage of electric power through the real-time purchase and sale of electricity, where the real-time electricity price is an exogenous variable obtained from historical data. Finally, this paper presents a robust optimization model that considers the uncertainty of the customer’s electricity consumption. This model leads to the expected income and the decision of the EVA under the worst electricity consumption deviation.

3. Electric Vehicle Demand Response Model

In the day-ahead stage, the EVA releases the price information for the next day, and, the next day, EV users decide on their own charging and discharging plans based on the released price information. For the EV users, the aim is to achieve the desired amount of electricity with the least cost, so the objective function of the EV users is shown in the following equation:
min t T n E V [ e ( t ) ( p c h , n E V ( t ) p d i s , n E V ( t ) ) ]
where T n E V denotes the schedulable time slot of EV n with a scheduling interval of 1 h;  p c h , n E V ( t ) and p d i s , n E V ( t )  denote the charging and discharging amount of EV n in time slot t , respectively; and e ( t ) is the charging and discharging price of EV n issued by the EVA for charging and discharging in time slot t .
The charging and discharging plans of EV users need to satisfy the following constraints:
(1)
Maximum charge/discharge constraints.
{ 0 p c h , n E V ( t ) p c h , max E V 0 p d i s , n E V ( t ) p d i s , max E V , t T n E V
(2)
Charge–discharge uniqueness constraint.
p c h , n E V ( t ) p d i s , n E V ( t ) = 0 , t T n E V
(3)
Zero charge/discharge during non-schedulable hours.
p c h , n E V ( t ) = p d i s , n E V ( t ) = 0 , t T n E V
(4)
Electric vehicle battery power constraints.
{ s n E V ( t b ) = s n , a E V s n E V ( t e ) = s n , e E V s min E V s n E V ( t ) s max E V s n E V ( t ) = s n E V ( t 1 ) +     η c h E V p c h , n E V ( t ) p d i s , n E V ( t ) / η d i s E V , t T n E V
where p c h , max E V and p d i s , max E V are the maximum charge and discharge capacity of the electric vehicle. s n E V ( t b ) and s n E V ( t e ) are the battery charges of EV n before the start and after the end of the schedulable time period; s n , a E V and s n , e E V are the initial and desired charges of EV n ; s min E V and s max E V are the minimum and maximum battery safety charge of the EV to prevent the battery from overcharging and over-discharging; and η d i s E V and η c h E V are the charging and discharging efficiency of the EV.

4. Two-Stage Robust Pricing Model for EVAs

A two-stage robust pricing model for EVAs was developed based on the aforementioned description of the pricing problem and the EV demand response model. The first stage of the model was designed to determine the amount of electricity to be purchased and the charging and discharging price of the user for a given amount of response deviation. In the second stage, the worst-case response deviation under the current stage of decision making is countered by purchasing and selling electricity in the real-time electricity market, based on the optimization results of the first stage. The purchased and sold electricity in the real-time electricity market is then returned to the first stage for iterative calculation to determine if the EVA can still obtain a better profit under the worst-case scenario.

4.1. Objective Function

Equation (6) shows the objective function of the robust pricing model. The primary objective in the first stage is to maximize EVA expected income, including expected EV customer payments, day-ahead electricity purchase costs, and expected income in the real-time stage; the secondary objective in the second stage is to maximize income in the worst-case real-time response scenario, including income in the real-time electricity market, income from participating in load shedding, and income from uncertainty.
{ O b j = max P b D A ( t ) , e ( t ) ( t T e ( t ) P E V ( t ) t T λ D A ( t ) P b D A ( t )   + min U ( t ) ω   max P s R T ( t ) , P b R T ( t ) E { λ R T ( t ) , t T } ( R ) ) P E V ( t ) = n N E V ( p c h , n E V ( t ) p d i s , n E V ( t ) ) R = t T [ λ R T ( t ) P s R T ( t ) λ R T ( t ) P b R T ( t )   + λ c u r P v c u r ( t ) + e ( t ) W ( t ) ] P v c u r ( t ) = { P b a s e ( t ) ( P E V ( t ) + W ( t ) ) , t T c u r 0 , t T c u r ω = { U min U ( t ) U min , U l U ( t ) U h , t T }
where T  is the dispatch time period with a 1 h dispatch interval; P E V ( t ) is the total EV electricity consumption in time period t ; λ D A ( t ) is the day-ahead price of the time period t ; P b D A ( t ) denotes the electricity purchased by the EVA in time period t ; P b R T ( t ) and P s R T ( t ) denote the real-time electricity purchased and sold, respectively, in time period t ; W ( t ) is the uncertainty deviation, which is determined by the uncertainty set ω ; λ R T ( t ) is the real-time price of time period t ; E ( · ) denotes the expectation operator used to calculate the real-time income under the desired scenario; N E V is the EV set; R denotes the income of the EVA in the real-time stage; λ c u r is the unit compensation price for load curtailment; P v c u r ( t ) is the total load curtailment during time period t ; T c u r is the load curtailment time period; P b a s e ( t ) is the baseline load in time period t ; W min  and  W max are the boundaries of uncertainty deviation in the unit dispatch time period t , respectively; and W l and W h are the boundaries of the total amount of uncertainty deviation, respectively.
During the day-ahead stage, the EVA publicly releases information on charging and discharging prices for the following day. EV users then base their charging and discharging plans on the public price information. This process involves sequential decision making and constitutes a master–slave game between the EVA and EV users, with the EVA dominating. Once the EVA determines the charging and discharging price, the charging and discharging plans of the EV user are uniquely established. The price for charging and discharging is the first-stage decision variable in the model. Therefore, although the user pays the charge in real time, it is still considered identifiable income in the first stage of the model.

4.2. Constraints

The constraints of the robust pricing model for EVAs are as follows:
(1)
Day-ahead electricity purchase constraint:
0 P b D A ( t ) P b , max D A , t T
where P b , max D A is the maximum value of day-ahead electricity purchased.
(2)
Fitting equation of day-ahead electricity purchase price to the quantity of electricity purchased:
λ D A ( t ) = k D A ( t ) P b D A ( t ) + b D A ( t )
where k D A ( t ) and b D A ( t ) are the fitting coefficients.
(3)
Charge–discharge price constraint:
{ e min e ( t ) e max t T e ( t ) T e a v , t T
where e min and e max are the upper and lower bounds of the price of electricity; e a v is the average value of the market-allowed price of electricity.
(4)
Real-time electricity purchase and sale constraints.
Equation (10) is the real-time electricity quantity purchase and sale constraint and Equation (11) is the uniqueness constraint of the electricity purchase and sale state:
{ 0 P b R T ( t ) P b , max R T 0 P s R T ( t ) P s , max R T , t T
P b R T ( t ) P s R T ( t ) = 0 , t T
where P b , max R T and P s , max R T are the maximum amounts of electricity purchased and sold by the EVA in the real-time electricity market.
(5)
Load curtailment constraint:
λ D A ( t ) = k D A ( t ) P b D A ( t ) + b D A ( t )
where P min c u r is the minimum value of effective load curtailment per unit scheduling period; P max c u r is the maximum value of effective load curtailment per unit scheduling period.
(6)
Power balance constraint:
P b D A ( t ) + P b R T ( t ) + n N E V p d i s , n E V ( t ) = P s R T ( t ) + W ( t ) + n N E V p c h , n E V ( t ) , t T
(7)
Safety constraint.
The following equation ensures that surpluses and shortfalls in electricity during the real-time stage can be sold and made up in the real-time electricity market.
{ W max P b D A ( t ) + n N E V ( p c h , n E V ( t ) p d i s , n E V ( t ) ) P b , max R T P b D A ( t ) W min n N E V ( p c h , n E V ( t ) p d i s , n E V ( t ) ) P s , max R T , t T
In the above constraints, Equations (7)–(12) are market rule constraints that aim to constrain the market behavior of market players. Electric vehicles use charging as the main power-using behavior, so the uncertainty deviation in Equation (13) only considers the uncertainty of charging, but not the uncertainty of discharging.

5. Model Solution

The uniqueness constraints Equations (3) and (11) are complementary relaxation conditions that are nonlinear. To transform these equations into linear constraints, the approach presented in ref. [23] was employed, which introduced Boolean variables. The transformed linear constraint equation is as follows:
{ 0 p c h , n E V ( t ) M ς ( t ) 0 p d i s , n E V ( t ) M ( 1 ς ( t ) ) , t T n E V
{ 0 P b R T ( t ) M θ ( t ) 0 P s R T ( t ) M ( 1 θ ( t ) ) , t T
where ς ( t ) and θ ( t ) are Boolean variables; M is a sufficiently large integer.
There are similarities among electric vehicles in the set and, at the same time, a large number of individual electric vehicles increases the complexity of the model on the one hand and the computational difficulty on the other hand. To address this, this paper divided the electric vehicle set into K classes and the charging and discharging quantities of the electric vehicle set were made as the following equivalent substitutions:
{ N k N k r k p c h , n E V ( t ) n N E V p c h , n E V ( t ) N k N k r k p d i s , n ( t ) E V n N E V p d i s , n E V ( t )
where N is the average value of the number of EVs charging at EVAs per day, N k is the set of EV types with K elements, and r k is the share of EVs of type k .

5.1. Derivation of the Solution Process

This paper presents a two-stage robust optimization model with a two-stage, three-layer, max–min–max problem. This problem could not be solved directly using a solver but could be solved iteratively by decomposing the original problem into two problems, the main problem and the subproblem by the CCG algorithm [30,31]. The method used to address the uncertainty of the real-time price of electricity was the scenario method, which was based on historical real-time tariff data. This transformed the expectation operator into the summation of finite scenarios. The original problem is formulated in a compact matrix form in the following equation:
{ O b j = max x , e c T x + N ( e T e T ) pr + min U ω max { y s , s Ω } e T W + λ c u r P v c u r + s Ω p s b s T y s s . t .   Ax + Bpr d     Fe f     Ex + G y s = H pr + MW , s Ω     I y s l : θ s , s Ω     p k = arg min ( [ e T e T ] p k ) , k N k     s . t .   Z k p k z k : ς k
where x and e are the first-stage decision variables; y s is the second-stage decision variable corresponding to scenario s ; Ω is the real-time price of electricity scenario; p s is the probability corresponding to scenario s ; b s T it is the real-time price of electricity corresponding to scenario s ; p is the charging and discharging plan for the EV set, which consists of a charging and discharging plan p k for class K electric vehicles; r is the vector of scale factors corresponding to K types of electric vehicles; c T , A , B , d , F , f , E , G , H , M , I , and l are the corresponding coefficient vectors or matrices; Z k and z k are coefficient matrices and vectors in the demand response model of the EVs; and θ s and ς k are the dual variables corresponding to the constraint.
In Equation (17), EVA pricing and EV demand response constitute a master–slave game and the EV demand response model is convex; the Karush–Kuhn–Tucker (KKT) condition is given in the following equation:
{ [ e T e T ] + ς k T Z k = 0 0 ( Z k p k z k ) ς k 0
where denotes complementarity.
The model was convex, so the strong duality held and its objective function could be represented by the dual variables; further, its payment could be represented by the dual variables, as in the following equation [32]:
γ k = [ e T e T ] p k = ς k T p k
where γ k denotes the electric vehicle payment cost vector.
{ O b j _ M P = max x , e ( c T x + N γ r + β ) s . t . β e T W j + λ c u r P v c u r + s Ω p s b s T y s , j , j J       Ax + Bpr d     Fe f     Ex + G y s , j = H pr + M W j , s Ω , j J     I y s , j l : θ s , j , s Ω , j J     [ e T e T ] + ς k T Z k = 0 , k N k     0 ( Z k p k z k ) ς k 0 , k N k
where γ consists of the payments for each type of electric vehicle; β is an auxiliary variable used to relate to the main problem and subproblem; W j is the worst case of deviation returned by the j th subproblem; y s , j is the new variable introduced to correspond to it and the decision variable for the main problem; and J is the total number of iterations.
The complementary constraints in the master problem were linearized by introducing Boolean variables and using the Big-M method, and the bilinear term λ D A ( t ) P b D A ( t ) in the objective function could be transformed into a quadratic function by Equation (8). The quadratic coefficients of the quadratic term of the quadratic function were positive definite, so the main problem was a mixed-integer quadratic programming problem that could be solved by the solver [33].
For the subproblem, the first and second terms of its objective function were determined by the outer min, so it could be transformed into the following equation:
{ O b j _ S P = min U ω ( e T W + λ c u r P v c u r + ( W ) ) s . t .   = max { y s , s Ω } s Ω p s b s T y s     s . t . Ex + G y s = H pr + MW , s Ω       I y s l : θ , s Ω
where ( W ) is the maximum return that the EVA can achieve through the purchase and sale of electricity in the real-time market, given that W is known, and the EVA’s real-time electric energy management function.
The subproblem, whose objective function and constraints were convex, could be applied to strong duality theory and transformed into the following single-layer min problem, according to the method used in ref. [34].
{ O b j _ S P = min U ω , { y s , s Ω , φ s , θ s } ( e T U + λ c u r P v c u r   + s Ω p s b s T y s ) s . t .   Ex + G y s = H pr + MU , s Ω     p s b s T + φ s T G + θ s T I = 0 , s Ω     ( I y s l ) θ s 0 , s Ω
where φ s is the dual variable.
The complementary constraints in the subproblem could likewise be treated in the same way as in the main problem. Thus, the subproblem was a mixed-integer linear programming problem and could be solved by the solver.

5.2. Solution Process

The CCG algorithm was used to solve the model of this paper in the following steps:
(1)
Use zero deviation as the initial value for solving the master problem, which is set as W 0 = 0 . Set the number of iterations as j = 1 , the upper bound as U B = + , the lower bound as L B = , and the allowable error as ε .
(2)
Solve the main problem Equation (20) based on W j 1 to obtain x j , e j and the EV charging and discharging schedule p j and update the upper bound U B = O b j _ M P .
(3)
Solve the subproblem Equation (23) based on the obtained x j and e j , obtain the worst deviation W j under the current decision of the main problem, obtain the value of the optimal objective function of the subproblem, and update the lower bound L B = c T x j + N ( e j T b e j T ) pr + O b j _ S P .
(4)
Judge the following conditions.
| U B L B | U B ε
If the condition is valid, the iteration is terminated and the optimal decision is output; if not, the next step is taken.
(5)
Add the following constraints.
{ Ex + G y s , j = H pr + M W j , s Ω I y s , j l : θ s , j , s Ω
Return the computed result to the main problem and update the number of iterations j = j + 1 . Return to step (2).

6. Simulation and Analysis

This section verifies the validity of the two-stage robust pricing model proposed in this paper. An arithmetic example is used to analyze the market behavior, pricing strategies, and income of the EVA. The impact of the relevant parameters in this paper on the decision making of the EVA and EV users is also discussed.

6.1. Parameter Settings

This study set the optimal scheduling period T to 24 h, the average daily number of charging EVs at the EVA to 200, and the safe battery capacity of EVs to 10% and 95% of the maximum capacity, respectively. The types of EVs and related parameters are shown in Table A1 in Appendix A. The day-ahead maximum quantity of electricity purchased by the EVA was set to 1000 kW·h. Table A2 in Appendix A shows the fitting coefficient between the amount of day-ahead electricity purchased and the day-ahead electricity purchase price. The upper and lower limits of the charging price were set at 0.8 and 1.2 times the day-ahead electricity purchase price, respectively. The allowable charge and discharge price was set to the average value of the day-ahead electricity purchase price. The quantity of electricity purchased and sold in the real-time market was limited to 500 kW·h. It was assumed that the EVA could participate in load shedding between 20:00 and 22:00. The maximum effective load curtailment per unit time period was 300 kW·h, while the minimum was 150 kW·h. The compensation price per unit of load curtailment was 1 CNY/kW·h. The upper limit 50 kW·h and lower limit −50 kW·h were set as the boundaries for the uncertainty response deviation volume of each unit scheduling time period, while the upper limit 300 kW·h and lower limit −300 kW·h were set as the boundaries for the total amount of uncertainty deviation. Figure A1 in Appendix A shows the curves of each scenario of real-time prices and the corresponding probabilities, and the allowable error ε was taken to be 10−9.

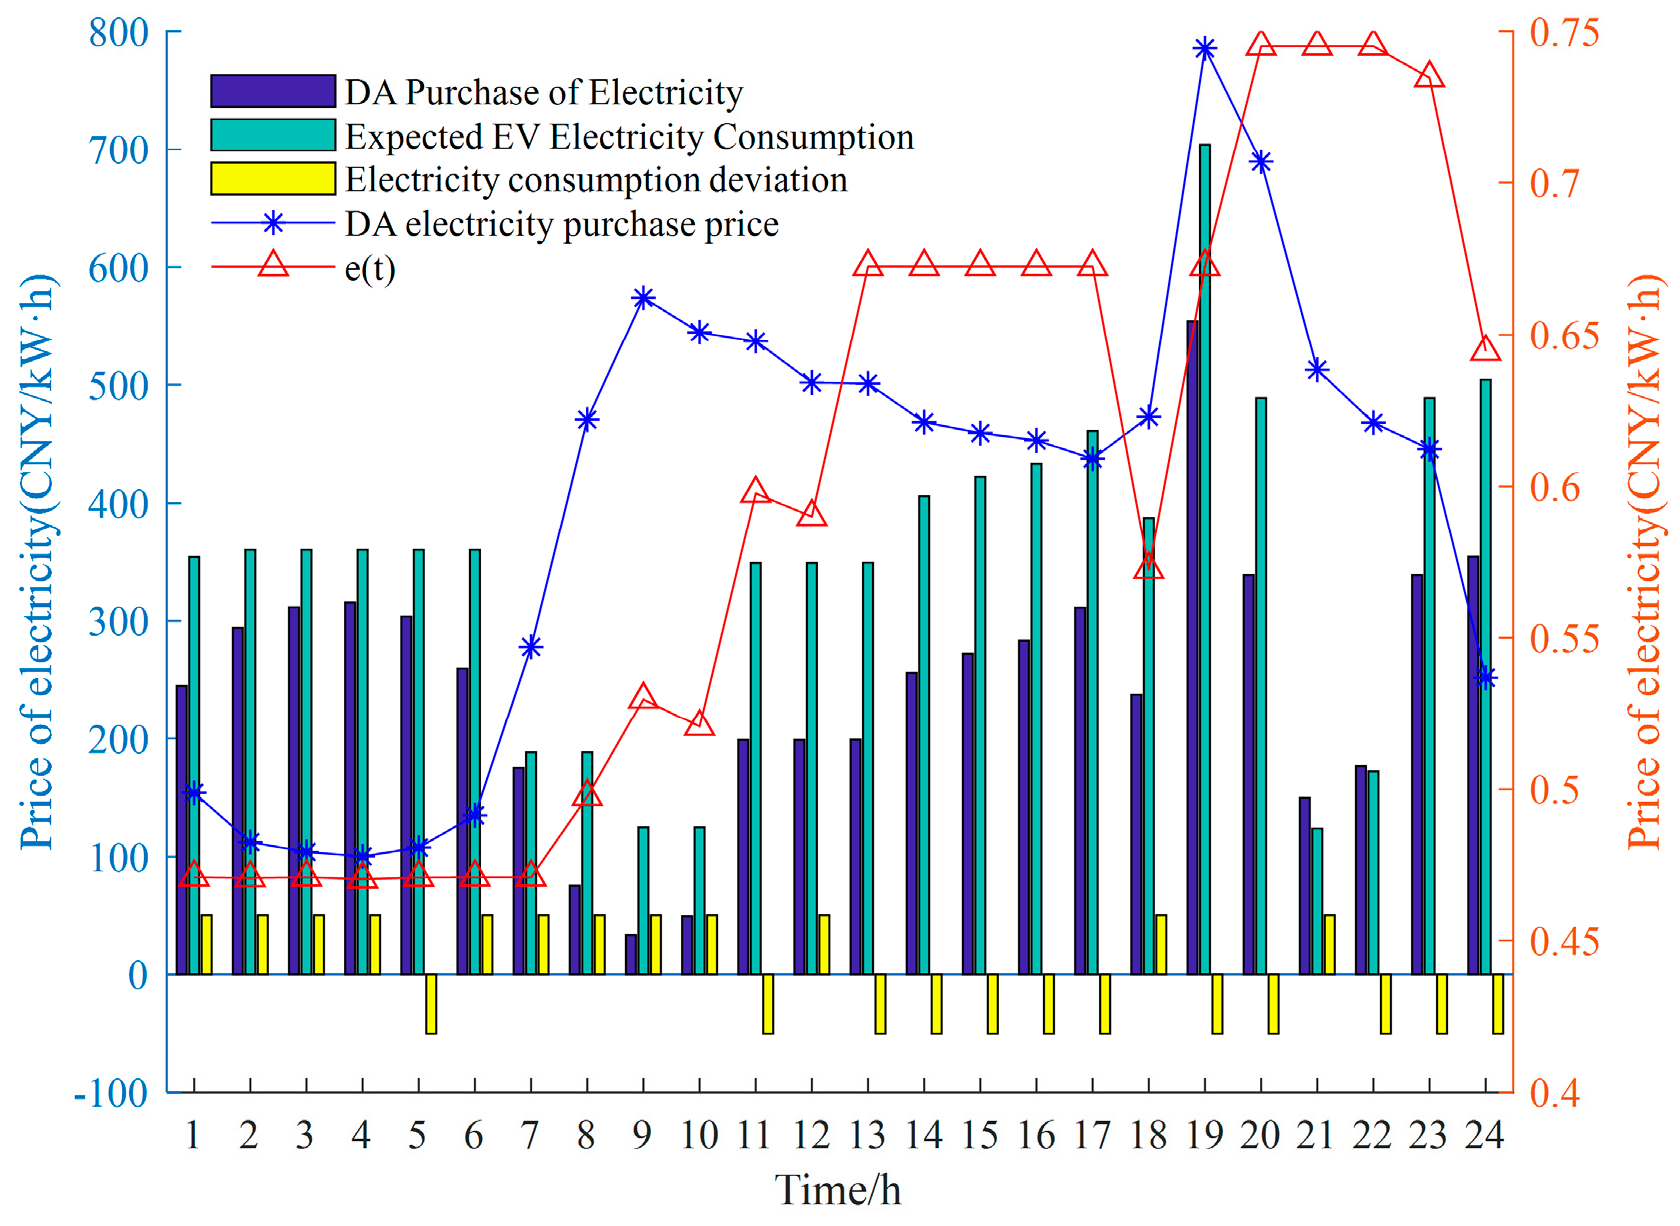
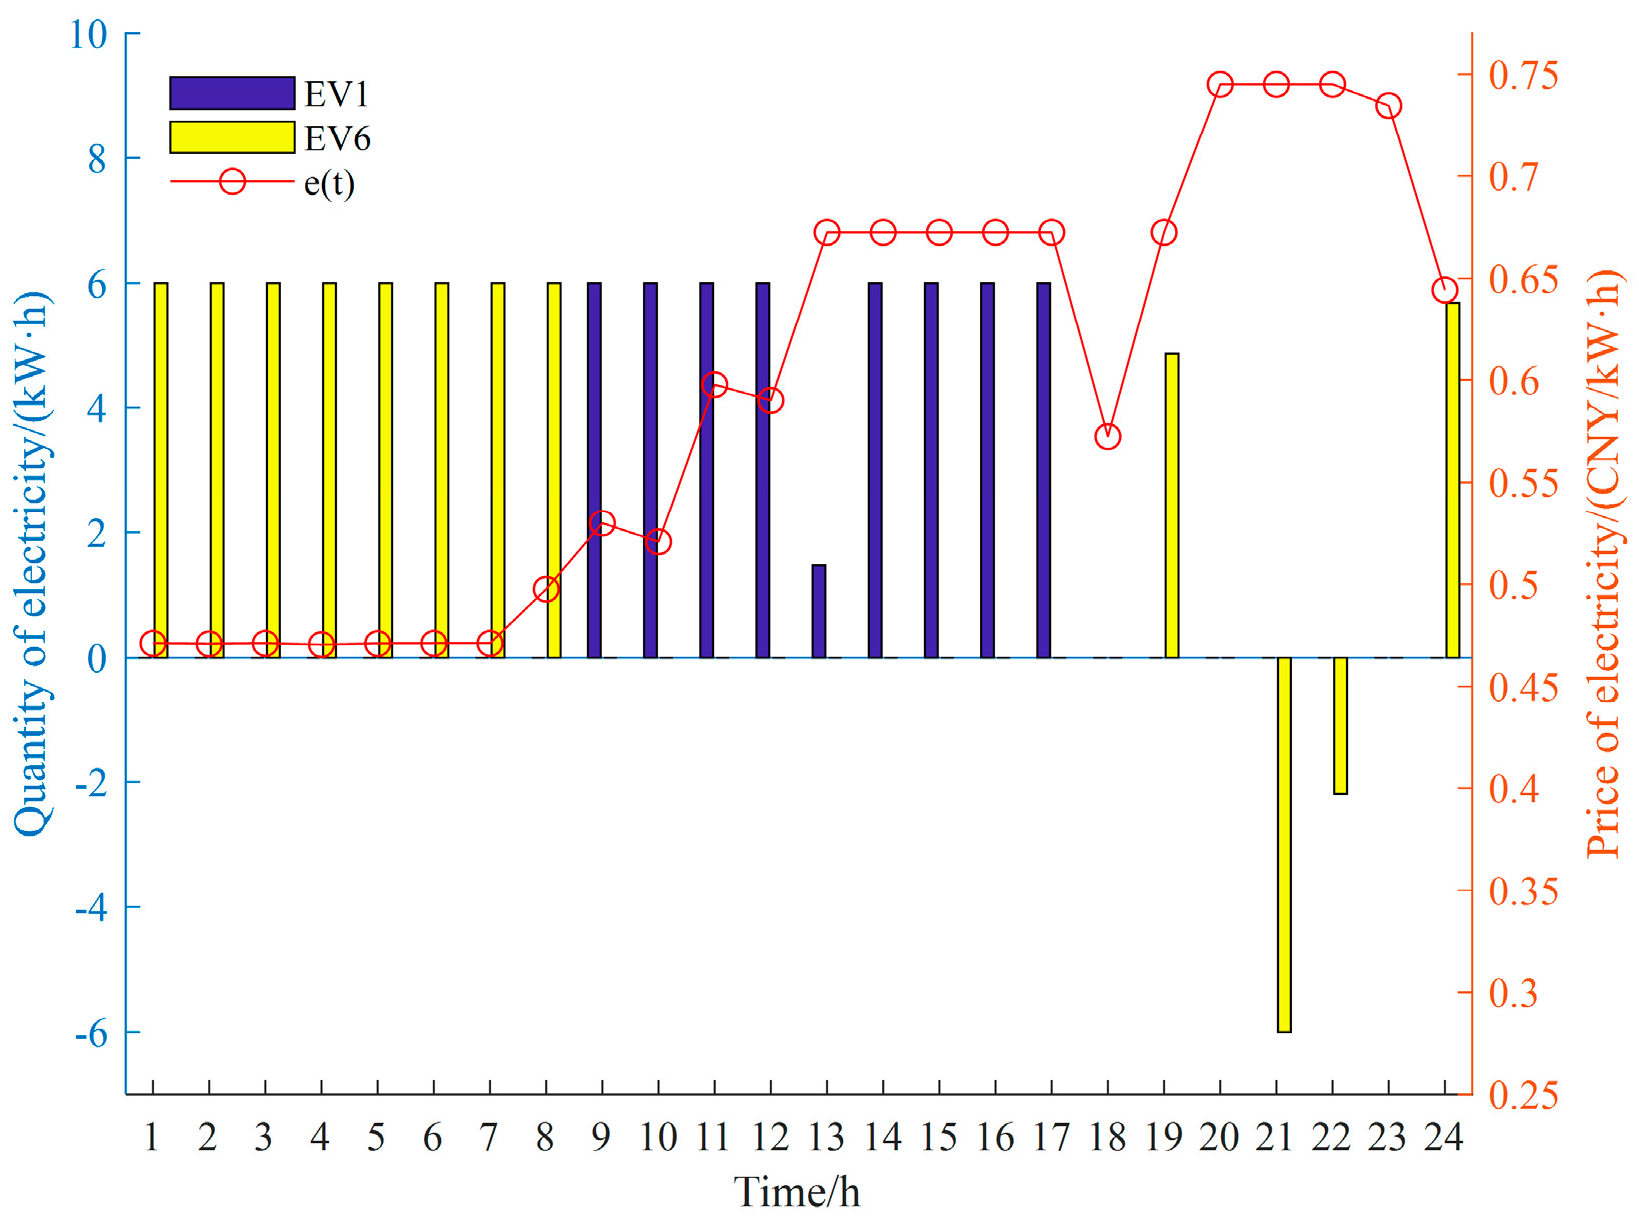
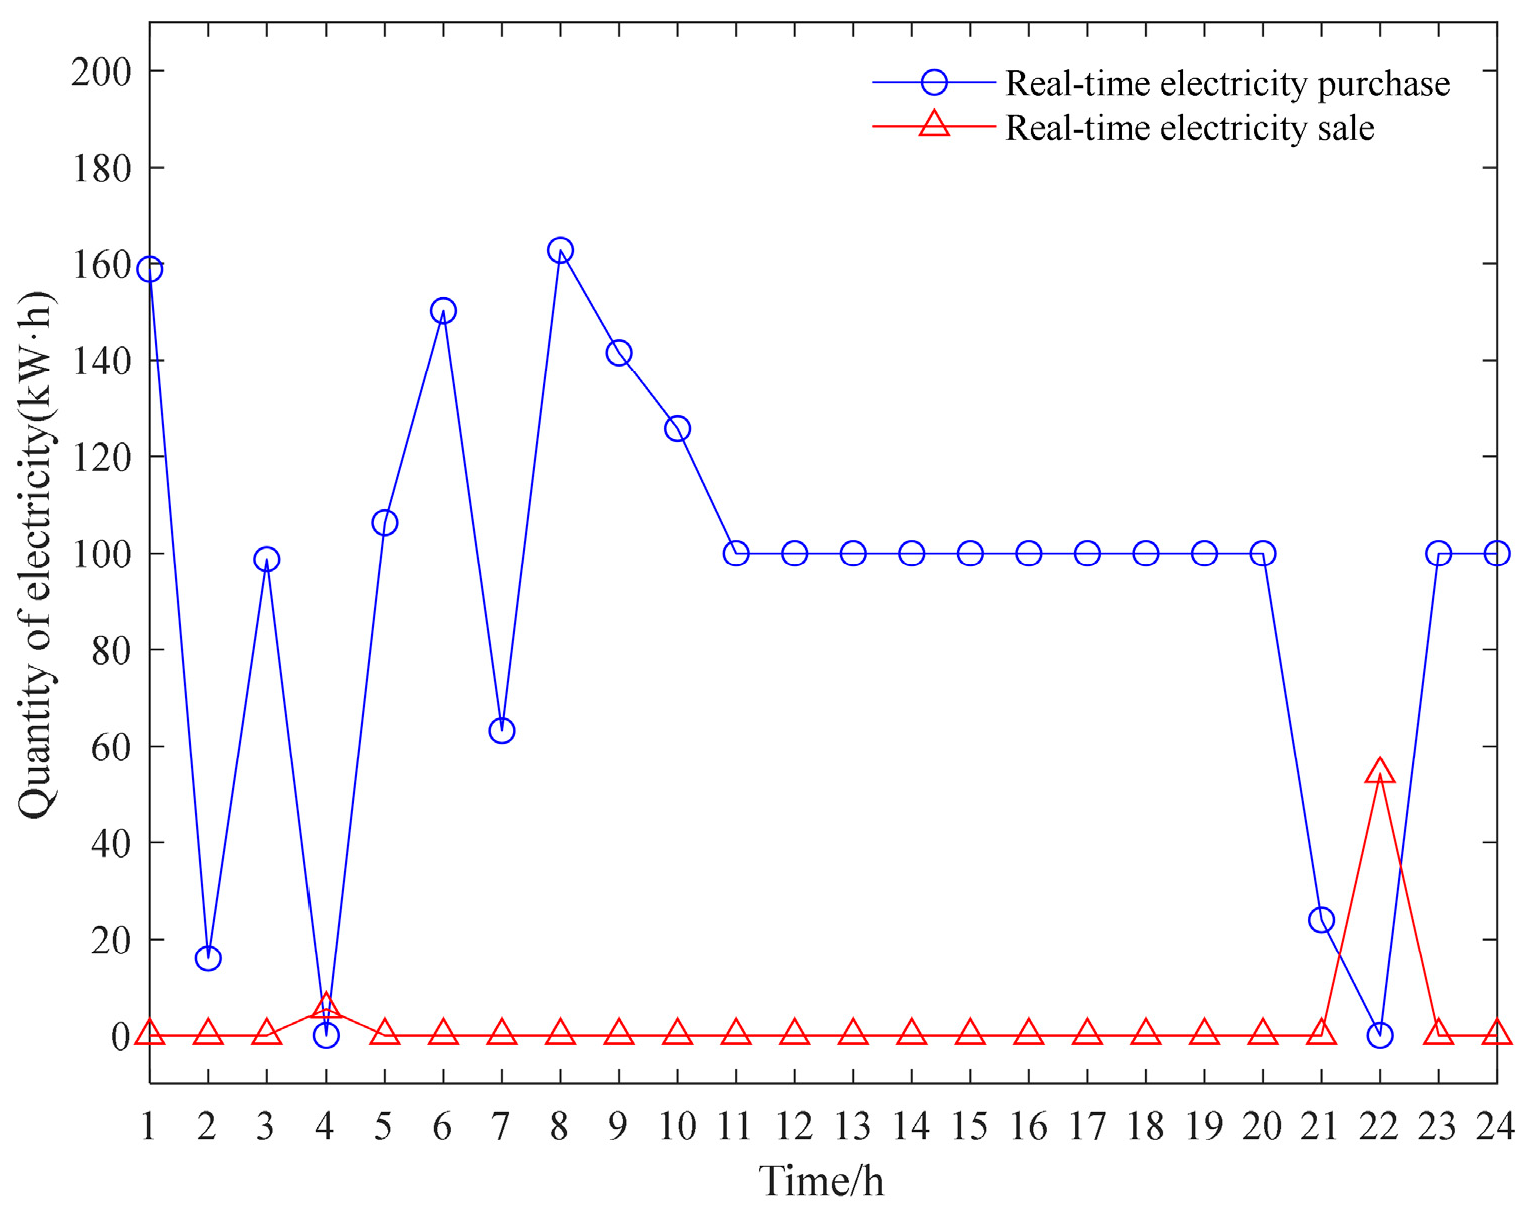
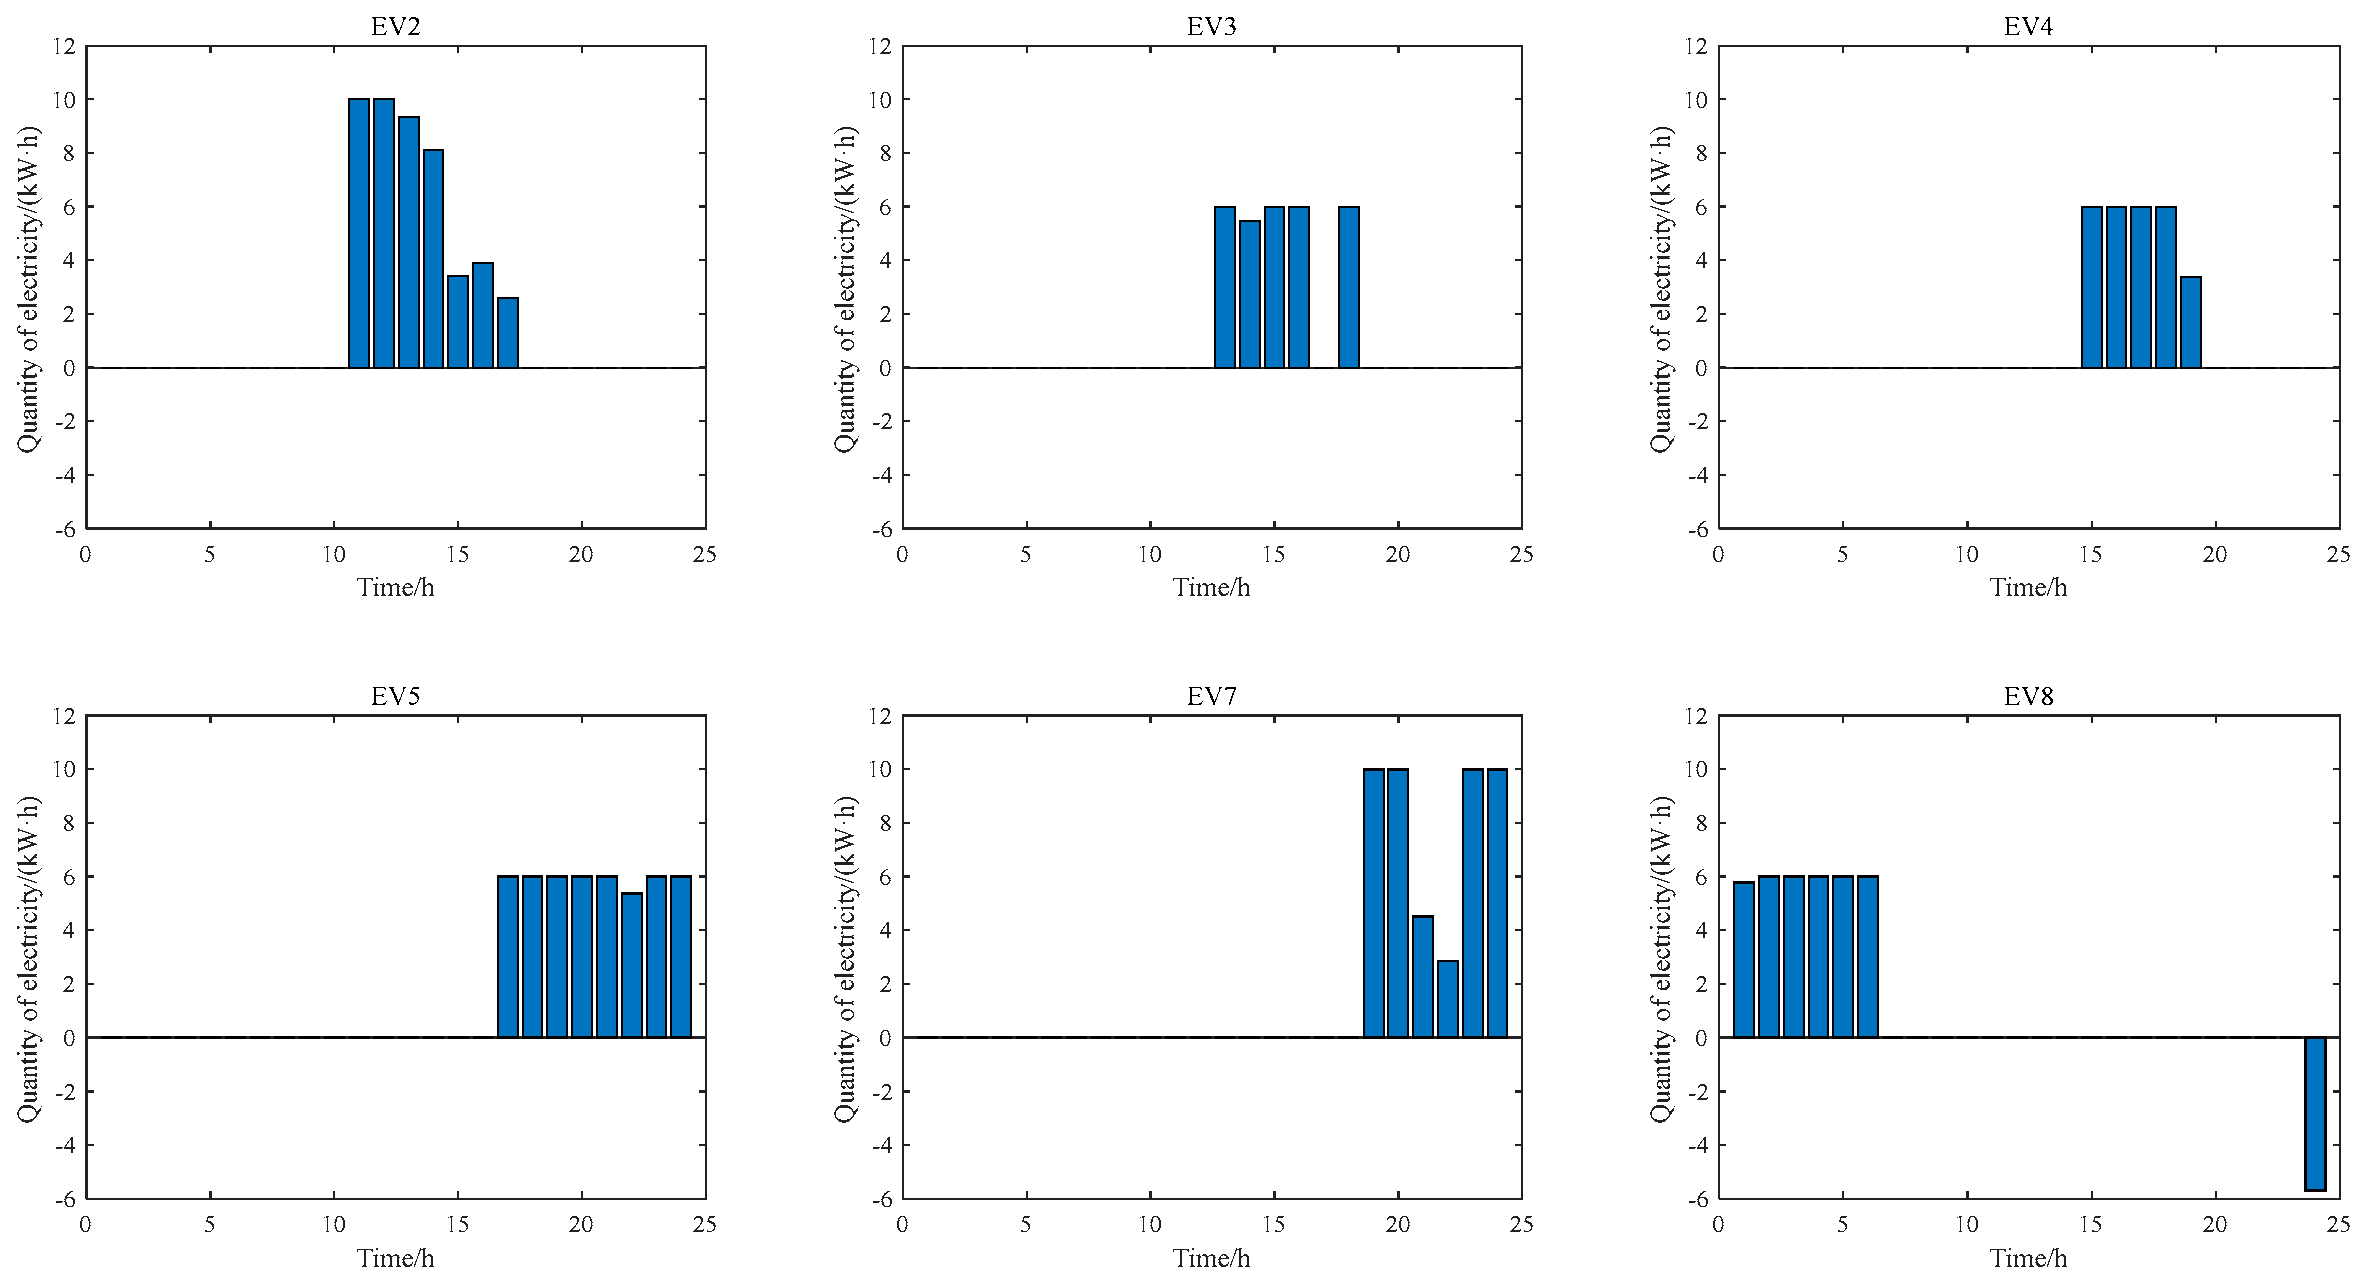
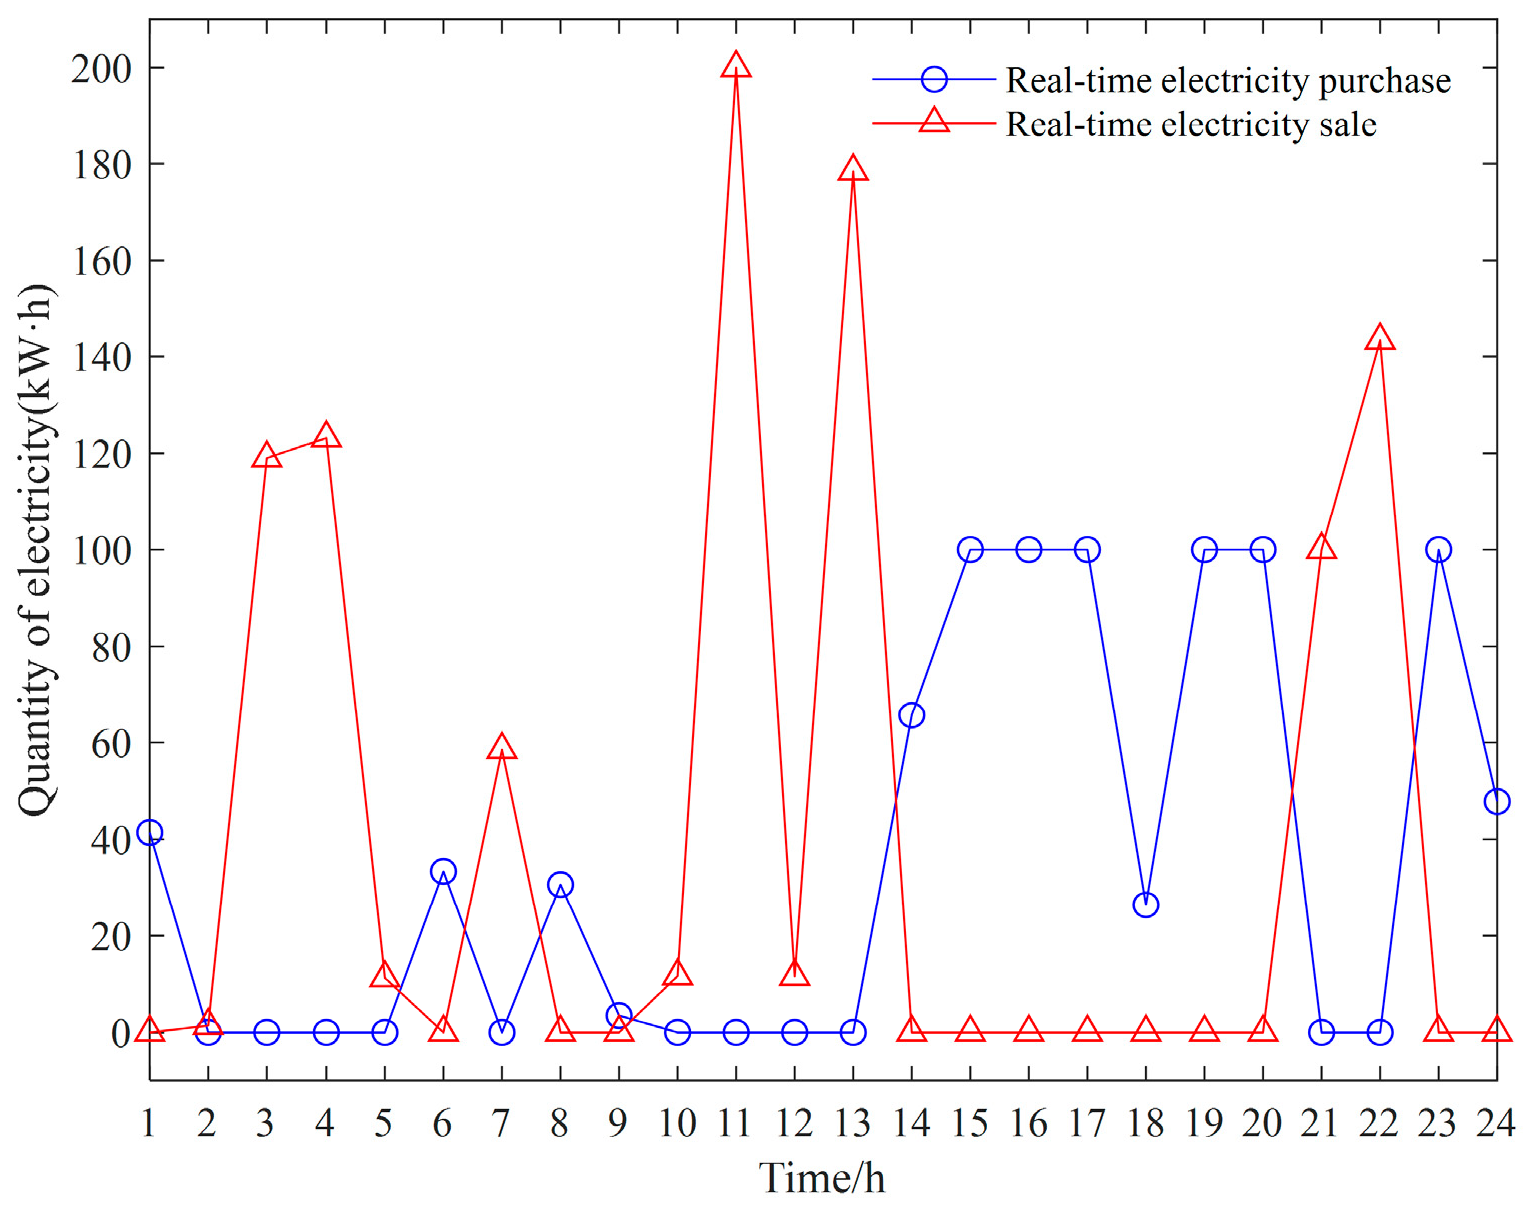
6.2. Results and Analysis

The iterative process of the solution is shown in Figure 3. With continuous iteration, the difference between the upper and lower bounds of the model decreased and, finally, after 16 iterations, the model converged to 633.16 Chinese yuan (CNY).
Figure 4 displays the EVA’s day-ahead (DA) electricity purchase and pricing decision(e(t)), along with the EVA’s day-ahead electricity purchase price, expected EV electricity consumption, and worst deviation electricity consumption under this decision. The figure shows that the EVA’s charging and discharging prices were higher than the day-ahead electricity purchase price only during the periods 13–17 and 20–24. In other words, the EVA incurred a loss when selling electricity to customers for most of the next day. The reason for this was that market rules limited the EVA’s ability to provide EV users with a price for charging and discharging that exceeded the average price of day-ahead electricity purchases for the entire day. This meant that the EVA needed to adjust user behavior by increasing the price of electricity, while also setting a low price to comply with market rules at other times. Therefore, under the constraints of market rules, the EVA needed to sacrifice some of its own interests to encourage users to change their electricity consumption behavior.
Figure 4 shows that the EVA’s day-ahead electricity purchases were lower than the sum of the expected next-day electricity consumption and the worst deviation electricity consumption in most time periods. This indicates that the EVA needed to purchase electricity in the real-time market on the next day to make up for the corresponding electricity shortfall. Appendix A, Figure A2 shows the EVA’s real-time market electricity purchases and sales under the worst deviation electricity. Upon comparing the day-ahead and real-time price scenarios, it is evident that the real-time price level was generally slightly lower than that of the day-ahead price. During the real-time stage, the EVA’s electricity purchases and sales were restricted by market rules, making it impossible to meet customers’ electricity demands solely by purchasing electricity in the real-time market. Therefore, to maximize its expected revenue, the EVA did not purchase excessive electricity in the day-ahead market. Instead, it bought electricity in the real-time market based on demand to balance out any gaps in electricity supply.
For the worst deviation in electricity consumption shown in Figure 4, positive deviations occurred mainly during periods when the charging and discharging price was lower than the day-ahead price, while negative deviations occurred mainly during periods when the charging and discharging price was higher than the day-ahead price. This is because the worst deviation electricity consumption was aimed at reducing the expected return on the EVA; electricity consumption needed to be reduced during periods of high charging and discharging prices and increased during periods of low charging and discharging prices.
The electricity consumption plans for night-charging EV1 and day-charging EV6 are presented in Figure 5 under the current EVA pricing strategy. Additionally, Figure A3 in Appendix A displays the electricity consumption plans for the remaining EV users of each type. It is important to note that the electricity consumption plans varied significantly due to differences in arrival times, departure times, battery parameters, and electricity demand among different types of EV users. However, the purpose of each type of electric vehicle user was the same: to minimize the cost of electricity consumption. Therefore, the electricity consumption pattern of each type of EV user was to charge at a low price and discharge at a high price under the price guidance of the EVA.
Figure 6 shows a comparison of pricing decisions and expected electricity consumption before and after the EVA’s participation in load curtailment (LC). Figure 6 shows that the charging and discharging price of the EVA was lower during load curtailment (periods 13–17 and 19) and higher during non-curtailment periods (periods 20–24). The price remained consistent before and after load curtailment in the remaining periods. There are two reasons for this phenomenon. Firstly, the EVA was subject to the average price constraints of the market rules, resulting in an increase in charging and discharging prices in one time period and a decrease in another. Secondly, the language used in the original text was not entirely objective, so I rephrased it to be more neutral. However, EV users experienced a certain amount of power loss during charging and discharging. To ensure that users benefitted from discharging, it was necessary to establish a significant price difference. The expected loads of the EVA before and after participating in load curtailment differed only in time periods 19–22. This is because the price level was higher in time periods 21–22. The follower problem of the master–slave game model used in this thesis was essentially an optimal sequencing problem. As a result, it shifted part of the loads in time periods 21–22 to time periods 19–20.
Table 1 shows the overall charging and discharging quantities of EV users before and after the EVA’s participation in load curtailments, and it can be seen that the charging quantity of EV users after participating in load curtailments increased from 8686.95 kW·h to 8839.63 kW·h and the discharging quantity increased from 282.34 kW·h to 420.13 kW·h, and it can be observed that the increase in charging quantity was larger than the discharging quantity by 152.68 kW·h. Additionally, there was an increase of 145.04 kW·h. The increase in EV users’ discharging power resulted in a loss of EV discharging, while the EV users’ requirement for the desired power at the time of departure remained unchanged. This led to an increase in EV users’ charging power.
Table 2 shows the income and expenses before and after EVA participation in load curtailment. The table shows that apart from the total income and income eligible for curtailment, the primary changes were in the expenditure of purchasing electricity for the day ahead and the outcome from the real-time electricity market. Day-ahead power purchase costs increased by CNY 263.599 from CNY 3245.572 to CNY 2509.171, and real-time power market expenditures decreased by CNY 189.164 from CNY 1398.518 to CNY 1209.354. The increase in electricity purchase expenditure for the day ahead was a result of higher charging demand from electric vehicle (EV) customers after participating in load curtailment. To address this, the EVA needed to purchase more electricity for the day ahead by participating in load curtailment. This led to wider spreads in charging and discharging prices at different times of the day, resulting in a higher concentration of load during certain hours. Consequently, the EVA could make more targeted day-ahead purchases. The increase in outcomes in the real-time market can be attributed to two factors. Firstly, the decrease in day-ahead purchases reduced the difference that the EVA made in the real-time stage. Secondly, EV customers’ discharging behavior compensated for the shortfall during the corresponding time period.
To analyze the impact of real-time pricing on the EVA’s market behavior, we assumed that the price of electricity in the real-time scenario was 1.1 times higher than the original price. This resulted in a higher level of electricity prices in the real-time scenario, as shown in Figure 7. The graph indicates that when the real-time price scenario was high, the EVA exhibited speculative behavior. The EVA demonstrated its ability to make a profit by purchasing more electricity than needed in the day-ahead stage and selling the excess electricity at a higher price in the corresponding time period in the real-time market. Figure A4 in Appendix A displays the EVA’s power purchases and sales in the real-time market. To maximize its expected income and minimize uncertainty regarding EV customers’ electricity consumption and real-time electricity prices, the EVA’s market strategy was to purchase electricity contracts in the real-time market after evaluating the uncertainty of electricity consumption and real-time electricity prices. It then bought or sold electricity contracts based on actual electricity demand and real-time electricity prices. The transfer of uncertainty regarding the electricity price for EV users to the EVA enabled EV participation in electricity market transactions, showcasing the potential of EVs as a flexible resource.
To verify the effectiveness of robust pricing, this study set the upper and lower bounds of the time period boundary and the aggregate boundary of deviation to 0. This meant that the uncertainty of electricity consumption was not taken into account, resulting in the optimal decision of the EVA under deterministic conditions. Based on the historical real-time price of electricity, 1000 sampling simulations were conducted under different conditions. The deviation of electricity in the simulation was a random number uniformly distributed: [–50, 50]. It is important to note that the EVA’s optimal decision under deterministic conditions did not meet the market rule constraints for real-time electricity purchases and sales in 5622 time periods out of 1000 simulations. To ensure the completeness of the sampling data, the sampling simulation of the optimal decision of the EVA under deterministic conditions did not restrict its real-time purchase and sale of electricity. The resulting income scenarios for the optimal EVA decision are shown in Figure 8 under deterministic conditions, considering uncertainty but not participating in load curtailment, and considering uncertainty and participating in load curtailment.
Under deterministic conditions, the EVA strategy in Figure 8 yielded an average income of CNY 223.29 and a range of income of (CNY 145.82, CNY 312.36) for the EVA in the simulation. However, when considering uncertainty, the EVA strategy increased the average income of the EVA in the simulation to CNY 273.37 and the range of fluctuation to (CNY 214.82, CNY 342.25). Therefore, it is evident that the pricing strategy proposed in this paper could optimize the average income of the EVA while reducing income fluctuations. The reason for this is that under the deterministic optimal decision, the EVA was only optimized for a specific EV customer electricity consumption plan. However, since there was uncertainty in the actual customer electricity consumption, a deterministic optimal decision may not have led to the maximization of the EVA’s revenue when there was a large deviation. In contrast, the EVA strategy under conditions that considered uncertainty in the optimization process broadened the search for EVA decisions, making day-ahead decisions more adaptable. In Figure 8, the EVA’s decision to participate in load curtailment increased its average income to CNY 703.40, with a fluctuation range of (CNY 583.33, CNY 837.81). The figure shows that participating in load curtailment led to a rapid increase in the EVA’s income, but it also resulted in a rapid increase in the fluctuation range of the EVA’s income. The reason is that the income from load curtailment accounted for a larger proportion of the total EVA income, so the total EVA income was more affected by the uncertainty of the electricity load, which manifested as a larger range of fluctuation of the income. However, the pricing strategy proposed in this paper improved the risk resistance and operational efficiency of the EVA in the long run, making it more adaptable to diverse, real-world scenarios.

7. Conclusions

To enhance the economics of the EVA operation strategy in the electricity market environment, this paper proposed a two-stage robust pricing strategy for EVAs. The strategy considered uncertainty under defined market rules and established a two-stage robust optimization model that takes into account electricity consumption and real-time price uncertainty as well as EV customer demand response. The risk aversion ability of the EVA was improved by coordinating the market behaviors of the two-stage market. Simulation analysis yielded the following conclusions:
(1)
The model’s optimal decision fully utilized the market rules of the two-stage market. The EVA compensated the electricity difference in the real-time market and sold excess electricity contracts to realize risk hedging, thus avoiding the market risk caused by price uncertainty.
(2)
The two-stage robust pricing model allowed the EVA to direct EV users to charge their vehicles in an organized manner by balancing self-interests and EV user expenditures through pricing. This approach avoids the market risks associated with electricity consumption uncertainty and fully utilizes the demand response potential of EV flexibility resources.
(3)
The model and optimization method enhanced the adaptability and economics of the EVA operating strategy. As a result, the average EVA income increased by approximately 20.8% and the range of income volatility decreased by about 23.5% in the simulation, while avoiding market risk.
This paper focused on an EVA’s decision-making process in the electricity market, with the user’s charging and discharging decisions being based solely on price. Future research could explore the interaction between multiple market players and the complex decision-making psychology of users. It could also investigate the dynamic game process of incomplete information among players and establish corresponding models.

Author Contributions

Conceptualization, Y.W.; methodology, W.S. and Y.W.; writing—original draft preparation, Y.W.; supervision, W.S.; project administration, W.S. All authors have read and agreed to the published version of the manuscript.

Funding

This research received no external funding.

Institutional Review Board Statement

Not applicable.

Informed Consent Statement

Not applicable.

Data Availability Statement

The raw data supporting the conclusions of this article will be made available by the authors on request.

Conflicts of Interest

The authors declare no conflicts of interest.

Appendix A

The types and parameters of electric vehicles are shown in Table A1.
Table A1. Types and parameters of electric vehicles.
EV TypesMaximum Charging and Discharging Quantity (kW·h)Battery Capacity
(kW·h)
Initial Electricity Quantity of Battery
(kW·h)
Time of ArrivalDeparture TimesRatios
EV16601008:0017:000.104
EV210601210:0017:000.112
EV36401012:0020:000.091
EV46401214:0021:000.093
EV56601216:0024:000.139
EV610601218:0024:000.161
EV76601018:00Next day 08:000.157
EV86401023:00Next day 08:000.143
The fitting parameters of Equation (8) are shown in Table A2.
Table A2. Fitting parameters.
Time123456
k D A ( t ) /(CNY/kW·h)0.0002040.0002010.0002010.0002010.0002010.00022
b D A ( t ) /(CNY)0.44880.42340.41680.41460.41980.6052
Time789101112
k D A ( t ) /(CNY/kW·h)0.000210.000220.0002250.0002240.000220.000219
b D A ( t ) /(CNY)0.51010.60520.65470.63980.60400.5906
Time131415161718
k D A ( t ) /(CNY/kW·h)0.0002190.0002160.0002150.0002150.0002130.000217
b D A ( t ) /(CNY)0.59020.56570.55880.55430.54260.5713
Time192021222424
k D A ( t ) /(CNY/kW·h)0.0002220.0002230.000220.0002180.0002130.000205
b D A ( t ) /(CNY)0.62150.64140.60520.58240.53400.4641
The real-time electricity price scenarios are shown in Figure A1.
Figure A1. Real-time electricity price scenarios.
Sustainability 16 03593 g0a1
The market behavior of the EVA in real-time electricity markets is shown in Figure A2.
Figure A2. Market behavior of EVA in real-time electricity markets.
Sustainability 16 03593 g0a2
The electricity consumption plans for different types of EVs are shown in Figure A3.
Figure A3. Electricity consumption plans for different types of EVs.
Sustainability 16 03593 g0a3
The market behavior of the EVA in real-time electricity markets under high electricity price scenarios is shown in Figure A4.
Figure A4. Market behavior of EVA in real-time electricity markets under high electricity price scenarios.
Sustainability 16 03593 g0a4

References

  1. Zhang, L.; Yang, M.; Zhao, Z. Game analysis of charging service fee based on benefit of multi-party participants: A case study analysis in China. Sustain. Cities Soc. 2019, 48, 101528. [Google Scholar] [CrossRef]
  2. Liu, J.; Zhong, C. An economic evaluation of the coordination between electric vehicle storage and distributed renewable energy. Energy 2019, 186, 115821. [Google Scholar] [CrossRef]
  3. Xu, B.; Zhang, G.; Li, K.; Li, B.; Chi, H.; Yao, Y. Reactive power optimization of a distribution network with high-penetration of wind and solar renewable energy and electric vehicles. Prot. Control Mod. Power Syst. 2022, 7, 51. [Google Scholar] [CrossRef]
  4. Saha, D.; Saikia, L.C.; Rahman, A. Cascade controller based modeling of a four area thermal: Gas AGC system with dependency of wind turbine generator and PEVs under restructured environment. Prot. Control Mod. Power Syst. 2022, 7, 47. [Google Scholar] [CrossRef]
  5. Hussain, M.T.; Sulaiman, N.B.; Hussain, M.S.; Jabir, M. Optimal Management strategies to solve issues of grid having Electric Vehicles (EV): A review. J. Energy Storage 2020, 33, 102114. [Google Scholar] [CrossRef]
  6. Ahmadi, M.; Hosseini, S.H.; Farsadi, M. Optimal Allocation of Electric Vehicles Parking Lots and Optimal Charging and Discharging Scheduling using Hybrid Metaheuristic Algorithms. J. Electr. Eng. Technol. 2021, 16, 759–770. [Google Scholar] [CrossRef]
  7. Li, P.; Hu, W.; Xu, X.; Huang, Q.; Liu, Z.; Chen, Z. A frequency control strategy of electric vehicles in microgrid using virtual synchronous generator control. Energy 2019, 189, 116389. [Google Scholar] [CrossRef]
  8. Reddy, K.R.; Meikandasivam, S. Load Flattening and Voltage Regulation using Plug-In Electric Vehicle’s Storage capacity with Vehicle Prioritization using ANFIS. IEEE Trans. Sustain. Energy 2018, 11, 260–270. [Google Scholar] [CrossRef]
  9. Zheng, Y.; Yu, H.; Shao, Z.; Jian, L. Day-ahead bidding strategy for electric vehicle aggregator enabling multiple agent modes in uncertain electricity markets. Appl. Energy 2020, 280, 115977. [Google Scholar] [CrossRef]
  10. Clairand, J.M. Participation of Electric Vehicle Aggregators in Ancillary Services Considering Users’ Preferences. Sustainability 2019, 12, 8. [Google Scholar] [CrossRef]
  11. Zhou, X.; Zou, S.; Wang, P.; Ma, Z. Voltage Regulation in Constrained Distribution Networks by Coordinating Electric Vehicle Charging Based on Hierarchical ADMM. IET Gener. Transm. Distrib. 2020, 14, 3444–3457. [Google Scholar] [CrossRef]
  12. Zheng, Y.; Wang, Y.; Yang, Q. Bidding strategy design for electric vehicle aggregators in the day-ahead electricity market considering price volatility: A risk-averse approach. Energy 2023, 283, 129138. [Google Scholar] [CrossRef]
  13. Zheng, Y.; Wang, Y.; Yang, Q. Two-phase operation for coordinated charging of electric vehicles in a market environment: From electric vehicle aggregators’ perspective. Renew. Sustain. Energy Rev. 2023, 171, 113006. [Google Scholar] [CrossRef]
  14. Liu, H.; Zhou, Y.; Li, Y.; Zheng, H. Aggregator pricing and electric vehicles charging strategy based on a two-layer deep learning model. Electr. Power Syst. Res. 2024, 227, 109971. [Google Scholar]
  15. Bulut, E.; Kisacikoglu, M.C.; Akkaya, K. Spatio-Temporal Non-Intrusive Direct V2V Charge Sharing Coordination. IEEE Trans. Veh. Technol. 2019, 68, 9385–9398. [Google Scholar] [CrossRef]
  16. Arias, N.B.; Sabillón, C.; Franco, J.F.; Quirós-Tortós, J.; Rider, M.J. Hierarchical optimization for user-satisfaction-driven electric vehicles charging coordination in integrated MV/LV networks. IEEE Syst. J. 2023, 17, 1247–1258. [Google Scholar] [CrossRef]
  17. Jozi, F.; Mazlumi, K.; Hosseini, H. Charging and discharging coordination of electric vehicles in a parking lot considering the limitation of power exchange with the distribution system. In Proceedings of the IEEE 4th International Conference on Knowledge-Based Engineering and Innovation, Tehran, Iran, 22–22 December 2017; pp. 937–941. [Google Scholar]
  18. He, Y.; Venkatesh, B.; Guan, L. Optimal Scheduling for Charging and Discharging of Electric Vehicles. IEEE Trans. Smart Grid 2012, 3, 1095–1105. [Google Scholar] [CrossRef]
  19. Sun, W.; Liu, X.; Xiang, W.; Li, H. Master-slave game based optimal pricing strategy for load aggregator in day-ahead electricity market. Autom. Electr. Power Syst. 2021, 45, 159–167. [Google Scholar]
  20. Zhang, B.; Hu, W.; Cao, D.; Ghias, A.M.Y.M.; Chen, Z. Novel Data-Driven decentralized coordination model for electric vehicle aggregator and energy hub entities in multi-energy system using an improved multi-agent DRL approach. Appl. Energy 2021, 339, 120902. [Google Scholar] [CrossRef]
  21. Cao, Y.; Huang, L.; Li, Y.; Jermsittiparsert, K.; Ahmadi-Nezamabad, H.; Nojavan, S. Optimal scheduling of electric vehicles aggregator under market price uncertainty using robust optimization technique. Int. J. Electr. Power Energy Syst. 2020, 117, 105628. [Google Scholar] [CrossRef]
  22. Yitong, S.; Yimeng, S.; Hang, Y.; Shao, Z.; Jian, L. Achieving Efficient and Adaptable Dispatching for Vehicle-to-Grid Using Distributed Edge Computing and Attention-Based LSTM. IEEE Trans. Ind. Inform. 2022, 18, 6915–6926. [Google Scholar]
  23. Wei, W.; Liu, F.; Mei, S. Energy pricing and dispatch for smart grid retailers under demand response and market price uncertainty. IEEE Trans. Smart Grid 2015, 6, 1364–1374. [Google Scholar] [CrossRef]
  24. Nguyen, D.T.; Le, L. Risk-constrained profit maximization for microgrid aggregators with demand response. IEEE Trans. Smart Grid 2015, 6, 135–146. [Google Scholar] [CrossRef]
  25. Wang, L.; Zhu, Z.; Jiang, C.; Li, Z. Bi-Level Robust Optimization for Distribution System with Multiple Microgrids Considering Uncertainty Distribution Locational Marginal Price. IEEE Trans. Smart Grid 2020, 12, 1104–1117. [Google Scholar] [CrossRef]
  26. Liu, W.; Wen, F.; Dong, Z.; Palu, I. Development of robust participation strategies for an aggregator of electric vehicles in multiple types of electricity markets. Energy Convers. Econ. 2020, 1, 104–123. [Google Scholar] [CrossRef]
  27. Habibifar, R.; Lekvan, A.A.; Ehsan, M. A risk-constrained decision support tool for EV aggregators participating in energy and frequency regulation markets. Electr. Power Syst. Res. 2020, 185, 106367. [Google Scholar] [CrossRef]
  28. Zhengmao, L.; Yan, X.; Xiaodong, Z. Stochastic-Weighted Robust Optimization Based Bilayer Operation of a Multi-Energy Building Microgrid Considering Practical Thermal Loads and Battery Degradation. IEEE Trans. Sustain. Energy 2022, 13, 668–682. [Google Scholar]
  29. José, I.; António, C.; Filipe, S. Network-secure bidding strategy for aggregators under uncertainty. Sustain. Energy Grids Netw. 2022, 30, 100666. [Google Scholar]
  30. Qiu, Y.; Li, Q.; Ai, Y.; Chen, W.; Benbouzid, M.; Liu, S. Two-stage distributionally robust optimization-based coordinated scheduling of integrated energy system with electricity-hydrogen hybrid energy storage. Prot. Control Mod. Power Syst. 2023, 8, 33. [Google Scholar] [CrossRef]
  31. Wang, J.; Xie, N.; Huang, C.; Wang, Y. Two-stage stochastic-robust model for the self-scheduling problem of an aggregator participating in energy and reserve markets. Prot. Control Mod. Power Syst. 2023, 8, 45. [Google Scholar] [CrossRef]
  32. Tian, K.; Sun, W.; Han, D. Strategic Investment in Transmission and Energy Storage in Electricity Markets. J. Mod. Power Syst. Clean Energy 2022, 10, 179–191. [Google Scholar] [CrossRef]
  33. Guo, S.; Li, P.; Ma, K.; Yang, B.; Yang, J. Robust energy management for industrial microgrid considering charging and discharging pressure of electric vehicles. Appl. Energy 2022, 325, 119846. [Google Scholar] [CrossRef]
  34. Zeng, B.; Zhao, L. Solving two-stage robust optimization problems using a column-and-constraint generation method. Oper. Res. Lett. 2013, 41, 457–461. [Google Scholar] [CrossRef]
Figure 1. Operation model of EVA.
Sustainability 16 03593 g001
Figure 2. Robust pricing model structure.
Sustainability 16 03593 g002
Figure 3. Iterative process of the model.
Sustainability 16 03593 g003
Figure 4. Day-ahead decision, expected EV electricity consumption, and worst deviation of EVA.
Sustainability 16 03593 g004
Figure 5. Electricity consumption plan for EV1 and EV6.
Sustainability 16 03593 g005
Figure 6. EVA’s pricing strategy and expected EV electricity consumption before and after participating in load curtailment.
Sustainability 16 03593 g006
Figure 7. Day-ahead purchase of electricity, expected EV electricity consumption, and worst deviation of EVA.
Sustainability 16 03593 g007
Figure 8. Box plots of EVA incomes for different decisions.
Sustainability 16 03593 g008
Table 1. Charging and discharging quantities of EV users before and after EVA’s participation in load curtailment.
ItemBefore LCAfter LC
Charged/kW·h8686.958839.63
Discharged/kW·h282.34420.13
Table 2. Income and expenditure statement of EVA before and after participating in load curtailment.
ItemBefore LCAfter LC
DA purchase of electricity/CNY−3245.572−3509.171
Fees paid by EV users/CNY5085.0065099.522
Real-time electricity market/CNY−1398.518−1209.354
Load curtailment/CNY-500
Uncertainty/CNY−247.180−247.836
Total income of EVA/CNY193.736633.161
Disclaimer/Publisher’s Note: The statements, opinions and data contained in all publications are solely those of the individual author(s) and contributor(s) and not of MDPI and/or the editor(s). MDPI and/or the editor(s) disclaim responsibility for any injury to people or property resulting from any ideas, methods, instructions or products referred to in the content.

