
The Influence of Cropping Systems and Tillage Intensity on Soil CO2 Exchange Rate


Institute of Agriculture, Lithuanian Research Centre for Agriculture and Forestry, Instituto al. 1, Akademija, LT-58344 Kėdainiai District, Lithuania
*
Authors to whom correspondence should be addressed.
Sustainability 2024, 16(9), 3591; https://0-doi-org.brum.beds.ac.uk/10.3390/su16093591
Submission received: 4 March 2024
/
Revised: 12 April 2024
/
Accepted: 22 April 2024
/
Published: 25 April 2024
(This article belongs to the Special Issue Interdisciplinary Research on Soil Sustainable Management in Different Agroecosystems: Management of Agriculture–Ecology–Land-Management-Planning Interactions)
Abstract
:In order to control the amount of greenhouse gas emissions from agriculture, it is necessary to select the appropriate crop rotation and tillage intensity depending on the soil type and climatic conditions. However, their implementation in agricultural management methods has been insufficient until now. The main objective of this study was to investigate the changes and dependences in soil net CO2 exchange rate (NCER) and main physico-chemical parameters under different tillage (conventional (CT) and no tillage (NT)) and crop rotation systems. Cropping systems significantly affected the amount of nutrients, but did not affect pH and organic carbon; otherwise, tillage vs. cropping systems had no significant effects on the soil chemical parameters analyzed. The data revealed that in NT treatments, the NCER was 28% higher than in CT. Different crop rotations also revealed a significant effect on NCER from the soil. Carbon dioxide fluxes increased in cropping systems where a higher share of catch crops were included. In NT systems, a comparatively higher soil moisture content was registered. In addition, the rotations with catch crops produced a higher (by 1–3%) soil moisture content. The temperature of the soil surface was not significantly affected by tillage or cropping systems; nevertheless, a trend towards higher soil surface temperatures in CT was determined, which might be affected by enhanced air circulation in the pores. Soil NCER increase correlated negatively with higher soil surface moisture content, while its relationship was positive with soil surface temperature increase. In general, soil surface temperature and moisture were the most significant factors in explaining the fluctuation in NCER from Cambisols in Lithuania under moderate climatic conditions.
1. Introduction
Global warming and its related environmental challenges caused by increased emissions of greenhouse gases, like carbon dioxide (CO2), are raising serious issues over the world. A significant portion of the world’s anthropogenic emissions, approximately 10–12%, comes from agriculture [1]. CO2 efflux has increased much more as a result of intensified agriculture based on monocultures and intense mechanization driven by the world’s food demand. The challenge of maintaining crop yields while reducing CO2 efflux is currently unparalleled. The amount of CO2 emitted from agricultural systems is significantly influenced by soil, its basic characteristics, location, climate, and management techniques [2]. Sustainable agriculture relies on the development of efficient practices in agriculture that maintain or even increase crop yields while lowering CO2 efflux [3]. Therefore, the identification and measurement of NCER from agricultural land have received considerable attention from scientists and policymakers around the world [4,5].
The release of CO2 in soil occurs as a result of biochemical processes that are closely linked to root respiration and microorganism biological activity. CO2 efflux from the soil is controlled by many factors such as temperature, soil moisture and aeration porosity, soil tillage and vegetation [6,7,8]. Additional factors influencing emissions are the soil’s physical, chemical, and biological characteristics [9]. Variations in temperature and precipitation can strongly impact NCER mainly through modifications to soil organic matter mineralization, which claims that soil moisture is the main factor in soil NCER [4,10]. According to Das et al. [11], positive linear correlations have been found between soil temperature and NCER. As reported by Buragiene et al. [12], there was a positive dependence between soil moisture content and NCER from the soil. It was determined that higher soil moisture leads to more intense oxidation of organic matter, which, in turn, increases CO2 efflux from the soil.
Land management strategies with the aim to optimize the global carbon cycle by limiting CO2 losses from soils through the long-term conservation of carbon deposits are critical [13]. Soil tillage is a major factor influencing soil NCER [14]. Tillage may alter the physical properties of the soil, such as temperature, moisture, oxygen content and also microbial contact with the substrate, and substrate distribution [15]. Intense tillage increases the soil’s O2 content, which makes it a more favorable environment for microbial activity and, consequently, a rise in NCER. According to reports by Nyambo et al. [16], Buragiene et al. [12], and Bilandžija et al. [17], extensive tillage results in higher NCER compared to reduced tillage or direct sowing. No tillage (NT) as a key conservation agricultural technique is becoming more and more popular as a way to lower soil erosion, increase biological activity, and promote greater soil aggregate stability in addition to lowering soil NCER [18]. It is recognized that the application of NT increases agricultural sustainability by reducing carbon footprint [15]. NT has been shown to lower soil NCER when compared to traditional tillage, although its effects on crop yields have not always remained constant. However, there is significant disagreement in the literature regarding the effectiveness of NT on CO2 efflux reduction and crop yield improvement compared to the more widely adopted CT, which highlights a critical knowledge gap in the context of climate change mitigation and carbon neutrality.
Although cropping systems diversification using perennials and catch crops is described as an effective long-term strategy for carbon and nitrogen storage in the soil, there are still many questions about the relationship between crop productivity and soil health [19]. Cultivated fields could be sown with catch crops to lessen the soil’s direct effect on the environment and lower NCER from the soil into the atmosphere. It also protects soil from erosion and enriches soil with organic materials through the addition of litter and root exudates [20]. However, how catch crops (CCs) affect CO2 and other greenhouse gas emissions remains elusive. The research results published in the literature are controversial. CCs may result in higher NCER because they provide more carbon to the soil than other crops. According to Sanz-Cobena et al. [21], the increased respiration and metabolic activity in the soil rhizosphere caused by a CC increased NCER by 30%. Other studies revealed that soil NCER responded differentially to the CC types studied to the reduction of CO2 efflux variation from 10 to 23% [22,23]. This suggests that the response of soil CO2 production by CC addition is likely mediated by a combination of different factors such as edaphic characteristics, sampling time, climatic conditions and plant performance. In relation to this, a deeper understanding of how different tillage practices, crop diversification, and inclusion of CC affect soil NCER in different pedoclimatic conditions is still needed. Also, scientific information regarding agronomic practices that can promote climate neutrality on fields by lowering greenhouse gas emissions and raising carbon storage is required. The main aim of this study was (1) to evaluate the effects of soil tillage (CT vs. NT) and cropping systems on soil NCER variations during the vegetation period; (2) to determine the influence of different tillage in combination with cropping systems on main soil physical and chemical parameters; and (3) to identify the potential environmental variables that are most probable to affect the soil NCER.
Thus, we hypothesized that reduced intensity of tillage and inclusion of CC will have an effect not only on the physico-chemical properties of soil, but also contribute to the management of the intensity of soil NCER. The results of this experiment should improve our understanding of how agricultural practices affect CO2 emission reduction, will help to understand the causes and enhancing aspects affecting NCER, as well as the influence of different management systems according to local environmental and climatic circumstances.
2. Materials and Methods
2.1. Experimental Site Characterization
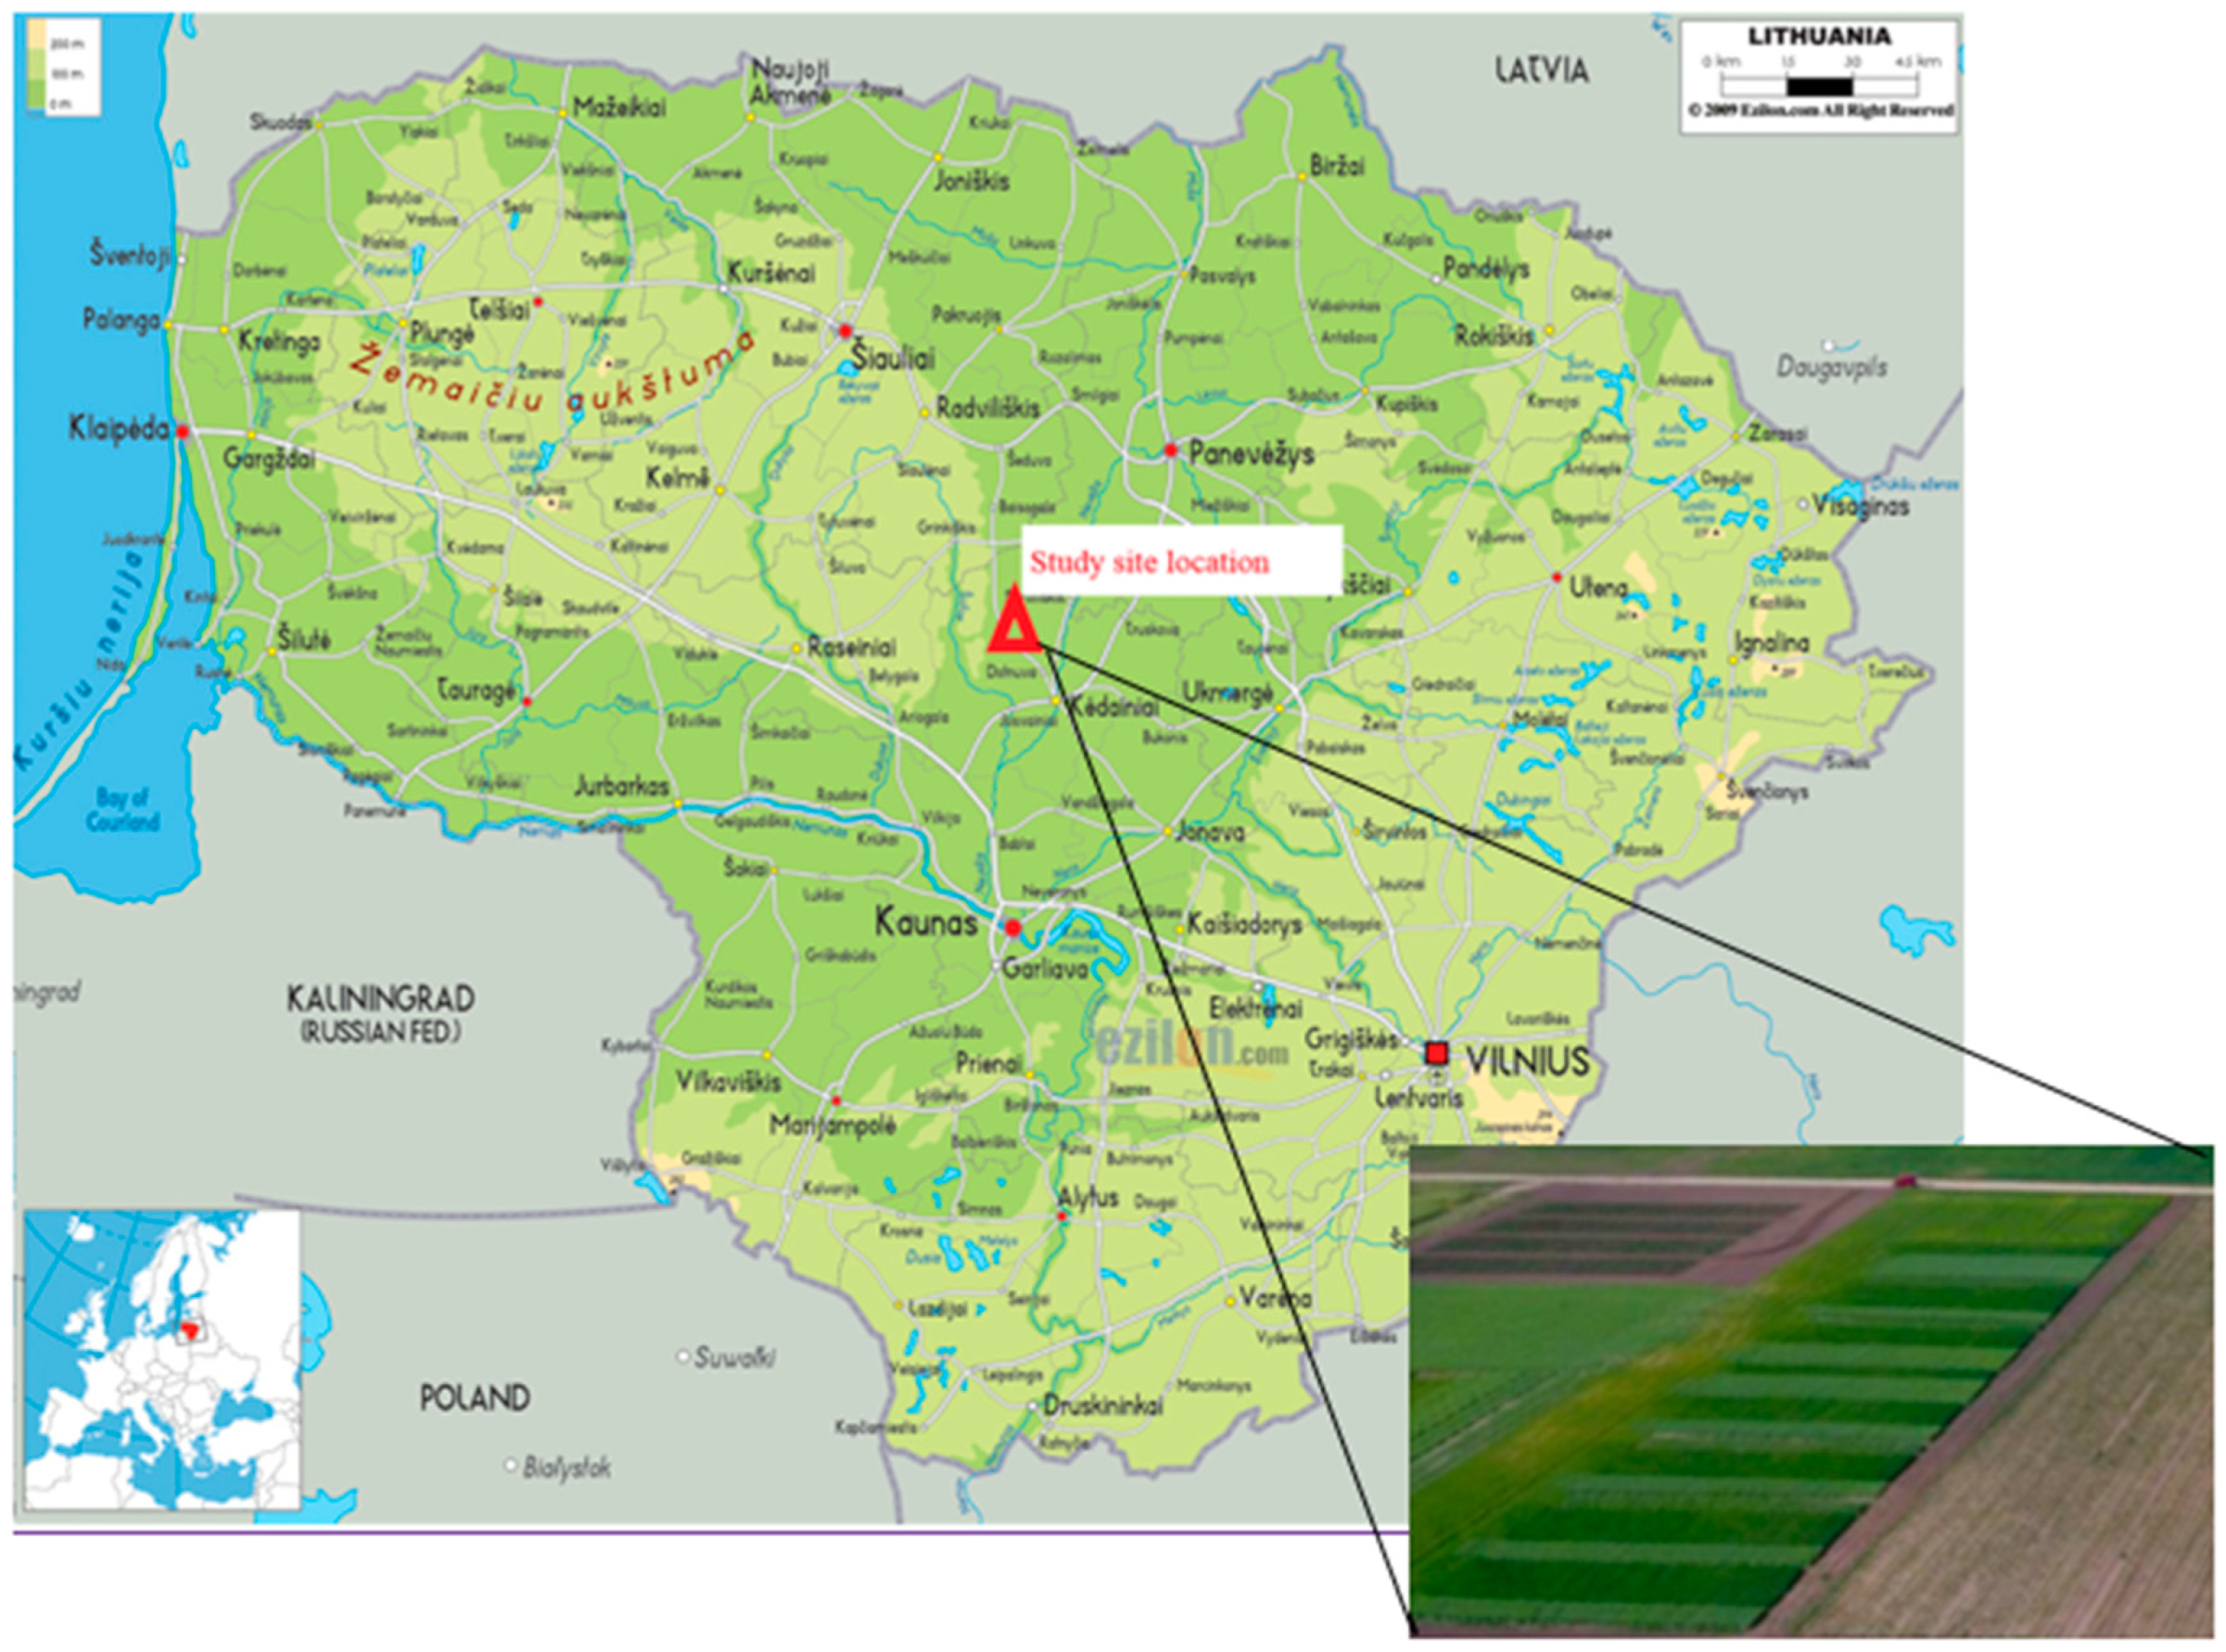
The field experiment was established in 2021 at the Institute of Agriculture, Lithuanian Research Centre for Agriculture and Forestry (LAMMC). The experimental area was situated in the Central part of Lithuania at Akademija, Kėdainiai district, with the coordinates (55°23′ N, 23°50′ E) (Figure 1). The climate of Lithuania is humid continental, with warm summers and rather severe winters. According to standard climate norm data (1991–2020), the average air temperature at the experimental site was 7.5 °C, and the average amount of precipitation amounted to 700 mm. The investigations were performed in 2021–2023.
The soil of the experimental site was identified as Endocalcary-Endohypogleyic Cambisol of a loam texture according to the international soil classification system [24]. The texture of the soil was loam with the clay content (13.7%). The main average topsoil (0–20 cm) chemical characteristics were as follows: pHKCl—6.6; humus content—31 g kg−1; plant available phosphorus (P2O5) and potassium (K2O)—200 and 150 mg kg−1, respectively.
2.2. Treatments and Management Techniques
This study was carried out during the period of April–September 2021–2023. Five different crop rotations and two tillage systems were analyzed in this research. The field experiment with 10 treatments was laid out in a split-plot design with four replications. In the two-factor field experiment, different tillage systems (Factor A: conventional tillage (CT) and no tillage (NT)) and different crop rotations (Factor B) were investigated (Figure 2).
Conventional tillage (CT) consisted of stubble cultivation and deep plowing. Deep plowing was carried out at 20–22 cm deep with a reversible plow with semi-screw plows. A day before sowing, pre-sowing tillage was carried out. Direct drilling was performed using a flat double-disc seed drill. No tillage (plots without cover crops) involved the application of broad-effect herbicide at the recommended rate, diluting it with 200 L ha−1 of water. Direct drilling was also carried out.
A three-course crop rotation including winter wheat (Triticum aestivum L.), spring wheat (Triticum aestivum L.), pea (Pisum sativum L.) and winter rape (Brassica napus L.) was included in the experiment. The crop rotation differed depending on the year of growing (Figure 2). White mustard (Sinapis alba L.) as a catch crop was sown only in selected treatments after the harvest of main crops. Catch crops were sown soon after harvesting the main crop. Sowing was carried out with the “Rapid 400 C” disk seed drill across the direction of tillage.
Mineral fertilizer (NPK) rates were determined based on the amount of mineral nitrogen, mobile P2O5, and K2O in the soil. Fertilizers were spread on the soil surface and slightly incorporated during pre-sowing tillage under CT or direct drilling under NT. The initial plot size was 60 m2 (4 m × 15 m) and the harvested plot size was 24.2 m2 (2.2 m × 11 m).
2.3. Meteorological Conditions
Meteorological conditions (average of daily air temperature and average amount of precipitation) differed every year during the study period (2021–2023) (Figure 3 and Figure 4).
The year 2021 was the warmest during the study period. Warm weather prevailed, without large temperature differences. In April, the average air temperature was similar to the long-term average, except in the second decade, when the average air temperature exceeded the long-term average and was 4 °C higher. Hot weather prevailed in June and July. The highest temperature (24.3 °C) was fixed in the second decade of July (6.3 °C more than the long-term average). During April and May 2022, the weather was moderately warm, the average daily temperature of the month was close to the long-term average and reached 12.3 °C. The weather warmed up in the first decade of June, the average daily temperature was 15.9 °C, but in the second decade the average daily temperature decreased, and it was more than 4 °C lower. Warm weather prevailed in July and August, with average temperatures of 17.8 and 20.7 °C, respectively. The temperature during the second and third decade of August was higher than the long-term average temperature. The average daily temperature in September was similar to the long-term average temperature value and reached 10.6 °C. In 2023, the months of April and May were warm, the average daily temperature was close to the long-term average. After the last ten days of May, the weather cooled a little bit from 15.4 °C to 14.6 °C. But in the next two decades of June, temperature increased slightly and was higher than the long-term average by 2–5 °C. July and August were warm enough. The temperature did not change much, but in August it was slightly higher than the long-term average—19.8 °C (long-term average—16.9 °C).
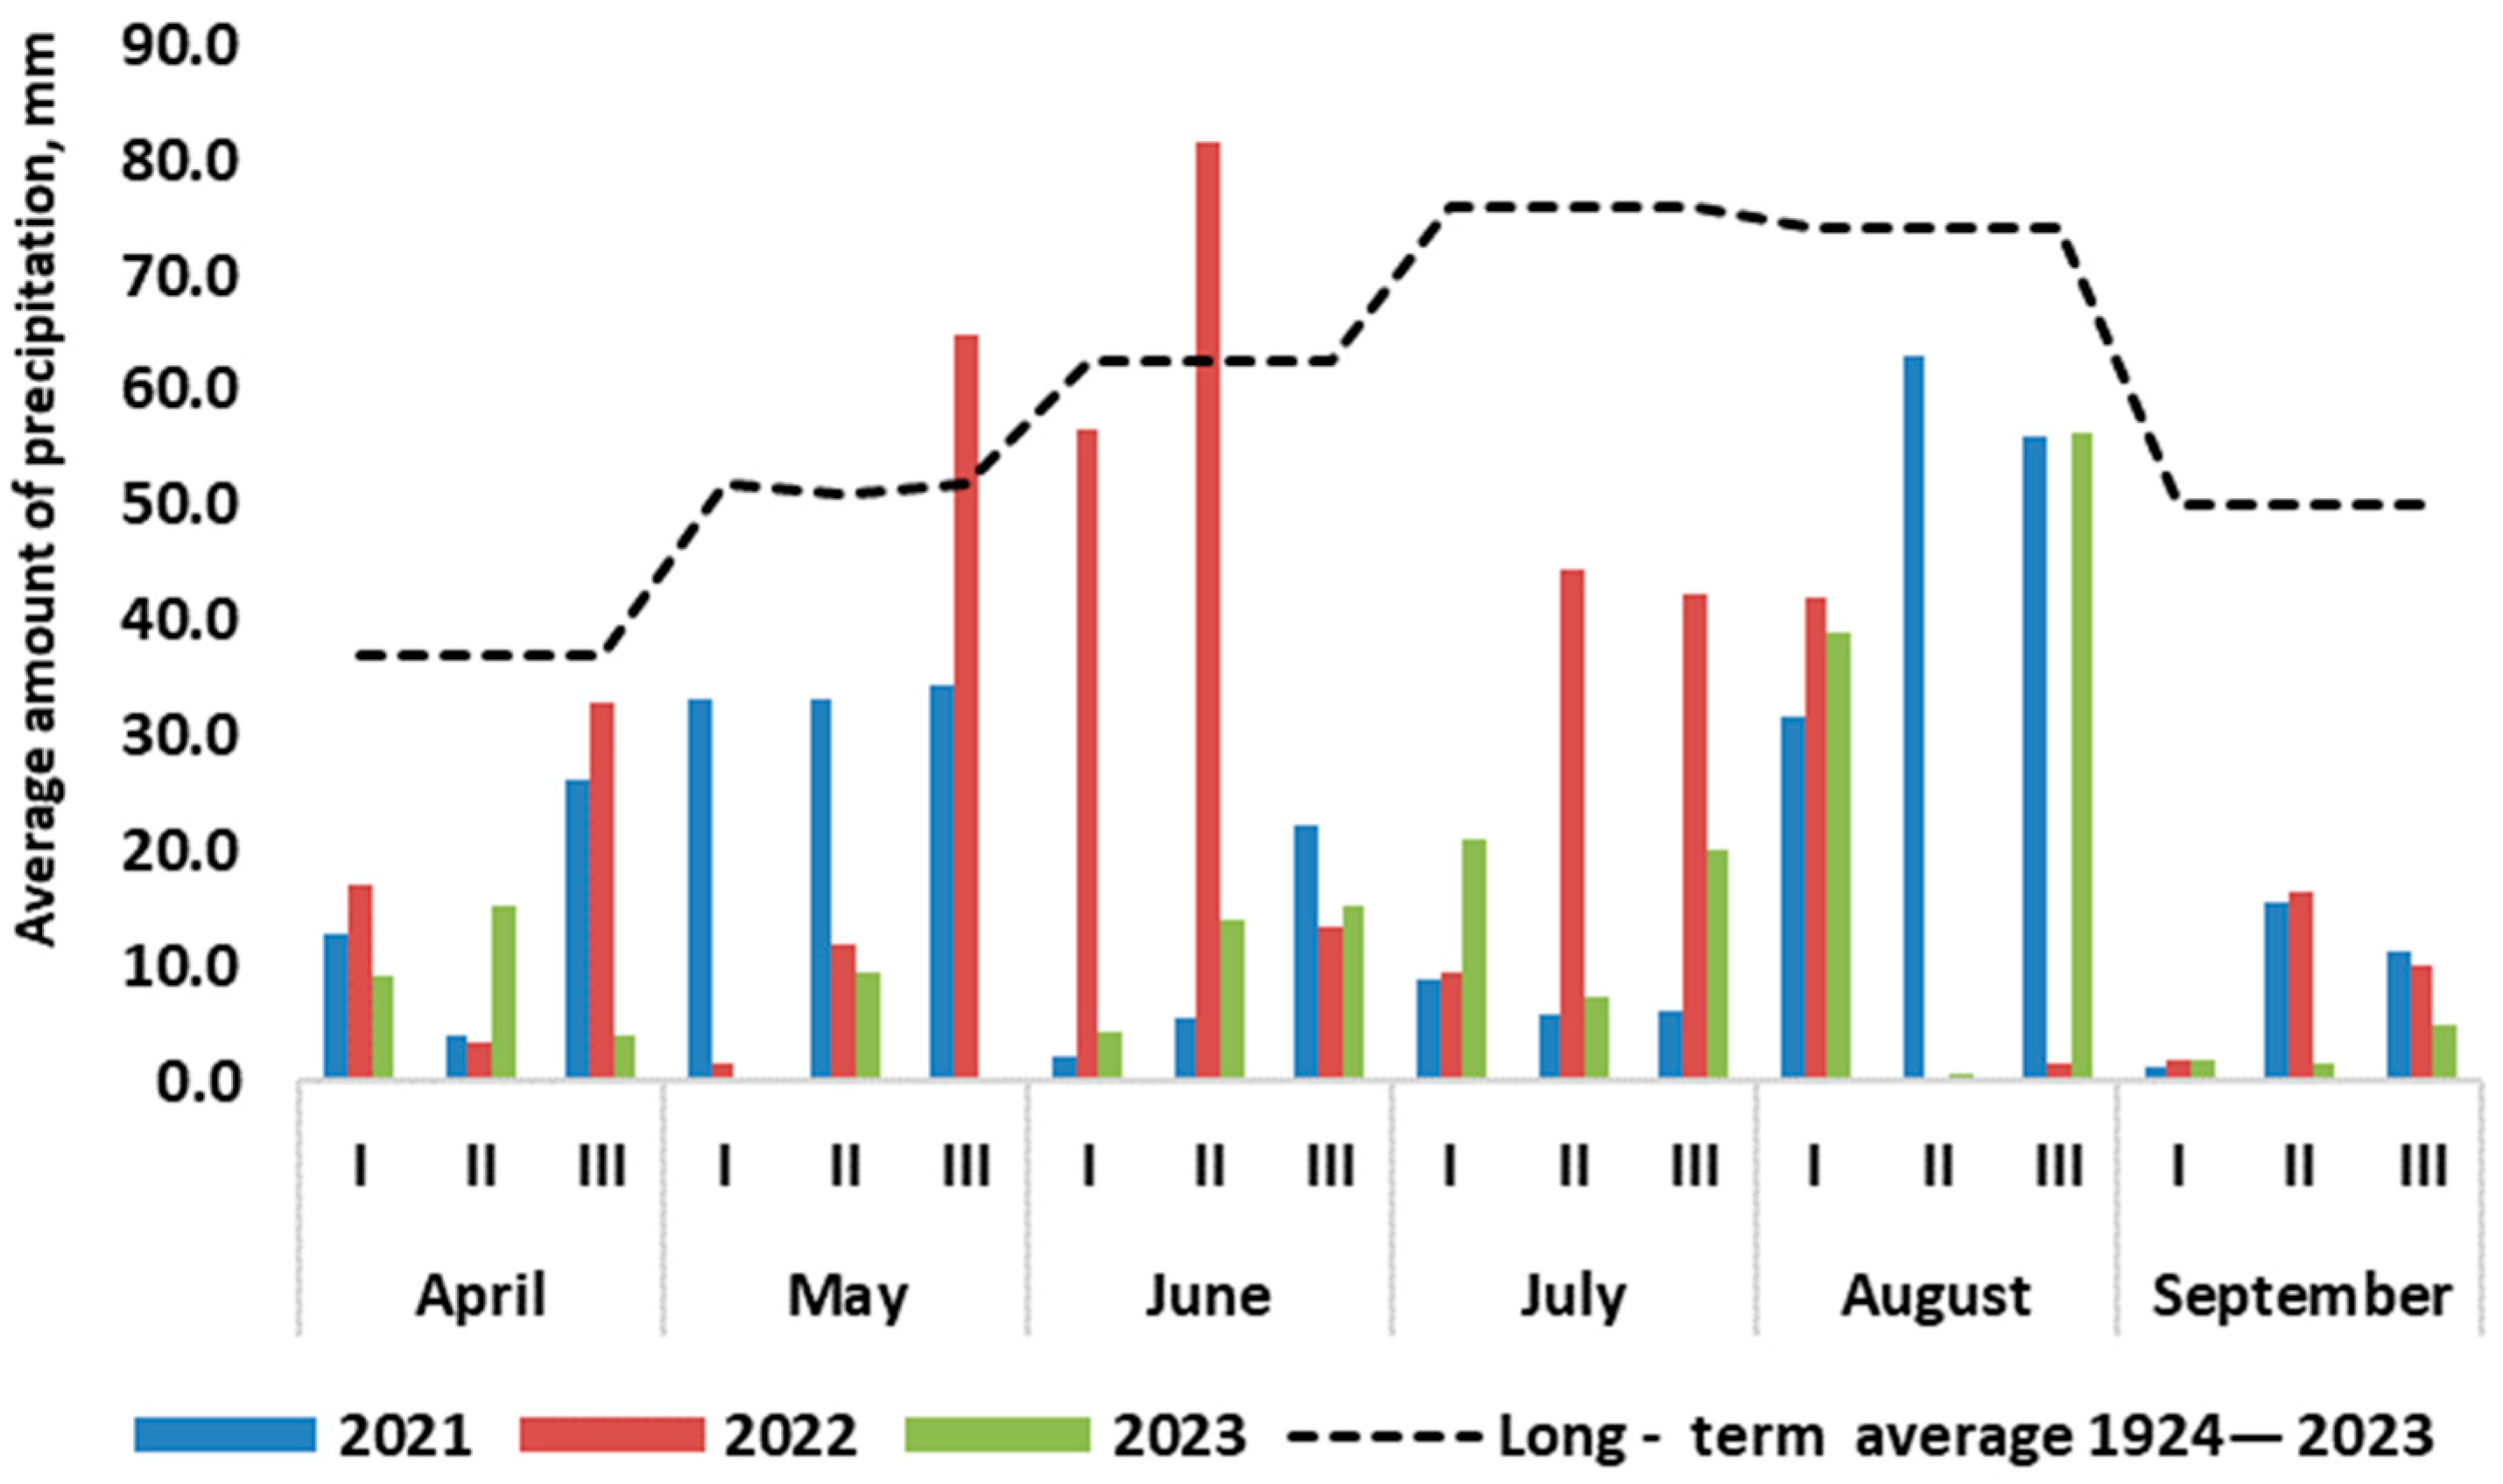
During the study year, the average amount of precipitation was very uneven (Figure 4). The year 2021 was quite dry in terms of precipitation. The amount of precipitation during all year periods did not exceed the long-term average. The driest periods were fixed during June–July and September. The amount of precipitation varied from 2.4 mm to 6.1 mm. The largest part of precipitation fell during the second and third decades of August. The amount of precipitation in April 2022 was only 53.6 mm (long-term average—41.3 mm). The beginning of May was very dry. The amount of precipitation falling during the first and second decades was 1.7 and 11.9 mm, respectively. In the third decade, the largest part of precipitation of this month fell (64.9 mm) and it was a little bit higher than the long-term average (61.7 mm). In June, the amount of precipitation was 151.5 mm and the largest part fell during the first two decades. July and August were dry and the amount of precipitation falling during these months was approximately twice as low compared to the long-term average.
The year 2023 was characterized as a very dry year. In total, 28.7 mm of precipitation fell in April, which was 12.6 mm less than the long-term average. A similar situation was observed in the next three years (May–July) when the amount of precipitation was 2–3 times lower compared to the long-term average. The amount of precipitation in August’s first decade was 39.0 mm. The second decade of August was characterized by a very small amount of precipitation (0.8 mm) (long-term average—88.0). The third decade of August was characterized by a higher amount of precipitation (56.4 mm).
2.4. Soil Analysis and Soil Net Carbon Dioxide (CO2) Exchange Rate Sampling
In the years 2021–2023, soil samples from 0–10 cm and 10–20 cm layers were taken to determine the basic chemical characteristics. Soil samples were taken using a steel auger with three replicates from all study treatments (including different crop rotations and tillage systems). Samples were air-dried and sieved through a 2 mm sieve. Measurements of soil pHKCl, plant-available phosphorus (P2O5) potassium (K2O) and humus content were performed. For investigating the chemical properties of the soil, the following methodologies were used: soil acidity was measured in 1M KCL plant-available phosphorus (P2O5) and potassium (K2O)—Egner–Riehm–Domingo (A-L) method, humus content was was determined by photometric procedure at the wavelength of 590 nm using the UV–VIS spectrophotometer Cary 50 (Varian). Humus content was recalculated to the organic carbon content using the coefficient 0.579 [25].
Soil net CO2 exchange rate: Soil net CO2 exchange rate (NCER) was measured using a closed chamber method. Soil CO2 emission (µmol m2 s−1) was determined in a 0–10 cm soil layer with a portable analyzer Li-Cor 6400-09 (ADC Bioscientific Ltd., Hoddesdon, UK). In each record plot, rings 20 cm in diameter were installed in the soil, and three measurements were made in each plot (Figure 5). CO2 flux was recorded in the data logger in about 2 min when no noticeable changes in CO2 respiration were registered. To avoid the effects of the time of the respiration measurement on soil temperature, we analyzed the whole time series in order to infer the temperature dependence of respiration, or at least to standardize the time at which soil respiration is measured. The NCER measurements were carried out at the same time of the day (from 10 a.m. to 5 p.m.) four times per growing season in 2021–2023. For every treatment, three replications of the CO2 emission measurements were performed in fixed locations in a field.
Soil surface moisture content and temperature measurements: Soil temperature and soil volumetric water content were measured at the 5 cm depth using a portable HHable HH2 WET sensor (Delta-T Devices Ltd., Cambridge, UK) at the same time in a fixed location in a field together with NCER measurements.
2.5. Statistical Analysis
Two-way analysis of variance (ANOVA) was used to statistically analyze the data using statistical software package SAS 7.1. The means were compared using Duncan’s multiple range tests at the probability level of p < 0.05. To investigate potential relationships between various characteristics, the Pearson correlation coefficient was employed. p-values of less than 0.05 were used to determine the statistical significance of differences.
3. Results and Discussion
3.1. Effect of Tillage and Cropping Systems on Soil Chemical Properties
As key elements of agricultural management, tillage and cropping systems have an indirect effect on crop productivity through effects on physical, chemical, and biological soil properties [26,27]. It has been observed that appropriate crop cultivation in cropping systems significantly contributes to the maintenance and enhancement of soil health, soil nutrients and organic matter [28]. Monocropping systems show the potential to accelerate land degradation by increasing erosion and depleting soil organic matter due to the bare soil surface [20]. Broader crop rotation as well as intercropping hold great interest for their effects on soil properties; for instance, legumes, being high in protein, release nutrients faster, while cereals and grasses release nutrients more slowly but produce more stable soil organic matter [29]. Therefore, in order to select and apply suitable management methods, it is crucial to understand how different tillage and cropping systems interact in combination to influence the chemical characteristics of the soil.
The research results indicated that the cropping systems significantly affected the amount of nutrients (plant—available phosphorus (P2O5) and potassium (K2O)) in the soil, but no significant effect was registered on pH and organic carbon changes (Table 1). These results are consistent with the data published by Salahin et al. [30] and Alam et al. [31]. On the contrary, mobile P2O5 changes only were significantly affected by tillage-cropping systems interaction.
Despite the type of tillage having no effect on main nutrient accumulation, a tendency for higher nutrient concentration was observed under NT treatments compared to CT. These data are in line with Mrabet et al.’s [32] published findings. It was observed that the main nutrients needed for plant growth and development are provided at a higher amount in the NT systems than in CT, due to crop residue deposition on the surface and occluded element mineralization. Also, the amount of main nutrients appeared to be dependent on cropping systems. In our study, the highest amount of plant-available phosphorus (256 mg kg−1) was determined under the WW-CC + SW + WW-CC cropping system, and it was 41 mg kg −1 higher compared with that at the beginning of the experiment. This increase in nutrients could be explained by deeper plant root distribution and producing more biomass compared with other crops [33]. In our trial, the lowest amount of plant-available phosphorus and potassium was registered in the cropping system WR + SW-WW (153 mg kg−1 and 129 mg kg−1, respectively), clearly showing that monoculture cultivation can worsen not only the availability of nutrients for plants but also impoverish the soil.
The adoption of reduced NT practices and the cultivation of crops with high potential for contributing to carbon biomass are further prerequisites for soil organic carbon (SOC) accumulation. Increases in SOC may depend on the type of crop and cropping system [34]. In our experiment, the tendency of SOC increase was observed applying NT, compared to the data that was determined at the start of the experiment. During this period, in NT treatments, the amount of SOC increased by 0.6 g kg−1, while no significant difference was registered compared to CT. Practices such as NT reduce residue incorporation and aggregate degradation may conserve and/or maintain concentrations of organic carbon. CC growing tended slightly to decrease the amount of SOC. It is in alignment with Koga and Tsuji’s [35] observations that NT-based long-term management inhibited soils from accumulating SOC, and NT combined with the application of CC caused negative rates of SOC accumulation during the first growing years. Our data confirms the statements of Vicente et al. [36], who found that in the first years of CC growing, the crops induced an increase in non-protected SOC fraction, which could be easily decomposed by microorganisms. According to other reports, the effect of CC on SOC could be seen after 4–5 years [37,38,39]. So, further observation of the effects of tillage systems, CC species and cropping systems diversification on SOC accumulation in soil is desirable.
3.2. The Dynamic of Soil Net CO2 Exchange Rate (NCER) under Different Tillage and Cropping Systems
Soil net carbon dioxide (CO2) exchange rate (NCER) is a physical process that is primarily driven by the diffusion gradient of CO2 concentration between the upper soil layers and the atmosphere. Emissions of carbon dioxide are highly variable. Numerous studies have demonstrated that soil NCER is influenced by several variables, including soil structure, temperature, humidity, pH, and the amount of carbon and nitrogen in the soil [40].
The soil NCER dynamics are illustrated in Figure 6. The effect of tillage and cropping systems was unequal during all of the study years. NCER for all cropping systems followed a similar pattern in both NT and CT. The soil NCER dynamics directly and indirectly (through the interaction of other environmental factors) responded to weather conditions. The higher soil CNER rates were detected during summer periods, and this could be attributed to a higher temperature registered (Figure 3). As a result, the biological (microbial, faunal, and root) activity had enhanced. In 2021, the highest NCER (3.21–5.50 µmol m−2 s−1) occurred in June, when the air temperatures were at their highest. The lowest NCERs (0.58–0.76 µmol m−2 s−1) for CT were recorded in the middle of August, when precipitation was highest. Also, it could be influenced by the soil characteristics under CT, in which the combinations of crop rotations end up providing residues to the soil with materials at different levels of decomposition and complexity. It leads to lower soil respiration rates since these managements have a balance between output and input of carbon into the system which leads to long-term CT. It should be noted that in this year, the lowest NCERs were detected during the research period in CT. On the contrary, in the NT system, in the middle of August 2021, the highest NCERs were detected. It is likely that the high average air temperatures and a large amount of precipitation falling during this decade (63.1 mm) significantly influenced the soil NCER. Morell et al. [41] noted that air temperature was an important factor when determining soil CO2 efflux variations, especially from NT soils. Furthermore, according to numerous scientific studies, an increase in CO2 has been observed in soil under NT management systems following large precipitation events [42,43,44,45]. After an intensive precipitation event, it is predicted that this pulse can release up to 10% of the NCER due to the rapid decomposition of dead microorganisms during this time [46] and the microbes’ breakdown of organic substrates. In 2022, the highest NCERs from the soil were established at the beginning of July. This increase, especially in CT, may have resulted from the use of fertilizers, as it is proposed that fertilization activates soil CO2 emissions. Although the end of June and beginning of July were the warmest months (the average monthly air temperature was 20.9 °C), the high temperatures could exert the soil NCER. At the beginning of September, as the temperatures of the air decreased, soil NCERs also decreased. The NCER in 2023 was quite low in comparison to the earlier study years. The lowest amount of precipitation that occurred all year may have influenced this result. In this year, the NCERs from the soil were approximately 2–3 times lower than in previous years.
The results of the experiments carried out in 2021–2023 (Table 2) show that different tillage systems had a significant effect on soil NCER. Also, the dependence of NCER was determined on cropping systems but did not observe a significant effect applying a combination of tillage and cropping systems.
Our results showed that in NT treatments, the NCER was higher by 28% than in CT. This increase in NCER could be attributed to the following: (1) higher microbiological activity induced by crop residues on the soil surface and relatively greater water-filled pore space under NT [47]; (2) higher carbon inputs and better conditions for microbial decomposition resulting from soil water conservation under NT during the dry season [41]; (3) enhancement of soil respiration and mineralization processes under NT [48]; and (4) earthworms’ abundance, particularly in NT soils, it has been shown that these invertebrates actively contribute to the mineralization of soil organic matter [49]. There are contradictory opinions about the NCER under NT and CT applications. Some authors [50] found that NT produces CO2 emissions that are similar to those of CT, while others [51] found that NT produces emissions that are higher. Some other research conducted in Lithuania revealed that in loam-textured soil, the NCER in NT treatments was 54% higher than in CT [2].
Cropping systems also showed a significant effect on carbon dioxide fluxes. The NCERs were increased in this rotation where more CCs were included. The present results correspond with the findings published by Chirinda et al. [52], who found that crop rotation incorporating CC increased the NCER by 30%. According to this, it was linked to an overall rise in C inputs, as well as microbial activity and biomass. The highest NCER (2.33 µmol m−2 s−1) was determined in WW-CC + SW + WW-CC crop rotation. Similar trends have been observed elsewhere by Ferrara et al. [53], who also found an increase in NCER during the growing of wheat and CC. An increase in soil NCER in response to CC adoption could be attributed to the contribution of labile C from CC to soils, as well as greater biodiversity benefits such as improved soil structure, water flow movement, and nutrient cycling [54,55]. The lowest NCER (1.68 µmol m−2 s−1) was determined under winter and spring wheat rotation without CC, possibly because of poorer vegetative performance. This shows that the response of soil NCER to the addition of CC is probably mediated by a variety of factors, including climatic conditions, sampling period, edaphic characteristics, plant performance, and native microbial community.
The total mean NCER data (Figure 7) supported the same trends as the dynamics data (Figure 6). A significantly higher NCER was determined under NT in all cropping systems. Cropping systems also regulated soil NCER due to their different root growth patterns and nutrient acquisition mechanisms. The highest NCER was observed in WW-CC + SW + WW-CC rotation, especially in NT.
3.3. Influence of Different Tillage and Cropping Systems on Soil Surface Moisture Content and Temperature
The moisture and temperature of the soil surface are considered to be one of the main ecological factors influencing the decomposition processes of organic matter, as well as the intensity of CO2 production and emissions from the soil. Soil NCER tends to be lower in dry conditions due to poor root and microbial activity. Increased soil moisture could enhance NCER up to a certain point, but at extremely high moisture conditions soil NCER decreases due to the restriction in oxygen diffusion [56].
As seen in Figure 8, soil surface moisture content (SMC) fluctuated among studied treatments during the study period. In both study years (2022–2023), a decrease in soil moisture during the summer months (beginning of June–end of August) was observed. Higher soil temperatures in the 0–10 cm layer as compared to other dates can be primarily attributed to this tendency. Also, the higher moisture content at the beginning of the growing season could be partly explained by the soil’s initial moisture content, initial porosity, roughness of the soil surface, infiltration rate, and depressional storage brought on by tillage management techniques [57]. A significantly higher SMC content was determined under NT treatments (Table 3). While a smaller amount of disturbance in NT systems increases SMC, the large pores and low amounts of macroaggregates increase gravitational drainage and decrease SMC in CT systems [20]. Our results are congruent with the studies conducted in Lithuania, when comparatively higher SMC in NT systems was also observed [58,59]. This increase can be attributed to the effect of tillage on reducing surface runoff and evaporation, increasing infiltration, and reducing evaporation at the soil surface due to the lack of soil disturbance in NT [60]. The sharp decrease and lowest SMC values (0.8–3.6%) were detected on 21 July 2023 in all treatments. This trend could be explained by high air and soil surface temperature as well as the absence of precipitation during the whole month. Later, when the air temperature decreased and the amount of precipitation increased (during August), SMC values also increased.
Despite the fact that cropping systems had no significant effect on SMC (Table 3), it was noted that SMC was higher (by 1–3%) in these systems where CCs were included (Figure 8). This observation was supported by Joyce et al. [61], who found that cover-planted fields had better rainfall infiltration and were characterized by higher SMC than fallow fields. Furthermore, the increase in moisture in these treatments can be attributed to the reduction of the loss of moisture through evaporation and, finally, an increase in water use efficiency [62].
Tillage and cropping systems had no significant impact on soil surface temperature in our investigation (Figure 9). The dynamics of soil surface temperature did not show a discernible difference between different tillage types. The soil surface temperature ranged between 18.2 and 21.9 °C at the beginning and the end of vegetation and 23.3–29.7 °C in the middle of vegetation. A slightly higher soil surface temperature was determined in CT treatments compared to NT. Higher soil surface temperatures in CT could be decisive due to increased air circulation in the pores as a result of earlier moisture losses in CT. It is also possible to propose that in NT treatments plant coverage significantly reduces soil temperature by remaining on the soil’s surface. According to De Oliveira Silva et al. [63], tillage can alter the temperature of the soil by changing its structure. Tillage alters the soil’s bulk density, aggregate stability, and organic matter content, which has a substantial impact on the soil’s heat capacity and thermal conductivity [64]. Shen et al. [65] found that the intensity of tillage systems can lead to differences in soil temperature from 0 to 1.5 °C.
It should be noted that 2023 was much hotter than 2022 and the soil surface temperature at the start of the vegetation period (15th of May) was 7–8 °C higher compared to 2022. This could be related to higher air temperature during this month.
3.4. The Effect of Environmental Variables on Soil Net Carbon Dioxide (CO2) Exchange Rate
Soil net carbon dioxide (CO2) exchange rate (NCER) from the soil is defined as a process determined by many processes occurring in the soil and influenced by the interaction of many factors. In addition to soil temperature and moisture as the main factors influencing NCER intensity [66,67], NCER can also be influenced by changes in soil physical, chemical, and biological properties [9]. In this study, the influence of environmental variables on total soil NCER was evaluated (Table 4). As environmental parameters, the soil surface moisture content (SMC), soil surface temperature and chemical properties (pH, P2O5, K2O and organic carbon) were analyzed.
According to the literature, the main limiting factor for soil NCER is typically moisture or temperature. The soil NCER is temperature insensitive when the soil is extremely dry. The intensity of NCER is substantially more temperature sensitive as the SMC increases. In the same direction, soil NCER is not sensitive to moisture when temperature is below 5 °C, but becomes more responsive as temperatures rise [59,68]. In this study, there were significant weak positive correlations (r = 0.44; p < 0.05) between NCER from the soil and soil surface temperature and also strong negative dependence of NCER on soil moisture content (r = −0.73; p < 0.05) (Table 4).
As a result, it should be noted that effluxes were changed with mineralization ratio from moisture and temperature changes affecting soil microorganism activities. Much research reported that there is a positive correlation between NCER and soil temperature, which influences the biological activity of the soil [69,70,71,72,73,74,75]. However, it has been noted by Mariko et al. [76] and Gonzalez-Mendez et al. [77] that there is not always a linear relationship between NCER, and soil temperature and that microbial activity will only rise between specified temperatures. Our findings corroborate this statement and prior studies conducted in Lithuania’s findings that the intensity of soil NCER was not considerably affected by a temperature change from 10 to 23 °C [59]. Additionally, it might be determined that, depending on how quickly the surface cools and increases moisture content, the NCER may tend to rise or fall in response to changes in the soil’s thermal conductivity. Conversely, as demonstrated by Buragiene et al. [12], there was a positive association between soil moisture and NCER, but not between soil temperature and NCER from the soil. Thus, the content of soil moisture has a significant impact on the oxidation of nitrogen and organic carbon in the soil [78,79], which, in turn, stimulates microbial activity and raises oscillations in NCER [80].
4. Conclusions
This study investigated the effect of soil tillage and cropping systems on total soil net CO2 exchange rate (NCER) dynamics and variables that are the most affecting NCER from the soil:
- The dependence of NCER was determined on tillage and cropping systems but did not observe a significant effect applying a combination of tillage and cropping systems. A significantly higher (by 28%) NCER was determined under NT. Crop rotation also regulated soil NCER and the highest NCER was observed in WW-CC + SW+ WW-CC rotation, especially in NT.
- Cropping systems improved the content of soil nutrients, but no significant effect was registered on pH and organic carbon changes. However, these changes were not reflected in tillage. The highest amount of nutrients was determined under the WW-CC + SW + WW-CC cropping system. WW-SW-WW cropping system was located in the opposite position of availability of nutrients, indicating the ability of this kind of monoculture to impoverish the soil. This informs on the necessity of crop rotation under moderate climatic conditions.
- Comparatively higher soil moisture content was observed in NT and in these rotations where CCs were included (by 1–3%). Tillage and cropping systems had no significant impact on soil surface temperature, but a trend of higher soil surface temperatures in CT was found, which could be decisive due to increased air circulation.
- Increased NCER positively correlated with the increase in surface soil temperature (r = 0.44; p < 0.05), but negatively depended on soil surface moisture content (r = −0.73; p < 0.05).
- The results of this experiment should improve our understanding of how agricultural practices affect NCER, so it can serve as a foundation for future research concepts. However, additional research is required on soil microbiological activity to obtain the knowledge of soil respiration in relation to soil microbes–plant roots relationship within topsoil layers of contrasting tillage systems application under moderate climatic conditions.
Author Contributions
Conceptualization, A.B. and I.D.; methodology, A.B., I.D. and V.F.; software, A.B.; validation, A.B., I.D., V.F. and A.V.; formal analysis, A.B. and I.D.; investigation, A.B.; data curation, A.B.; writing—original draft preparation, A.B.; writing—review and editing, I.D., V.F. and A.V.; visualization, A.B.; supervision, I.D. All authors have read and agreed to the published version of the manuscript.
Funding
This research received no external funding.
Institutional Review Board Statement
Not applicable.
Informed Consent Statement
Not applicable.
Data Availability Statement
The data used to support the findings of this study are available from the corresponding authors upon request.
Conflicts of Interest
The authors declare no conflicts of interest.
References
- IPCC. Climate Change 2021: The Physical Science Basis. Contribution of Working Group I to the Sixth Assessment Report of the Intergovernmental Panel on Climate Change; Cambridge University Press: Cambridge, UK, 2021. [Google Scholar]
- Feizienė, D.; Feiza, V.; Karklins, A.; Veršulienė, A.; Janušauskaitė, D.; Antanaitis, Š. After-effects of long-term tillage and residue management on topsoil state in Boreal conditions. Eur. J. Agron. 2018, 94, 12–24. [Google Scholar] [CrossRef]
- Hossain, M.E.; Islam, M.S.; Sujan, M.H.K.; Tuhin, M.M.U.J.; Bekun, F.V. Towards a clean production by exploring the nexus between agricultural ecosystem and environmental degradation using novel dynamic ARDL simulations approach. Environ. Sci. Pollut. Res. 2022, 29, 53768–53784. [Google Scholar] [CrossRef]
- Mohammed, S.; Mirzaei, M.; Pappné Törő, Á.; Gorji Anari, M.; Moghiseh, E.; Asadi, H.; Szabó, S.; Kakuszi-Széles, A.; Harsányi, E. Soil carbon dioxide emissions from maize (Zea mays L.) fields as influenced by tillage management and climate. Irrig. and Drain. 2022, 71, 228–240. [Google Scholar] [CrossRef]
- Chen, Z.; An, C.; Fang, H.; Zhang, Y.; Zhou, Z.; Zhou, Y.; Zhao, S. Assessment of regional greenhouse gas emission from beef cattle production: A case study of Saskatchewan in Canada. J. Environ. Manag. 2020, 264, 110443. [Google Scholar] [CrossRef] [PubMed]
- Bond-Lamberty, B.; Thomson, A. Temperature-associated increases in the global soil respiration record. Nature 2010, 464, 579–582. [Google Scholar] [CrossRef] [PubMed]
- Oertel, C.; Matschullat, J.; Zurba, K.; Zimmermann, F.; Erasmi, S. Greenhouse gas emissions from soils—A review. Chem. Erde-Geochem. 2016, 76, 327–352. [Google Scholar] [CrossRef]
- Pries, C.E.H.; Castanha, C.; Porras, R.C.; Torn, M.S. The whole-soil carbon flux in response to warming. Science 2017, 355, 1420–1423. [Google Scholar] [CrossRef] [PubMed]
- Haddaway, N.R.; Hedlund, K.; Jackson, L.E.; Katterer, T.; Lugato, E.; Thomsen, I.K.; Jorgensen, H.B.; Isberg, P.E. How does tillage intensity affect soil organic carbon? A systematic review. Environ. Evid. 2017, 5, 30. [Google Scholar] [CrossRef]
- Silva, W.M.d.; Bianchini, A.; Amorim, R.S.S.; Couto, E.G.; Weber, O.L.d.S.; Hoshide, A.K.; Pereira, P.S.X.; Cremon, C.; Abreu, D.C.d. Soil Efflux of Carbon Dioxide in Brazilian Cerrado Wheat (Triticum aestivum L.) under Variable Soil Preparation and Irrigation. Agriculture 2022, 12, 163. [Google Scholar] [CrossRef]
- Das, S.; Chatterjee, S.; Rajbanshi, J. Responses of soil organic carbon to conservation practices including climate-smart agriculture in tropical and subtropical regions: A meta-analysis. Sci. Total Environ. 2022, 805, 150428. [Google Scholar] [CrossRef] [PubMed]
- Buragiene, S.; Sarauskis, E.; Romaneckas, K.; Adamaviciene, A.; Kriauciuniene, Z.; Avizienyte, D.; Marozas, V.; Naujokienė, V. Relationship between CO2 emissions and soil properties of differently tilled soils. Sci. Total Environ. 2019, 662, 786–795. [Google Scholar] [CrossRef] [PubMed]
- Egan, G.; Crawley, M.J.; Fornara, D.A. Effects of long-term grassland management on the carbon and nitrogen pools of different soil aggregate fractions. Sci. Total Environ. 2018, 613–614, 810–819. [Google Scholar] [CrossRef] [PubMed]
- Du, K.; Li, F.; Qiao, Y.; Leng, P.; Li, Z.; Ge, J. Influence of no-tillage and precipitation pulse on continuous soil respiration of summer maize affected by soil water in the North China Plain. Sci. Total Environ. 2021, 766, 144384. [Google Scholar] [CrossRef] [PubMed]
- Zhang, X.; Xin, X.; Yang, W.; Ding, S.; Ren, G.; Li, M. Soil respiration and net carbon flux response to long-term reduced/no-tillage with and without residues in a wheat-maize cropping system. Soil Tillage Res. 2021, 214, 105182. [Google Scholar] [CrossRef]
- Nyambo, P.; Cornelius, C.; Araya, T. Carbon dioxide fluxes and carbon stocks under conservation agricultural practices in South Africa. Agriculture 2020, 10, 374. [Google Scholar] [CrossRef]
- Bilandžija, D.; Zgorelec, Ž.; Kisić, I. Influence of tillage practices and crop type on soil CO2 emissions. Sustainability 2016, 8, 90. [Google Scholar] [CrossRef]
- Cooper, H.V.; Sjogersten, S.; Lark, R.M.; Mooney, S.J. To till or not to till in a temperate ecosystem? Implications for climate change mitigation. Environ. Res. Lett. 2021, 16, 9326. [Google Scholar] [CrossRef]
- Chahal, I.; Hooker, D.C.; Deen, B.; Janovicek, K.; Van Eerd, L.L. Long-term effects of crop rotation, tillage, and fertilizer nitrogen on soil health indicators and crop productivity in a temperate climate. Soil Tillage Res. 2021, 213, 105121. [Google Scholar] [CrossRef]
- Morugán-Coronado, A.; Linares, C.; Gómez-López, M.D.; Faz, Á.; Zornoza, R. The impact of intercropping, tillage and fertilizer type on soil and crop yield in fruit orchards under Mediterranean conditions: A meta-analysis of field studies. Agric. Syst. 2020, 178, 102736. [Google Scholar] [CrossRef]
- Sanz-Cobena, A.; García-Marco, S.; Quemada, M.; Gabriel, J.; Almendros, P.; Vallejo, A. Do cover crops enhance N2O, CO2 or CH4 emissions from soil in Mediterranean arable systems? Sci. Total Environ. 2014, 466, 164–174. [Google Scholar] [CrossRef] [PubMed]
- Skinner, C.; Gattinger, A.; Krauss, M.; Krause, H.M.; Mayer, J.; van der Heijden, M.G.; Mader, P. The impact of long-term organic farming on soil-derived greenhouse gas emissions. Sci. Rep. 2019, 9, 1702. [Google Scholar] [CrossRef] [PubMed]
- Youngerman, C.Z.; DiTommaso, A.; Curran, W.S.; Mirsky, S.B.; Ryan, M.R. Corn density effect on interseeded cover crops, weeds, and grain yield. Org. Agric. Agroecol. 2018, 110, 2478–2487. [Google Scholar] [CrossRef]
- IUSS Working Group WRB. World Reference Base for Soil Resources 2014, Update International Soil Classification System for Naming Soils and Creating Legends for Soil Maps; World Soil Resources Reports No. 106; FAO: Rome, Italy, 2015. [Google Scholar]
- Staugaitis, G.; Masevičienė, A.; Žičkienė, L. Dirvožemio Organinės Anglies (Humuso) Tyrimai Žemės ūkio Naudmenose. Rekomendacijos; Lietuvos Agrarinių ir Miškų Mokslų Centras: Kaunas, Lithuania, 2022; 32p, ISBN 978-609-451-006-9. [Google Scholar]
- Malobane, M.E.; Nciizah, A.D.; Mudau, F.N.; Wakindiki, I.I.C. Tillage, crop rotation and crop residue management effects on nutrient availability in a sweet sorghum-based cropping system in marginal soils of south Africa. Agronomy 2020, 10, 776. [Google Scholar] [CrossRef]
- Desoky, E.S.M.; Mansour, E.; El-Sobky, E.S.E.A.; Abdul-Hamid, M.I.; Taha, T.F.; Elakkad, H.A.; Arnaout, S.M.A.I.; Eid, R.S.M.; El-Tarabily, K.A.; Yasin, M.A.T. Physio-biochemical and agronomic responses of faba beans to exogenously applied nano-silicon under drought stress conditions. Front. Plant Sci. 2021, 12, 637783. [Google Scholar] [CrossRef] [PubMed]
- Tesfahunegn, G.B.; Gebru, T.A. Variation in soil properties under different cropping and other land-use systems in dura catchment, northern Ethiopia. PLoS ONE 2020, 15, 0222476. [Google Scholar] [CrossRef] [PubMed]
- Desoky, E.S.M.; Mansour, E.; Yasin, M.A.T.; El-Sobky, E.S.E.A.; Rady, M.M. Improvement of drought tolerance in five different cultivars of Vicia faba with foliar application of ascorbic acid or silicon. Span. J. Agric. Res. 2020, 18, 0802. [Google Scholar] [CrossRef]
- Salahin, N.; Alam, M.K.; Shil, N.C.; Mondol, A.T.M.A.I.; Alam, M.J.; Kobeasy, M.I.; Ahmed, S. Interactive effects of tillage systems and nitrogen fertilizer rates on the performance of mustard-Boroaman rice cropping systems under conservation agriculture practices. Agronomy 2022, 12, 1671. [Google Scholar] [CrossRef]
- Alam, M.K.; Bell, R.W.; Hasanuzzaman, M.; Salahin, N.; Rashid, M.H.; Akter, N.; Khatun, M.F. Rice (Oryza sativa L.) establishment techniques and their implications for soil properties, global warming potential mitigation and crop yields. Agronomy 2020, 10, 888. [Google Scholar] [CrossRef]
- Mrabet, R. No-Tillage farming: Renewing harmony between soils and crops in semiarid Morocco. In Proceedings of the Third International Conference on Land Degradation (ICLD3) and Meeting of the IUSS Subcommission C–Soil and Water Conservation, Rio de Janeiro, Brazil, 17–21 September 2001; pp. 17–21. [Google Scholar]
- Amsili, J.P.; Kaye, J.P. Root traits of cover crops and carbon inputs in an organic grain rotation. Renew. Agric. Food Syst. 2021, 36, 182–191. [Google Scholar] [CrossRef]
- Mäkelä, P.S.A.; Tuulos, A.; Turakainen, M.; Santanen, A.; Stoddard, F.L. Revitalizing the winter turnip rape crop in the northern latitudes. Acta Agric. Scand. B Soil Plant Sci. 2011, 61, 195–201. [Google Scholar] [CrossRef]
- Koga, N.; Tsuji, H. Effects of reduced tillage, crop residue management and manure application practices on crop yields and soil carbon sequestration on an Andisol in northern Japan. Soil Sci. Plant Nutr. 2009, 55, 546–557. [Google Scholar] [CrossRef]
- Vicente-Vicente, J.L.; Gomez-Munoz, B.; Hinojosa-Centeno, M.B.; Smith, P.; GarciaRuiz, R. Carbon saturation and assessment of soil organic carbon fractions in Mediterranean rainfed olive orchards under plant cover management. Agric. Ecosyst. Environ. 2017, 245, 135–146. [Google Scholar] [CrossRef]
- Tiemann, L.; Grandy, A.; Atkinson, E.; Marin-Spiotta, E.; McDaniel, M. Crop rotational diversity enhances belowground communities and functions in an agroecosystem. Ecol. Lett. 2015, 18, 761–771. [Google Scholar] [CrossRef] [PubMed]
- Gomez, J.A. Sustainability using cover crops in Mediterranean tree crops, olives, and vines—Challenges and current knowledge. Hung. Geogr. Bull. 2017, 66, 13–28. [Google Scholar] [CrossRef]
- Jian, J.; Du, X.; Reiter, M.S.; Stewart, R.D. A meta-analysis of global cropland soil carbon changes due to cover cropping. Soil Biol. Biochem. 2020, 143, 107735. [Google Scholar] [CrossRef]
- Ball, B.C. Soil structure and greenhouse gas emissions: A synthesis of 20 years of experimentation. Eur. J. Soil Sci. 2013, 64, 357–373. [Google Scholar] [CrossRef]
- Morell, F.J.; Cantero-Martínez, C.; Lampurlanés, J.; Plaza-Bonilla, D.; Alvaro-Fuentes, J. Soil Carbon Dioxide Flux and Organic Carbon Content: Effects of Tillage and Nitrogen Fertilization. Soil Sci. Soc. Am. J. 2011, 75, 1874–1884. [Google Scholar] [CrossRef]
- Chavez, L.F.; Amado, T.J.C.; Bayer, C.; La Scala, N.; Escobar, L.F.; Fiorin, J.E.; Campos, B.H.C.D. Carbon dioxide efflux in a rhodic hapludox as affected by tillage systems in southern Brazil. Rev. Bras. Ciênc. Solo 2009, 33, 325–334. [Google Scholar] [CrossRef]
- Panosso, A.R.; Marques Júnior, J.; Pereira, G.T.; La Scala, N. Spatial and temporal variability of soil CO2 emission in a sugarcane area under green and slash-and-burn managements. Soil Tillage Res. 2009, 105, 275–282. [Google Scholar] [CrossRef]
- Koncz, P.; Balogh, J.; Papp, M.; Hidy, D.; Pintér, K.; Fóti, S.; Klumpp, K.; Nagy, Z. Higher soil respiration under mowing than under grazing explained by biomass differences. Nutr. Cycl. Agroecosyst. 2015, 103, 201–215. [Google Scholar] [CrossRef]
- Rigon, J.P.G.; Calonego, J.C.; Rosolem, C.A.; La Scala, N., Jr. Cover crop rotations in no-till system: Short-term CO2 emissions and soybean yield. Sci. Agric. 2018, 77, 18–26. [Google Scholar] [CrossRef]
- Blazewicz, S.J.; Schwartz, E.; Firestone, M.K. Growth and death of bacteria and fungi underlie rainfall-induced carbon dioxide pulses from seasonally dried soil. Ecology 2014, 95, 1162–1172. [Google Scholar] [CrossRef] [PubMed]
- Liu, X.J.; Mosier, A.R.; Halvorson, A.D.; Zhang, F.S. The Impact of Nitrogen Placement and Tillage on NO, N2O, CH4 and CO2 Fluxes from a Clay Loam Soil. Plant Soil 2006, 280, 177–188. [Google Scholar] [CrossRef]
- Plaza-Bonilla, D.; Cantero-Martínez, C.; Bareche, J.; Arrúe, J.L.; Alvaro-Fuentes, J. Soil carbon dioxide and methane fluxes as affected by tillage and N fertilization in dryland conditions. Plant Soil 2014, 381, 111–130. [Google Scholar] [CrossRef]
- Sheehy, J.; Nuutinen, V.; Six, J.; Palojearvi, A.; Knuutila, O.; Kaseva, J.; Regina, K. Earthworm Lumbricus terrestris mediated redistribution of C and N into large macroaggregate-occluded soil fractions in fine-textured no-till soils. Appl. Soil Ecol. 2019, 140, 26e34. [Google Scholar] [CrossRef]
- Adjuik, T.A.; Davis, S.C. Machine Learning Approach to Simulate Soil CO2 Fluxes under Cropping Systems. Agronomy 2022, 12, 197. [Google Scholar] [CrossRef]
- Vinten, A.J.A.; Ball, B.C.; O’sullivan, M.F.; Henshall, J.K. The effects of cultivation method, fertilizer input and previous sward type on organic C and N storage and gaseous losses under spring and winter barley following long-term leys. J. Agric. Sci. 2002, 139, 231–243. [Google Scholar] [CrossRef]
- Chirinda, N.; Olesen, J.E.; Porter, J.R.; Schjønning, P. Soil properties, crop production and greenhouse gas emissions from organic and inorganic fertilizer-based arable cropping systems. Agric. Ecosyst. Environ. 2010, 139, 584–594. [Google Scholar] [CrossRef]
- Ferrara, R.M.; Campi, P.; Muschitiello, C.; Leogrande, R.; Vittorio Vonella, A.; Ventrella, D.; Rana, G. Soil respiration during three cropping cycles of durum wheat under different tillage conditions in a Mediterranean environment. Soil Use Manag. 2022, 38, 1547–1563. [Google Scholar] [CrossRef]
- Finney, D.M.; Murrell, E.G.; White, C.M.; Baraibar, B.; Barbercheck, M.E.; Bradley, B.A. Ecosystem services and disservices are bundled in simple and diverse cover cropping systems. Agric. Environ. Lett. 2017, 2, 170033. [Google Scholar] [CrossRef]
- Wortman, S.E.; Francis, C.A.; Bernards, M.L.; Drijber, R.A.; Lindquist, J.L. Optimizing cover crop benefits with diverse mixtures and an alternative termination method. Agron. J. 2012, 104, 1425–1435. [Google Scholar] [CrossRef]
- Lal, R. Soil organic matter and water retention. Agron. J. 2020, 112, 3265–3277. [Google Scholar] [CrossRef]
- Jacobs, A.A.; Evans, R.S.; Allison, J.K.; Garner, E.R.; Kingery, W.L.; McCulley, R.L. Cover crops and no-tillage reduce crop production costs and soil loss, compensating for lack of short-term soil quality improvement in a maize and soybean production system. Soil. Tillage Res. 2022, 218, 105310. [Google Scholar] [CrossRef]
- Feiza, V.; Feizienė, D.; Sinkevičienė, A.; Bogužas, V.; Putramentaitė, A.; Lazauskas, S.; Deveikytė, I.; Seibutis, V.; Steponavičienė, V.; Pranaitienė, S. Soil water capacity, pore-size distribution and CO2 e-flux in different soils after long-term no-till management. Zemdirbyste 2015, 102, 3–14. [Google Scholar] [CrossRef]
- Feizienė, D.; Kadžienė, G. The influence of soil organic carbon, moisture and temperature on soil surface CO2 emission in the 10th year of different tillage-fertilization management. Zemdirbyste 2008, 95, 29–45. [Google Scholar]
- Sithole, N.J.; Magwaza, L.S.; Thibaud, G.R. Long-term impact of no-till conservation agriculture and N-fertilizer on soil aggregate stability, infiltration, and distribution of C in different size fractions. Soil Tillage Res. 2019, 190, 147–156. [Google Scholar] [CrossRef]
- Joyce, B.A.; Wallender, W.W.; Mitchell, J.P.; Huyck, L.M.; Temple, S.R.; Brostrom, P.N.; Hsiao, T.C. Infiltration and soil water storage under winter cover cropping in California’s Sacramento Valley. Trans. ASABE 2002, 45, 315–326. [Google Scholar] [CrossRef]
- Koudahe, K.; Allen, S.C.; Djaman, K. Critical review of the impact of cover crops on soil properties. Int. Soil Water Conserv. Res. 2022, 10, 343–354. [Google Scholar] [CrossRef]
- De Oliveira Silva, B.; Moitinho, M.R.; de Araujo Santos, G.A.; Teixeira, D.D.B.; Fernandes, C.; La Scala, N., Jr. Soil CO2 emission and short-term soil pore class distribution after tillage operations. Soil Tillage Res. 2019, 186, 224–232. [Google Scholar] [CrossRef]
- Van Wie, J.B.; Adam, J.C.; Ullman, J.L. Conservation tillage in dryland agriculture impacts watershed hydrology. J. Hydrol. 2013, 483, 26–38. [Google Scholar] [CrossRef]
- Shen, Y.; McLaughlin, N.; Zhang, X.; Xu, M.; Liang, A. Effect of tillage and crop residue on soil temperature following planting for a Black soil in Northeast China. Sci. Rep. 2018, 8, 4500. [Google Scholar] [CrossRef] [PubMed]
- Evans, S.E.; Burke, I.C. Carbon and nitrogen decoupling under an 11-year drought in the shortgrass steppe. Ecosystems 2013, 16, 20–33. [Google Scholar] [CrossRef]
- Hou, H.; Han, Z.; Yang, Y.; Abudu, S.; Cai, H.; Li, Z. Soil CO2 emissions from summer maize fields under deficit irrigation. Environ. Sci. Pollut. Res. 2020, 27, 4442–4449. [Google Scholar] [CrossRef] [PubMed]
- Akbolat, D.; Barut, Z.; Turgut, M.M.; Celik, I. Soil CO2 emissions under conventional and conservational tillage methods in soybean cultivation in Cukurova Plain of Turkey. Agron. Ser. 2016, 59, 15–20. [Google Scholar]
- Sainju, U.M.; Jabro, J.D.; Stevens, W.B. Soil carbon dioxide emission and carbon content as affected by irrigation, tillage, cropping system, and nitrogen fertilization. J. Environ. Qual. 2008, 37, 98–106. [Google Scholar] [CrossRef] [PubMed]
- Rey, A.; Pegoraro, E.; Oyonarte, C.; Were, A.; Escribano, P.; Raimundo, J. Impact of land degradation on soil respiration in a steppe (Stipa tenacissima L.) semi-arid ecosystem in the SE of Spain. Soil Biol. Biochem. 2011, 43, 393–403. [Google Scholar] [CrossRef]
- Nosalewicz, M.; Stepniewska, Z.; Nosalewicz, A. Effect of soil moisture and temperature on N2O and CO2 concentrations in soil irrigated with purified wastewater. Int. Agrophysics 2013, 27, 299–304. [Google Scholar] [CrossRef]
- Chen, H.; Hou, H.; Wang, X.; Zhu, Y.; Saddique, Q.; Wang, Y.; Cai, H. The effects of aeration and irrigation regimes on soil CO2 and N2O emissions in a greenhouse tomato production system. J. Integr. Agric. 2018, 17, 449–460. [Google Scholar] [CrossRef]
- Du, Y.; Gu, X.; Wang, J.; Niu, W. Yield and gas exchange of greenhouse tomato at different nitrogen levels under aerated irrigation. Sci. Total Environ. 2019, 668, 1156–1164. [Google Scholar] [CrossRef] [PubMed]
- Zhao, P.; Pumpanen, J.; Kang, S. Spatio-temporal variability and controls of soil respiration in a furrow-irrigated vineyard. Soil Tillage Res. 2020, 196, 104424. [Google Scholar] [CrossRef]
- Yerli, C.; Sahin, U. An assessment of the urban water footprint and blue water scarcity: A case study for Van (Turkey). Braz. J. Biol. 2022, 82, 249745. [Google Scholar] [CrossRef] [PubMed]
- Mariko, S.; Urano, T.; Asanuma, J. Effects of irrigation on CO2 and CH4 fluxes from Mongolian steppe soil. J. Hydrol. 2007, 333, 118–123. [Google Scholar] [CrossRef]
- Gonzalez-Mendez, B.; Webster, R.; Fiedler, S.; Loza-Reyes, E.; Hernandez, J.M.; Ruiz-Suarez, L.G.; Siebe, C. Short-term emissions of CO2 and N2O in response to periodic flood irrigation with wastewater in the Mezquital Valley of Mexico. Atmos. Environ. 2015, 101, 116–124. [Google Scholar] [CrossRef]
- Morugan-Coronado, A.; García-Orenes, F.; Mataix-Solera, J.; Arcenegui, V.; Mataix- Beneyto, J. Short-term effects of treated wastewater irrigation on Mediterranean calcareous soil. Soil Tillage Res. 2011, 112, 18–26. [Google Scholar] [CrossRef]
- Shi, A.D.; Marschner, P. Drying and rewetting frequency influences cumulative respiration and its distribution over time in two soils with contrasting management. Soil Biol. Biochem. 2014, 72, 172–179. [Google Scholar] [CrossRef]
- Lamparter, A.; Bachmann, J.; Goebel, M.O.; Woche, S.K. Carbon mineralization soil: Impact of wetting-drying, aggregation and water repellency. Geoderma 2009, 150, 324–333. [Google Scholar] [CrossRef]
Figure 1.
Study site location.

Figure 2.
Research scheme of the field experimental design. Note: CT—conventional tillage; NT—no tillage; CC—catch crop (white mustard (Sinapis alba L.)).
Figure 2.
Research scheme of the field experimental design. Note: CT—conventional tillage; NT—no tillage; CC—catch crop (white mustard (Sinapis alba L.)).

Figure 3.
The average daily air temperature (°C) during the study period (2021–2023).

Figure 4.
The average amount of precipitation (mm) during the study period (2021–2023).

Figure 5.
Measurements of NCER. In spring in the stand of peas (on the left) and soon after winter wheat harvesting in autumn (on the right).
Figure 5.
Measurements of NCER. In spring in the stand of peas (on the left) and soon after winter wheat harvesting in autumn (on the right).

Figure 6.
Dynamic of soil net carbon dioxide (CO2) exchange rate (NCER) under CT and NT tillage application and cropping systems. Data collected in 2021, 2022, and 2023. Note: CT—conventional tillage; NT—no tillage, WW—winter wheat; SW—spring wheat; WR—winter rape; P—peas; CC—catch crop—white mustard (Sinapis alba L.). The error bars show the mean’s standard error values.


Figure 7.
Total mean soil net carbon dioxide (CO2) exchange rate (NCER) over the entire study period (2021–2023) under different tillage and cropping systems. Note: CT—conventional tillage; NT—no tillage, WW—winter wheat; SW—spring wheat; WR—winter rape; P—peas; CC—catch crop—white mustard (Sinapis alba L.). The error bars show the mean’s standard error values.

Figure 8.
Soil surface moisture content (%) dynamics during the study period influenced by different tillage and cropping systems. Note: CT—conventional tillage; NT—no tillage, WW—winter wheat; SW—spring wheat; WR—winter rape; P—peas; CC—catch crop—white mustard (Sinapis alba L.).
Figure 8.
Soil surface moisture content (%) dynamics during the study period influenced by different tillage and cropping systems. Note: CT—conventional tillage; NT—no tillage, WW—winter wheat; SW—spring wheat; WR—winter rape; P—peas; CC—catch crop—white mustard (Sinapis alba L.).

Figure 9.
Soil surface temperature (°C) dynamics during the study period influenced by different tillage and cropping systems. Note: CT—conventional tillage; NT—no tillage, WW—winter wheat; SW—spring wheat; WR—winter rape; P—peas; CC—catch crop—white mustard (Sinapis alba L.).
Figure 9.
Soil surface temperature (°C) dynamics during the study period influenced by different tillage and cropping systems. Note: CT—conventional tillage; NT—no tillage, WW—winter wheat; SW—spring wheat; WR—winter rape; P—peas; CC—catch crop—white mustard (Sinapis alba L.).


Table 1.
The impact of tillage, cropping system, and their interaction on soil nutrients, pH, and organic carbon content (2021–2023 average data).
Table 1.
The impact of tillage, cropping system, and their interaction on soil nutrients, pH, and organic carbon content (2021–2023 average data).
| Factor | pHKCl | P2O5, mg kg −1 | K2O, mg kg−1 | Corg, g kg−1 |
|---|---|---|---|---|
| Tillage system (Factor A) | ||||
| Conventional tillage (CT) | 6.47 | 194 | 146 | 1.76 |
| No tillage (NT) | 6.50 | 196 | 183 | 1.85 |
| Cropping systems (Factor B) | ||||
| WW + SW + WW | 6.39 | 153 a | 129 a | 1.62 |
| WW-CC + SW + WW-CC | 6.77 | 256 c | 185 bc | 1.69 |
| SW-CC + P + SW | 6.48 | 174 ab | 146 a | 1.76 |
| SW-CC + P-CC + WR | 6.44 | 175 ab | 144 a | 1.71 |
| WR-CC + SW-CC + P-CC | 6.35 | 217 bc | 218 b | 1.74 |
| Actions and interactions | ||||
| Factor A | n.s. | n.s. | n.s. | n.s. |
| Factor B | n.s. | ** | * | n.s. |
| Factor A × Factor B | n.s. | n.s. | n.s. | n.s. |
Note: * and **—the least significant difference at p < 0.05 and p < 0.01, n.s.—not significant. WW—winter wheat; SW—spring wheat; WR—winter rape; P—peas; CC—catch crop—white mustard (Sinapis alba L.). Data followed by the different letters indicate significant difference at p < 0.05.
Table 2.
Effect of tillage and different cropping systems on soil net carbon dioxide (CO2) exchange rate (NCER) (µmol m−2 s−1) during the study period (2021–2023).
Table 2.
Effect of tillage and different cropping systems on soil net carbon dioxide (CO2) exchange rate (NCER) (µmol m−2 s−1) during the study period (2021–2023).
| Tillage (Factor A) | Cropping Systems (Factor B) | NCER (µmol m−2 s−1) |
|---|---|---|
| CT | 1.71 a | |
| NT | 2.19 b | |
| WW + SW + WW | 1.68 ab | |
| WW-CC + SW + WW-CC | 2.33 bc | |
| SW-CC + P + WR | 1.82 ab | |
| SW-CC + P-CC + WR | 1.72 ab | |
| WR-CC + SW-CC + P-CC | 2.07 abc | |
| Actions and interactions | ||
| Factor A | ** | |
| Factor B | ** | |
| Factor A × Factor B | n.s. | |
Note: **—the least significant difference at p < 0.01, n.s.—not significant. CT—conventional tillage; NT—no tillage; WW—winter wheat; SW—spring wheat; WR—winter rape; P—peas; CC—catch crop—white mustard (Sinapis alba L.). Data followed by the different letters indicate significant difference at p < 0.01.
Table 3.
Effect of tillage and different cropping systems on soil surface moisture content and temperature during the study period.
Table 3.
Effect of tillage and different cropping systems on soil surface moisture content and temperature during the study period.
| Tillage (Factor A) | Cropping Systems (Factor B) | Soil Moisture Content (%) | Soil Surface Temperature, °C |
|---|---|---|---|
| CT | 7.1 a | 23.3 | |
| NT | 8.9 b | 23.8 | |
| WW + SW + WW | 6.8 | 23.9 | |
| WW-CC + SW + WW-CC | 6.9 | 23.4 | |
| SW-CC + P + WR | 8.3 | 23.6 | |
| SW-CC + P-CC + WR | 8.7 | 23.4 | |
| WR-CC + SW-CC + P-CC | 8.9 | 23.3 | |
| Actions and interactions | |||
| Factor A | ** | n.s. | |
| Factor B | n.s. | n.s. | |
| Factor A × Factor B | n.s. | n.s. | |
Note: **—the least significant difference at p < 0.01, n.s.—not significant. CT—conventional tillage; NT—no tillage; WW—winter wheat; SW—spring wheat; WR—winter rape; P—peas; CC—catch crop—white mustard (Sinapis alba L.). Data followed by the different letters indicate significant difference at p < 0.01.
Table 4.
Pearson’s correlations of soil net carbon dioxide (CO2) exchange rate with SMC, temperature, and soil chemical properties.
Table 4.
Pearson’s correlations of soil net carbon dioxide (CO2) exchange rate with SMC, temperature, and soil chemical properties.
| NCER | SMC | Tsoil | pH | P2O5 | K2O | Corg | |
|---|---|---|---|---|---|---|---|
| NCER | 1 | −0.73 * | 0.44 * | −0.42 | −0.23 * | 0.21 | −0.28 |
| SMC | 1 | −0.72 * | 0.52 * | 0.53 | 0.05 | 0.50 * | |
| Tsoil | 1 | −0.55 | −0.36 * | 0.15 | −0.69 * | ||
| pH | 1 | 0.31 | −0.23 | 0.49 | |||
| P2O5 | 1 | 0.53 | −0.23 | ||||
| K2O | 1 | −0.11 | |||||
| Corg | 1 |
Note: * the least significant difference at p < 0.05.
Disclaimer/Publisher’s Note: The statements, opinions and data contained in all publications are solely those of the individual author(s) and contributor(s) and not of MDPI and/or the editor(s). MDPI and/or the editor(s) disclaim responsibility for any injury to people or property resulting from any ideas, methods, instructions or products referred to in the content. |
© 2024 by the authors. Licensee MDPI, Basel, Switzerland. This article is an open access article distributed under the terms and conditions of the Creative Commons Attribution (CC BY) license (https://creativecommons.org/licenses/by/4.0/).
Share and Cite
MDPI and ACS Style
Buivydienė, A.; Deveikytė, I.; Veršulienė, A.; Feiza, V. The Influence of Cropping Systems and Tillage Intensity on Soil CO2 Exchange Rate. Sustainability 2024, 16, 3591. https://0-doi-org.brum.beds.ac.uk/10.3390/su16093591
AMA Style
Buivydienė A, Deveikytė I, Veršulienė A, Feiza V. The Influence of Cropping Systems and Tillage Intensity on Soil CO2 Exchange Rate. Sustainability. 2024; 16(9):3591. https://0-doi-org.brum.beds.ac.uk/10.3390/su16093591
Chicago/Turabian StyleBuivydienė, Agnė, Irena Deveikytė, Agnė Veršulienė, and Virginijus Feiza. 2024. "The Influence of Cropping Systems and Tillage Intensity on Soil CO2 Exchange Rate" Sustainability 16, no. 9: 3591. https://0-doi-org.brum.beds.ac.uk/10.3390/su16093591
Note that from the first issue of 2016, this journal uses article numbers instead of page numbers. See further details here.