
Structural and Successional Dynamics of Old-Growth Mixed Oak Forests in the West Qinling Mountains
1
State Key Laboratory of Efficient Production of Forest Resource, Key Laboratory of Tree Breeding and Cultivation of National Forestry and Grassland Administration, Research Institute of Forestry, Chinese Academy of Forestry, Beijing 100091, China
2
Key Laboratory of Secondary Forest Cultivation Gansu Province, Xiaolongshan Research Institute of Forestry of Gansu Province, Tianshui 741020, China
*
Author to whom correspondence should be addressed.
Forests 2024, 15(5), 765; https://0-doi-org.brum.beds.ac.uk/10.3390/f15050765
Submission received: 20 March 2024
/
Revised: 17 April 2024
/
Accepted: 24 April 2024
/
Published: 26 April 2024
(This article belongs to the Special Issue Protection, Ecological Restoration and Sustainable Management of Natural Forest: Theory and Technology)
Abstract
:Understanding the composition and structure of forest trees is crucial to comprehending the properties and functions of forests. It also helps in implementing effective management strategies for sustainable resource utilization. Our study analyzed the structural dynamics of the old-growth mixed oak forests in the Xiaolongshan Forest region, focusing on three long-term monitoring plots (A, B, C). We examined the tree species composition, diameter distribution, mortality, and recruitment dynamics of different successional species groups, as well as the spatial distribution patterns of living and dead trees, with surveys conducted every five years. The findings indicate: (1) Plot A experienced a decline in stand density and species diversity during the survey period, with the Importance Value Index (IVI) of pioneer successional species continually decreasing in plots B and C. (2) The tree diameter distribution structure in plot A significantly differed from other plots, showing notable change between 2007 and 2012. (3) All plots exhibited lower, well-balanced community-level demographic parameters based on stem number, but a higher recruitment rate for later successional species groups based on basal area. (4) Dead individuals in plot A had a slight clustering distribution, while the other plots showed a random distribution. We conclude that the individual growth rate significantly impacts the dynamics of the natural Quercus aliena var. acuteserrata forest, with pioneer species groups being gradually replaced by early or late-successional species groups in the succession process.
1. Introduction
Vegetation dynamics in forest ecology has always been an important subject matter, encompassing all changes in the plant community over time, including its physiological state and composition. A comprehensive understanding of the dynamics of community structure is fundamental in ecological studies, as it sheds light on numerous ecological processes. Monitoring permanent plots is an effective way of studying the dynamic processes of forest ecosystems [1,2,3,4,5], even though tree ecological processes are slow-acting [6,7]. If there are data from long-term remeasurement plots, changes in forest characteristics such as tree composition, diameter distribution, mortality, recruitment, and distribution patterns of individuals become critical concerns. Most of our knowledge about forest dynamics comes from several large and long-term monitoring plots [1,5,8] in species-rich forest ecosystems in tropical and subtropical regions [5,9,10,11,12,13,14,15,16,17,18,19]. The community dynamics in the Amazon tropical forests [12], the BCI (a permanent 50-hectare forest dynamics project plot on Barro Colorado Island in Brazil) [9], and the subtropical Dinghu Mountain forest in southern China [10,19] have been extensively studied. In contrast, information on forest dynamics in the transition zone between the temperate and subtropical regions is limited, especially in the transitional zone between China’s north and south, despite well-established records of floristic composition in this area [20,21,22,23].
The dynamics of forests can be used to forecast how forest ecosystems may respond to disturbances. These disturbances could be small- or large-scale, such as interactions between trees, global climatic change [15], and extreme climatic events [8]. These disturbances are essential for initiating succession [24]. They can change growth and mortality rates between tree species or individuals, thereby having long-term effects on stand development and successional pathways [25]. Several studies have documented that regional warming and the consequent drought stress have caused a decrease in tree diameter growth [26,27,28], reduced biomass carbon sinks [29], increased tree mortality [30,31,32], and die-off of some species [33]. Some studies have demonstrated the effects of ice storms on forest dynamics, which cause sudden changes in structure and community composition [2,4,18,34]. Responses to these extreme climate events may vary widely among forest vegetation, depending on the magnitude and occurrence time of these events [2]. Many studies have focused on evaluating tree species’ immediate susceptibility, forest ecosystem destruction, forest fire occurrence, and loss assessment of broad-leaved forests and plantations in southern and central China after ice storms [35,36,37,38,39,40,41]. However, only some studies have involved forest dynamics, especially in deciduous broad-leaved mixed forests. Forests located in climate transition zones may be more sensitive to natural disturbances and therefore provide a unique opportunity to document the effects of disturbances on forest dynamics.
The Xiaolongshan Forest Region is in the southeastern region of the Gansu Province, at the western edge of the Qinling Mountains. The region intersects four natural vegetation zones: Central China, North China, the Himalayas, and Mengxin. These are all located in China. It belongs to the transitional zone from the warm temperate zone to the northern subtropical area and has the characteristics of China’s northern and southern climates. The regions play an irreplaceable role in maintaining biodiversity and regional ecological balance. We established an old-growth mixed oak forest permanent plot in 2007 to study and monitor the dynamics of forest structure characteristics. The plot has been unmanaged since the 1960s. Some research in this region primarily focused on the community structure, interspecific relationships, and biodiversity of forest communities [20,21,22,23,40,41]. In this region, we used a permanent forest plot that was remeasured every five years to identify the dynamics and trends in forest composition and structure. In addition to the old-growth mixed oak forest plot, we established two other monitoring plots in this forest in 2009. These were also remeasured every five years. The lack of long-term monitoring of forest plots in this unique climate zone highlights the need for more research on forest community dynamics.
Therefore, based on community-level demographic parameters such as recruitment and mortality data, in the Xiaolong Mountain forest region of Gansu, we established three plots in old-growth forests with the aim to interpret population and community dynamics in an old-growth mixed oak forest. The major questions are as follows: (1) how does the species composition and diversity of trees in the forest vary across different survey intervals? And (2) what are the dynamic processes of different succession groups across different survey intervals? Based on the above information, we aim to have a clearer understanding of the structure and succession processes of the stands.
2. Materials and Methods
2.1. Study Site and Monitoring Plot Data
The study area is in the Xiaolongshan forest region (33°30′–34°49′ N, 104°22′–106°43′ E), southeastern Gansu Province, China (Figure 1). The altitude ranges approximately from 1400 to 2500 m. The annual precipitation in this area is 460–800 mm, and the mean yearly temperature is between 7 and 12 °C. Most rainfall, approximately 50% to 60% of the annual precipitation, occurs during the months of July, August, and September. The soil is mainly composed of brown mountainous soil and mountainous cinnamon soil. The typical vegetation type is deciduous broad-leaved forest dominated by Quercus aliena var. acuteserrata Maxim and Quercus liaotungensis.
The established plots (34°14′10″ N–34°14′55″ N, 106°27′10″ E–106°27′55″ E) were located in the No. 91 compartment of the Wangangou District, Baihua Forest Farm, within the Xiaolongshan Forest region. The elevation was approximately 1900 m. The area of the compartment is approximately 17 hectares, and it is a typical mixed oak forest dominated by Quercus aliena var. acuteserrata Maxim. There are over 50 species in this area. Other common and dominant species include Staphylea holocarpa Hemsl., Rhus verniciflus Stokes, Acer davidii Franch., Tilia paucicostata Maxim., Craibiodendron stellatum (Pierre) W. W. Sm., Sorbus hupehensis Schneiid., Cerasus polytricha (Koehne) Yü et Li, and so on. The forest is remote and difficult to access. It has been unmanaged since the 1960s. Fallen wood and dead trees were common at the sample sites. Using an increment borer, we determined that the tree with the largest diameter at breast height (dbh) was over 110 years old.
Within the No. 14 sub-compartments, we established three permanent plots (A, B, and C), each measuring 100 m by 100 m. Plot A (34°14′43″ N, 106°27′11″ S) was established and measured in July of 2007. The other two monitoring plots (plot B, 34°14′49” N, 106°27′12″ S, and plot C, 34°15′12″ N, 106°26′52″ S) were established in September 2009. To accurately locate trees, each plot was partitioned into 25 subplots measuring 20 m by 20 m, and all trees with a diameter at breast height (dbh, measured at h = 1.30 m) greater than 5 cm were labeled and positioned using a TOPCON total station (GTS-601). The dbh and height of trees were measured by a diameter tape and hypsometer, respectively. The established plots, due to their remote geographic location, have been minimally influenced by anthropogenic disturbances for several decades, making them suitable as ideal sites for studying forest stand succession. Plot A was remeasured in 2012 and 2017, while plots B and C were remeasured twice, in 2014 and 2019. At each remeasurement, we recorded the dbh, height, crown dimensions, and survival status (live or dead) of each tree. During each remeasurement, we identified, measured, and tagged the small trees that had newly reached a dbh of 5 cm.
2.2. Data Analysis
The tree composition and structure in each plot were analyzed and compared at different census times. We first classified tree species into different successional species groups based on the literature review, i.e., pioneer, early, and late-successional species [10,22,40,41,42,43] and we displayed the species within each successional group in the Appendix A (Table A1). We then studied tree demography and forest dynamics, focusing on the following aspects: (1) tree composition changes in each plot in terms of stem number, basal area, mean stem diameter, species diversity, and tree species importance value in a community; (2) diameter distribution characteristics of live trees and dead trees; (3) mortality, recruitment, and dynamics of different successional groups; and (4) spatial distribution patterns of living and dead trees.
We used the Shannon–Wiener index [44] and the Pielou evenness index [45] to quantify the diversity and evenness of tree species in communities. The species stem number and basal area were used to calculate diversity indices.
where is the diversity of tree species, is the proportion of the i-th tree species that used the species’ stem number or basal area, and is the tree species number in the plot.
where is the Pielou evenness index, is the Shannon–Wiener index, and is the tree species number in the plot.
The importance value index (IVI) for different successional groups was calculated as follows [46]:
where = importance value of j-th successional group; = number of individuals of the jth successional group present in sample population (density); = total number of individuals in sample population; = sum of basal area for j-th successional group (dominance); and = total of basal area across all species.
Annual mortality (m) and recruitment (r) rates were calculated following the standard models [12]:
where and represent the population sizes of the different successional groups at time t and time 0, respectively, and represents the number of survivors at time t.
The specific successional group dynamics rate (D) was calculated as the average of the recruitment rate (r) and the mortality rate (m) over the study period. The half-life time (), the time that it would take for a given successional group to lose 50% of all its individuals, was calculated as follows [47]:
The Kolmogorov–Smirnov test [48,49] was used to compare the distribution of dbh at different periods in the community (). We used the univariate pair correlation function, g(r), to assess the spatial distribution patterns of all living trees and used complete spatial randomness (CSR) as the null hypothesis, indicating no deviation from the random spatial arrangement of trees. The bivariate pair correlation function, g12(r), assessed the spatial interaction between living and dead trees. Random labeling was used as a null model to assess whether the spatial distribution of dead trees was independent of the spatial distribution of living trees. Monte Carlo simulations were used to determine the significance of deviations from each null hypothesis by running 999 simulations for each analysis [50]. Translation correction was utilized in the analyses to prevent edge effects [51]. A one-way analysis of variance (ANOVA), coupled with subsequent post hoc testing, was utilized to ascertain significant disparities in the fundamental attributes of stands across diverse plot classifications and temporal intervals. Both data calculation and analysis were performed using R statistical software (4.1.0) [52].
3. Results
3.1. Tree Species Composition and Diversity
In the initial survey, we documented trees in plots A, B, and C, focusing on those with a diameter at breast height (DBH) exceeding 5 cm. The observed tree species count was 49, 49, and 48 for each plot, respectively (Table 1 and Table 2). Over time, the species composition varied across the plots. Specifically, plot A experienced a slight reduction in species count from 2007 to 2017, with Viburnum erubescens and Stachyurus chinensis disappearing by 2012, and Cotoneaster acutifolius by 2017. Conversely, plot B saw the introduction of a new species within the first five years, though two species were lost between 2014 and 2019. Plot C’s species count rose from 48 to 51 between 2009 and 2019.
In three surveyed plots of old-growth forests, plot A was initially dominated by Quercus aliena and Acer davidii. However, after a ten-year investigation, Acer davidii was replaced by Rhusverniciflus. In contrast, the tree species community in plot B remained stable, with Quercus aliena and Carpinus turczaninowii consistently dominating. Amongst the three plots, plot C had the most diverse main tree community, with four tree species accounting for more than ten percent of the total forest basal area. These species were Quercus aliena, Carpinus turczaninowii, Sorbus alnifolia, and Carpinus stipulata.
Tree density in plot A significantly decreased from 2007 to 2017 (p < 0.05), particularly during the initial inventory, possibly due to pest or disease outbreaks or the 2008 ice-snow disaster. The density of dead trees in plot A peaked at 111 trees/ha in 2012, markedly higher than in plots B and C during the first survey. Meanwhile, DBH, basal area, and tree height saw increases in all plots. The Shannon–Wiener index, based on both stem count and basal area, revealed a declining trend in plots A and B, in contrast to an increase in plot C, indicating a decrease in community heterogeneity in the former and an increase in the latter. The Pielou evenness index, based on stem count, showed an upward trend in plots A and B, but a downward trend in plot C. When based on basal area, this index decreased in plots A and B but remained stable in plot C, suggesting that the deceased trees during the survey likely had larger basal areas.
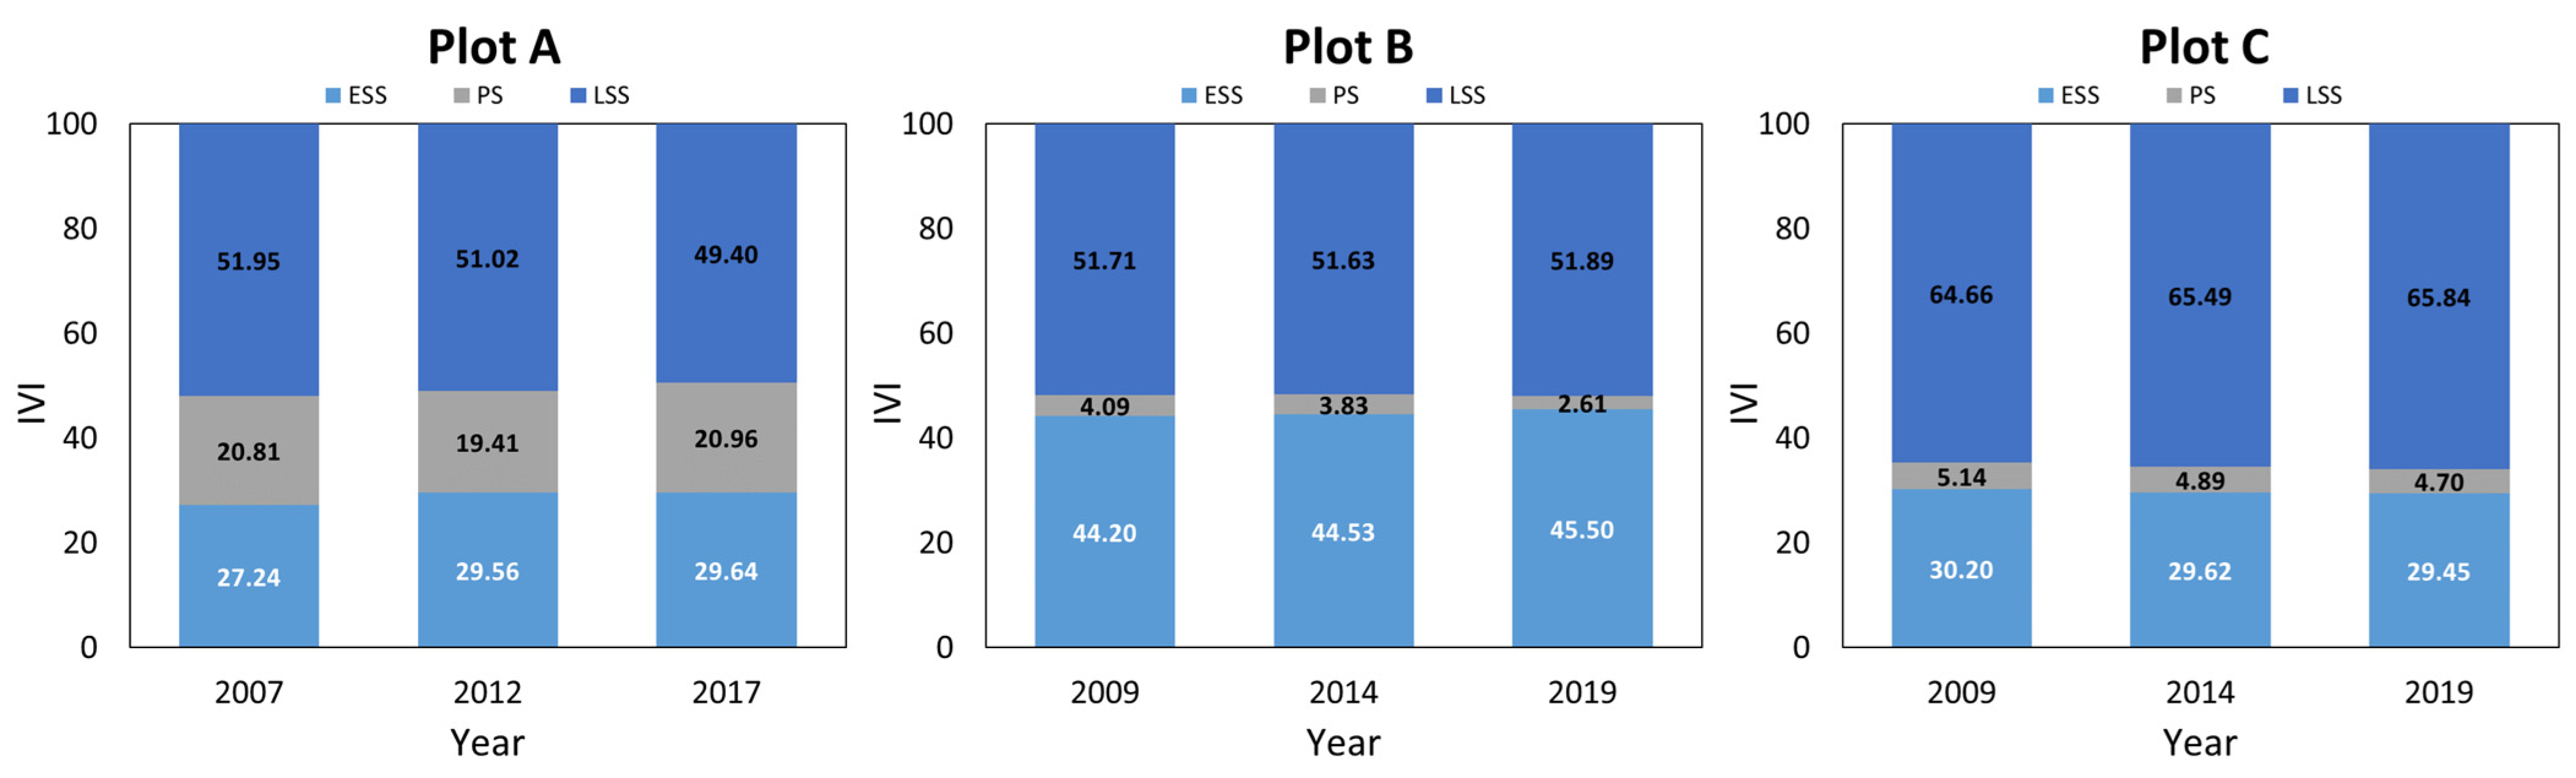
The Importance Value Index (IVI) (Figure 2) remained stable over time, with late-successional species dominating plot A (over 50%), early successional species making up nearly 30%, and pioneer species making up the least. In plots B and C, pioneer species groups account for less than 5% and the communities of pioneer species show a declining trend, with the IVI of early successional species groups in plot B steadily increasing. This indicates that the growth and developmental stages in these areas are more advanced than in plot A. The proportion of late-successional species groups in plot B is slightly higher than that of the early successional community, while in plot C, the late-successional community almost reaches 70%, with early successional species accounting for about 30%.
3.2. Tree Diameter Distribution and Demographic Parameters
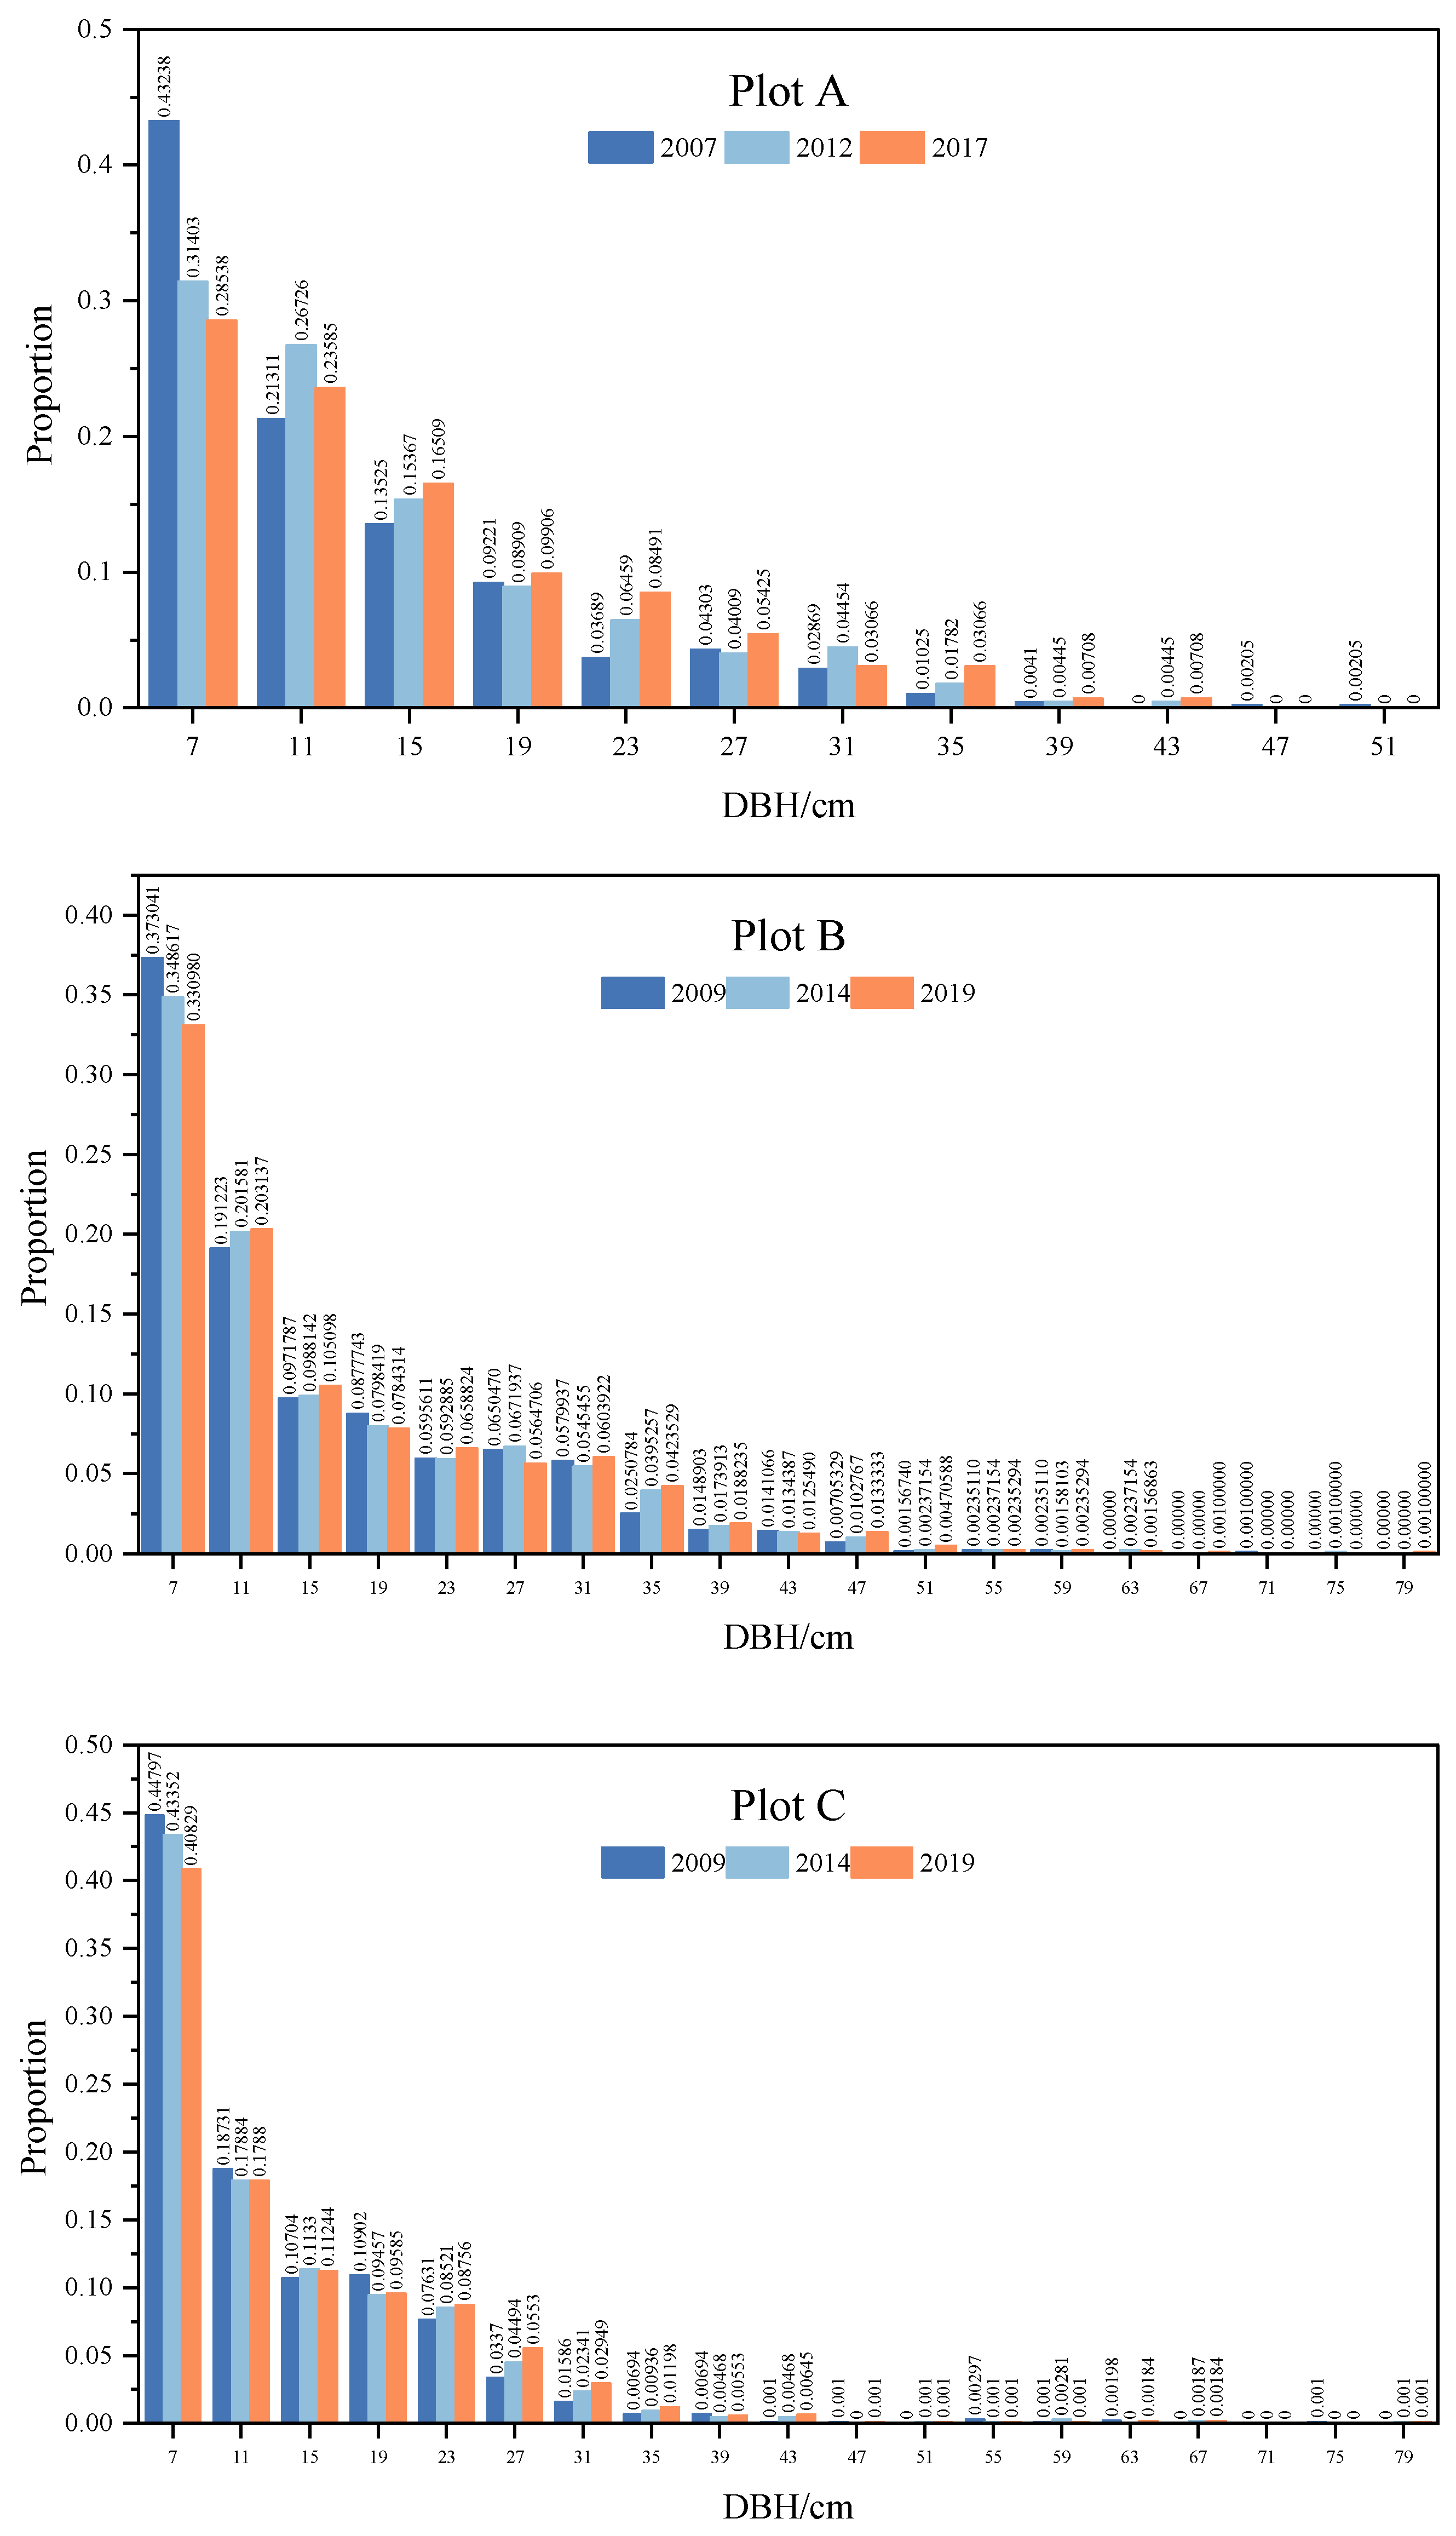
The diameter distributions of living trees in plots A, B, and C generally exhibited an inverse J-shape, with a predominance of small-diameter individuals and a decrease in probability density as tree DBH increased (Figure 3). Over time, the proportion of smaller DBH classes diminished, while larger trees became more numerous. In plot A, the percentage of trees with DBHs between 5 cm and 9 cm declined from 43.2% in 2007 to 31.4% in 2012 and 28.5% in 2017, with the maximum diameter also expanding from 43 cm to 53 cm. The Kolmogorov–Smirnov test revealed significant differences in diameter distribution between 2007 and subsequent years (2012: , , _ ()) and 2017 (, , _ ()), but not between 2012 and 2017.
Diameter distributions in plots B and C showed minimal variation across censuses, with the Kolmogorov–Smirnov test indicating no significant structural differences between 2009 and 2014.
Significant variations in recruitment and mortality rates were observed among different successional species groups and time intervals based on stem count (Table 3). From 2007 to 2012, plot A exhibited low recruitment rates. No recruitment of individuals with a DBH larger than 5 cm was observed in plot A’s pioneer or late-successional species groups. The recruitment rate for the early successional species group was merely 0.07%, with minimal differences among the three successional groups. However, during this interval, the mortality rates for pioneer and early successional species groups (1.8% and 1.72%, respectively) were higher compared to the late-successional species group (0.87%). In the second interval (2012–2017), there was still no recruitment in the late-successional group, but the recruitment rates for pioneer and early successional groups increased (from 0.00% to 1.06% and from 0.07% to 1.70%, respectively). Except for the early successional group, whose mortality rate remained stable at 1.70%, the mortality rates for pioneer and late-successional groups increased (from 1.80% to 3.02% and from 0.87% to 1.85%, respectively). Plots B and C showed a trend opposite to plot A, with a decrease in recruitment and mortality rates for most successional species groups, except for an increase in the pioneer group’s recruitment rate in plot C during the second survey. Between 2009 and 2014, the highest recruitment and mortality rates were observed in plot B’s pioneer group (1.38% and 3.81%) and plot C’s early successional group (2.81% and 1.24%), respectively. From 2014 to 2019, recruitment and mortality rates significantly decreased across all successional species groups in both plots; the highest recruitment rates were in the early successional group (0.80% for plot B and 0.96% for plot C), and the highest mortality rates were in the pioneer groups of plots B and C (1.37% and 0.56%, respectively).
Compared to stem count, the recruitment rates based on basal area for different successional species groups were higher in all three plots (Table 4). The late-successional species group in plot A had the highest recruitment rates during both survey intervals, with values of 3.62% and 3.04%, followed by the early successional species group. Between 2009 and 2014, the pioneer species group in plot B exhibited the highest recruitment rate (4.61%), while the early successional group in plot C had the highest rate (3.66%). The pioneer species group in plot A had a relatively higher mortality rate compared to the early and late-successional species across different survey intervals, especially between 2007 and 2012, reaching 6.39%. The mortality rate of each successional species group in plot B was lower than in plot A, with higher rates during the first survey period than in the second. Plot C had the lowest mortality rate among the three plots, with the pioneer species group’s mortality rate only at 0.21% during the first survey period but increasing to 1.45% in the second. The mortality rate of the early successional species group remained stable across the two survey intervals, while that of the late-successional species group decreased from 0.43% to 0.10%.
3.3. Tree Dynamics Pattern and Individual Distribution Pattern
Forest dynamics, or succession, can be quantified by analyzing the mortality, recruitment rate, and growth rate of individual trees. The half-life (), the time it takes for a successional group to lose 50% of its individuals, reflects the speed of community succession. Analyzing both stem number and basal area reveals the dynamics of community density and growth. The characteristics of different successional groups are presented in Table 2 and Table 3, illustrating significant differences between dynamics assessed by stem number and those based on basal area. In plot A, the dynamics of successional species groups based on stem number indicate an accelerated rate of change. From 2007 to 2012, pioneer and early successional species groups in plot A exhibited the most significant dynamic rates in stem number (0.90% for both) and shorter half-lives (38.1 years and 39.9 years, respectively). However, from 2012 to 2017, pioneer species groups showed even more significant dynamics and a shorter half-life compared to early and late-successional species groups.
In contrast, the dynamic rates based on stem number for successional species groups in plots B and C showed a decelerating trend. Between the two survey intervals (2009 to 2019), pioneer species groups in plot B exhibited the most significant dynamic rates (2.60% and 1.04%) and the shortest half-life times (17.9 years and 50.2 years), while late-successional species had the lowest dynamic rates (0.45% and 0.28%) and the longest half-lives (180.8 years and 549.3 years). In plot C, early successional species groups showed the highest dynamic rates (2.03% and 0.74%) and the shortest half-lives (55.4 years and 134.7 years) during the survey intervals.
Forest dynamics measured by basal area were higher than those measured by stem number, indicating more pronounced changes in basal area. Moreover, successional species groups in all three plots exhibited a decelerating trend, except for the late-successional group in plot A and the pioneer group in plot C, which remained stable or showed a slight increase. During the first survey period, the pioneer species group in plots A and B had higher rates of change (4.13% and 3.80%) and shorter half-lives (10.5 years and 22.8 years) compared to the early and late-successional groups. In plot C, the early successional species exhibited the highest dynamic rate (2.10%) and the shortest half-life (129.5 years). During the second survey interval, the pioneer species groups in plots A and C (2.94%, 1.74%) and the early successional species groups in plot B (1.28%) had the highest rates of change. ANOVA tests indicated significant differences between plot A and plots B and C during the second survey interval (p = 0.0302 < 0.05), with these successional groups also exhibiting shorter half-lives: 16.5 years, 47.4 years, and 126.4 years, respectively.

Table 3.
Dynamic features of different successional groups based on stem number in Quercus aliena var. acuteserrata natural forest in the West Qinling Mountains, China.
Table 3.
Dynamic features of different successional groups based on stem number in Quercus aliena var. acuteserrata natural forest in the West Qinling Mountains, China.
| Species Group | Recruitment Rate (%) | Mortality Rate (%) | Dynamics Rate (%) | Half-Life Time (Year) | ||||||||||||||||||||
|---|---|---|---|---|---|---|---|---|---|---|---|---|---|---|---|---|---|---|---|---|---|---|---|---|
| Plot A | Plot B | Plot C | Plot A | Plot B | Plot C | Plot A | Plot B | Plot C | Plot A | Plot B | Plot C | |||||||||||||
| 2007– 2012 | 2012– 2017 | 2009– 2014 | 2014– 2019 | 2009– 2014 | 2014– 2019 | 2007– 2012 | 2012– 2017 | 2009– 2014 | 2014– 2019 | 2009– 2014 | 2014– 2019 | 2007– 2012 | 2012– 2017 | 2009– 2014 | 2014– 2019 | 2009– 2014 | 2014– 2019 | 2007– 2012 | 2012– 2017 | 2009– 2014 | 2014– 2019 | 2009– 2014 | 2014– 2019 | |
| Pioneer | 0.00 | 1.06 | 1.38 | 0.70 | 0.00 | 0.56 | 1.80 | 3.02 | 3.81 | 1.37 | 1.08 | 0.56 | 0.90 | 2.04 | 2.60 | 1.04 | 0.54 | 0.56 | 38.1 | 22.6 | 17.9 | 50.2 | 64.1 | 123.0 |
| Early successional | 0.07 | 1.70 | 1.11 | 0.80 | 2.81 | 0.96 | 1.72 | 1.70 | 1.37 | 0.70 | 1.24 | 0.51 | 0.90 | 1.70 | 1.24 | 0.75 | 2.03 | 0.74 | 39.9 | 40.3 | 50.4 | 99.3 | 55.4 | 134.7 |
| Late-successional | 0.00 | 0.00 | 0.51 | 0.42 | 1.38 | 0.50 | 0.87 | 1.85 | 0.38 | 0.13 | 1.02 | 0.50 | 0.44 | 0.93 | 0.45 | 0.28 | 1.20 | 0.50 | 79.2 | 37.2 | 180.8 | 549.3 | 67.3 | 138.9 |
Table 4.
Dynamic features of different successional groups based on basal area in Quercus aliena var. acuteserrata natural forest in the West Qinling Mountains, China.
Table 4.
Dynamic features of different successional groups based on basal area in Quercus aliena var. acuteserrata natural forest in the West Qinling Mountains, China.
| Species Group | Recruitment Rate (%) | Mortality Rate (%) | Dynamics Rate (%) | Half-Life Time (Year) | ||||||||||||||||||||
|---|---|---|---|---|---|---|---|---|---|---|---|---|---|---|---|---|---|---|---|---|---|---|---|---|
| Plot A | Plot B | Plot C | Plot A | Plot B | Plot C | Plot A | Plot B | Plot C | Plot A | Plot B | Plot C | |||||||||||||
| 2007– 2012 | 2012–2017 | 2009–2014 | 2014–2019 | 2009–2014 | 2014–2019 | 2007– 2012 | 2012–2017 | 2009–2014 | 2014–2019 | 2009–2014 | 2014–2019 | 2007– 2012 | 2012–2017 | 2009–2014 | 2014–2019 | 2009–2014 | 2014–2019 | 2007– 2012 | 2012–2017 | 2009–2014 | 2014–2019 | 2009–2014 | 2014–2019 | |
| Pioneer | 1.86 | 1.76 | 4.61 | 1.88 | 2.90 | 2.02 | 6.39 | 4.12 | 2.99 | 0.11 | 0.21 | 1.45 | 4.13 | 2.94 | 3.80 | 1.00 | 1.56 | 1.74 | 10.5 | 16.5 | 22.8 | 628.5 | 329.2 | 47.4 |
| Early successional | 3.13 | 2.82 | 2.04 | 2.01 | 3.66 | 2.60 | 2.12 | 0.83 | 1.09 | 0.55 | 0.53 | 0.54 | 2.63 | 1.83 | 1.57 | 1.28 | 2.10 | 1.57 | 32.3 | 83.5 | 63.5 | 126.4 | 129.5 | 126.9 |
| Late-successional | 3.62 | 3.04 | 2.04 | 1.37 | 3.52 | 2.39 | 0.29 | 0.99 | 0.13 | 0.11 | 0.43 | 0.10 | 1.96 | 2.02 | 1.09 | 0.74 | 1.98 | 1.25 | 260.3 | 69.0 | 525.3 | 598.9 | 159.8 | 685.9 |
Statistical analyses were performed on the addition of dead trees within three sample plots across various survey intervals, with findings presented in Table 5. This study utilized univariate and bivariate pair correlation functions g(r) and g12(r), respectively, to examine the distribution patterns of live trees over time and their spatial relationships with dead trees. ANOVA tests highlighted significant disparities in dbh, and average height of live trees, as well as the density of dead trees in plot A, in comparison to plots B and C across different survey periods (). It is important to note, however, that the diversity of tree species analyzed was relatively limited.
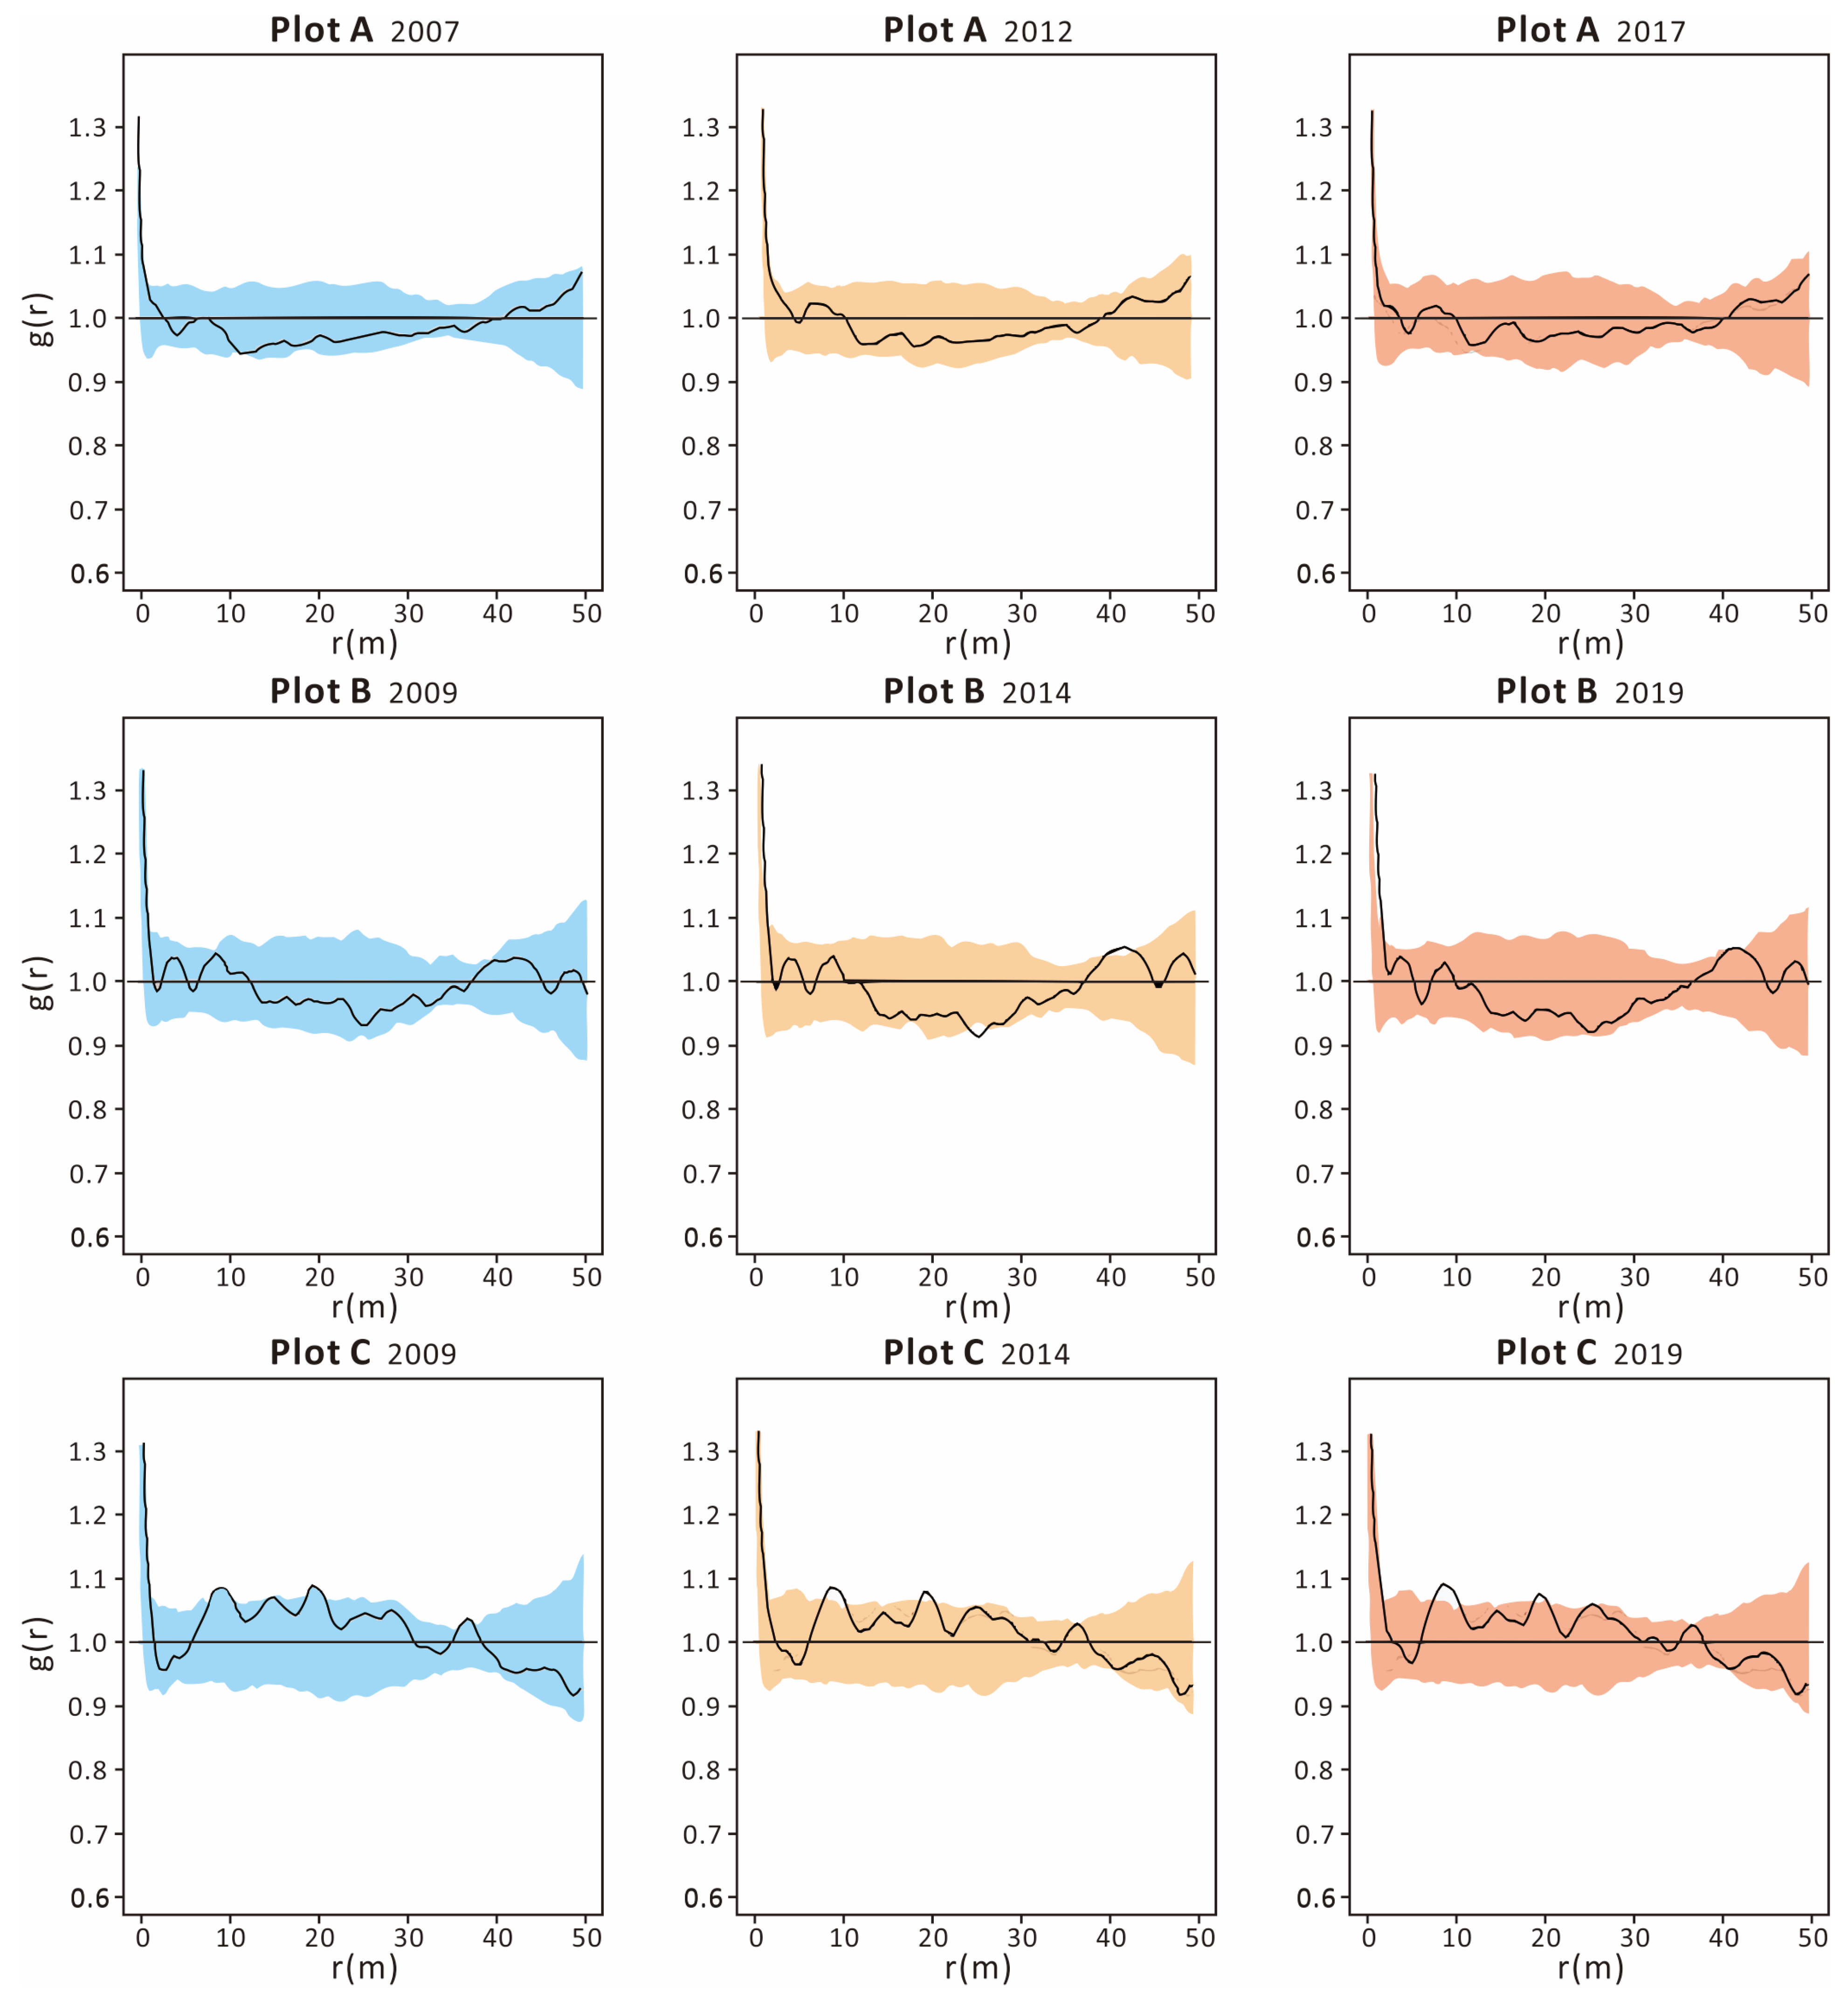
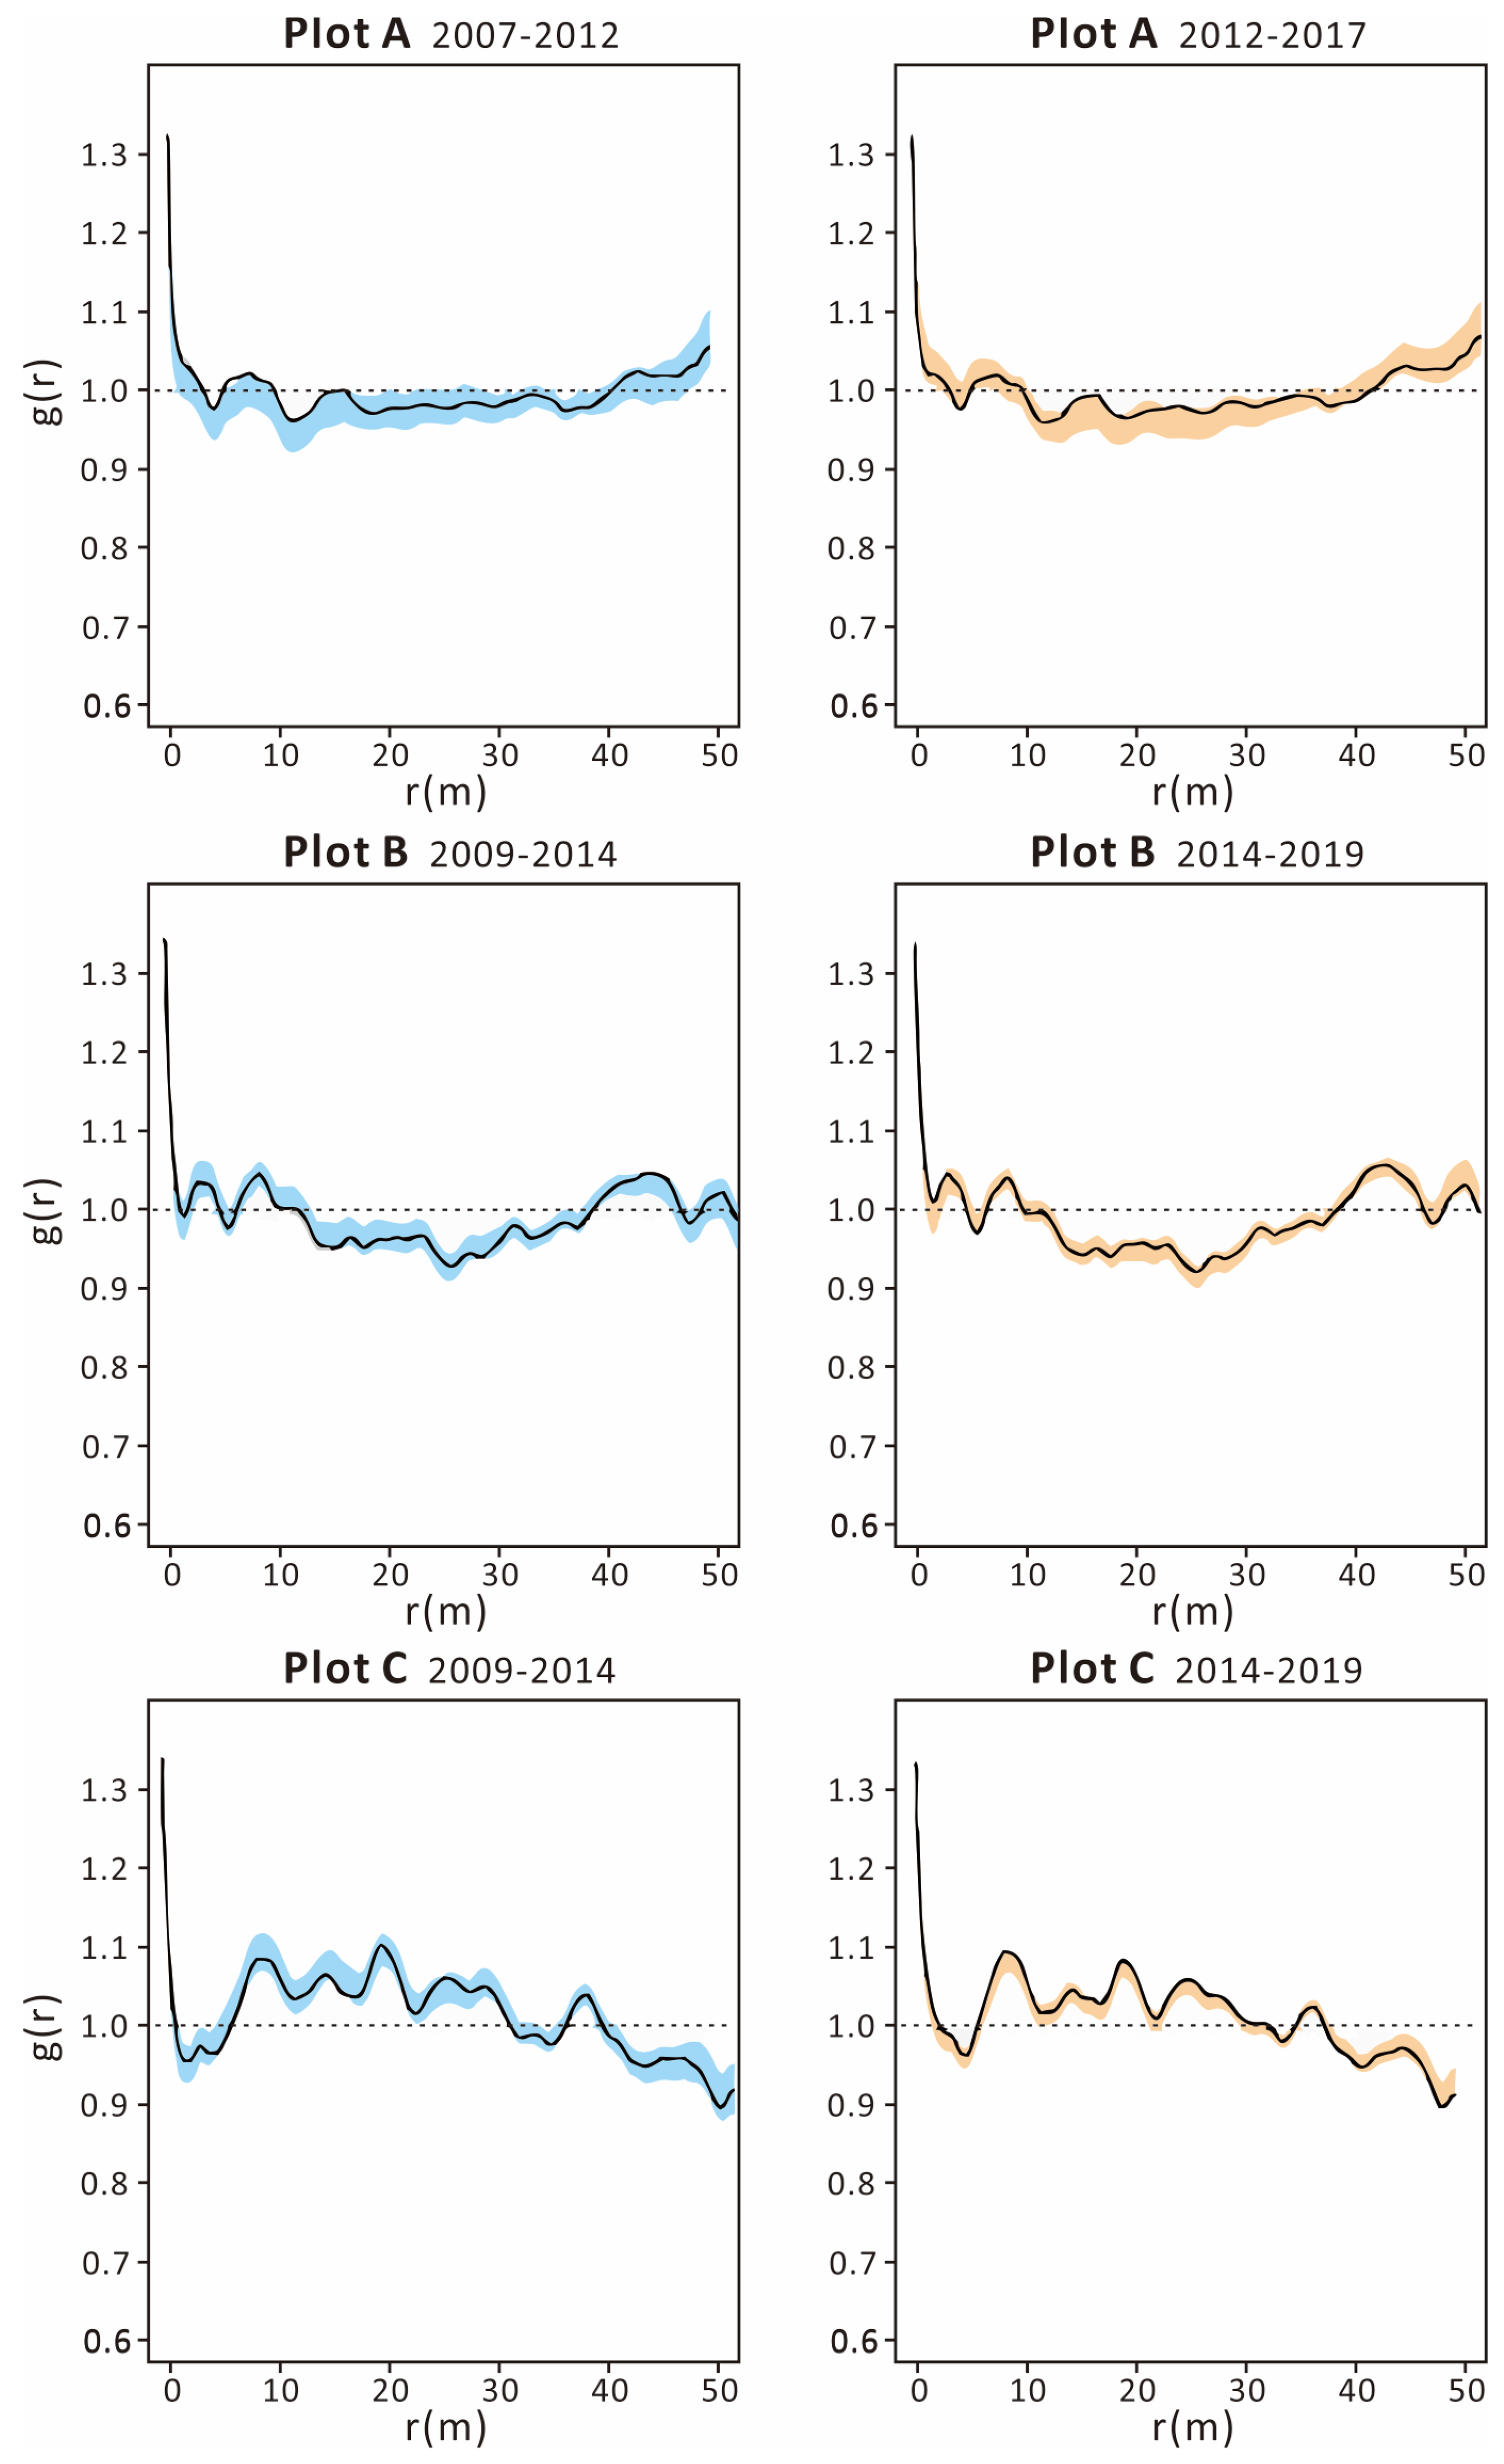
The application of univariate pair correlation functions revealed that the distribution patterns of live trees remained consistent throughout the decade-long observation period across all plots. For plots A and B, the correlation functions for live trees closely aligned with the envelope lines, suggesting a random spatial arrangement of live trees across the entire area. In contrast, the correlation function curves for plot C dipped below the lower envelope lines at certain scales, indicating clustered distributions of live trees at distances of 8–12 m and 19–21 m. Meanwhile, the bivariate pair correlation functions for plot A (illustrated in Figure 4 and Figure 5 top) exceeded the envelope lines at distances of 5–12 m and 15–17 m between 2007 and 2012, and at 15–17 m between 2012 and 2017, signifying that dead trees and living trees were clustered together. This suggests a higher likelihood of mortality for trees situated in close proximity to one another. Conversely, for plots B (Figure 4 and Figure 5 middle) and C (Figure 4 and Figure 5 bottom), the bivariate pair correlation functions remained within the envelope lines, indicating a random distribution of dead trees relative to live trees across the entire spatial scale.
4. Discussion
4.1. Tree Species Composition and Diversity
Our research found that the composition and structure of the old-growth mixed oak forests within the study area have remained almost unchanged, especially in plots B and C. We observed minor changes in tree species diversity over different survey periods, similar to other studies conducted in tropical and temperate forests [2,18,53]. However, the number of species in plot A continuously declined, and the stand density in plot A changed significantly, with the density of standing deadwood reaching 111 trees per hectare, greatly exceeding plots B and C. We suspect this is related to the minor ice storm disaster that occurred in 2008 and sudden pest and disease outbreaks; some studies have shown that catastrophic events can lead to significant changes in forest composition and structure [16]. Meanwhile, our analysis of the IVI calculations for the plot’s stands indicated that the pioneer species groups in plots B and C exhibit a decreasing trend while the importance value of the early successional species groups in plot B continues to rise, suggesting that early and late-successional species groups further dominate the landscape. In plot A, the importance values of various successional species groups did not change significantly over the ten-year survey period and remained generally stable. Forest succession is a slow and continuous process, and long-term monitoring in complex climate zones can provide new references.
4.2. Tree Size Differentiation
The stand diameter class structure can provide insights into forest dynamics [2]. Our research results show that the old-growth mixed oak forests exhibit an inverse J-shaped distribution, indicating stable and sustainable forest development, consistent with multiple studies [21,22]. The distribution of tree diameter at breast height (dbh) reflects size differentiation, growth patterns, mortality, and regeneration. The proportion of small trees decreased in all plots over different survey periods, in line with other research findings [18,46]. The Kolmogorov–Smirnov test indicated that the diameter distribution in plot A underwent significant changes during this period [54], while the diameter distributions in plots B and C did not show significant changes. We speculate that natural disturbances led to damage in trees of different diameter classes within the stand, accelerating tree mortality. The high mortality rate of small trees [55] and the limited understory light due to the dense forest canopy explain this phenomenon. Tree mortality is a complex process that is closely related to forest type as well as the intensity and frequency of natural disturbances.
4.3. Dynamics Characteristics
Our results reveal a clear imbalance between recruitment and mortality during different survey intervals. Pioneer species groups displayed the highest rates of dynamic change, while late-successional species groups had the lowest. We found that the dynamic change rate of tree density based on the number of individuals was significantly lower than the dynamic change rate of each successional group based on basal area, which is consistent with other studies [18,34,55,56]. In the first survey period, the pioneer and early successional species communities in plot A had higher rates of dynamic change based on stem numbers and shorter half-lives. In the second survey period, pioneer species communities exhibited a more significant rate of dynamic change and a shorter half-life compared to the other two groups. In contrast, plots B and C showed a decrease in the rates of dynamic change and an increase in half-lives for each species community, aligning to some extent with directional succession. However, we cannot exclude the possibility that the observed changes might be due to natural fluctuations.
5. Conclusions
This study, through investigation of the structural dynamics and successional species composition in the old-growth forests of the Xiaolong Mountains in Gansu, found that over a 10-year period, there were no significant changes in stand structure. However, variations were observed within different successional communities: pioneer, early successional, and late-successional species. Notably, stands in plots B and C showed consistent trends, with a decline in IVI for pioneer species groups, while IVI for early-successional and late-successional tree species increased, suggesting the influence of complex natural processes. Within the three surveyed plots, species composition, diameter distribution, and dynamics varied over the survey period. We conclude that the growth rates of individual trees in natural forests of Quercus aliena var. acuteserrata are the primary drivers of dynamic processes in the short term. During succession, pioneer species groups are gradually replaced by early or late-successional species, indicating a transition over time. Despite the insights gained over the ten-year study, the duration remains insufficient to fully capture the succession processes of forest communities. Long-term and large-scale observational studies are more apt to directly demonstrate the evidence of forest dynamics driven by diverse natural processes.
Author Contributions
Q.L. and Z.Z. conceived the study, and Z.Z. designed the experiments and collected data with W.L., Q.L. and R.S. Z.Z. presented the method; Q.L., R.S. and Z.Z. analyzed the data; Q.L. and Z.Z. wrote the manuscript. All authors have read and agreed to the published version of the manuscript.
Funding
This research was funded by National Key R&D Program of China (2022YFD2200503-03) and National Natural Science Foundation of China (32171780).
Data Availability Statement
The data presented in this study are available upon request from the corresponding author.
Acknowledgments
We are grateful to Xiaolong Shi, Anmin Li, Xiaolong Guo, Peng Wang, Shenmin Yu and other colleagues who participated in the field survey.
Conflicts of Interest
The authors declare no conflicts of interest.
Appendix A
Table A1.
Successional species group and woody plant List.
| Species | Group | Attribute |
|---|---|---|
| Lindera obtusiloba Blume | Early successional species group | shrub |
| Sorbus alnifolia (Siebold & Zucc.) C. Koch | macrophanerophytes | |
| Carpinus turczaninowii Hance | macrophanerophytes | |
| Carpinus stipulata H. J. P. Winkl. | macrophanerophytes | |
| Meliosma cuneifolia Franch. var. glabriuscula Cuf | macrophanerophytes | |
| Carpinus henryana (H. J. P. Winkl.) H. J. P. Winkl. | macrophanerophytes | |
| Cornus hemsleyi C. K. Schneid. & Wangerin | macrophanerophytes | |
| Carya cathayensis Sarg. | macrophanerophytes | |
| Acer davidii Frarich. | macrophanerophytes | |
| Amelanchier alnifolia | deciduous tree or shrub | |
| Malus hupehensis (Pamp.) Rehder | macrophanerophytes | |
| Fraxinus sogdiana Bunge | macrophanerophytes | |
| Tilia paucicostata Maxim. | macrophanerophytes | |
| Acer tetramerum Pax | macrophanerophytes | |
| Staphylea holocarpa Hemsl. | deciduous tree or shrub | |
| Crataegus kansuensis E. H. Wilson | macrophanerophytes or shrub | |
| Viburnum dilatatum Thunb. | shrub | |
| Fraxinus paxiana Lingelsh. | macrophanerophytes | |
| Tilia tuan Szyszyl. | macrophanerophytes | |
| Ulmus macrocarpa Hance | deciduous tree or shrub | |
| Prunus polytricha Koehne in Sarg. | macrophanerophytes or shrub | |
| Viburnum erubescens Wall. var. gracilipes Rehd. | macrophanerophytes or shrub | |
| Sambucus williamsii Hance | shrub | |
| Prunus clarofolia C. K. Schneid. | macrophanerophytes or shrub | |
| Forsythia suspensa (Thunb.) Vahl | shrub | |
| Philadelphus incanus Koehne | shrub | |
| Rhus potaninii Maxim. | macrophanerophytes | |
| Dipelta floribunda Maxim. | deciduous tree or shrub | |
| Morus alba L. | macrophanerophytes or shrub | |
| Rhus punjabensis var. sinica (Diels) Rehd.et Wils. | macrophanerophytes | |
| Malus baccata (L.) Borkh. | macrophanerophytes | |
| Kalopanax septemlobus (Thunb.) Koidz. | macrophanerophytes | |
| Lindera aggregata (Sims) Kosterm var. playfairii (Hemsl.) H. P. Tsui | macrophanerophytes or shrub | |
| Corylus heterophylla var. sutchuenensi Franch. | macrophanerophytes or shrub | |
| Cotoneaster acuminatus Lindl. | shrub | |
| Picrasma quassioides (D. Don) Benn. | macrophanerophytes | |
| Quercus aliena var. acutiserrata Maximowicz ex Wenzig | macrophanerophytes | |
| Fraxinus platypoda Oliv. | Late successional species group | macrophanerophytes |
| Acer mono Maxim. | macrophanerophytes | |
| Tilia oliveri | macrophanerophytes | |
| Toxicodendron vernicifluum (Stokes) F. A. Barkley | macrophanerophytes | |
| Quercus wutaishansea Mary | macrophanerophytes | |
| Ulmus bergmanniana C. K. Schneid. | macrophanerophytes | |
| Tilia oliveri Szyszyl. | macrophanerophytes | |
| Pinus armandii Franch. | macrophanerophytes | |
| Tilia chinensis Maxim. | macrophanerophytes | |
| Ulmus davidiana Planch. var. japonica(Rehd.) Nakai | macrophanerophytes | |
| Sorbus koehneana C. K. Schneid. | macrophanerophytes or shrub | |
| Betula platyphylla Sukaczev | Pioneer Species Group | macrophanerophytes |
| Populus purdomii Rehder | macrophanerophytes | |
| Lindera obtusiloba Blume | shrub |
References
- Condit, R. Research in large, long-term tropical forest plots. Trends Ecol. Evol. 1995, 10, 18–22. [Google Scholar] [CrossRef] [PubMed]
- Takahashi, K.; Mitsuishi, D.; Uemura, S.; Suzuki, J.-I.; Hara, T. Stand structure and dynamics during a 16-year period in a sub-boreal conifer–hardwood mixed forest, northern Japan. For. Ecol. Manag. 2003, 174, 39–50. [Google Scholar] [CrossRef]
- Ke-Ping, M.A. Large Scale Permanent Plots: Important Platform for Long Term Research on Biodiversity in Forest Ecosystem. Chin. J. Plant Ecol. 2008, 32, 237. [Google Scholar]
- Yamada, T.; Aiba, S.I.; Kubota, Y.; Okubo, K.; Miyata, I.; Suzuki, E.; Maenaka, H.; Nagano, M. Dynamics of species diversity in a Japanese warm-temperate secondary forest. Ecosphere 2011, 2, 1–19. [Google Scholar] [CrossRef]
- Feeley, K.J.; Davies, S.J.; Perez, R.; Hubbell, S.P.; Foster, R.B. Directional changes in the species composition of a tropical forest. Ecology 2011, 92, 871–882. [Google Scholar] [CrossRef] [PubMed]
- Gaines, S.D.; Denny, M.W. The largest, smallest, highest, lowest, longest, and shortest: Extremes in ecology. Ecology 1993, 74, 1677. [Google Scholar] [CrossRef]
- Sheil, D.; Jennings, S.; Savill, P. Long-term permanent plot observations of vegetation dynamics in Budongo, a Ugandan rain forest. J. Trop. Ecol. 2000, 16, 865–882. [Google Scholar] [CrossRef]
- Condit, R.; Hubbell, S.P.; Foster, R.B. Short-Term Dynamics of a Neotropical Forest. Bioscience 1992, 42, 822–828. [Google Scholar] [CrossRef]
- Condit, R. Ecological Implications of Changes in Drought Patterns: Shifts in Forest Composition in Panama. Clim. Chang. 1998, 39, 413–427. [Google Scholar] [CrossRef]
- Peng, S.; Fang, W.; Ren, H.; Huang, Z.; Zhang, D. The Dynamics on Organization in the Successional Process of Dinghushan Cryptocarya Community. Chin. J. Plant Ecol. 1998, 22, 245. [Google Scholar]
- Rees, M.; Condit, R.; Crawley, M.; Pacala, S.; Tilman, D. Long-term studies of vegetation dynamics. Science 2001, 293, 650–655. [Google Scholar] [CrossRef]
- Laurance, W.F.; Oliveira, A.A.; Laurance, S.G.; Condit, R.; Nascimento, H.E.M.; Sanchez-Thorin, A.C.; Lovejoy, T.E.; Andrade, A.; D’Angelo, S.; Ribeiro, J.E. Pervasive alteration of tree communities in undisturbed Amazonian forests. Nature 2004, 428, 171–175. [Google Scholar] [CrossRef] [PubMed]
- Lewis, S.L.; Phillips, O.L.; Sheil, D.; Vinceti, B.; Baker, T.R.; Brown, S.; Graham, A.W.; Higuchi, N.; Hilbert, D.W.; Laurance, W.F. Tropical forest tree mortality, recruitment and turnover rates: Calculation, interpretation and comparison when census intervals vary. J. Ecol. 2004, 92, 929–944. [Google Scholar] [CrossRef]
- Weckel, M.; Tirpak, J.M.; Nagy, C.; Christie, R. Structural and compositional change in an old-growth eastern hemlock Tsuga canadensis forest, 1965–2004. For. Ecol. Manag. 2006, 231, 114–118. [Google Scholar] [CrossRef]
- Fauset, S.; Baker, T.R.; Lewis, S.L.; Feldpausch, T.R.; Affum-Baffoe, K.; Foli, E.G.; Hamer, K.C.; Swaine, M.D. Drought-induced shifts in the floristic and functional composition of tropical forests in Ghana. Ecol. Lett. 2012, 15, 1120–1129. [Google Scholar] [CrossRef] [PubMed]
- Holzmueller, E.J.; Gibson, D.J.; Suchecki, P.F. Accelerated succession following an intense wind storm in an oak-dominated forest. For. Ecol. Manag. 2012, 279, 141–146. [Google Scholar] [CrossRef]
- Marimon, B.S.; Felfili, J.M.; Fagg, C.W.; Marimon-Junior, B.H.; Umetsu, R.K.; Oliveira-Santos, C.; Morandi, P.S.; Lima, H.S.; Nascimento, A.R.T. Monodominance in a forest of Brosimum rubescens Taub. (Moraceae): Structure and dynamics of natural regeneration. Acta Oecologica 2012, 43, 134–139. [Google Scholar] [CrossRef]
- Ge, J.; Xiong, G.; Zhao, C.; Shen, G.; Xie, Z. Short-term dynamic shifts in woody plants in a montane mixed evergreen and deciduous broadleaved forest in central China. For. Ecol. Manag. 2013, 310, 740–746. [Google Scholar] [CrossRef]
- Shen, Y.; Santiago, L.S.; Ma, L.; Lin, G.J.; Lian, J.Y.; Cao, H.L.; Ye, W.H. Forest dynamics of a subtropical monsoon forest in Dinghushan, China: Recruitment, mortality and the pace of community change. J. Trop. Ecol. 2013, 29, 131–145. [Google Scholar] [CrossRef]
- Zhao, Z. Forest Naturalness Evaluation Method Based on Stand State Characters:A Case Study of Gansu Xiaolongshan Forests. Sci. Silvae Sin. 2011, 47, 9–16. [Google Scholar]
- Zhao, Z.H.; Hui, G.Y.; Yuan, S.Y.; Liu, W.Z. Tree Species Diversity and Structure Characteristics of Quercus aliena var. acuteserrata Natural Forest on Xiaolongshan. For. Res. 2008, 21, 605–610. [Google Scholar]
- Zhao, Z. Spatial Structure Characteristic of Quercus aliena var. acuteserrata Natural Forest in Xiaolongshan. Sci. Silvae Sin. 2009, 45, 1–6. [Google Scholar]
- Ma, Y.; Liu, W.; Zhao, Z.; Shi, X.; Li, A. Change Analysis of Spatial Pattern and Correlation for Quercus aliena var. acuteserrata Forest Population in Xiaolong Mountains. Acta Bot. Boreali-Occident. Sin. 2014, 34, 1878–1886. [Google Scholar]
- Mooney, H.A. Plants in Changing Environments: Linking Physiological, Population and Community Ecology. Tree Physiol. 1997, 17, 489. [Google Scholar] [CrossRef]
- Oliver, C.D.; Larson, B.C. Forest Stand Dynamics; Updated Edition; John Wiley & Sons: Hoboken, NJ, USA, 1996. [Google Scholar]
- Allen, C.D.; Breshears, D.D. Drought-induced shift of a forest–woodland ecotone: Rapid landscape response to climate variation. Proc. Natl. Acad. Sci. USA 1998, 95, 14839–14842. [Google Scholar] [CrossRef] [PubMed]
- Clark, D.B.; Clark, D.A.; Oberbauer, S.F. Annual wood production in a tropical rain forest in NE Costa Rica linked to climatic variation but not to increasing CO2. Glob. Chang. Biol. 2010, 16, 747–759. [Google Scholar] [CrossRef]
- Feeley, K.J.; Wright, S.J.; Supardi, M.N.N.; Kassim, A.R.; Davies, S.J. Decelerating growth in tropical forest trees. Ecol. Lett. 2007, 10, 461–469. [Google Scholar] [CrossRef]
- Phillips, O.L.; Baker, T.R.; Arroyo, L.; Higuchi, N.; Vinceti, B. Pattern and process in Amazon tree turnover, 1976–2001. Philos. Trans. R. Soc. B Biol. Sci. 2004, 359, 381–407. [Google Scholar] [CrossRef]
- Breshears, D.D.; Myers, O.B.; Meyer, C.W.; Barnes, F.J.; Zou, C.B.; Allen, C.D.; McDowell, N.G.; Pockman, W.T. Tree die-off in response to global change-type drought: Mortality insights from a decade of plant water potential measurements. Front. Ecol. Environ. 2009, 7, 185–189. [Google Scholar] [CrossRef]
- van Mantgem, P.J.; Stephenson, N.L.; Byrne, J.C.; Daniels, L.D.; Franklin, J.F.; Fule, P.Z.; Harmon, M.E.; Larson, A.J.; Smith, J.M.; Taylor, A.H.; et al. Widespread increase of tree mortality rates in the western United States. Science 2009, 323, 521–524. [Google Scholar] [CrossRef]
- Peng, C.; Ma, Z.; Lei, X.; Zhu, Q.; Chen, H.; Wang, W.; Liu, S.; Li, W.; Fang, X.; Zhou, X. A drought-induced pervasive increase in tree mortality across Canada’s boreal forests. Nat. Clim. Chang. 2011, 1, 467–471. [Google Scholar] [CrossRef]
- Breshears, D.D.; Cobb, N.S.; Rich, P.M.; Price, K.P.; Allen, C.D.; Balice, R.G.; Romme, W.H.; Kastens, J.H.; Floyd, M.L.; Belnap, J. Regional vegetation die-off in response to global-change-type drought. Proc. Natl. Acad. Sci. USA 2005, 102, 15144–15148. [Google Scholar] [CrossRef] [PubMed]
- Woods, K.D. Dynamics in late-successional hemlock–hardwood forests over three decades. Ecology 2000, 81, 110–126. [Google Scholar]
- Wang, M.; Shu, L.; Wang, Q.; Zhao, F.; Tian, X.; Yan, H.; Du, J. Forest fire occurrence in short term under the impacts of snow damage in south China—Case study in Hunan Province. Sci. Silvae Sin 2008, 44, 64–68. [Google Scholar]
- Cao, K.-F.; Chang, J. The ecological effects of an unusual climatic disaster: The destruction to forest ecosystems by the extremely heavy glaze and snow storms occurred in early 2008 in southern China. Chin. J. Plant Ecol. 2010, 34, 123. [Google Scholar]
- Chen, Y.; Niu, S.; Zhao, X.; He, J.; Fan, J.; Mao, S. Damage and recovery of a evergreen broadleaved forest in Jiulianshan National Nature Reserve after affected by freezing rain. J. Northeast. For. Univ. 2011, 39, 20–34. [Google Scholar]
- Su, Z.; Liu, G.; Ou, Y.; Li, Z. Storm damage in a montane evergreen broadleaved forest of Chebaling National Nature Reserve, South China. Chin. J. Plant Ecol. 2010, 34, 213–222. (In Chinese) [Google Scholar]
- Wang, J.; Wen, X.F.; Wang, H.M.; Wang, J.Y. The effects of ice storms on net primary productivity in a subtropical coniferous plantation. Acta Ecol. Sin. 2014, 34, 5030–5039. [Google Scholar]
- Ning, S.A.; Zhen, J.T.; Hua, Z.J.; Hua, W.Q. Analysis of biodiversity characteristics of Quercus aliena var. acuteserrata community on Mt.Xiaolong in Gansu. Acta Bot. Boreali-Occident. Sin. 2004, 24, 1877–1881. [Google Scholar]
- Anning, S.; Tianzhen, J.U.; Junhua, Z.; Jianping, G.E. Biomass structure of Quercus aliena var. acuteserrata community on Mt.Xiaolongshan in Gansu. Chin. J. Ecol. 2005, 4, 377. [Google Scholar]
- Editorial Committee of English Version; Li, L.; Yang, Q.; Li, F.Y. Vegetation of China; China Agricultural University Press: Beijing, China, 2020. [Google Scholar]
- Zhang, G.; Wang, D.; Zhang, M.; Liu, W.; Guo, X. Interspecific Association and Correlation of Main Species in the Succession Process of Pine Oak Forest Community on the South-facing Slopes in Qinling Mountain. Acta Bot. Boreali-Occident. Sin. 2015, 35, 1657–1668. [Google Scholar]
- Shannon, C.E.; Weaver, W. The Mathematical Theory of Communication; University of Illinois Press: Urbana, IL, USA, 1963. [Google Scholar]
- Pielou, E.C. Ecological Diversity. A Wiley Interscience Publication; John Wiley & Sons: New York, NY, USA; London, UK; Sydney, Australia; Toronto, ON, Canada, 1975. [Google Scholar]
- Lévesque, M.; McLaren, K.P.; McDonald, M.A. Recovery and dynamics of a primary tropical dry forest in Jamaica, 10 years after human disturbance. For. Ecol. Manag. 2011, 262, 817–826. [Google Scholar] [CrossRef]
- Cascante-Marín, A.; Meza-Picado, V.; Estrada-Chavarría, A. Tree turnover in a premontane neotropical forest (1998–2009) in Costa Rica. Plant Ecol. 2011, 212, 1101–1108. [Google Scholar] [CrossRef]
- Kolmogorov, A. Sulla determinazione empirica di una lgge di distribuzione. Inst. Ital. Attuari Giorn. 1933, 4, 83–91. [Google Scholar]
- Smirnoff, N.W. On the estimation of the discrepancy between empirical curves of distribution for two independent samples. Bull. Math. Univ. Moscou 1939, 2, 3–14. [Google Scholar]
- Van Lieshout, M.N.M. Book Review: Statistical Analysis and Modelling of Spatial Point Patterns. By J. Illian, A. Penttinen, H. Stoyan, and D. Stoyan. Biom. J. 2008, 50, 627. [Google Scholar] [CrossRef]
- Pommerening, A.; Stoyan, D. Edge-correction needs in estimating indices of spatial forest structure. Can. J. For. Res. 2006, 36, 1723–1739. [Google Scholar] [CrossRef]
- Wickham, H.; Chang, W. Package ggplot2: Create Elegant Data Visualisations Using the Grammar of Graphics; Springer: Cham, Switzerland, 2016. [Google Scholar]
- Seidl, R.; Thom, D.; Kautz, M.; Martin-Benito, D.; Peltoniemi, M.; Vacchiano, G.; Wild, J.; Ascoli, D.; Petr, M.; Honkaniemi, J.; et al. Forest disturbances under climate change. Nat. Clim. Chang. 2017, 7, 395–402. [Google Scholar] [CrossRef] [PubMed]
- Enquist, B.J.; Enquist, C.A. Long-term change within a Neotropical forest: Assessing differential functional and floristic responses to disturbance and drought. Glob. Chang. Biol. 2011, 17, 1408–1424. [Google Scholar] [CrossRef]
- Mori, A.S.; Mizumachi, E.; Komiyama, A. Roles of disturbance and demographic non-equilibrium in species coexistence, inferred from 25-year dynamics of a late-successional old-growth subalpine forest. For. Ecol. Manag. 2007, 241, 74–83. [Google Scholar] [CrossRef]
- Lewis, S.L.; Lloyd, J.; Sitch, S.; Mitchard, E.T.A.; Laurance, W.F. Changing Ecology of Tropical Forests: Evidence and Drivers. Annu. Rev. Ecol. Evol. Syst. 2009, 40, 529–549. [Google Scholar] [CrossRef]
Figure 1.
Location of the study area.

Figure 2.
Importance value index changes of different successional groups during the study periods. ESS: early successional species; PS: pioneer species; and LSS: late-successional species.
Figure 2.
Importance value index changes of different successional groups during the study periods. ESS: early successional species; PS: pioneer species; and LSS: late-successional species.

Figure 3.
Diameter distributions of living trees in different census times.

Figure 4.
The living tree distribution patterns of plot (A) (top), plot (B) (middle) and plot (C) (bottom) at different census times. The envelopes (bule\yellow\orange) were constructed from the 2.5% and 97.5% quantiles of 999 Monte Carlo simulations based on the complete spatial randomness null model.

Figure 5.
Distribution patterns showing the relationships of dead and living individuals in plot (A) (top), plot (B) (middle), and plot (C) (bottom) at different census times. The envelopes (bule\yellow) were constructed from the 2.5% and 97.5% quantiles of 999 Monte Carlo simulations based on the complete spatial randomness null model.

Table 1.
The composition of tree species in three plots across different census times.
| Plot | Census Time/Year | Density/Trees·ha−1 | Tree Species Number | Tree Species Composition |
|---|---|---|---|---|
| Plot A | 2007 | 1356 | 49 | 4 Quercus aliena 1 Acer davidii. 5 Other |
| 2012 | 1247 | 47 | 4 Quercus aliena 1 Rhusverniciflus 5 Other | |
| 2017 | 1178 | 46 | 4 Quercus aliena 1 Rhusverniciflus 5 Other | |
| Plot B | 2009 | 1276 | 49 | 4 Quercus aliena 1 Carpinus turczaninowii 5 Other |
| 2014 | 1265 | 50 | 4 Quercus aliena 1 Carpinus turczaninowii 5 Other | |
| 2019 | 1275 | 48 | 4 Quercus aliena 1 Carpinus turczaninowii 5 Other | |
| Plot C | 2009 | 1009 | 48 | 3 Quercus aliena 1 Carpinus turczaninowii 1 Sorbus alnifolia 1 Carpinus stipulata 4 Other |
| 2014 | 1068 | 50 | 3 Quercus aliena 1 Carpinus turczaninowii 1 Sorbus alnifolia 1 Carpinus stipulata 4 Other | |
| 2019 | 1085 | 51 | 3 Quercus aliena 1 Carpinus turczaninowii 1 Sorbus alnifolia 1 Carpinus stipulata 4 Other |
Table 2.
Plot characters and diversity across different census times.
| Plot | Census Time/Year | Basal Area/m2·ha−1 | Canopy Closure | Mean DBH/ cm | Mean Height/m | Diversity and Evenness | |||
|---|---|---|---|---|---|---|---|---|---|
| Shannon–Wiener (Stem) | Shannon–Wiener (Basal Area) | Pielou (Stem) | Pielou (Basal Area) | ||||||
| Plot A | 2007 | 22.786 | 0.80 | 14.6 ± 8.0 | 11.9 | 2.911 | 2.571 | 0.748 | 0.661 |
| 2012 | 24.861 | 0.80 | 15.9 ± 8.2 | 12.5 | 2.901 | 2.492 | 0.754 | 0.647 | |
| 2017 | 26.500 | 0.85 | 16.9 ± 8.8 | 13.1 | 2.901 | 2.480 | 0.758 | 0.648 | |
| Plot B | 2009 | 34.337 | 0.85 | 18.5 ± 10.4 | 12.7 | 3.069 | 2.370 | 0.788 | 0.609 |
| 2014 | 37.244 | 0.85 | 19.4 ± 11.0 | 13.3 | 3.060 | 2.340 | 0.782 | 0.598 | |
| 2019 | 39.795 | 0.90 | 19.9 ± 11.3 | 13.6 | 3.057 | 2.308 | 0.790 | 0.596 | |
| Plot C | 2009 | 18.195 | 0.80 | 15.2 ± 8.3 | 11.2 | 3.135 | 2.816 | 0.810 | 0.727 |
| 2014 | 21.230 | 0.80 | 15.9 ± 8.7 | 10.9 | 3.147 | 2.844 | 0.804 | 0.727 | |
| 2019 | 23.559 | 0.85 | 16.6 ± 9.1 | 11.0 | 3.152 | 2.847 | 0.802 | 0.724 | |
Table 5.
The characteristics of living trees and added dead trees across different census times.
| Plot | Census Time/Year | Living Trees | Dead Trees | ||||||
|---|---|---|---|---|---|---|---|---|---|
| Density/ Trees·ha−1 | Mean DBH/cm | Mean Height/m | Tree Species Number | Density/ Trees·ha−1 | Mean DBH/cm | Mean Height/m | Tree Species Number | ||
| Plot A | 2007 | 1356 | 14.6 b | 11.9 b | 49 | - | - | - | - |
| 2012 | 1247 | 15.9 b | 12.5 b | 47 | 111 | 13.1 | 9.7 | 16 | |
| 2017 | 1178 | 16.9 b | 13.1 b | 46 | 89 | 11.3 | 10.6 | 14 | |
| Plot B | 2009 | 1276 | 18.5 a | 12.7 a | 49 | - | - | - | - |
| 2014 | 1265 | 19.4 a | 13.3 a | 50 | 66 | 10.6 | 9.3 | 24 | |
| 2019 | 1275 | 19.9 a | 13.6 a | 48 | 30 | 10.4 | 9.8 | 15 | |
| Plot C | 2009 | 1009 | 15.2 b | 11.2 b | 48 | - | - | - | - |
| 2014 | 1068 | 15.9 b | 10.9 b | 50 | 58 | 8.4 | 8.3 | 19 | |
| 2019 | 1085 | 16.6 b | 11.0 b | 51 | 27 | 10.7 | 9.3 | 11 | |
NOTES: Different letters after means in each plot indicate significant differences by One-Way ANOVA test at α = 0.05.
Disclaimer/Publisher’s Note: The statements, opinions and data contained in all publications are solely those of the individual author(s) and contributor(s) and not of MDPI and/or the editor(s). MDPI and/or the editor(s) disclaim responsibility for any injury to people or property resulting from any ideas, methods, instructions or products referred to in the content. |
© 2024 by the authors. Licensee MDPI, Basel, Switzerland. This article is an open access article distributed under the terms and conditions of the Creative Commons Attribution (CC BY) license (https://creativecommons.org/licenses/by/4.0/).
Share and Cite
MDPI and ACS Style
Lian, Q.; Sa, R.; Liu, W.; Zhao, Z. Structural and Successional Dynamics of Old-Growth Mixed Oak Forests in the West Qinling Mountains. Forests 2024, 15, 765. https://0-doi-org.brum.beds.ac.uk/10.3390/f15050765
AMA Style
Lian Q, Sa R, Liu W, Zhao Z. Structural and Successional Dynamics of Old-Growth Mixed Oak Forests in the West Qinling Mountains. Forests. 2024; 15(5):765. https://0-doi-org.brum.beds.ac.uk/10.3390/f15050765
Chicago/Turabian StyleLian, Qi, Rina Sa, Wenzhen Liu, and Zhonghua Zhao. 2024. "Structural and Successional Dynamics of Old-Growth Mixed Oak Forests in the West Qinling Mountains" Forests 15, no. 5: 765. https://0-doi-org.brum.beds.ac.uk/10.3390/f15050765
Note that from the first issue of 2016, this journal uses article numbers instead of page numbers. See further details here.