
Zinc-Enhanced Regulation of the Ginkgo biloba L. Response and Secondary Metabolites

1
State Key Laboratory of Tree Genetics and Breeding, Co-Innovation Center for Sustainable Forestry in Southern China, Nanjing Forestry University, Nanjing 210037, China
2
Suining County Runqi Investment Co., Ltd., Xuzhou 221225, China
*
Authors to whom correspondence should be addressed.
Forests 2024, 15(5), 759; https://0-doi-org.brum.beds.ac.uk/10.3390/f15050759
Submission received: 22 March 2024
/
Revised: 24 April 2024
/
Accepted: 24 April 2024
/
Published: 26 April 2024
(This article belongs to the Section Forest Ecophysiology and Biology)
Abstract
:Ginkgo biloba L. leaves are rich in secondary metabolites with important medicinal values; to increase their contents, foliar spraying of micronutrients is a potential strategy. Zinc, a multifunctional element, has a significant impact on the content of secondary metabolites in other plants, but relevant research into ginkgo is still lacking. In our study, different spraying time and concentration strategies were used to investigate the effects of zinc sulfate (ZnSO4) on physiological indicators and secondary metabolites of 2-year-old ginkgo. The results demonstrated that ZnSO4 could increase the contents of hydrogen peroxide, abscisic acid, and free amino acids in ginkgo leaves. It also enhances the antioxidant enzyme activity of ginkgo leaves, decreases the content of plant auxin, and ultimately facilitates the accumulation of ginkgo terpene lactones (TTL). Spraying ZnSO4 in June resulted in a more significant increase in the contents of TTL and flavonoids compared to spraying in August. After spraying 12 mmol/L ZnSO4 in June, the contents of TTL and flavonoids in ginkgo leaves were significantly elevated by 35.95% and 24.30%, respectively, compared to those in the CK (p < 0.05). The contents of ginkgolide A, B, and C were notably increased by 45.93%, 46.56%, and 74.29%, respectively, compared to those in the CK (p < 0.05). Therefore, our study suggests that the optimal timing for spraying ZnSO4 on ginkgo is in June, with a recommended concentration of 12 mmol/L. Our study provides a theoretical basis for the accumulation of secondary metabolites in ginkgo and guides the production of its leaf-utilization plantations.
1. Introduction
Ginkgo biloba L. is a deciduous tree species belonging to the Ginkgoaceae family and the Ginkgo genus. It is considered one of the oldest relict species among existing gymnosperms and is commonly referred to as a “living fossil” [1]. Ginkgo has high medicinal value, with ginkgo terpene lactones (TTL) and flavonoids being its main active medicinal compounds [2]. TTL can antagonize platelet-activating factor receptor (PAFR) [3] and protect nerves [4]. Flavonoids possess anti-inflammatory, antiviral, and neuroprotective biological properties [5]. These two compounds are widely used to treat cardiovascular and cerebrovascular diseases [6,7], as well as metabolic syndrome (MetS) [8]. They are also commonly used to treat asthma, bronchitis, ischemia, arteriosclerosis, and rheumatism [9]. The chemical components of ginkgo extract are complex, making chemical synthesis challenging. Currently, ginkgo extract is primarily derived from ginkgo leaves. As a result, current research is focused on increasing the concentrations of medicinal components in ginkgo leaves.
Zinc is an essential trace element for plant growth and development. It can bind to proteins and participate in various biological processes—such as transcription, translation, photosynthesis, and reactive oxygen species (ROS) metabolism—in plants [10]. Carbonic anhydrase is a zinc metalloenzyme that plays a crucial role in plant photosynthesis. Zinc deficiency can impair the function of carbonic anhydrase, impacting plant photosynthesis and carbohydrate metabolism regulation [11]. However, high levels of zinc can hinder the synthesis of photosynthetic pigments, leading to the inhibition of photosynthesis [12,13]. Zinc can indirectly impact the regulation of auxin by controlling the synthesis of tryptophan [14]. Additionally, studies have shown that excess zinc can increase the expression of auxin biosynthesis-related genes, resulting in auxin accumulation in the root tips of Arabidopsis thaliana [15]. As a heavy metal, zinc can decrease the activities of enzymes such as superoxide dismutase (SOD), ascorbate peroxidase (APX), and guaiacol peroxidase (GOPX) in plants [16]. This reduction in enzyme activity leads to a decrease in ROS production and oxidative damage [17], ultimately helping to alleviate salt-induced oxidative stress. However, excessive concentrations of zinc can overload the antioxidant defense system of plants, resulting in decreased plant antioxidant activity and lipid peroxidation [11]. Zinc fertilizer has been shown to improve plant protein metabolism and carbohydrate metabolism, promote plant growth and increase plant stress resistance [18,19]. Zinc is widely used in the research and quality improvement of Triticum aestivum L [20], Oryza sativa L. [21], Phaseolus vulgaris L. [18], Camellia sinensis L. [22], Dendrobium nobile L. [23], and other plants.
Plant secondary metabolism is a crucial process through which plants react to stressful environments, the generated metabolites play significant roles in enhancing plant resilience and adaptation to stress [24]. It has been proved that zinc can effectively trigger the biosynthesis of secondary metabolites [25]. Several studies have examined the impact of zinc stress on flavonoid metabolism in tea leaves [22]. Other studies have revealed a significant positive correlation between the zinc content in the soil and the terpene lactone content in ginkgo [26]. Additionally, moderate application of zinc has been found to improve the essential oil composition of Damask rose [27]. However, it has been observed that low concentrations of zinc promote the synthesis of flavonoids in Dendrobium nobile L., while high concentrations inhibit it [23]. These findings highlight the varying tolerances of different plant species to zinc. Currently, there is limited research available on the effects of zinc on the physiology and medicinal content of ginkgo. Several studies have shown that exogenous inducers such as methyl jasmonate [28], salicylic acid [29], and selenium [30] can notably increase the levels of TTL and flavonoids in ginkgo leaves. However, research on the impact of the trace element zinc on ginkgo physiology and secondary metabolites is still relatively limited. Studies have shown that zinc can stimulate the growth and development of ginkgo plants, and enhance the accumulation of flavonoids [31]. However, the impact of zinc on the physiological indicators and terpene lactone content of ginkgo leaves remain unclear, as well as the optimal application time and concentration of zinc. Therefore, our study utilized foliar spraying to treat ginkgo seedlings with varying concentrations of ZnSO4 at different application times. Considering the optimal harvesting time for ginkgo flavonoids and terpene lactones, the leaves were harvested in September [32], and their physiological indicators and secondary metabolite contents were analyzed. The research findings indicated that foliar spraying 12 mmol/L ZnSO4 to ginkgo in June resulted in the greatest increases in flavonoid and TTL. Our study provided initial insights into the impact of zinc on ginkgo plants, specifying the optimal timing and concentration of ZnSO4 for ginkgo seedlings. These results provide a theoretical foundation for enhancing ginkgo leaf production and utilizing zinc fertilizer effectively, while also shedding light on the role of zinc in ginkgo secondary metabolism pathways.
2. Materials and Methods
2.1. Plant Materials and Test Sites
The experiment was conducted from March to October 2022 in a glass greenhouse at Xia Shu Forest Farm, Nanjing Forestry University, located in Jurong City, Jiangsu Province (119°13′ E, 32°7′ N), which has a subtropical monsoon climate. The average annual temperature is 15.4 °C, and there is ample sunshine. Biennial ginkgo seedlings sourced from Xuzhou City, Jiangsu Province, China, were utilized as test subjects. The polyethylene plastic, round cone-shaped pots used for the experiment had an upper inner diameter of 26 cm, a lower inner diameter of 21 cm, and a height of 28 cm, with holes cut out of the bottoms and trays to prevent nutrient drainage. The potting substrate consisted of a mixture of local yellow loam soil from Jurong city and nutrient soil in a 2:1 (v/v) ratio. The organic carbon content of the local yellow loam soil was 21.60 g/kg, total nitrogen content was 1.47 g/kg, and the total phosphorus content was 0.12 g/kg. The nutrient soil, purchased from Huai’an Green Land Base Fertilizer Factory, had a total nutrient content of ≥2% and a total organic matter content of ≥28%. In March, ginkgo plants were transplanted into plastic pots and placed in a glass greenhouse for acclimatization, for approximately 3 months. In June, ginkgo plants showing uniform growth and no signs of disease (with an average plant height of 49.29 cm and average ground diameter of 12.41 mm) were selected for foliar zinc application experiments.
2.2. Treatment
In this experiment, zinc sulfate (chemically pure ZnSO4) was sprayed with 0.01% Tween 80 (m/v, chemically pure) to promote the absorption and utilization of zinc by the leaves. Our study adopted a two-factor, completely randomized experimental design (Table 1). Three time-based treatment groups were set up: group A (June 2), group B (August 2), and group C (both June 2 and August 2). Four concentrations of ZnSO4 solution were prepared: 6 mmol/L (T1), 12 mmol/L (T2), 18 mmol/L (T3), and 24 mmol/L (T4), with 0 mmol/L (CK) as the blank control. A total of 13 treatments were applied, with 15 plants in each treatment. Every 5 plants served as a biological replicate, resulting in a total of 3 biological replicates. Each treatment involved spraying 1 L of ZnSO4 solution on the leaves. Plants for all treatments were placed in the same seedbed and subjected to the same management practices. After measuring the ginkgo, relative chlorophyll content (SPAD values) and photosynthetic parameters were measured on 22 September 2022, when the whole ginkgo leaves were collected. Leaves from the same biological replicate were mixed and divided into two portions. One portion was quickly frozen in a box of dry ice and stored in a −80 °C ultralow temperature freezer for measurement of physiological indicators. The other portion was dried at 105 °C for 30 min, followed by drying at 60 °C to a constant weight. The dried leaves were then ground and passed through a 40-mesh sieve for determination of secondary metabolite content.
2.3. Measurements of Physiological Indicators of Ginkgo Leaves
Each treatment consisted of three biological replicates, with three randomly selected plants per replicate. From each plant, three middle and upper mature leaves of ginkgo plants were chosen for the measurement of SPAD values and photosynthetic parameters. The SPAD values of the leaves was measured using a portable leaf chlorophyll meter (SPAD-502 PLUS, Zhejiang Top Cloud-Agri Technology Co., Ltd., Hangzhou, China). To measure the photosynthetic parameters of ginkgo leaves, including the net photosynthetic rate (Pn), transpiration rate (Tr), stomatal conductance (Gs), and intercellular CO2 concentration (Ci), a CIRAS-3 portable photosynthesis meter (Hansha Scientific Instruments) was used.
The anthrone colorimetric method was used to determine the soluble sugar (SS) and starch contents in ginkgo leaves [33]. The Coomassie Brilliant Blue (G-250) method was used to determine the total protein content [33,34]. Enzyme-linked immunoassays were used to determine the content of endogenous hormones, which included gibberellin (GA3), zeatin (ZR), growth hormone (IAA), and abscisic acid (ABA) [35]. The total flavonoid content of the ginkgo leaves was determined following the method described by Xia et al. [36]. The contents of TTL, which included bilobalide (BB), ginkgolide A (GA), ginkgolide B (GB), and ginkgolide C (GC), were determined using the methods described in the 2020 edition of the “Pharmacopoeia of People’s Republic of China” and by Su et al. [37]. The following physiological indicators were tested using kits from Nanjing Jiancheng Biotechnology Research Institute Co., Ltd., Nanjing, China, following the manufacturer’s instructions. The reduced glutathione (GSH) content was determined using the 2-nitrobenzoic acid (DTNB) method [38] (Kit A006-2-1), while the malondialdehyde (MDA) content was measured using the thiobarbituric acid (TBA) method [39] (Kit A003-1-1). The hydrogen peroxide (H2O2) content was assessed through a molybdic acid reaction (Kit A064-1-1), the peroxidase (POD) activity was determined using the guaiacol method [40] (Kit A084-3-1), and the SOD activity was measured through the hydroxylamine method [41] (Kit A001-1-2). Finally, the free amino acid (FAA) content was calculated through a copper ion complexation reaction (Kit A026-1-1).
2.4. Statistical Analysis
The experimental data were organized using Excel 2019 software and analyzed with IBM SPSS Statistics 26.0 software (IBM Corp., Armonk, NY, USA). ANOVA was conducted on three zinc-treated time groups labeled as A, B, and C. Two-way ANOVA was conducted on zinc application time (with treatment levels A, B, and C) and different zinc spray concentrations (with treatment levels CK, T1, T2, T3, and T4). The Sidak multiple comparison method was employed to test the significance of the differences. The experimental data are presented as means and standard deviations (means ± SDs, n = 3). Graphs were generated, and correlation analysis and principal component analyses were carried out using Origin 2023 software (Origin Lab, Inc., Northampton, MA, USA).
3. Results
3.1. Effects of Different Times and Zinc Concentrations on the Photosynthesis and Gas Exchange in Ginkgo Leaves
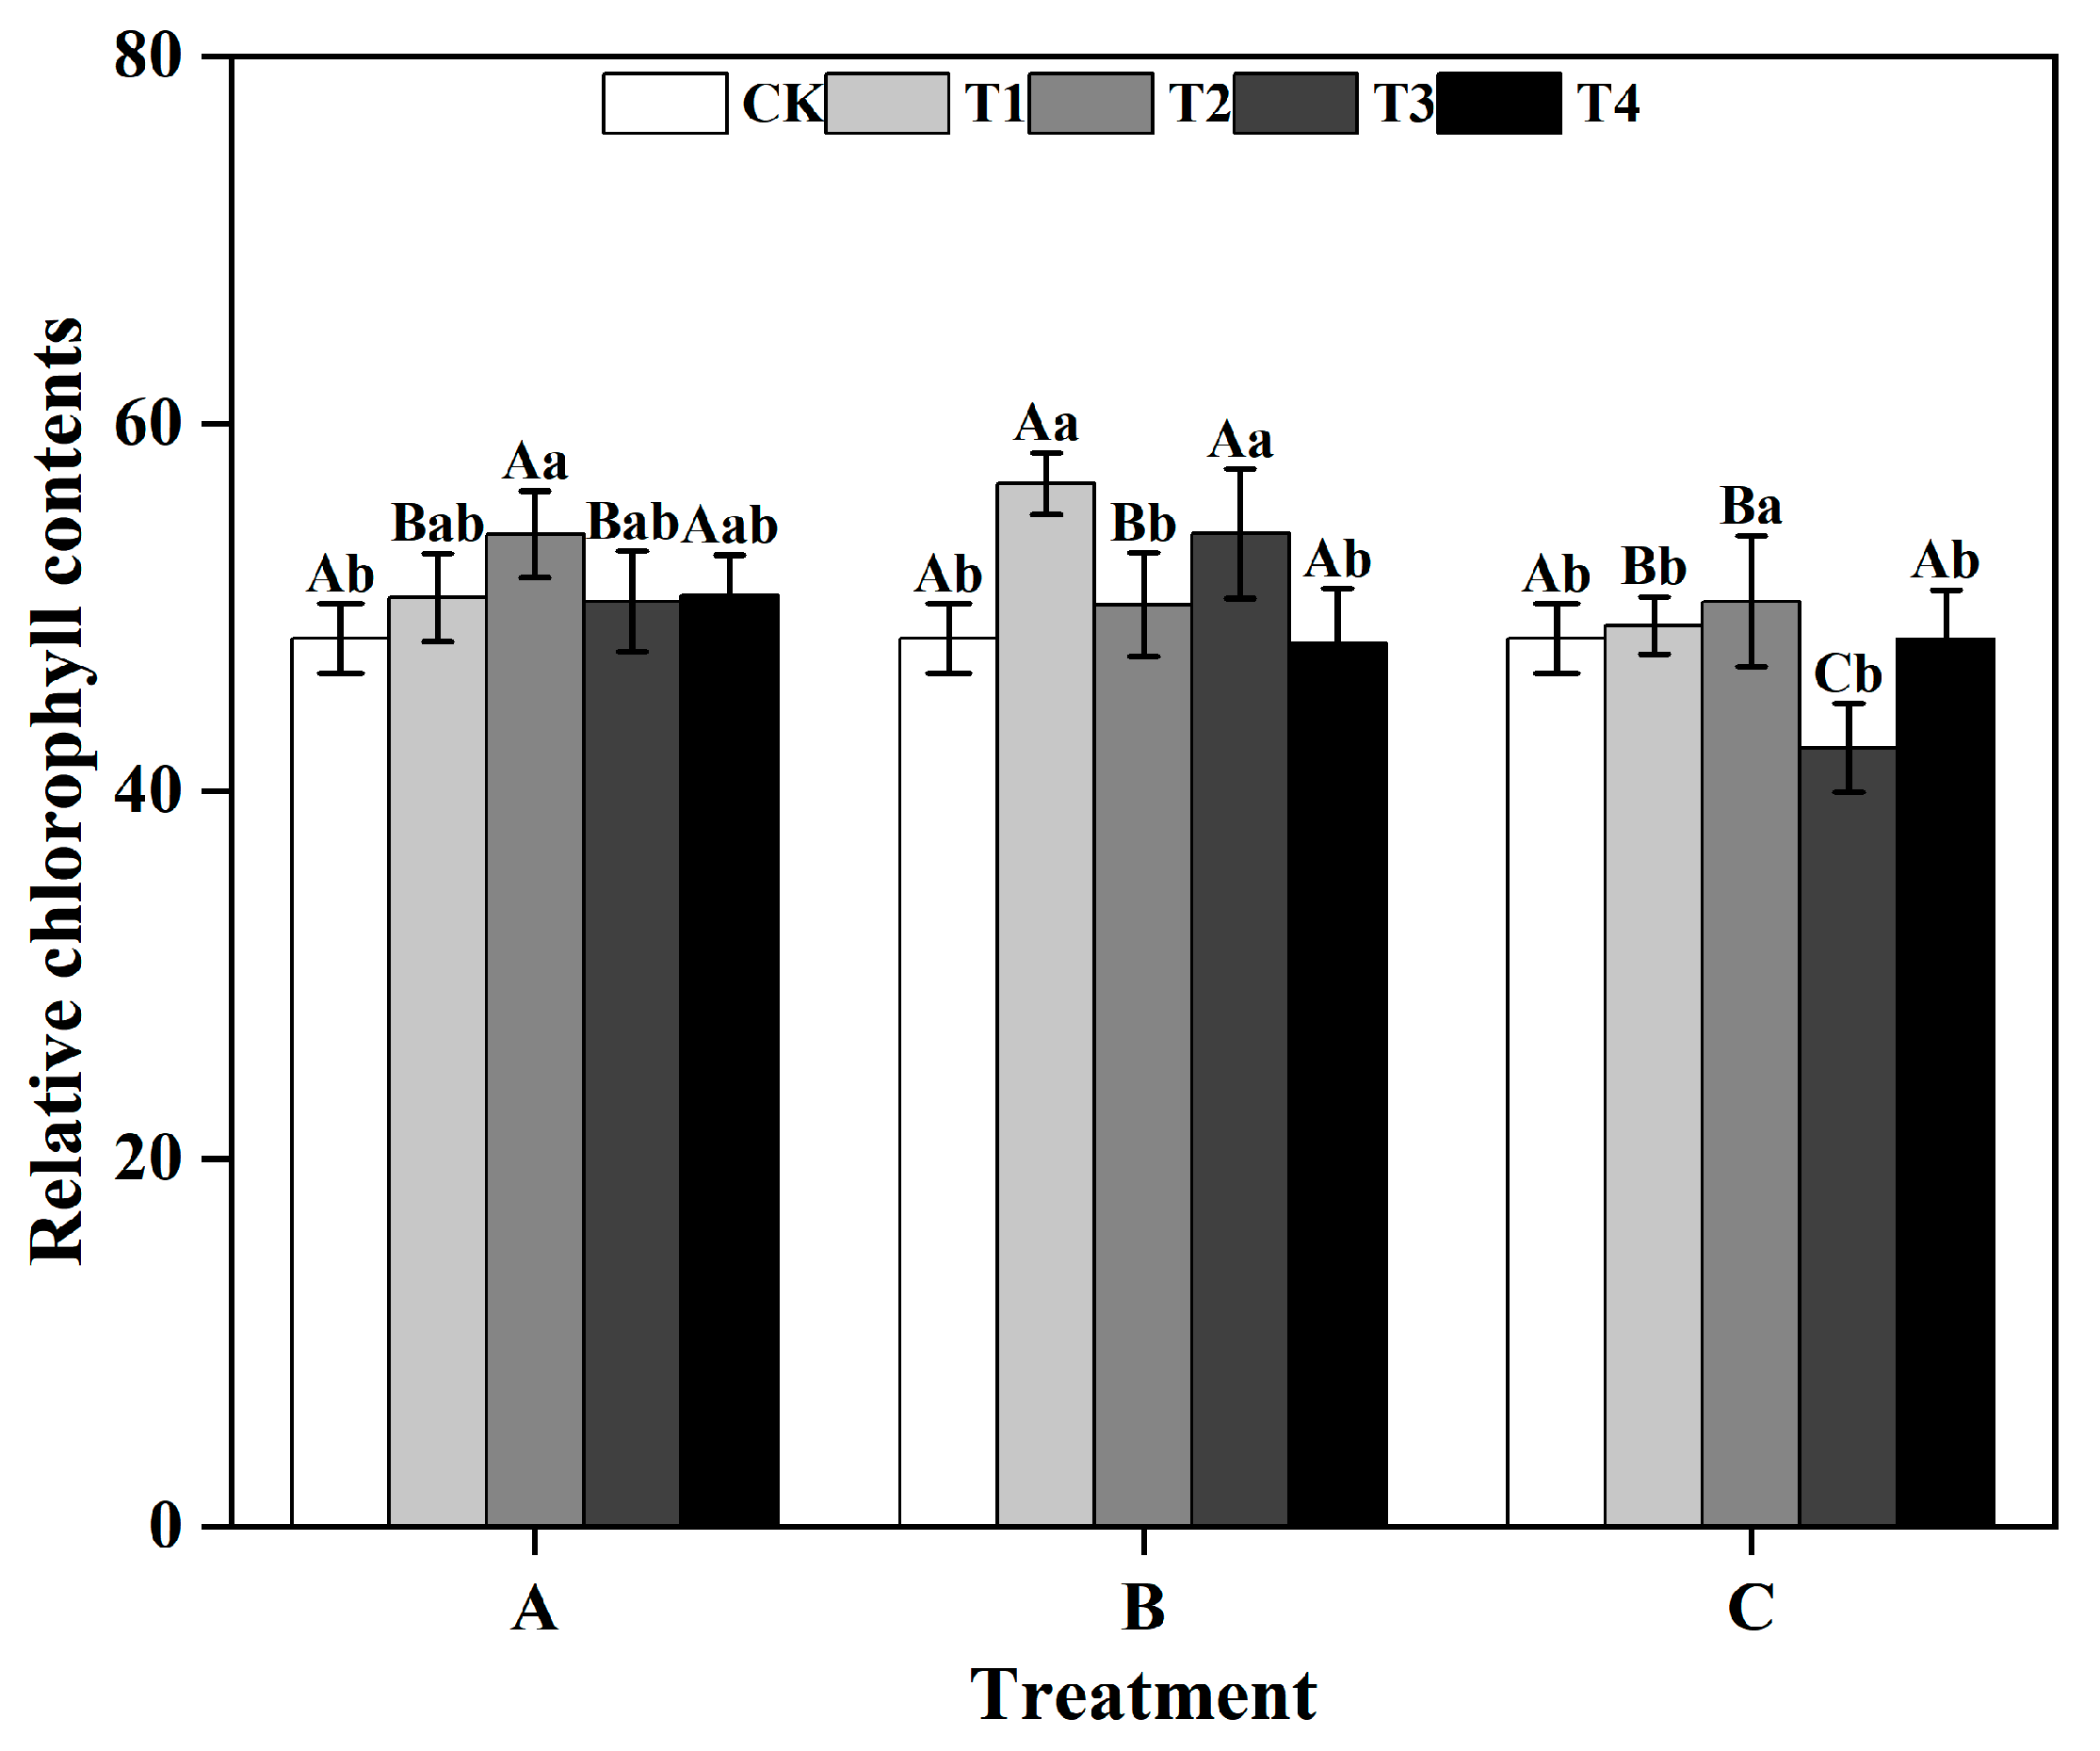
From a group perspective, during the T1 and T3, the SPAD values of ginkgo leaves in group B were significantly greater than those in groups A and C. Similarly, during the T2, the SPAD values of ginkgo leaves in group A was significantly greater than that those in groups B and C (p < 0.05) (Figure 1). Within groups, in groups A and C, the SPAD values of ginkgo leaves reached their highest level under the T2, which were significantly greater than those under the other treatments (p < 0.05). In group B, both the T1 and T3 significantly improved the SPAD values of ginkgo leaves (p < 0.05), resulting in increases of 17.46% and 11.79%, respectively, compared to those in the CK.
Between groups, the Pn and gs levels of the plants in zinc-treated group A were significantly greater than those in zinc-treated group B (Figure 2a,c), and the E of the plants in the zinc-treated group C was significantly greater than that of zinc-treated group B (p < 0.05) (Figure 2d). Within groups, in group A, there were no significant differences in the photosynthetic indicators of ginkgo leaves under the different zinc concentrations. However, in group B, the Pn of the ginkgo leaves in the T2 and T3 treatments were significantly lower than that in the CK treatment (p < 0.05) (Figure 2a). In group C, both the Ci and E of ginkgo leaves reached their lowest levels in the T2 as the zinc concentration increased and reached their highest levels in the T3 (Figure 2b,d).
3.2. Effects of Different Times and Zinc Concentrations on the Enzyme Activity and Antioxidant Capacity of Ginkgo Leaves
Between groups, in the T1, T2, and T3, the POD activity levels of group B were significantly greater than those of groups A and C (p < 0.05), reaching 216.18 U g−1 FW, 245.39 U g−1 FW, and 221.32 U g−1 FW, respectively. However, in the T4, the POD activity of group C significantly increased (p < 0.05), showing 38.81% and 49.83% greater POD activity than those of groups A and B, respectively. Within groups, in groups A and C, the POD activity levels of T4 ginkgo leaves were significantly greater than that of CK leaves (p < 0.05). Conversely, in group B, the POD activity levels in the T1, T2, and T3 ginkgo leaves were significantly increased compared with that in the CK leaves (p < 0.05), while POD activity did not significantly differ among the T4 ginkgo leaves (Figure 3a). Between groups, the SOD activity of group A was generally greater than those of groups B and C. Specifically, in the T1, T2, and T4, the SOD activity levels of group A were significantly greater than those of groups B and C (p < 0.05) (Figure 3b). Within groups, the SOD activity in the zinc application group A was significantly greater than that in the CK (p < 0.05) and remained relatively stable. Conversely, the SOD activity levels of groups B and C initially increased as the spray concentration increased, reaching the highest level in the T3, and then decreased.
Between groups, the GSH content of ginkgo plants in the zinc application group C was significantly greater than those in zinc-treated groups, A and B (p < 0.01) (Figure 3c). Within groups, in group B, the GSH content of ginkgo leaves reached its peak during the T3, showing a significant increase of 33.33% compared to that in the CK treatment (p < 0.05). Moreover, the GSH content of ginkgo leaves in the zinc application group C exhibited a consistent upward trend with increasing zinc concentration, significantly surpassing that in the CK (p < 0.05). Between groups, the MDA content of ginkgo plants in zinc application group B was significantly greater than those in zinc application groups A and C (p < 0.05) (Figure 3d). Within groups, zinc-treated group A had significantly lower MDA content than the CK (p < 0.05), with the lowest levels observed in the T3, representing a 54.75% decrease. Conversely, the MDA content of the ginkgo leaves in group B peaked under T2, showing a significant 27.65% increase compared to that in the CK treatment (p < 0.05). Group C exhibited a pattern of initial decrease followed by an increase in the MDA content with increasing zinc concentration, with significantly lower MDA contents in T1 and T2 than in the CK treatment (p < 0.05).
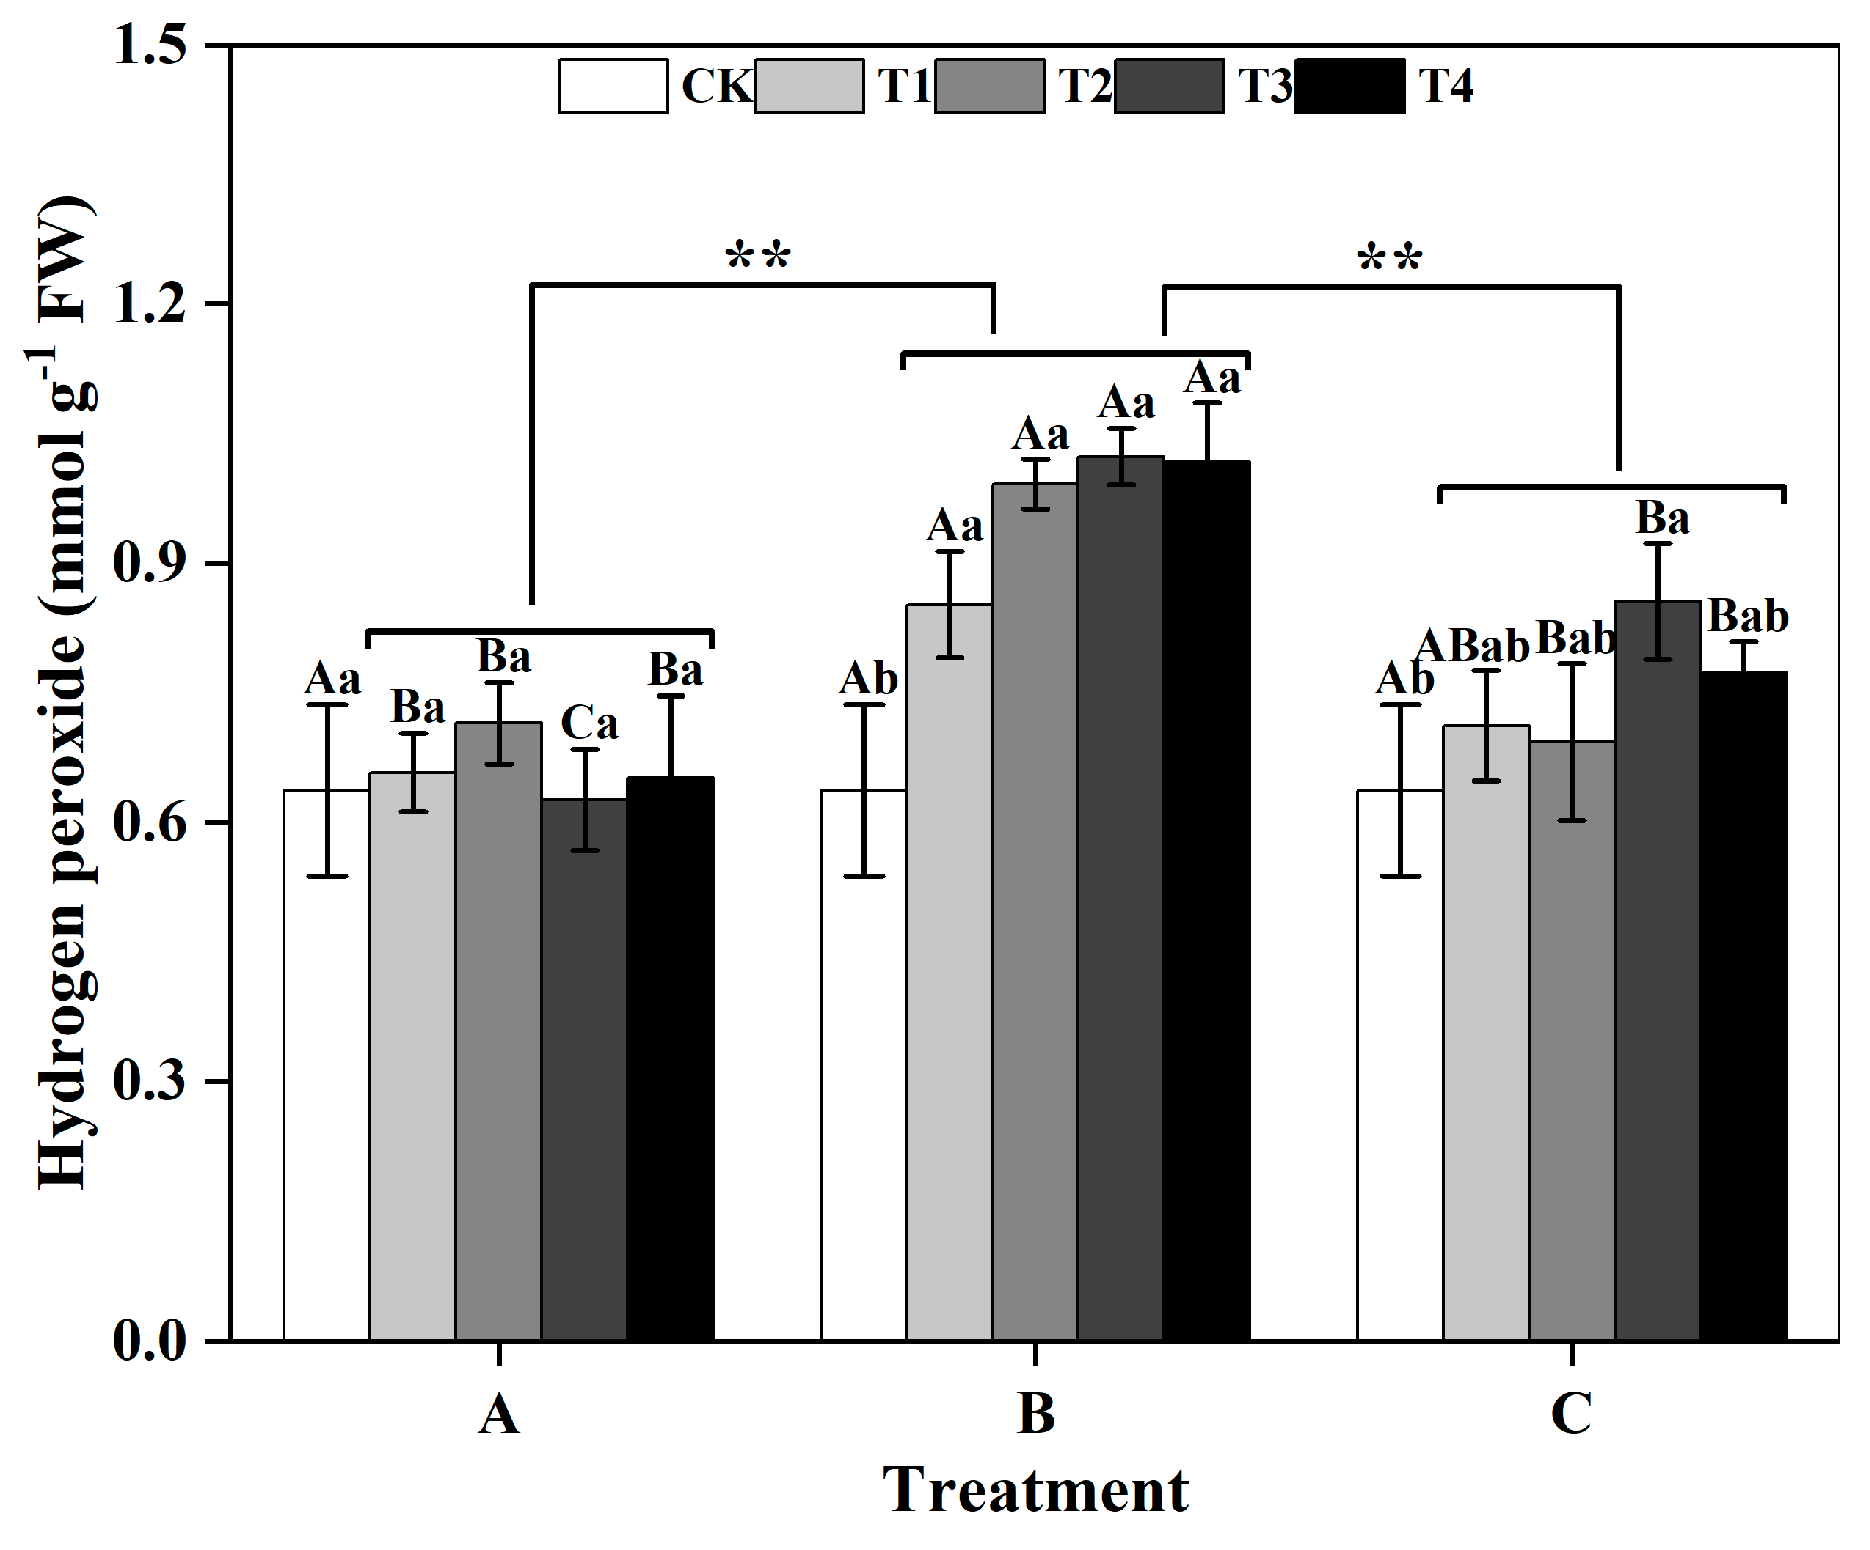
Among groups, the H2O2 content of ginkgo leaves in the zinc-treated group B was significantly greater than those in the zinc-treated groups A and C (p < 0.01) (Figure 4). Within group B, there was an increasing trend in the H2O2 content of ginkgo leaves as the zinc concentration increased. Compared with those in the CK treatment, the H2O2 contents in the ginkgo leaves in T1, T2, T3, and T4 significantly increased by 32.81%, 54.69%, 59.38%, and 59.38%, respectively (p < 0.05).
3.3. Effects of Different Times and Zinc Concentrations on the Endogenous Hormones of Ginkgo Leaves
Among groups, treatment at different times did not significantly affect the contents of GA3, IAA, or ABA in ginkgo leaves (Figure 5a,c,d). However, the ZR content of ginkgo leaves in zinc-treated group B was notably greater than those in zinc-treated groups A and C (Figure 5b) (p < 0.05). From the within-group perspective, zinc application did not significantly impact the GA3 contents of ginkgo leaves in the different time groups (Figure 5a). In T3 and T4 of group A, the ZR contents of ginkgo leaves were significantly lower than those of CK leaves, while the ABA contents were notably greater than those of CK leaves (Figure 5b,d) (p < 0.05). The ZR and ABA contents in the zinc-treated ginkgo leaves of group B were both greater than those in the CK. In group B, the ZR content of ginkgo leaves at T3 increased significantly by 34.62% (p < 0.05), and the ABA content of ginkgo leaves at T4 increased significantly by 63.66% (p < 0.05). The ZR and ABA contents in the ginkgo leaves of group C tended to initially increase and then decrease with increasing zinc concentration. Particularly in group C, the ABA content was significantly greater than those in the other groups at T2 and T3, being 40.90% and 55.71% greater than CK treatment (p < 0.05). At different time groups, the IAA contents of ginkgo leaves tended to decrease with increasing zinc concentration and significantly decreased under T3 and T4 (p < 0.05).
3.4. Effects of Different Times and Zinc Concentrations on the Nascent Metabolites of Ginkgo Leaves
Between the different groups, there was no significant difference in the FAA or SS contents of ginkgo leaves (Figure 6a,c). However, the TP content in ginkgo leaves was significantly greater in the zinc-treated group B than in groups A and C (Figure 6b). Additionally, the starch content in ginkgo leaves was significantly greater in the zinc-supplemented group B (Figure 6d) (p < 0.05). The FAA contents in ginkgo leaves peaked at T3 in all groups, with a notable 34.44% increase in T3 in group A compared to that in the CK (Figure 6a) (p < 0.05). The TP contents in ginkgo leaves showed fluctuating trends, reaching peaks at T2 and T4, particularly in T2 of group B, where it was significantly greater than CK by 46.77% (Figure 6b) (p < 0.05). The SS content of ginkgo leaves in group A decreased significantly at T2 compared to that in the CK treatment, but significantly increased by 15.17% at T4 (Figure 6c) (p < 0.05). In group B, the SS contents of ginkgo leaves in the T2, T3, and T4 treatments were significantly lower than those in the CK treatment by 10.60%, 14.72%, and 15.72%, respectively (p < 0.05). In group A, only the starch content in ginkgo leaves in the T3 treatment was significantly greater than that in the CK (p < 0.05), while there were no significant differences in the other zinc concentrations. In group B, the starch contents under T1, T2, and T3 were significantly lower than those under CK by 22.85%, 19.95%, and 21.77%, respectively (p < 0.05), with no significant difference under T4. Conversely, in group C, compared with that in the CK treatment, the starch content in the ginkgo leaves at T4 was significantly increased by 30.01% (p < 0.05) (Figure 6d).
3.5. Effects of Different Times and Zinc Concentrations on the Flavonoids and TTL Contents of Ginkgo Leaves
In group A, the flavonoid contents of ginkgo leaves initially increased and then decreased as the zinc concentration increased, peaking at 13.71 mg g−1 DW in T2, showing a significant 24.30% increase compared to that in the CK treatment (Figure 7a) (p < 0.05). However, in groups B and C, the effects of different zinc concentrations on ginkgo leaf flavonoids were not significantly different. In group A, the TTL contents of ginkgo leaves in the T2, T3, and T4 treatments significantly increased by 36.31%, 33.76%, and 26.71%, respectively, compared to those in the CK treatment (Figure 7b) (p < 0.05). In groups B and C, the contents of TTL were significantly greater than those of the CK treatment at T1, T2, and T4 (p < 0.05). Specifically, in group B, the TTL content peaked at T4, showing a significant 37.36% increase compared to that in the CK treatment (p < 0.05). In group C, the TTL content peaked at T2, with a significant 43.93% increase compared to that in the CK treatment (p < 0.05).
Among the groups, the BB content of ginkgo leaves in zinc-supplemented group A was significantly greater than that of zinc-supplemented group B (p < 0.05), while the BB content in zinc-supplemented group C was even more significantly greater than that in group B (p < 0.01). Treatment duration did not significantly impact the diterpene lactone content of ginkgo leaves (Figure 8). Within groups, the BB content of ginkgo leaves in group A was 23.65% lower than that in the CK at T1, but increased by 24.30% compared to that in the CK at T3. In group B, ginkgo leaves sprayed with zinc had a significantly lower BB content than did those sprayed with CK (Figure 8a) (p < 0.05). However, in group C, the ginkgo leaves sprayed with zinc had greater BB contents than did those sprayed with CK, with significant increases of 29.35% and 41.33% at T2 and T4, respectively (p < 0.05). For group A (Figure 8b), the GA contents of ginkgo leaves in T2, T3, and T4 were significantly greater than that in the CK, particularly in T2, where it was 45.93% greater than that in the CK (p < 0.05). In groups B and C, ginkgo leaves sprayed with zinc had a significantly greater GA contents than did those sprayed with CK, with group B showing a 66.78% increase in GA content at T4 (p < 0.05). In group A (Figure 8c,d), the GB and GC contents of ginkgo leaves peaked at T2, being 46.56% and 74.29% greater than those in the CK, respectively (p < 0.05). In group B, the GB and GC contents in ginkgo leaves sprayed with zinc were significantly greater than those in the CK leaves (p < 0.05). In group C, the GB and GC contents in ginkgo leaves at T1, T2, and T4 were significantly greater than those in the CK (p < 0.05).
3.6. Correlation Analysis and Principal Component Analysis (PCA) of Various Indicators of Ginkgo at Different Time Groups
In group A (Figure 9a), flavonoids from ginkgo at various zinc concentrations exhibited significant positive correlations with Pn, ZR, GB, and GC; with correlation coefficients of 0.54, 0.67, 0.76, and 0.55, respectively; and were negatively correlated with SS, with a correlation coefficient of −0.66 (p < 0.05). TTL were significantly correlated with SPAD, Pn, FAA, BB, GA, GB, and GC (p < 0.05); with correlation coefficients of 0.54, 0.67, 0.59, 0.71, 0.93, 0.70, and 0.82, respectively. BB exhibited significant positive correlations with Pn, ABA, FAA, and SS, as well as significant negative correlations with ZR, GA, and GSH (p < 0.05). These findings suggest that zinc application in group A impacted the levels of ginkgo flavonoids and TTL by influencing the photosynthetic parameters, endogenous hormones, free amino acids, and soluble sugars in ginkgo leaves. In group B (Figure 9b), the TTL contents of ginkgo plants at different zinc concentrations were significantly correlated with the MDA, H2O2, ZR, ABA, TP, GA, GB, and GC contents (p < 0.05); and the correlation coefficients were 0.54, 0.61, 0.52, 0.70, 0.58, 0.97, 0.57, and 0.92, respectively; while there were significant negative correlations with gs, E, SS, and BB (p < 0.05), with correlation coefficients of −0.65, −0.52, −0.55, and −0.67, respectively. BB showed a significant positive correlation with gs and SS, and a significant negative correlation with GSH, MDA, H2O2, ZR, ABA, TP, GA, GB, and GC. GB was significantly negatively correlated with POD and starch, and GC was significantly negatively correlated with Ci (p < 0.05). The results indicated that zinc application in group B affected the content of TTL by affecting photosynthetic parameters, resistance indicators, and endogenous hormones. In group C (Figure 9c), a significant positive correlation was observed between flavonoids in ginkgo and H2O2 at different zinc concentrations (p < 0.05), with a correlation coefficient of 0.51. Additionally, TTL contents exhibited significant positive correlations with GSH, BB, GA, GB, and GC; with correlation coefficients of 0.60, 0.84, 0.82, 0.75, and 0.87, respectively; and a significant negative correlation with gs (p < 0.05), represented by a correlation coefficient of −0.54. Furthermore, BB displayed significant positive correlations with POD, GSH, starch, GB, and GC but significant negative correlations with Pn and gs (p < 0.05). GA was significantly positively correlated with H2O2, ABA, and GC and significantly negatively correlated with IAA, TP, and SS (p < 0.05). Notably, a significant positive correlation was found between GB and SPAD (p < 0.05). Overall, the results indicate that zinc application in group C influenced the levels of flavonoids and TTL contents by impacting photosynthetic parameters and resistance indicators.
PCA analysis was conducted on 24 indicators of ginkgo plants across the varying zinc levels within three different time groups (Figure 9d–f). Three principal components (PC1, PC2, and PC3) were identified based on eigenvalues exceeding 1, with cumulative contribution rates exceeding 60%. This suggests that the three principal components effectively captured the information from all 24 indicators. The scatter plot distributions corresponding to each zinc concentration treatment were clearly distinct, indicating a significant influence of zinc application levels on various indicators of ginkgo saplings across the three time groups. In group A (Figure 9d), PC1 exhibited strong positive correlations with POD, ABA, FAA, starch, and BB, implying substantial positive effects; while ZR and IAA showed negative correlations. PC2 showed positive correlations with SPAD, flavonoids, and TTL contents. PC3 displayed positive correlations with Pn and TP, and negative correlations with Ci, GSH, and starch. In group B (Figure 9e), PC1 was positively associated with H2O2, ABA, TP, and GA but was negatively correlated with SS and BB. PC2 was positively correlated with Ci, POD, and FAA but was negatively correlated with starch, GA, and GC. PC3 demonstrated positive correlations with MDA, IAA, SS, and GB, and negative correlations with gs, E, and ZR. In group C (Figure 9f), PC1 showed positive correlations with E, FAA, SOD, and H2O2; and negative correlations with TP and IAA. PC2 was positively correlated with POD and TTL contents, but negatively correlated with Pn and gs. PC3 exhibited positive correlations with POD, MDA, SS, and starch but negative correlations with ZR.
4. Discussion
As a crucial trace element in plants, zinc plays a significant role in promoting the synthesis of chlorophyll and enhancing the photosynthetic capacity of leaves [42]. This is consistent with the results of our study, in which the SPAD values of the plants in the zinc-supplemented groups A and B were both greater than those in the CK. Nevertheless, an excess of zinc can hinder the activity of the enzymes responsible for chlorophyll biosynthesis, leading to a reduction in photosynthetic pigments [43]. However, in our study, zinc was applied twice to the ginkgo trees in group C, and the SPAD values of the ginkgo leaves in T4 was greater than that in the CK. This could be attributed to the strong zinc tolerance ability of Ginkgo biloba [44]. Studies have demonstrated that an optimal concentration of zinc enhances CO2 levels in chloroplasts, leading to improved carboxylation by the rubisco enzyme and enhancing the photosynthetic capacity of plants [11]. However, Misra et al. [45] reported that an excess of zinc during their investigation of geraniums could lead to reduced plant water uptake, stomatal closure, and decreased CO2 flow in plant leaves. This obstruction of CO2 diffusion into chloroplasts can negatively impact photosynthetic efficiency and carbon fixation. Notably, in our study, there were no significant differences in the various photosynthetic indicators of ginkgo plants in group A under the different zinc concentrations. Conversely, compared with those in the CK treatment, Pn, gs, and E in the ginkgo plants in the zinc-treated group B all decreased to varying degrees. However, the changes in Pn and Ci were not consistent, suggesting that the Pn response of ginkgo leaves to different Zn concentrations may be influenced by non-stomatal factors. Further research and discussion are necessary to fully understand these findings. The differing outcomes between groups A and B could be attributed to variations in the timing of zinc application and the differential absorption and sequestration of zinc by the plants [46]. In group C, which was treated with zinc twice, varying zinc concentrations did not significantly influence the photosynthetic parameters of the ginkgo plants. This finding contrasts with a study by Lui et al. [47], which suggested that excessive zinc could hinder plant photosynthesis. This discrepancy could be attributed to the possibility that pecans are more susceptible to zinc [48].
In stressful environments, plants experience disruptions in metabolic pathways and electron transport mechanisms, resulting in the overproduction of reactive oxygen species (ROS) and oxidative stress [43]. Our study demonstrated that foliar spraying zinc at various stages can enhance the antioxidant enzyme activity of ginkgo. In plants under stress, zinc acts as a cofactor for Cu-Zn SOD, activating ROS scavenging enzymes such as SOD [49] and POD to maintain the ROS balance and prevent oxidative damage [50]. Goodarzi et al. [51] demonstrated that zinc can enhance lipid peroxidation by increasing MDA and H2O2 levels in safflower seedlings, which is consistent with the findings of group B in our study. The MDA content of ginkgo plants in group C decreased after being treated with zinc twice, while the GSH content increased significantly compared to that in the CK. This could be attributed to the ability of GSH to chelate with zinc and form a complex [52,53], which in turn reduces the toxicity of excess zinc in plants and leads to a decrease in lipid peroxidation.
Endogenous hormones play a crucial role in regulating plant life activities [54]. When plants are exposed to stressful conditions, they can modulate metabolic activities by regulating changes in endogenous hormones, thus influencing the physiological and biochemical processes in plants. Specifically, ABA is a key player in plant responses to adverse conditions. In our study, the ZR and ABA contents of ginkgo increased to varying degrees after zinc application, while the IAA content decreased with increasing zinc application. This finding contradicts the results of Zhang et al. [15]. Dani and Loreto [55] suggested that under external stress, the synthesis of endogenous hormones in plants is initially affected, with a priority given to isoprenoids as synthesis precursors. The significant negative correlation between the IAA and GA contents, as shown in the correlation analysis (Figure 9a,c), further supports this hypothesis.
In our study, it was observed that the FAA content in ginkgo increased to varying degrees with zinc application at different times, which shows that ginkgo plants exhibit a tolerance response to zinc stress [56]. The TP content of ginkgo was significantly increased only in the zinc-supplemented group B. The trend of the TP contents showed an initial increase followed by a decrease with increasing zinc concentration, consistent with findings by Fan et al. [23]. This shows that ginkgo plants respond positively to moderate zinc stress by adjusting osmoregulation through the regulation of the TP content [57]. The SS content of ginkgo saplings after zinc spraying decreased to varying degrees, contrary to previous studies [58]. This difference may be attributed to the diverse osmotic regulatory mechanisms of plants under different heavy metal stresses, which warrants further investigation. In zinc spraying groups A and C, the starch content in ginkgo increased, while in group B it decreased significantly. Additionally, the TP and starch contents exhibited negative correlations across different time groups, indicating that zinc may play a role in regulating protein synthesis through starch metabolism in ginkgo [23].
Recent research has focused on the induction of plant secondary metabolites by heavy metals [59]. Appropriate concentrations of heavy metals have been shown to effectively stimulate the synthesis and accumulation of plant secondary metabolites. However, excessive amounts can be detrimental to plants [60]. In our study, the flavonoid content of ginkgo was significantly increased only in the T2 treatment in the zinc-spraying group A, consistent with findings from previous research [31]. The TTL contents in the ginkgo leaves increased to varying degrees in different zinc spraying groups, suggesting that zinc application can increase the TTL content [61]. According to the growth differentiation balance hypothesis [62], it is hypothesized that under zinc stress, ginkgo plants may allocate more nutrients toward the synthesis of terpenoids by redistributing carbohydrates. Further research is needed to investigate this speculation. Correlation analysis revealed positive correlations between TTL contents and various oxidative defense-related markers in groups B and C. Research indicates that regulating TTL content may be associated with plants’ ability to adapt to potential oxidative stress induced by high zinc levels [63]. Among the TTL components, BB is synthesized through the mevalonic acid (MVA) pathway, while GA, GB, and GC are synthesized as diterpenes through the 2-C-methyl-D-erythritol 4-phosphate (MEP) pathway [64]. Our study revealed significant increases in the BB contents in the ginkgo leaves of groups A and C when subjected to high concentrations of zinc (T3 and T4). Early application timing and a high concentration of ZnSO4 may enhance the synthesis of BB through the MVA pathway. Further comprehensive research is needed to validate these findings. The diterpene contents of ginkgo leaves increased to varying degrees when zinc was applied at different times. In particular, the diterpene content reached its peak within group A when ZnSO4 was applied at a concentration of T2. This indicates that spraying 12 mmol/L ZnSO4 in June is advantageous for the accumulation of diterpenes in ginkgo leaves.
5. Conclusions
Based on the analysis of secondary metabolites and economic principles, our study suggested that the optimal timing for foliar spraying ZnSO4 to ginkgo trees is in June, with a recommended concentration of 12 mmol/L. The application of ZnSO4 in June enhanced the accumulation of total flavonoids and TTL contents in ginkgo leaves. In particular, at a concentration of 12 mmol/L, the flavonoids and TTL contents in ginkgo leaves increased by 24.30% and 36.31%, respectively, compared to those in the CK. Foliar spraying appropriate amounts of ZnSO4 at different times can effectively increase the relative chlorophyll content of ginkgo leaves, maintain high levels of POD and SOD activities and H2O2 contents, and reduce the IAA content in ginkgo leaves. Promoting the accumulation of ABA, FAA, TTL, and diterpene lactone content in ginkgo and enhancing its stress resistance. Consequently, foliar spraying of zinc can enhance the medicinal quality of ginkgo leaves. Our study’s findings will offer insights into the utilization of ZnSO4 in ginkgo leaf forest production. In future research, we aim to investigate the dynamic impact of zinc application on ginkgo secondary metabolites and explore the molecular mechanisms through which zinc regulates ginkgo flavonoids and TTL contents. Furthermore, exploring the synthesis and accumulation pathways of zinc secondary metabolites in ginkgo is crucial for improving research related to the chemical synthesis of ginkgo TTL and flavonoids.
Author Contributions
J.Z.: investigation, experimental conduct, data curation, data analysis, writing—original draft, writing-review and editing, visualization. Y.L.: investigation, experimental conduct, writing—review and editing, supervision. H.H.: Writing—review and editing. P.Y.: writing—review and editing. J.G.: writing—review and editing, supervision, resources. G.W.: conceptualization, writing—review and editing, project management, funding acquisition. All authors have read and agreed to the published version of the manuscript.
Funding
This work was supported by the National Natural Science Foundation of China (32101560, 31971689), the Natural Science Foundation of Jiangsu Province (No. BK20210609), the Priority Academy Program Development of Jiangsu Higher Education Institution (PAPD), and the Jiangsu Province Scientific Research and Practice Innovation Project (No. KYCX22_1119).
Data Availability Statement
The data will be provided upon request.
Conflicts of Interest
Author Pengfei Yu is employed by the company Suining County Runqi Investment Co., Ltd. The remaining authors declare that the research was conducted in the absence of any commercial or financial relationships that could be construed as potential conflicts of interest.
References
- Cao, F.L. Chinese Ginkgo; China Forestry Publishing House: Beijing, China, 2007; ISBN 7-5038-4805-7. [Google Scholar]
- Strømgaard, K.; Nakanishi, K. Chemistry and Biology of Terpene Trilactones from Ginkgo biloba. Angew. Chem. Int. Ed. Engl. 2004, 43, 1640–1658. [Google Scholar] [CrossRef]
- Lachachi, H.; Plantavid, M.; Simon, M.F.; Chap, H.; Braquet, P.; Douste-Blazy, L. Inhibition of Transmembrane Movement and Metabolism of Platelet Activating Factor (PAF-Acether) by a Specific Antagonist, BN 52021. Biochem. Biophys. Res. Commun. 1985, 132, 460–466. [Google Scholar] [CrossRef] [PubMed]
- Feng, Z.; Sun, Q.; Chen, W.; Bai, Y.; Hu, D.; Xie, X. The Neuroprotective Mechanisms of Ginkgolides and Bilobalide in Cerebral Ischemic Injury: A Literature Review. Mol. Med. 2019, 25, 57. [Google Scholar] [CrossRef] [PubMed]
- Biernacka, P.; Adamska, I.; Felisiak, K. The Potential of Ginkgo biloba as a Source of Biologically Active Compounds—A Review of the Recent Literature and Patents. Molecules 2023, 28, 3993. [Google Scholar] [CrossRef] [PubMed]
- Chiu, Y.-L.; Tsai, W.-C.; Wu, C.-H.; Wu, C.-H.; Cheng, C.-C.; Lin, W.-S.; Tsai, T.-N.; Wu, L.-S. Ginkgo biloba Induces Thrombomodulin Expression and Tissue-Type Plasminogen Activator Secretion via the Activation of Krüppel-like Factor 2 within Endothelial Cells. Am. J. Chin. Med. 2020, 48, 357–372. [Google Scholar] [CrossRef] [PubMed]
- Liu, X.-W.; Yang, J.-L.; Niu, W.; Jia, W.-W.; Olaleye, O.E.; Wen, Q.; Duan, X.-N.; Huang, Y.-H.; Wang, F.-Q.; Du, F.-F.; et al. Human Pharmacokinetics of Ginkgo Terpene Lactones and Impact of Carboxylation in Blood on Their Platelet-Activating Factor Antagonistic Activity. Acta Pharmacol. Sin. 2018, 39, 1935–1946. [Google Scholar] [CrossRef] [PubMed]
- Eisvand, F.; Razavi, B.M.; Hosseinzadeh, H. The Effects of Ginkgo biloba on Metabolic Syndrome: A Review. Phytother. Res. 2020, 34, 1798–1811. [Google Scholar] [CrossRef] [PubMed]
- Liu, X.-G.; Lu, X.; Gao, W.; Li, P.; Yang, H. Structure, Synthesis, Biosynthesis, and Activity of the Characteristic Compounds from Ginkgo biloba L. Nat. Prod. Rep. 2022, 39, 474–511. [Google Scholar] [CrossRef] [PubMed]
- Stanton, C.; Sanders, D.; Krämer, U.; Podar, D. Zinc in Plants: Integrating Homeostasis and Biofortification. Mol. Plant 2022, 15, 65–85. [Google Scholar] [CrossRef] [PubMed]
- Sturikova, H.; Krystofova, O.; Huska, D.; Adam, V. Zinc, Zinc Nanoparticles and Plants. J. Hazard. Mater. 2018, 349, 101–110. [Google Scholar] [CrossRef] [PubMed]
- Moustakas, M.; Bayçu, G.; Gevrek, N.; Moustaka, J.; Csatári, I.; Rognes, S.E. Spatiotemporal Heterogeneity of Photosystem II Function during Acclimation to Zinc Exposure and Mineral Nutrition Changes in the Hyperaccumulator Noccaea Caerulescens. Environ. Sci. Pollut. Res. 2019, 26, 6613–6624. [Google Scholar] [CrossRef] [PubMed]
- Balafrej, H.; Bogusz, D.; Triqui, Z.-E.A.; Guedira, A.; Bendaou, N.; Smouni, A.; Fahr, M. Zinc Hyperaccumulation in Plants: A Review. Plants 2020, 9, 562. [Google Scholar] [CrossRef] [PubMed]
- Tsonev, T.; Lidon, F. Zinc in Plants—An Overview. Emir. J. Food Agric. 2012, 24, 322–333. [Google Scholar]
- Zhang, P.; Sun, L.; Qin, J.; Wan, J.; Wang, R.; Li, S.; Xu, J. cGMP Is Involved in Zn Tolerance through the Modulation of Auxin Redistribution in Root Tips. Environ. Exp. Bot. 2018, 147, 22–30. [Google Scholar] [CrossRef]
- Mahawar, L.; Živčák, M.; Barboricova, M.; Kovár, M.; Filaček, A.; Ferencova, J.; Vysoká, D.M.; Brestič, M. Effect of Copper Oxide and Zinc Oxide Nanoparticles on Photosynthesis and Physiology of Raphanus sativus L. under Salinity Stress. Plant Physiol. Biochem. 2024, 206, 108281. [Google Scholar] [CrossRef] [PubMed]
- Rai-Kalal, P.; Jajoo, A. Priming with Zinc Oxide Nanoparticles Improve Germination and Photosynthetic Performance in Wheat. Plant Physiol. Biochem. 2021, 160, 341–351. [Google Scholar] [CrossRef] [PubMed]
- Salehi, H.; De Diego, N.; Chehregani Rad, A.; Benjamin, J.J.; Trevisan, M.; Lucini, L. Exogenous Application of ZnO Nanoparticles and ZnSO4 Distinctly Influence the Metabolic Response in Phaseolus vulgaris L. Sci. Total Environ. 2021, 778, 146331. [Google Scholar] [CrossRef]
- Jan, A.U.; Hadi, F.; Midrarullah; Nawaz, M.A.; Rahman, K. Potassium and Zinc Increase Tolerance to Salt Stress in Wheat (Triticum aestivum L.). Plant Physiol. Biochem. 2017, 116, 139–149. [Google Scholar] [CrossRef]
- Wei, C.; Jiao, Q.; Agathokleous, E.; Liu, H.; Li, G.; Zhang, J.; Fahad, S.; Jiang, Y. Hormetic Effects of Zinc on Growth and Antioxidant Defense System of Wheat Plants. Sci. Total Environ. 2022, 807, 150992. [Google Scholar] [CrossRef] [PubMed]
- Shang, G.; Meng, Z.; Qinyue, Z.; Feng, X.; Zhang, W. Effects of Exogenous Zinc (ZnSO4·7H2O) on Photosynthetic Characteristics and Grain Quality of Hybrid Rice. Plant Physiol. Biochem. 2023, 205, 108049. [Google Scholar] [CrossRef] [PubMed]
- Zhang, Y.; Wang, Y.; Ding, Z.; Wang, H.; Song, L.; Jia, S.; Ma, D. Zinc Stress Affects Ionome and Metabolome in Tea Plants. Plant Physiol. Biochem. 2017, 111, 318–328. [Google Scholar] [CrossRef] [PubMed]
- Fan, Y.; Jiang, T.; Chun, Z.; Wang, G.; Yang, K.; Tan, X.; Zhao, J.; Pu, S.; Luo, A. Zinc Affects the Physiology and Medicinal Components of Dendrobium nobile Lindl. Plant Physiol. Biochem. 2021, 162, 656–666. [Google Scholar] [CrossRef] [PubMed]
- Liu, F.; Chen, G.T.; Hu, Q.H.; Zhao, S.W.; Zhao, L.Y. Separation, Purification and Structure Characteristics of Zn-Binding Polysaccharides from Flammulina velutipes. Food Sci. 2014, 35, 1. [Google Scholar] [CrossRef]
- Jin, L.; Gao, M.J.; Duan, X.H.; Guo, X.R. Zn Stress Changchun Spend Different Parts of Zn Accumulation by Exogenous Ethephon Regulation. Bull. Bot. Res. 2015, 35, 150–153. [Google Scholar] [CrossRef]
- Lin, Y.; Lou, K.; Wu, G.; Wu, X.; Zhou, X.; Feng, Y.; Zhang, H.; Yu, P. Bioactive Metabolites in of Ginkgo biloba Leaves: Variations by Seasonal, Meteorological and Soil. Braz. J. Biol. Rev. Brasleira Biol. 2020, 80, 790–797. [Google Scholar] [CrossRef]
- Kumar, R.; Sharma, S.; Kaundal, M.; Sharma, S.; Thakur, M. Response of Damask Rose (Rosa damascena Mill.) to Foliar Application of Magnesium (Mg), Copper (Cu) and Zinc (Zn) Sulphate under Western Himalayas. Ind. Crops Prod. 2016, 83, 596–602. [Google Scholar] [CrossRef]
- Horbowicz, M.; Wiczkowski, W.; Góraj-Koniarska, J.; Miyamoto, K.; Ueda, J.; Saniewski, M. Effect of Methyl Jasmonate on the Terpene Trilactones, Flavonoids, and Phenolic Acids in Ginkgo biloba L. Leaves: Relevance to Leaf Senescence. Molecules 2021, 26, 4682. [Google Scholar] [CrossRef] [PubMed]
- Ye, J.; Mao, D.; Cheng, S.; Zhang, X.; Tan, J.; Zheng, J.; Xu, F. Comparative Transcriptome Analysis Reveals the Potential Stimulatory Mechanism of Terpene Trilactone Biosynthesis by Exogenous Salicylic Acid in Ginkgo biloba. Ind. Crops Prod. 2020, 145, 112104. [Google Scholar] [CrossRef]
- Li, L.; Yu, J.; Li, L.; Rao, S.; Wu, S.; Wang, S.; Cheng, S.; Cheng, H. Treatment of Ginkgo biloba with Exogenous Sodium Selenite Affects Its Physiological Growth, Changes Its Phytohormones, and Synthesizes Its Terpene Lactones. Molecules 2022, 27, 7548. [Google Scholar] [CrossRef] [PubMed]
- Wang, Q.; Xu, S.; Zhong, L.; Zhao, X.; Wang, L. Effects of Zinc Oxide Nanoparticles on Growth, Development, and Flavonoid Synthesis in Ginkgo biloba. Int. J. Mol. Sci. 2023, 24, 15775. [Google Scholar] [CrossRef] [PubMed]
- Shi, F.-J.; Yang, C.-J.; Chen, X.-F.; Maiheliya, M.-J.-T.; Huang, M.-M.; Wei, X.-J.; Wang, K.; Liu, C.-S.; Yang, Y.-J. Effect of origin, tree age, and harvesting time on content of flavonoids and terpene lactones in Ginkgo folium. Zhongguo Zhong Yao Za Zhi 2022, 47, 4055–4065. [Google Scholar] [CrossRef] [PubMed]
- Wang, X. Plant Physiological and Biochemical Experimental Principles and Techniques, 2nd ed.; Higher Education Press: Beijing, China, 2006; ISBN 9787040192162. [Google Scholar]
- Bradford, M.M. A Rapid and Sensitive Method for the Quantitation of Microgram Quantities of Protein Utilizing the Principle of Protein-Dye Binding. Anal. Biochem. 1976, 72, 248–254. [Google Scholar] [CrossRef]
- Weiler, E.W. Immunoassay of Plant Growth Regulators. Annu. Rev. Plant Physiol. 1984, 35, 85–95. [Google Scholar] [CrossRef]
- Xia, X.; Cao, J.; Zheng, Y.; Wang, Q.; Xiao, J. Flavonoid Concentrations and Bioactivity of Flavonoid Extracts from 19 Species of Ferns from China. Ind. Crops Prod. 2014, 58, 91–98. [Google Scholar] [CrossRef]
- Su, E.; Yang, M.; Cao, J.; Lu, C.; Wang, J.; Cao, F. Deep Eutectic Solvents as Green Media for Efficient Extraction of Terpene Trilactones from Ginkgo biloba Leaves. J. Liq. Chromatogr. Relat. Technol. 2017, 40, 385–391. [Google Scholar] [CrossRef]
- Tietze, F. Enzymic Method for Quantitative Determination of Nanogram Amounts of Total and Oxidized Glutathione: Applications to Mammalian Blood and Other Tissues. Anal. Biochem. 1969, 27, 502–522. [Google Scholar] [CrossRef] [PubMed]
- Heath, R.L.; Packer, L. Photoperoxidation in Isolated Chloroplasts: II. Role of Electron Transfer. Arch. Biochem. Biophys. 1968, 125, 850–857. [Google Scholar] [CrossRef] [PubMed]
- Maehly, A.C. Plant Peroxidase. In Methods in Enzymology; Academic Press: Cambridge, MA, USA, 1955; Volume 2, pp. 801–813. [Google Scholar]
- Beyer, W.F.; Fridovich, I. Assaying for Superoxide Dismutase Activity: Some Large Consequences of Minor Changes in Conditions. Anal. Biochem. 1987, 161, 559–566. [Google Scholar] [CrossRef] [PubMed]
- Rukhsar-Ul-Haq; Kausar, A.; Hussain, S.; Javed, T.; Zafar, S.; Anwar, S.; Hussain, S.; Zahra, N.; Saqib, M. Zinc Oxide Nanoparticles as Potential Hallmarks for Enhancing Drought Stress Tolerance in Wheat Seedlings. Plant Physiol. Biochem. 2023, 195, 341–350. [Google Scholar] [CrossRef] [PubMed]
- Kaur, H.; Garg, N. Zinc Toxicity in Plants: A Review. Planta 2021, 253, 129. [Google Scholar] [CrossRef] [PubMed]
- Tang, M.; Zhang, X.; Tan, X.-R.; Liu, Y.; Wang, M.-X. Accumulation, subcellular distribution, and chemical forms of zinc in three tree species. Ying Yong Sheng Tai Xue Bao 2021, 32, 4298–4306. [Google Scholar] [CrossRef]
- Misra, A.; Srivastava, A.K.; Srivastava, N.K.; Khan, A. Zn-Acquisition and Its Role in Growth, Photosynthesis, Photosynthetic Pigments, and Biochemical Changes in Essential Monoterpene Oil(s) of Pelargonium Graveolens. Photosynthetica 2005, 43, 153–155. [Google Scholar] [CrossRef]
- Verbruggen, N.; Hermans, C.; Schat, H. Molecular Mechanisms of Metal Hyperaccumulation in Plants. New Phytol. 2009, 181, 759–776. [Google Scholar] [CrossRef] [PubMed]
- Liu, J.-P.; Deng, Q.-J.; Shang, Y.-J.; Yao, X.-W.; Wang, H.-K.; Tang, Y.-J.; Peng, F.-R.; Tan, P.-P. Effects of Zinc Application on the Growth and Photosynthetic Characteristics of Pecan at the Seedling Stage. Plant Biol. 2021, 23, 1149–1156. [Google Scholar] [CrossRef]
- Heerema, R.J.; VanLeeuwen, D.; Thompson, M.Y.; Sherman, J.D.; Comeau, M.J.; Walworth, J.L. Soil-Application of Zinc-EDTA Increases Leaf Photosynthesis of Immature ‘Wichita’ Pecan Trees. J. Am. Soc. Hortic. Sci. 2017, 142, 27–35. [Google Scholar] [CrossRef]
- Gomes, M.P.; Duarte, D.M.; Carneiro, M.M.L.C.; Barreto, L.C.; Carvalho, M.; Soares, A.M.; Guilherme, L.R.G.; Garcia, Q.S. Zinc Tolerance Modulation in Myracrodruon urundeuva Plants. Plant Physiol. Biochem. 2013, 67, 1–6. [Google Scholar] [CrossRef] [PubMed]
- Michael, P.I.; Krishnaswamy, M. The Effect of Zinc Stress Combined with High Irradiance Stress on Membrane Damage and Antioxidative Response in Bean Seedlings. Environ. Exp. Bot. 2011, 74, 171–177. [Google Scholar] [CrossRef]
- Goodarzi, A.; Namdjoyan, S.; Soorki, A.A. Effects of Exogenous Melatonin and Glutathione on Zinc Toxicity in Safflower (Carthamus tinctorius L.) Seedlings. Ecotoxicol. Environ. Saf. 2020, 201, 110853. [Google Scholar] [CrossRef] [PubMed]
- Kühnlenz, T.; Hofmann, C.; Uraguchi, S.; Schmidt, H.; Schempp, S.; Weber, M.; Lahner, B.; Salt, D.E.; Clemens, S. Phytochelatin Synthesis Promotes Leaf Zn Accumulation of Arabidopsis Thaliana Plants Grown in Soil with Adequate Zn Supply and Is Essential for Survival on Zn-Contaminated Soil. Plant Cell Physiol. 2016, 57, 2342–2352. [Google Scholar] [CrossRef] [PubMed]
- Zlobin, I.E.; Kartashov, A.V.; Shpakovski, G.V. Different Roles of Glutathione in Copper and Zinc Chelation in Brassica Napus Roots. Plant Physiol. Biochem. 2017, 118, 333–341. [Google Scholar] [CrossRef] [PubMed]
- Ji, X.; Tang, J.; Zheng, X.; Li, A.; Zhang, J. The Regulating Mechanism of Salt Tolerance of Black Walnut Seedlings Was Revealed by the Physiological and Biochemical Integration Analysis. Plant Physiol. Biochem. 2024, 210, 108548. [Google Scholar] [CrossRef] [PubMed]
- Dani, K.G.S.; Loreto, F. Plant Volatiles as Regulators of Hormone Homeostasis. New Phytol. 2022, 234, 804–812. [Google Scholar] [CrossRef] [PubMed]
- Souza, S.C.R.; Souza, L.A.; Schiavinato, M.A.; de Oliveira Silva, F.M.; de Andrade, S.A.L. Zinc Toxicity in Seedlings of Three Trees from the Fabaceae Associated with Arbuscular Mycorrhizal Fungi. Ecotoxicol. Environ. Saf. 2020, 195, 110450. [Google Scholar] [CrossRef] [PubMed]
- Kaur, H.; Garg, N. Zinc-Arbuscular Mycorrhizal Interactions: Effect on Nutrient Pool, Enzymatic Antioxidants, and Osmolyte Synthesis in Pigeonpea Nodules Subjected to Cd Stress. Commun. Soil Sci. Plant Anal. 2017, 48, 1684–1700. [Google Scholar] [CrossRef]
- Ibrahim, M.H.; Chee Kong, Y.; Mohd Zain, N.A. Effect of Cadmium and Copper Exposure on Growth, Secondary Metabolites and Antioxidant Activity in the Medicinal Plant Sambung Nyawa (Gynura procumbens (Lour.) Merr). Molecules 2017, 22, 1623. [Google Scholar] [CrossRef] [PubMed]
- Eghbaliferiz, S.; Iranshahi, M. Prooxidant Activity of Polyphenols, Flavonoids, Anthocyanins and Carotenoids: Updated Review of Mechanisms and Catalyzing Metals. Phytother. Res. 2016, 30, 1379–1391. [Google Scholar] [CrossRef] [PubMed]
- Berni, R.; Luyckx, M.; Xu, X.; Legay, S.; Sergeant, K.; Hausman, J.-F.; Lutts, S.; Cai, G.; Guerriero, G. Reactive Oxygen Species and Heavy Metal Stress in Plants: Impact on the Cell Wall and Secondary Metabolism. Environ. Exp. Bot. 2019, 161, 98–106. [Google Scholar] [CrossRef]
- Nekoukhou, M.; Fallah, S.; Abbasi-Surki, A.; Pokhrel, L.R.; Rostamnejadi, A. Improved Efficacy of Foliar Application of Zinc Oxide Nanoparticles on Zinc Biofortification, Primary Productivity and Secondary Metabolite Production in Dragonhead. J. Clean. Prod. 2022, 379, 134803. [Google Scholar] [CrossRef]
- Herms, D.A.; Mattson, W.J. The Dilemma of Plants: To Grow or Defend. Q. Rev. Biol. 1992, 67, 283–335. [Google Scholar] [CrossRef]
- Zheljazkov, V.D.; Craker, L.E.; Xing, B. Effects of Cd, Pb, and Cu on Growth and Essential Oil Contents in Dill, Peppermint, and Basil. Environ. Exp. Bot. 2006, 58, 9–16. [Google Scholar] [CrossRef]
- Lukas, B.; Schmiderer, C.; Novak, J. Essential Oil Diversity of European Origanum vulgare L. (Lamiaceae). Phytochemistry 2015, 119, 32–40. [Google Scholar] [CrossRef] [PubMed]
Figure 1.
Relative chlorophyll contents (SPAD values) of ginkgo leaves at different times and zinc concentrations. Different capital letters indicate significant differences between different time groups at the same zinc concentration (p < 0.05), while different lowercase letters indicate significant differences between different zinc concentrations at the same time group (p < 0.05).

Figure 2.
Photosynthetic parameters of ginkgo leaves at different times and zinc concentrations. The data are expressed as the mean ± standard deviation. The net photosynthetic rate (Pn), intercellular carbon dioxide concentration (Ci), stomatal conductance (gs), and transpiration rate (E) are shown in panels (a), (b), (c), and (d), respectively. Different capital letters indicate significant differences between different time groups at the same zinc concentration (p < 0.05), while different lowercase letters indicate significant differences between different zinc concentrations at the same time group (p < 0.05). “*” indicates a significant difference between the zinc application time groups (p < 0.05).

Figure 3.
Antioxidant enzyme activity levels and antioxidant contents of ginkgo leaves at different times and at different zinc concentrations. The data are expressed as the mean ± standard deviation. The peroxidase (POD) activity, superoxide dismutase (SOD) activity, glutathione (GSH) content, and malondialdehyde (MDA) content are shown in panels (a), (b), (c), and (d), respectively. Differ-ent capital letters indicate significant differences between different times groups at the same zinc concentration (p < 0.05), while different lowercase letters indicate significant differences between different zinc concentrations at the same time group (p < 0.05). “*” indicates significant differences between zinc application time groups (*, p < 0.05; **, p < 0.01).

Figure 4.
Hydrogen peroxide (H2O2) contents of ginkgo leaves at different times and zinc concentrations. The data are expressed as the mean ± standard deviation. Different capital letters indicate significant differences between different times groups at the same zinc concentration (p < 0.05), while different lowercase letters indicate significant differences between different zinc concentra-tions at the same time group (p < 0.05). “**” indicates significant differences between zinc application time groups (p < 0.01).

Figure 5.
Endogenous hormone contents of ginkgo leaves at different times and zinc concentrations. The data are expressed as the mean ± standard deviation. (a) Gibberellin (GA3); (b) Zeatin (ZR); (c) Auxin (IAA); (d) Abscisic acid (ABA). Different capital letters indicate significant differences be-tween different times groups at the same zinc concentration (p < 0.05), while different lowercase letters indicate significant differences between different zinc concentrations at the same time group (p < 0.05). “*” indicates a significant difference between the zinc application time groups (p < 0.05).

Figure 6.
Contents of primary metabolites in ginkgo leaves at different times and zinc concentrations. The data are expressed as the mean ± standard deviation. The levels of free amino acids (FAA), total protein (TP), soluble sugar (SS), and starch are shown in panels (a), (b), (c), and (d), respectively. Different capital letters indicate significant differences between different times groups at the same zinc concentration (p < 0.05), while different lowercase letters indicate significant differences be-tween different zinc concentrations at the same time group (p < 0.05). “*” indicates a significant difference between zinc application time groups (*, p < 0.05; **, p < 0.01).

Figure 7.
Contents of secondary metabolites in ginkgo leaves at different times and zinc concentrations. The data are expressed as the mean ± standard deviation. (a) Flavonoids content. (b) Ginkgo terpene lactone (TTL) content. Different capital letters indicate significant differences between dif-ferent time groups at the same zinc concentration (p < 0.05), while different lowercase letters indicate significant differences between different zinc concentrations at the same time group (p < 0.05).

Figure 8.
Contents of each component of ginkgo terpene lactones in ginkgo leaves at different times and zinc concentrations. The data are expressed as mean ± standard deviation. The components included bilobalide (BB) (a), ginkgolide A (GA) (b), ginkgolide B (GB) (c), and ginkgolide C (GC) (d). Different capital letters indicate significant differences between different times groups at the same zinc concentration (p < 0.05), while different lowercase letters indicate significant differences between different zinc concentrations at the same time group (p < 0.05). “*” indicates a significant difference between zinc application time groups (*, p < 0.05; **, p < 0.01).

Figure 9.
Correlation analysis and principal component analysis (PCA) of various physiological pa-rameters of ginkgo leaves under zinc treatment in different time groups. Panels (a–c) correspond to the correlation analysis of indicators in groups A, B, and C. The results were obtained through Pear-son correlation analysis. “*” indicates significant correlation at the 0.05 level. Panels (d–f) corre-spond to PCA of groups A, B, and C, respectively.


Table 1.
Two-factor completely randomized experimental design.
| Treatment Group | Treatment | Experimental Treatment Level Combination | Sampling Time |
|---|---|---|---|
| Control group | Treatment 1 | CK | Ginkgo leaves were sampled from the whole plant on September 22 |
| Zinc application group A (sprayed on 2 June) | Treatment 2 | A-T1 | |
| Treatment 3 | A-T2 | ||
| Treatment 4 | A-T3 | ||
| Treatment 5 | A-T4 | ||
| Zinc application group B (sprayed on 2 August) | Treatment 6 | B-T1 | |
| Treatment 7 | B-T2 | ||
| Treatment 8 | B-T3 | ||
| Treatment 9 | B-T4 | ||
| Zinc application group C (sprayed on both 2 June and 2 August) | Treatment 10 | C-T1 | |
| Treatment 11 | C-T2 | ||
| Treatment 12 | C-T3 | ||
| Treatment 13 | C-T4 |
Disclaimer/Publisher’s Note: The statements, opinions and data contained in all publications are solely those of the individual author(s) and contributor(s) and not of MDPI and/or the editor(s). MDPI and/or the editor(s) disclaim responsibility for any injury to people or property resulting from any ideas, methods, instructions or products referred to in the content. |
© 2024 by the authors. Licensee MDPI, Basel, Switzerland. This article is an open access article distributed under the terms and conditions of the Creative Commons Attribution (CC BY) license (https://creativecommons.org/licenses/by/4.0/).
Share and Cite
MDPI and ACS Style
Zhang, J.; Luo, Y.; Hou, H.; Yu, P.; Guo, J.; Wang, G. Zinc-Enhanced Regulation of the Ginkgo biloba L. Response and Secondary Metabolites. Forests 2024, 15, 759. https://0-doi-org.brum.beds.ac.uk/10.3390/f15050759
AMA Style
Zhang J, Luo Y, Hou H, Yu P, Guo J, Wang G. Zinc-Enhanced Regulation of the Ginkgo biloba L. Response and Secondary Metabolites. Forests. 2024; 15(5):759. https://0-doi-org.brum.beds.ac.uk/10.3390/f15050759
Chicago/Turabian StyleZhang, Jingjing, Yixuan Luo, Huifeng Hou, Pengfei Yu, Jing Guo, and Guibin Wang. 2024. "Zinc-Enhanced Regulation of the Ginkgo biloba L. Response and Secondary Metabolites" Forests 15, no. 5: 759. https://0-doi-org.brum.beds.ac.uk/10.3390/f15050759
Note that from the first issue of 2016, this journal uses article numbers instead of page numbers. See further details here.