
A Comprehensive Resource Assessment for Wind Power Generation on the Rural Island of Sibuyan, Philippines

 ,
,  , and
, and
Abstract
:1. Introduction
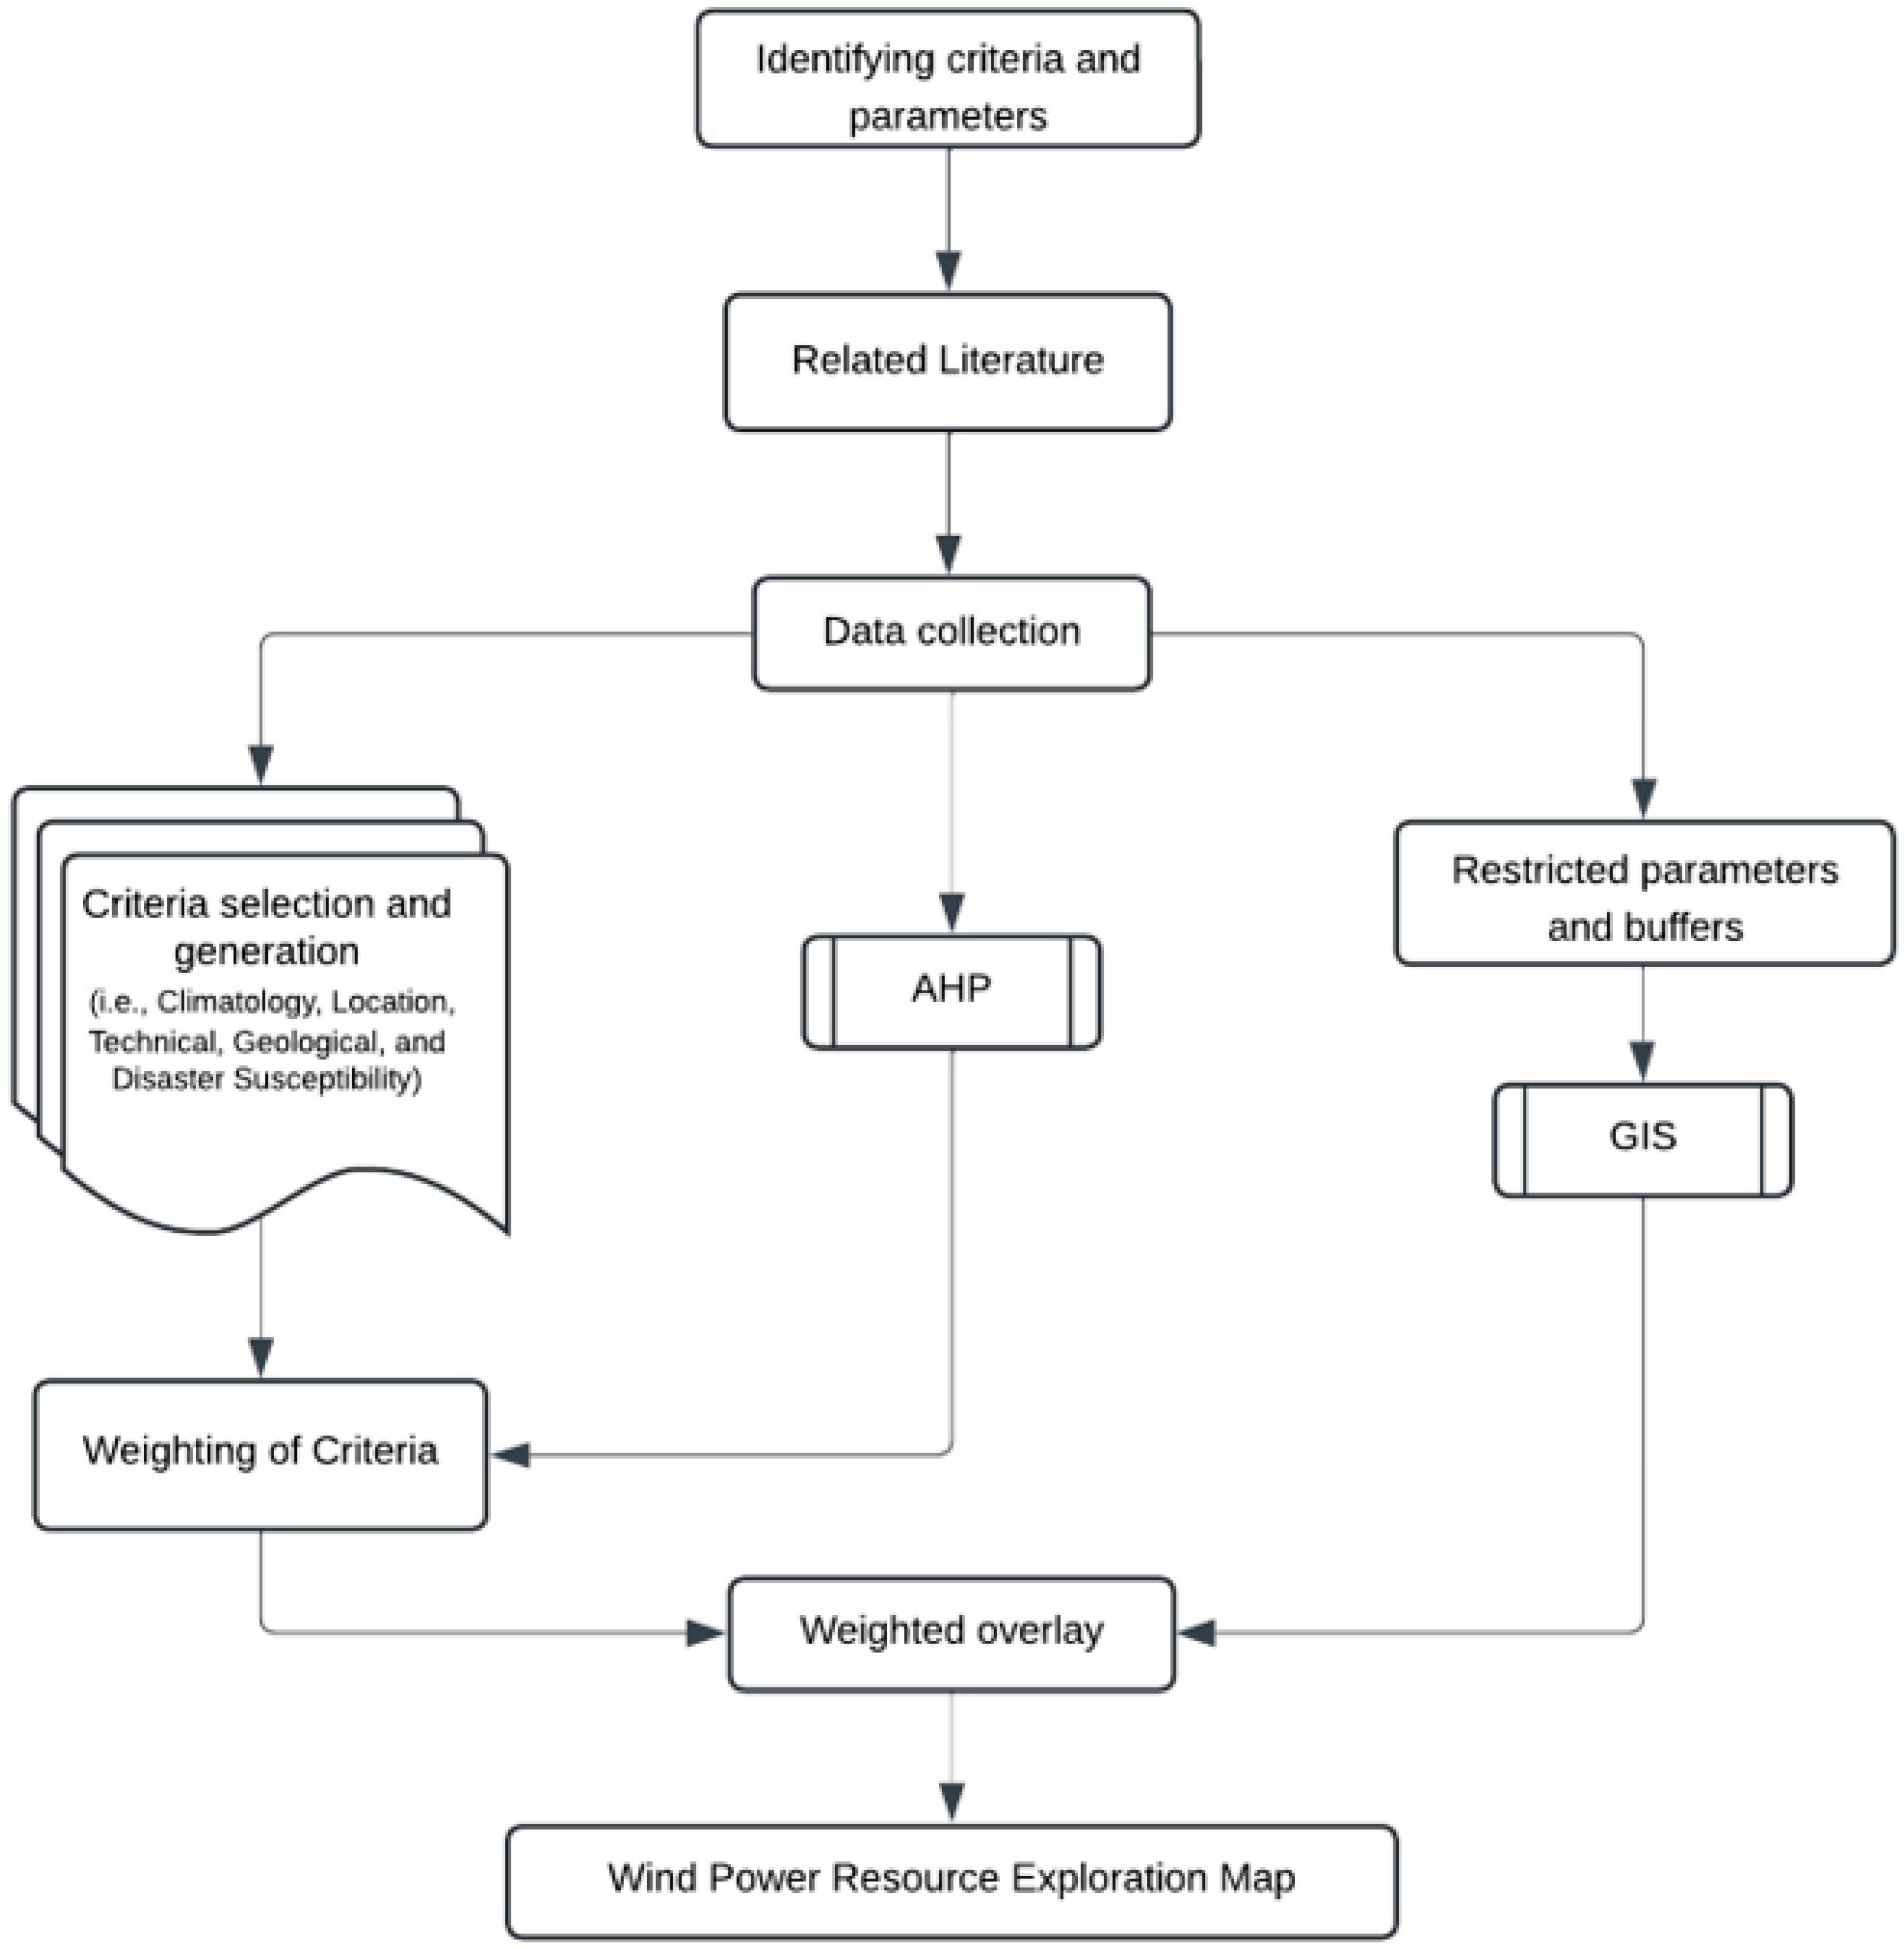
2. Materials and Methods
2.1. Study Area

2.2. Selection of Parameters and Data Gathering
2.2.1. Climatology (C1)

| Code | Identified Parameters | Sources of Information | Year | Related Studies |
|---|---|---|---|---|
| C1 | Climatology Criteria | |||
| P1 | Mean wind speed | Raster Data from Global Wind Atlas Website (https://globalwindatlas.info/en accessed on 5 December 2023) | 2023 | [2,3,10,11,12,15,19] |
| P2 | Mean wind power density | [18,19] | ||
| C2 | Location Criteria | |||
| P3 | Distance from the road network | Vector file from the Department of Public Works and Highway (DPWH) | 2020 | [1,5,18,38,39] |
| P4 | Distance from river | Shapefile digitized from Google Earth | 2019 | [15] |
| C3 | Geographical Criteria | |||
| P5 | Elevation | Digital elevation model (DEM) with 5 m × 5 m pixels from National Mapping and Resource Information Authority (NAMRIA) | 2013 | [3,8,12,18,39] |
| P6 | Slope | [1,2,3,5,8,11,12,38] | ||
| P7 | Land cover | Vector file form NAMRIA | 2020 | [1,2,3,10,11,18] |
| C4 | Technical Criteria | |||
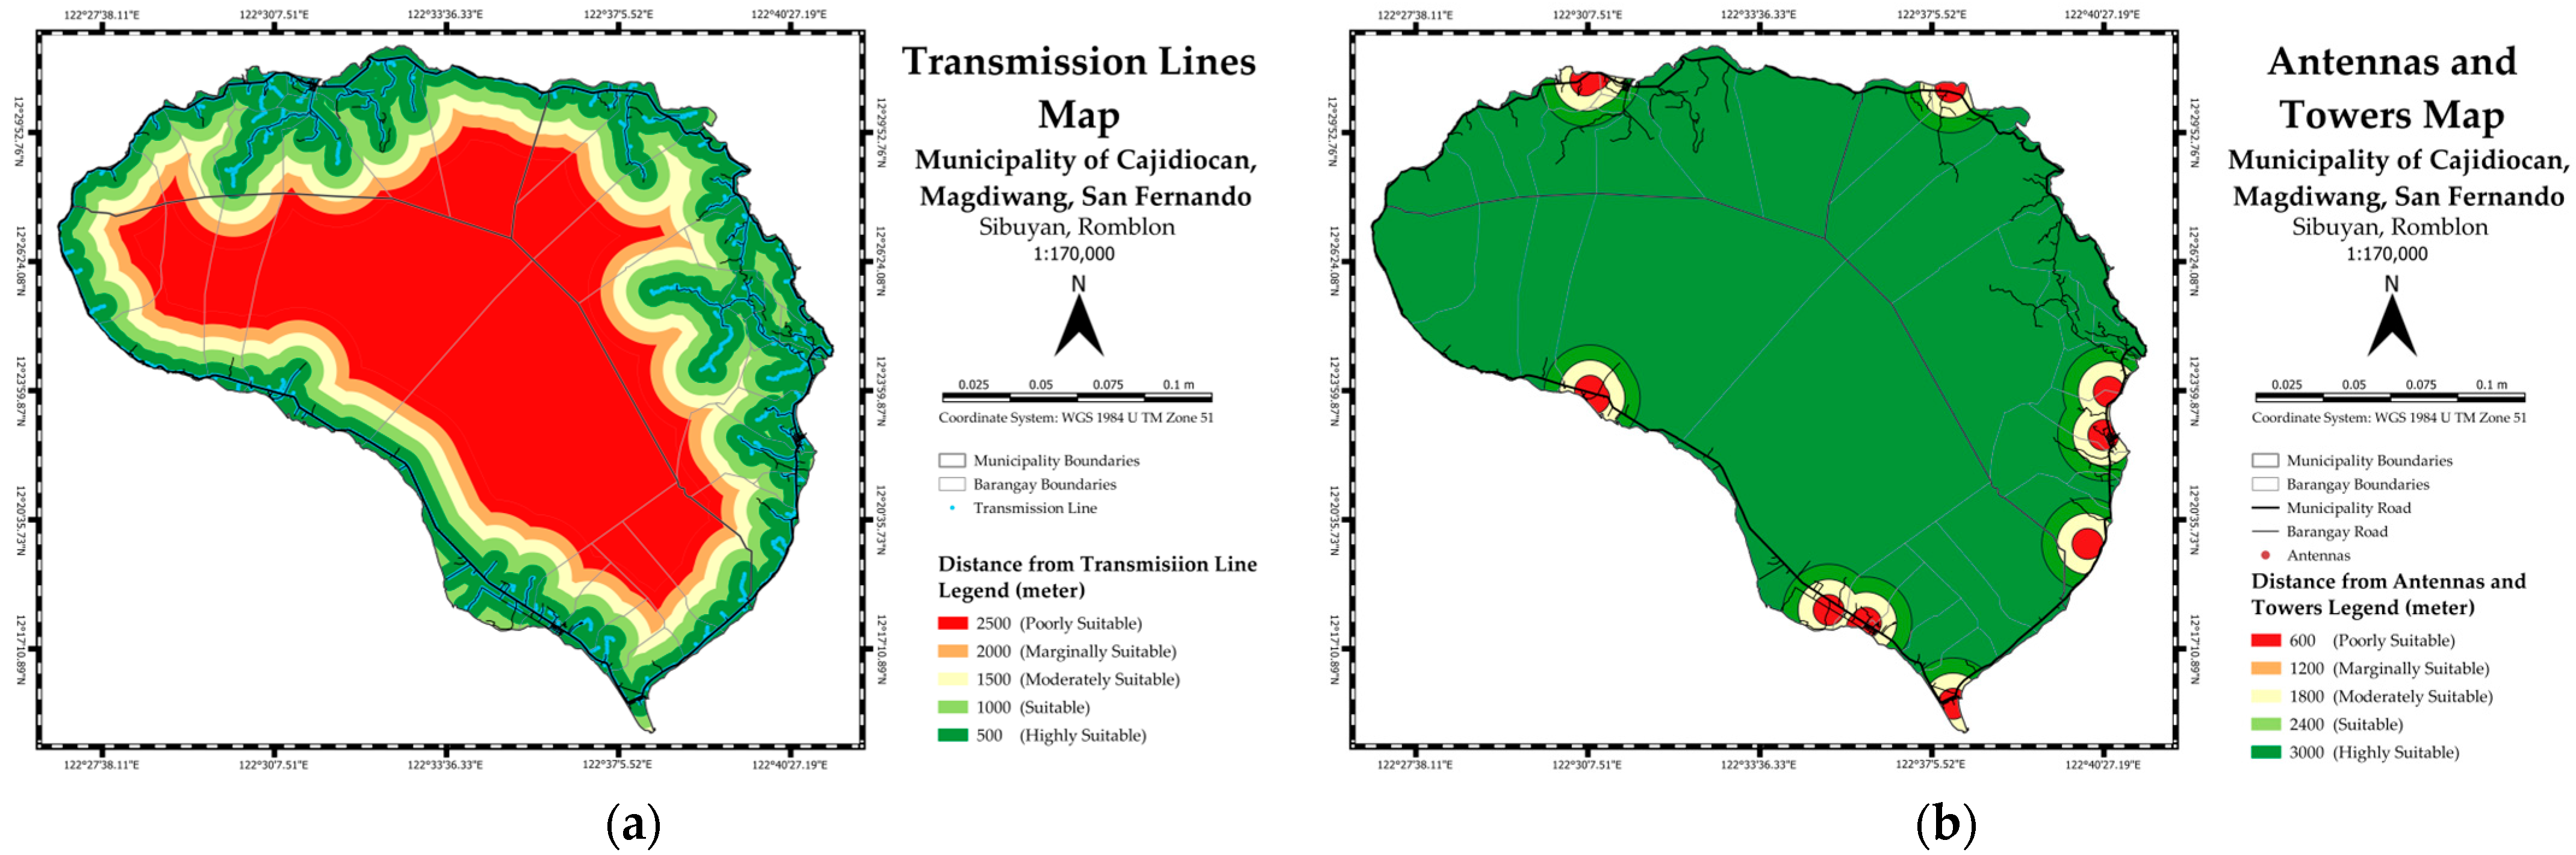
| P8 | Distance from transmission lines | Spreadsheet file of coordinates from ROMELCO | 2022 | [2,5,11,12,15,39] |
| P9 | Distance from antenna, radars, and telecoms | Spreadsheet from the Department of Information and Communications Technology (DICT) | [9,15] | |
| C5 | Disaster Susceptibility Criteria | |||
| P10 | Flood susceptibility | Vector file requested from DENR— Mines and Geosciences Bureau (MGB) | 2019 | [35,40,41] |
| P11 | Landslide susceptibility | [35,41,42] | ||
| R | Restricted Criteria | |||
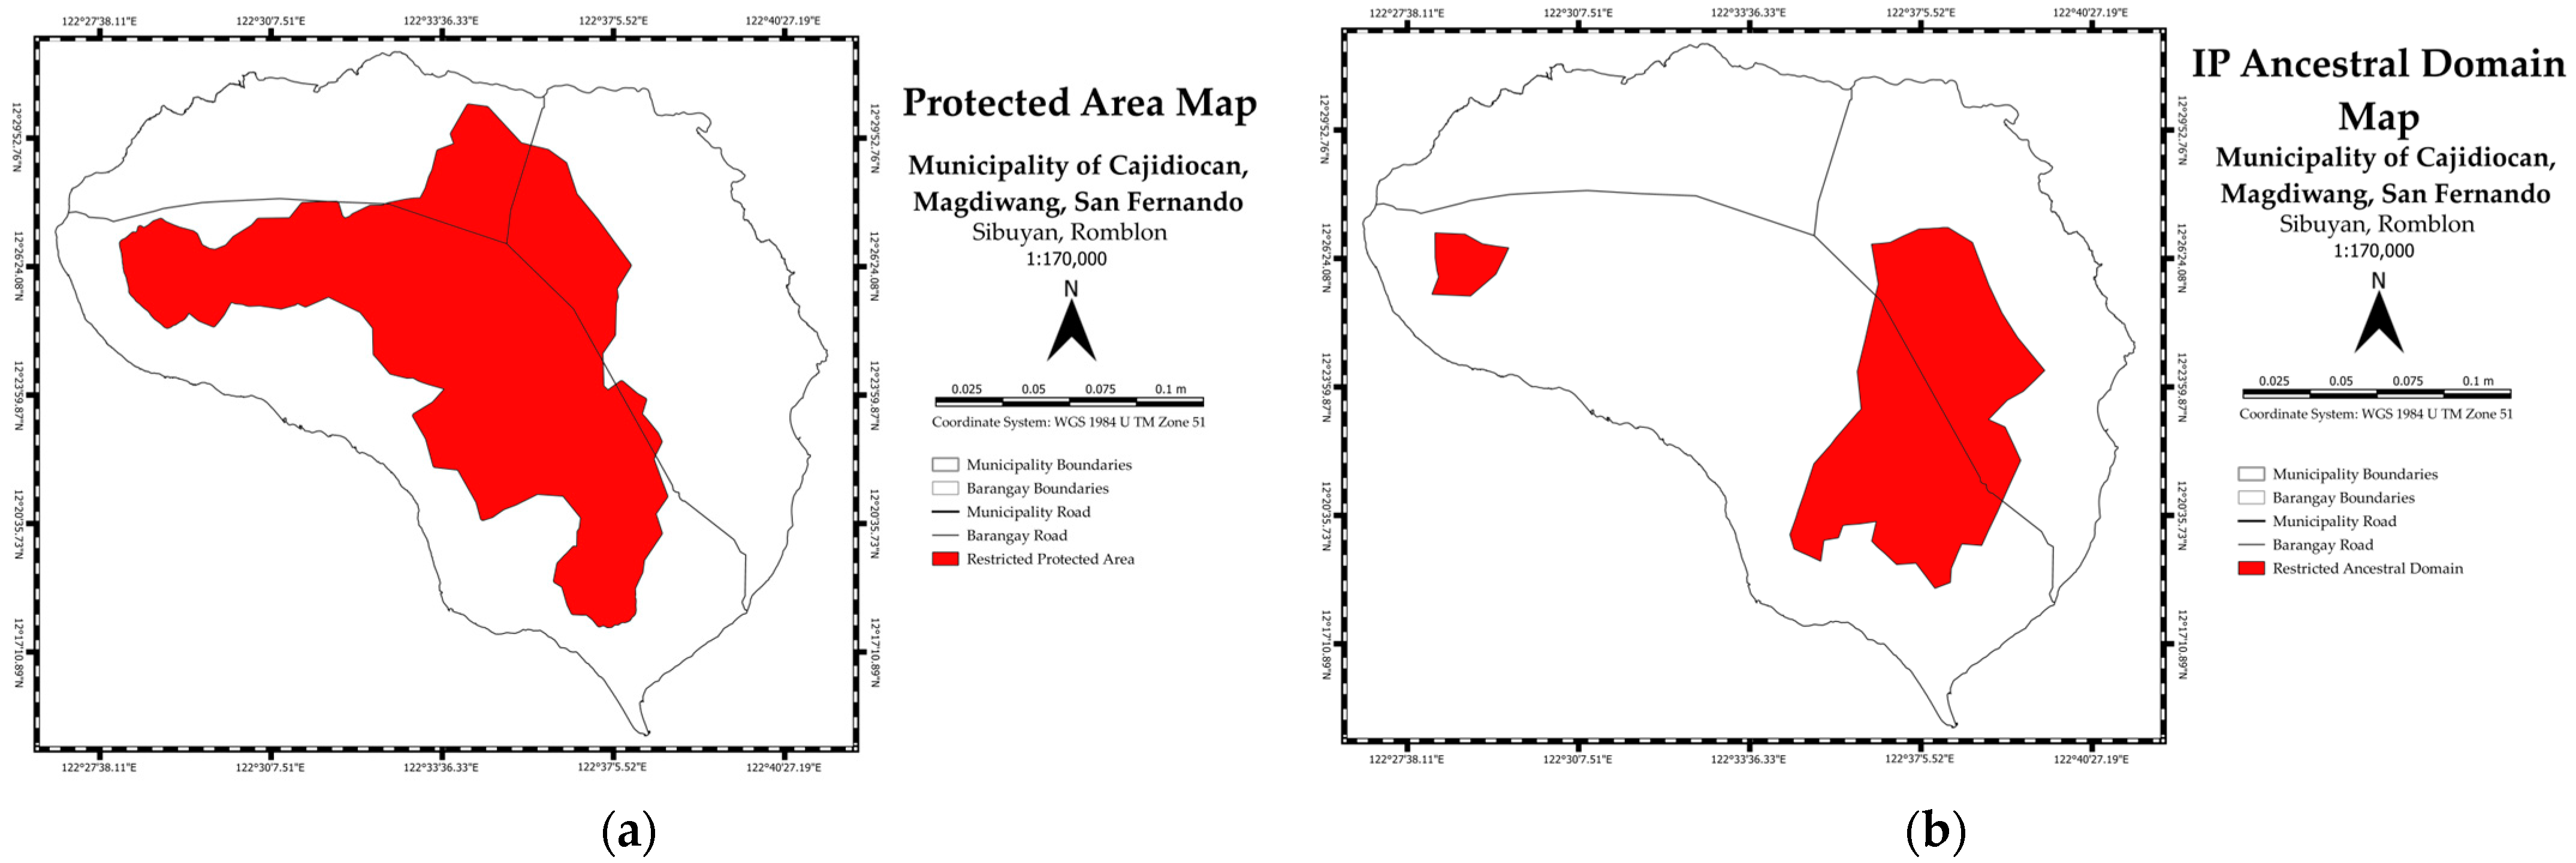
| R1 | Distance from protected areas | Vector file of NIPAS Map on Geoportal PH (https://www.geoportal.gov.ph/ accessed on 6 September 2023) | 2018 | [30,35,43,44] |
| R2 | Distance from ancestral domains | Vector file from the National Commission on Indigenous Peoples (NCIP) | 2015 | [11,15,35] |
| R3 | Distance to faults | Traced from the Map of the National Oceanic and Atmospheric Administration (NOAA) | 2017 | [45] |
| R4 | Bodies of inside water | Vector file form NAMRIA | 2019 | [2] |
2.2.2. Location (C2)
2.2.3. Geography (C3)
2.2.4. Technical (C4)
2.2.5. Disaster Susceptibility (C5)
2.2.6. Restrictive Parameters (R)
2.3. MCDM
2.4. Overlaying of Maps
3. Results
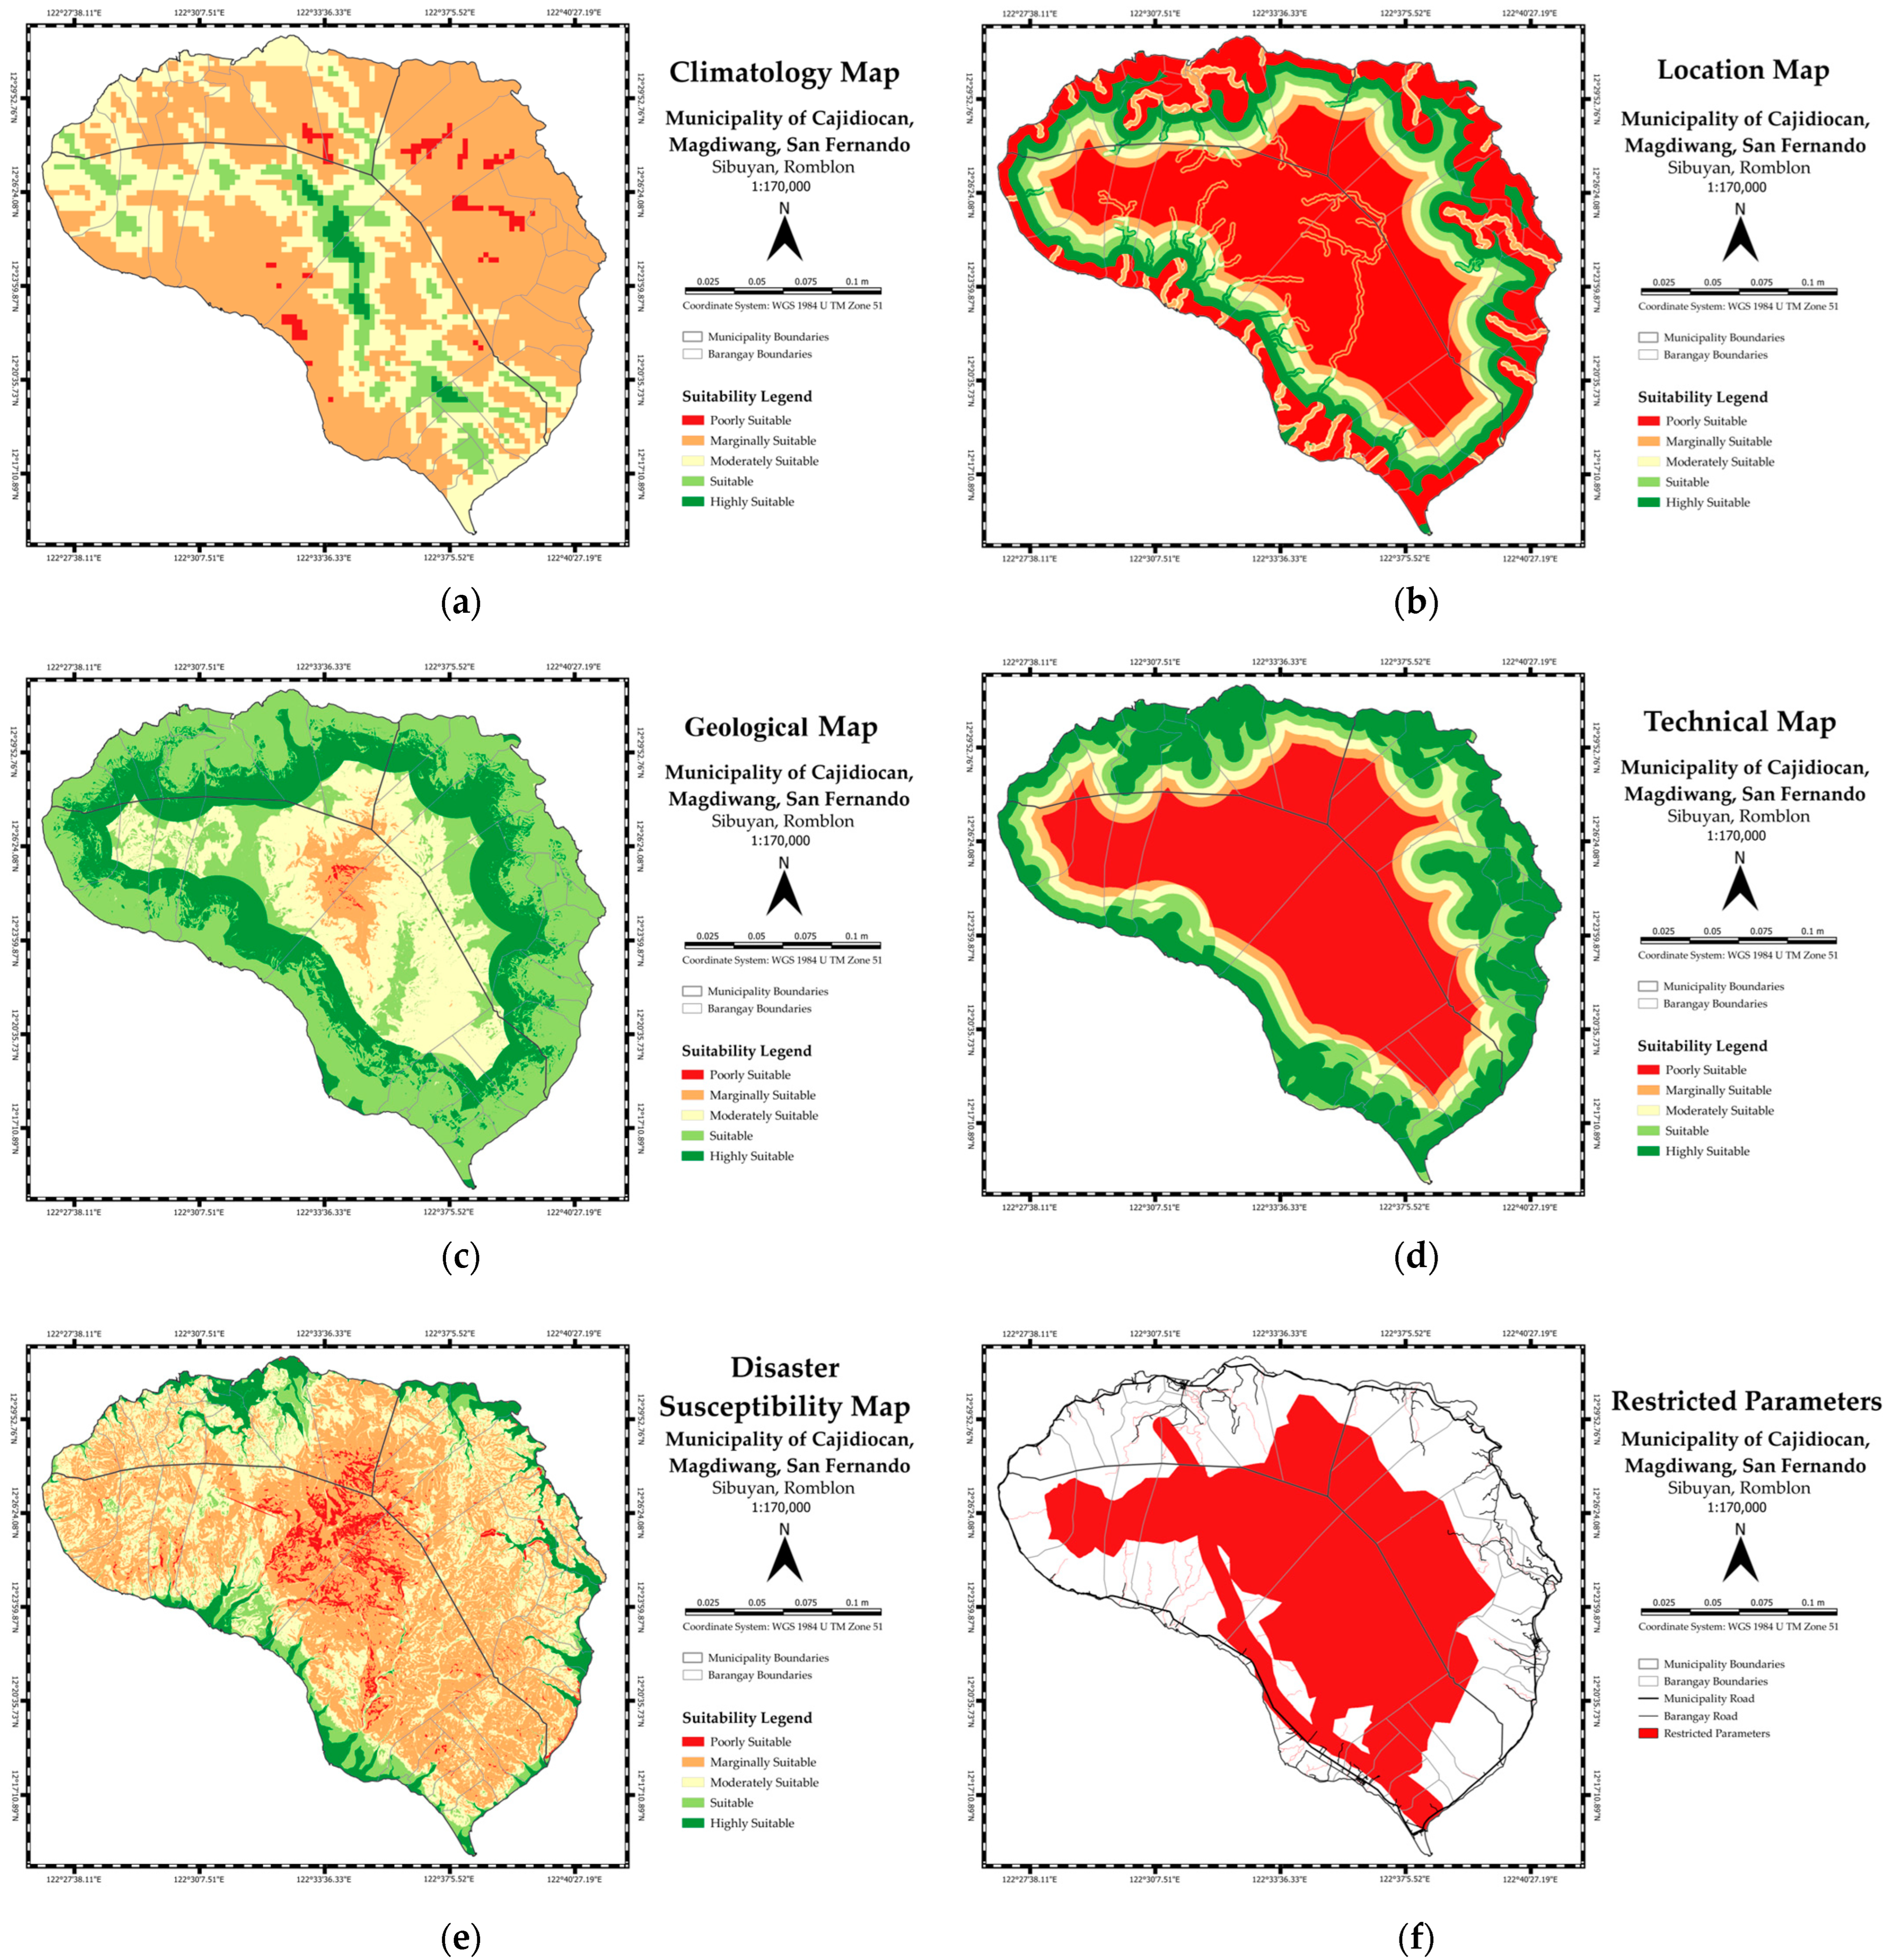
3.1. Land Resource Mapping for Identified Criteria
3.1.1. Climatology
3.1.2. Location-Related Criteria
3.1.3. Geographical Criteria
3.1.4. Technical Criteria
3.1.5. Disaster Susceptibility
3.1.6. Restricted
3.2. MCDM-AHP Results
3.3. Wind Resource Exploration Map
4. Discussion
5. Conclusions
Author Contributions
Funding
Data Availability Statement
Acknowledgments
Conflicts of Interest
Appendix A
| Respondent | Expertise/Projects | Agency/Institution |
|---|---|---|
| 1 | Ph.D., Professor (GIS Expert) | University of the Philippines Diliman (UPD) in the Department of Mechanical Engineering |
| 2 | Professor (Electrical Engineer) | Bohol State University |
| 3 | Wind Substation Engineer (Operation and Maintenance) | VENA Energy |
| 4 | Plant Manager | Alterenergy Wind One Corporation |
| 5 | Control Operator (Control and Maintenance) | Catingas Mini Hydro Power Corporation |
| 6 | Ph.D., Research Professor | University of Las Palma de Gran Canaria, Department of Electronic and Automation Engineering |
| 7 | Ph.D., Candidate | Eindhoven University of Technology, Department of Industrial Engineering and Innovation Sciences |
| 8 | Associate Professor (Principal Investigator of Several Research Projects about Offshore Renewable Energies) | University of A Coruña Esteiro Campus, Department of Naval and Industrial Engineering |
| 9 | Assistant Professor (Expert in Spatial Planning and Renewable Energy Sources) | School of Spatial Planning and Development, Aristotle University of Thessaloniki, Thessaloniki, Greece |
| 10 | Ph.D., Environmental Engineering (GIS Expert) | Mapúa University |
References
- Tercan, E. Land Suitability Assessment for Wind Farms through Best-Worst Method and GIS in Balıkesir Province of Turkey. Sustain. Energy Technol. Assess. 2021, 47, 101491. [Google Scholar] [CrossRef]
- Benti, N.E. Site Suitability Assessment for the Development of Wind Power Plant in Wolaita Area, Southern Ethiopia: An AHP-GIS Model. Sci. Rep. 2023, 13, 19811. [Google Scholar] [CrossRef]
- Okechukwu, U. Site Suitability Analysis for Locating Wind Energy Power Plant in Rivers State, Nigeria Using Geospatial Technology. Ijesc 2019, 9, 23476–23480. [Google Scholar]
- Asghar, R.; Ullah, Z.; Azeem, B.; Aslam, S.; Hashmi, M.H.; Rasool, E.; Shaker, B.; Anwar, M.J.; Mustafa, K. Wind Energy Potential in Pakistan: A Feasibility Study in Sindh Province. Energies 2022, 15, 8333. [Google Scholar] [CrossRef]
- Ozim, C.E.; Nweke, A.O.; Ekpo, S.A.; Oladeinde, O.S.; Ayuba, H.K.; Mbanaso, U.M. Spatial Analysis and Modelling of Wind Farm Site Suitability in Nasarawa State, North-Central Nigeria. J. Geogr. Inf. Syst. 2021, 13, 603–630. [Google Scholar] [CrossRef]
- Opeyemi, I.I.; Abayomi, A.S.; Suara, G. Site Suitability Assessment for Solar Photovoltaic Power Plant in FCT-Abuja, Nigeria: A Geographic Information System (GIS) and Analytical Hierarchy Process (AHP) Approach. World Sci. News 2022, 172, 88–104. [Google Scholar]
- Noorollahi, Y.; Ghenaatpisheh Senani, A.; Fadaei, A.; Simaee, M.; Moltames, R. A Framework for GIS-Based Site Selection and Technical Potential Evaluation of PV Solar Farm Using Fuzzy-Boolean Logic and AHP Multi-Criteria Decision-Making Approach. Renew. Energy 2022, 186, 89–104. [Google Scholar] [CrossRef]
- Baseer, M.A.; Rehman, S.; Meyer, J.P.; Alam, M.M. GIS-Based Site Suitability Analysis for Wind Farm Development in Saudi Arabia. Energy 2017, 141, 1166–1176. [Google Scholar] [CrossRef]
- Watson, J.J.W.; Hudson, M.D. Regional Scale Wind Farm and Solar Farm Suitability Assessment Using GIS-Assisted Multi-Criteria Evaluation. Landsc. Urban Plan. 2015, 138, 20–31. [Google Scholar] [CrossRef]
- Iusubova, N. A Multiscale Assessment of Wind Energy Resources and Suitability in the Russian Arctic. Master’s Thesis, University of Northern Iowa, Cedar Falls, IA, USA, 2017. [Google Scholar]
- Bobeck, M. A GIS-Based Multi-Criteria Decision Analysis of Wind Farm Site Suitability in New South Wales, Australia, from a Sustainable Development Perspective. Master’s Thesis, Lund University, Lund, Sweden, 2017. [Google Scholar]
- Islam, M.R.; Islam, M.R.; Imran, H.M. Assessing Wind Farm Site Suitability in Bangladesh: A GIS-AHP Approach. Sustainability 2022, 14, 14819. [Google Scholar] [CrossRef]
- Elboshy, B.; Alwetaishi, M.; Aly, R.M.H.; Zalhaf, A.S. A Suitability Mapping for the PV Solar Farms in Egypt Based on GIS-AHP to Optimize Multi-Criteria Feasibility. Ain Shams Eng. J. 2022, 13, 101618. [Google Scholar] [CrossRef]
- Gomiero, T. Soil Degradation, Land Scarcity and Food Security: Reviewing a Complex Challenge. Sustainability 2016, 8, 281. [Google Scholar] [CrossRef]
- Sotiropoulou, K.F.; Vavatsikos, A.P. Onshore Wind Farms GIS-Assisted Suitability Analysis Using PROMETHEE II. Energy Policy 2021, 158, 112531. [Google Scholar] [CrossRef]
- Zalhaf, A.S.; Elboshy, B.; Kotb, K.M.; Han, Y.; Almaliki, A.H.; Aly, R.M.H.; Elkadeem, M.R. A High-Resolution Wind Farms Suitability Mapping Using Gis and Fuzzy Ahp Approach: A National-Level Case Study in Sudan. Sustainability 2022, 14, 358. [Google Scholar] [CrossRef]
- Hou, G.; Xu, K.; Lian, J. A Review on Recent Risk Assessment Methodologies of Offshore Wind Turbine Foundations. Ocean Eng. 2022, 264, 112469. [Google Scholar] [CrossRef]
- Azizi, A.; Malekmohammadi, B.; Jafari, H.R.; Nasiri, H.; Amini Parsa, V. Land Suitability Assessment for Wind Power Plant Site Selection Using ANP-DEMATEL in a GIS Environment: Case Study of Ardabil Province, Iran. Environ. Monit. Assess. 2014, 186, 6695–6709. [Google Scholar] [CrossRef] [PubMed]
- Adedeji, P.A.; Akinlabi, S.A.; Madushele, N.; Olatunji, O.O. Neuro-Fuzzy Resource Forecast in Site Suitability Assessment for Wind and Solar Energy: A Mini Review. J. Clean. Prod. 2020, 269, 122104. [Google Scholar] [CrossRef]
- Athanasios, S. A GIS-Based Multicriteria Decision Analysis Approach on Wind Power Development: The Case of Nova Scotia, Canada. Master’s Thesis, Uppsala Universitet, Uppsala, Sweden, 2018. [Google Scholar]
- Biswal, G.C.; Shukla, S.P. Site Selection for Wind Farm Installation. Ijireeice 2015, 3, 59–61. [Google Scholar] [CrossRef]
- Nebey, A.H.; Taye, B.Z.; Workineh, T.G. Site Suitability Analysis of Solar PV Power Generation in South Gondar, Amhara Region. J. Energy 2020, 2020, 3519257. [Google Scholar] [CrossRef]
- Kılıç, B. Determination of Wind Dissipation Maps and Wind Energy Potential in Burdur Province of Turkey Using Geographic Information System (GIS). Sustain. Energy Technol. Assess. 2019, 36, 100555. [Google Scholar] [CrossRef]
- Ryan, S.; Nimick, E. Multi-Criteria Decision Analysis and GIS. Available online: https://storymaps.arcgis.com/stories/b60b7399f6944bca86d1be6616c178cf (accessed on 29 October 2023).
- Gacu, J.G.; Monjardin, C.E.F.; Senoro, D.B.; Tan, F.J. Flood Risk Assessment Using GIS-Based Analytical Hierarchy Process in the Municipality of Odiongan, Romblon, Philippines. Appl. Sci. 2022, 12, 9456. [Google Scholar] [CrossRef]
- Vaidya, O.S.; Kumar, S. Analytic Hierarchy Process: An Overview of Applications. Eur. J. Oper. Res. 2006, 169, 1–29. [Google Scholar] [CrossRef]
- Khashei-Siuki, A.; Keshavarz, A.; Sharifan, H. Comparison of AHP and FAHP Methods in Determining Suitable Areas for Drinking Water Harvesting in Birjand Aquifer. Iran. Groundw. Sustain. Dev. 2020, 10, 100328. [Google Scholar] [CrossRef]
- Raza, M.A.; Yousif, M.; Hassan, M.; Numan, M.; Abbas Kazmi, S.A. Site Suitability for Solar and Wind Energy in Developing Countries Using Combination of GIS-AHP; a Case Study of Pakistan. Renew. Energy 2023, 206, 180–191. [Google Scholar] [CrossRef]
- Amjad, F.; Agyekum, E.B.; Shah, L.A.; Abbas, A. Site Location and Allocation Decision for Onshore Wind Farms, Using Spatial Multi-Criteria Analysis and Density-Based Clustering. A Techno-Economic-Environmental Assessment, Ghana. Sustain. Energy Technol. Assess. 2021, 47, 101503. [Google Scholar] [CrossRef]
- Rediske, G.; Burin, H.P.; Rigo, P.D.; Rosa, C.B.; Michels, L.; Siluk, J.C.M. Wind Power Plant Site Selection: A Systematic Review. Renew. Sustain. Energy Rev. 2021, 148, 111293. [Google Scholar] [CrossRef]
- Rosellon, M.A.D. The Renewable Energy Policy Debate in the Philippines; PIDS Discussion Paper Series, No. 2017-17; Philippine Institute for Development Studies (PIDS): Quezon City, Philippines, 2017; pp. 1–43. [Google Scholar]
- Pabellano, P.C. Harnessing the Power of Nature: Rise of Wind Energy in the Philippines. Available online: https://billionbricks.org/updates/harnessing-the-power-of-nature-rise-of-wind-energy-in-the-philippines (accessed on 5 December 2023).
- Department of Energy. Philippine Energy Plan 2020–2040. 2020. Available online: https://www.doe.gov.ph/pep (accessed on 13 February 2024).
- Department of Energy. Romblon Energy Plan 2018–2040. 2018. Available online: https://www.doe.gov.ph/pep (accessed on 13 February 2024).
- Gacu, J.G.; Garcia, J.D.; Fetalvero, E.G.; Catajay-Mani, M.P.; Monjardin, C.E.F. Suitability Analysis Using GIS-Based Analytic Hierarchy Process (AHP) for Solar Power Exploration. Energies 2023, 16, 6724. [Google Scholar] [CrossRef]
- Xu, Y.; Li, Y.; Zheng, L.; Cui, L.; Li, S.; Li, W.; Cai, Y. Site Selection of Wind Farms Using GIS and Multi-Criteria Decision Making Method in Wafangdian, China. Energy 2020, 207, 118222. [Google Scholar] [CrossRef]
- Zahid, F.; Tahir, A.; Khan, H.U.; Naeem, M.A. Wind Farms Selection Using Geospatial Technologies and Energy Generation Capacity in Gwadar. Energy Rep. 2021, 7, 5857–5870. [Google Scholar] [CrossRef]
- Karamountzou, S.; Vagiona, D.G. Suitability and Sustainability Assessment of Existing Onshore Wind Farms in Greece. Sustainability 2023, 15, 2095. [Google Scholar] [CrossRef]
- Rabbani, R.; Zeeshan, M. Exploring the Suitability of MERRA-2 Reanalysis Data for Wind Energy Estimation, Analysis of Wind Characteristics and Energy Potential Assessment for Selected Sites in Pakistan. Renew. Energy 2020, 154, 1240–1251. [Google Scholar] [CrossRef]
- Hao, K.; Ialnazov, D.; Yamashiki, Y. GIS Analysis of Solar PV Locations and Disaster Risk Areas in Japan. Front. Sustain. 2021, 2, 815986. [Google Scholar] [CrossRef]
- Sward, J.A.; Nilson, R.S.; Katkar, V.V.; Stedman, R.C.; Kay, D.L.; Ifft, J.E.; Zhang, K.M. Integrating Social Considerations in Multicriteria Decision Analysis for Utility-Scale Solar Photovoltaic Siting. Appl. Energy 2021, 288, 116543. [Google Scholar] [CrossRef]
- Pintor, B.H.; Sola, E.F.; Teves, J.; Inocencio, L.C.; Ang, M.R.C. Solar Energy Resource Assessment Using R.SUN In GRASS GIS And Site Suitability Analysis Using AHP For Groundmounted Solar Photovoltaic (PV) Farm in the Central Luzon Region (Region 3), Philippines. In Proceedings of the FOSS4G Seoul 2015, Seoul, Republic of Korea, 14–19 September 2015; Volume 15, p. 3. [Google Scholar]
- Hosseinzadeh, S.; Etemad-Shahidi, A.; Stewart, R.A. Site Selection of Combined Offshore Wind and Wave Energy Farms: A Systematic Review. Energies 2023, 16, 2074. [Google Scholar] [CrossRef]
- Gašparović, I.; Gašparović, M. Determining Optimal Solar Power Plant Locations Based on Remote Sensing and GIS Methods: A Case Study from Croatia. Remote Sens. 2019, 11, 1481. [Google Scholar] [CrossRef]
- Karipoğlu, F.; Genç, M.S.; Koca, K. Determination of the Most Appropriate Site Selection of Wind Power Plants Based Geographic Information System and Multi-Criteria Decision-Making Approach in Develi, Turkey. Int. J. Sustain. Energy Plan. Manag. 2021, 30, 97–114. [Google Scholar] [CrossRef]
- Asadi, M.; Pourhossein, K. Wind Farm Site Selection Considering Turbulence Intensity. Energy 2021, 236, 121480. [Google Scholar] [CrossRef]
- Ayodele, T.R.; Ogunjuyigbe, A.S.O.; Odigie, O.; Munda, J.L. A Multi-Criteria GIS Based Model for Wind Farm Site Selection Using Interval Type-2 Fuzzy Analytic Hierarchy Process: The Case Study of Nigeria. Appl. Energy 2018, 228, 1853–1869. [Google Scholar] [CrossRef]
- Shao, Z.; Jahangir, Z.; Yasir, Q.M.; Mahmood, S. Identification of Potential Sites for a Multi-Purpose Dam Using a Dam Suitability Stream Model. Water 2020, 12, 3249. [Google Scholar] [CrossRef]
- Noorollahi, E.; Fadai, D.; Shirazi, M.A.; Ghodsipour, S.H. Land Suitability Analysis for Solar Farms Exploitation Using GIS and Fuzzy Analytic Hierarchy Process (FAHP)—A Case Study of Iran. Energies 2016, 9, 643. [Google Scholar] [CrossRef]
- Gigović, L.; Pamučar, D.; Bajić, Z.; Drobnjak, S. Application of GIS-Interval Rough AHP Methodology for Flood Hazard Mapping in Urban Areas. Water 2017, 9, 360. [Google Scholar] [CrossRef]
- Tercan, E.; Eymen, A.; Urfalı, T.; Saracoglu, B.O. A Sustainable Framework for Spatial Planning of Photovoltaic Solar Farms Using GIS and Multi-Criteria Assessment Approach in Central Anatolia, Turkey. Land Use Policy 2021, 102, 105272. [Google Scholar] [CrossRef]
- Ifkirne, M.; El Bouhi, H.; Acharki, S.; Pham, Q.B.; Farah, A. Multi-Criteria GIS-Based Analysis for Mapping Suitable Sites for Onshore Wind Farms in Southeast France. Land 2022, 11, 1839. [Google Scholar] [CrossRef]
- Conover, K. Philippine Wind Farm Analysis and Site Selection Analysis; US Department of Energy: Washington, DC, USA, 2001; pp. 1–88.
- Elliott, D. Philippines Wind Energy Resource Atlas Development. In Proceedings of the Business and Investment Forum for Renewable Energy and Energy Efficiency in Asia and the Pacific Region, Kuala Lumpur, Malaysia, 4–7 September 2000; pp. 1–10. [Google Scholar]
- Silang, A.; Uy, S.N.; Dado, J.M.; Cruz, F.A.; Narisma, G.; Libatique, N.; Tangonan, G. Wind Energy Projection for the Philippines Based on Climate Change Modeling. Energy Procedia 2014, 52, 26–37. [Google Scholar] [CrossRef]
- Maandal, G.L.D.; Tamayao-Kieke, M.A.M.; Danao, L.A.M. Techno-Economic Assessment of Offshore Wind Energy in the Philippines. J. Mar. Sci. Eng. 2021, 9, 758. [Google Scholar] [CrossRef]
- Kia, M.B.; Pirasteh, S.; Pradhan, B.; Mahmud, A.R.; Sulaiman, W.N.A.; Moradi, A. An Artificial Neural Network Model for Flood Simulation Using GIS: Johor River Basin, Malaysia. Environ. Earth Sci. 2012, 67, 251–264. [Google Scholar] [CrossRef]
- Garcia, J.; Gacu, J.; Lawrence, M. Suitability Analysis for Solar PV Farm Installation Using GIS and Analytical Hierarchy Process (AHP) in Simara Island, Province of Romblon, Philippines. E3S Web Conf. 2024, 473, 01013. [Google Scholar] [CrossRef]
- Gacu, J.G.; Monjardin, C.E.F.; de Jesus, K.L.M.; Senoro, D.B. GIS-Based Risk Assessment of Structure Attributes in Flood Zones of Odiongan, Romblon, Philippines. Buildings 2023, 13, 506. [Google Scholar] [CrossRef]
- Taoufik, M.; Laghlimi, M.; Fekri, A. Land Suitability Analysis for Solar Farms Exploitation Using the GIS and Analytic Hierarchy Process (AHP)—A Case Study of Morocco. Polityka Energ. 2021, 24, 79–96. [Google Scholar] [CrossRef]
- Yilmaz, I. A Hybrid DEA–Fuzzy COPRAS Approach to the Evaluation of Renewable Energy: A Case of Wind Farms in Turkey. Sustainability 2023, 15, 11267. [Google Scholar] [CrossRef]
- Ahmed, F.; Kilic, K. Fuzzy Analytic Hierarchy Process: A Performance Analysis of Various Algorithms. Fuzzy Sets Syst. 2019, 362, 110–128. [Google Scholar] [CrossRef]
- Sachit, M.S.; Zulhaidi, H.; Shafri, M.; Abdullah, A.F.; Shakrine, A.; Rafie, M.; Gibril, M.B.A. Global Spatial Suitability Mapping of Wind and Solar Systems Using an Explainable AI-Based Approach. ISPRS Int. J. Geo-Inf. 2022, 11, 422. [Google Scholar] [CrossRef]


| Criteria | Parameters/Factors | Final Weights (%) |
|---|---|---|
| C1 | P1 | 80.15 |
| P2 | 19.85 | |
| C2 | P3 | 71.44 |
| P4 | 28.56 | |
| C3 | P5 | 49.00 |
| P6 | 24.37 | |
| P7 | 26.64 | |
| C4 | P8 | 85.51 |
| P9 | 14.49 | |
| C5 | P10 | 26.22 |
| P11 | 73.78 |
| Level of Suitability and Range of Index Value | Percentage (%) | Land Area (km2) |
|---|---|---|
| Poorly suitable (restricted) | 50.44 | 224.48 |
| Marginally suitable (0–1) | 0.08 | 0.35 |
| Moderately suitable (2–3) | 9.15 | 40.73 |
| Suitable (3–4) | 36.64 | 176.39 |
| Highly suitable (4–5) | 0.69 | 3.05 |
Disclaimer/Publisher’s Note: The statements, opinions and data contained in all publications are solely those of the individual author(s) and contributor(s) and not of MDPI and/or the editor(s). MDPI and/or the editor(s) disclaim responsibility for any injury to people or property resulting from any ideas, methods, instructions or products referred to in the content. |
© 2024 by the authors. Licensee MDPI, Basel, Switzerland. This article is an open access article distributed under the terms and conditions of the Creative Commons Attribution (CC BY) license (https://creativecommons.org/licenses/by/4.0/).
Share and Cite
Gacu, J.G.; Garcia, J.D.; Fetalvero, E.G.; Catajay-Mani, M.P.; Monjardin, C.E.F.; Power, C. A Comprehensive Resource Assessment for Wind Power Generation on the Rural Island of Sibuyan, Philippines. Energies 2024, 17, 2055. https://0-doi-org.brum.beds.ac.uk/10.3390/en17092055
Gacu JG, Garcia JD, Fetalvero EG, Catajay-Mani MP, Monjardin CEF, Power C. A Comprehensive Resource Assessment for Wind Power Generation on the Rural Island of Sibuyan, Philippines. Energies. 2024; 17(9):2055. https://0-doi-org.brum.beds.ac.uk/10.3390/en17092055
Chicago/Turabian StyleGacu, Jerome G., Junrey D. Garcia, Eddie G. Fetalvero, Merian P. Catajay-Mani, Cris Edward F. Monjardin, and Christopher Power. 2024. "A Comprehensive Resource Assessment for Wind Power Generation on the Rural Island of Sibuyan, Philippines" Energies 17, no. 9: 2055. https://0-doi-org.brum.beds.ac.uk/10.3390/en17092055