
CO2 Capture Cost Reduction Potential of the Coal-Fired Power Plants under High Penetration of Renewable Power in China

1
School of Ecology, Environment and Resources, Guangdong University of Technology, No. 100 Waihuan Xi Road, Guangzhou 510006, China
2
Collaborative Innovation Institute of Carbon Neutrality and Green Development, Guangdong University of Technology, No. 100 Waihuan Xi Road, Guangzhou 510006, China
3
Shenzhen Gas Corporation Ltd., Shenzhen 518040, China
*
Authors to whom correspondence should be addressed.
Energies 2024, 17(9), 2050; https://0-doi-org.brum.beds.ac.uk/10.3390/en17092050
Submission received: 29 March 2024
/
Revised: 21 April 2024
/
Accepted: 24 April 2024
/
Published: 25 April 2024
Abstract
:With a significant share of renewable power generation integrated into the power supply, it is crucial to timely adjust the regulating peak load for coal-fired power plants equipped with CO2 capture to ensure the stable operation of the multi-energy supply system. In this paper, the effects of varying boiler loads on the techno-economic performance of the retrofitted power plant were studied. Furthermore, the potential for reducing the cost of CO2 capture was investigated, and early opportunities for demonstration were discussed. Results showed that when the boiler load decreased from 100% turbine heat acceptance condition to 50% turbine heat acceptance condition, the cost of CO2 capture increased from 37.0 $/t CO2 to 57.0 $/t CO2, cost contribution of energy penalty and extra capital investment also increased from 20.6 $/t-CO2 to 25.7 $/t-CO2, and from 16.4 $/t-CO2 to 31.3 $/t-CO2, respectively. Furthermore, by improving separation efficiency from 0.15 to 0.5, a 25% to 30% reduction in CO2 capture cost can be achieved. The cost of CO2 capture could decrease by 42.2–50.5% when the cumulative capacity reaches 250 GW under the high investment learning rate scenario. According to the distribution of coal prices and renewable energy sources in China, the early demonstration projects of multi-energy supply systems should prioritize the northern region. The results of this work can provide informative references for making roadmaps and policies for CO2 emission reduction toward carbon neutrality.
1. Introduction
Climate change resulting from anthropogenic greenhouse gas (GHG) emissions is one of the major global challenges of the 21st century [1]. CO2 emissions account for almost 75% of anthropogenic greenhouse gas emissions [2]. Reducing these emissions can have the greatest effect on limiting global warming. Currently, nearly 41% of emissions come from the power sector in China [3], and decarbonizing the power sector is key to controlling CO2 emissions and achieving the target of carbon neutrality. CO2 emissions from the power sector can be mitigated through three aspects: (i) improving energy efficiency, (ii) developing renewable energy, and (iii) deploying CO2 capture and storage (CCS) technology.
It can be safely assumed that renewable energy will play a more important role in the future energy system. On the one hand, it is believed that the cost of renewable power will fall sharply with the Chinese government’s financial support and technological advancements in renewable energy. For example, by 2035 and 2050, it is estimated that the price of solar photovoltaic (PV) will be reduced to about 0.029 $/kWh and 0.019 $/kWh [4], respectively. On the other hand, the installed capacities of wind and solar power plants are growing rapidly. The proportion of total wind power and solar PV power generation in the world’s global power generation has increased from 3% to 9.3%. [5]. It was estimated the share of renewable energy will be achieved at 76% by 2060 in China [6]. With a significant share of renewable power generation integrated into the power supply, dispatchable thermal power plants fueled by fossil fuels will still be necessary to ensure a stable power supply. However, the utilization of fossil fuels inevitably leads to CO2 emissions. CCS was the only way to achieve the low-carbon utilization of high-carbon fossil fuels. It is predicted that most coal-fired power plants will be equipped with CO2 capture and storage (CCS) technology to further reduce CO2 emissions in the future [7]. Therefore, the integration of renewable energy and CCS in a multi-energy system will provide an alternative for stable and low-carbon power generation. However, to balance renewable energy sources, retrofitted coal-fired power plants are required to operate flexibly under variable load conditions. Techno-economic performance under variable load conditions and the additional capital investment required for CO2 capture pose serious challenges to the economic feasibility of the multi-energy supply system [8].
For coal-fired power plants, post-combustion CO2 capture (PCC) using an amine-based solvent has been recognized as a promising technology. The amine-based PCC technology is mature and can be easily retrofitted to existing coal-fired power plants [9,10,11,12,13,14]. Flexible operation of coal-fired power plants with CCS technology can be achieved by adjusting the operating loads of the coal-fired boiler and post-combustion capture units. Most studies have focused on the techno-economic performance and optimization strategies of the CO2 capture unit in response to variations in electricity prices when the coal-fired boiler operates under design load conditions [15,16,17,18]. In the CO2 capture unit, a bypass configuration is adopted to meet the requirement for flexible operation. However, the flexibility of the bypass configuration comes at the expense of the CO2 capture rate, which was regulated by adjusting the amount of treated flue gas in the CO2 capture unit. In the retrofitted coal-fired power plant, adjusting the boiler loads and eliminating the bypass configuration of the CO2 capture unit can be an effective alternative to maintain the CO2 capture rate during flexible operation. However, there have been relatively few studies focused on the techno-economic performance under variable boiler loads in coal-fired power plants with CCS. Therefore, the thermodynamic performance and economic assessment are evaluated under variable boiler loads, and a sensitivity study was conducted to investigate the effects of economic parameters. Furthermore, the cost contributions of energy penalties and additional capital investments were derived and investigated to reveal the potential for cost savings. The study examined the cost reduction potentials of improving separation efficiency and deploying large-scale commercial operations.
In this paper, a thermodynamic analysis and economic assessment will be conducted to investigate the retrofitted power plant with CCS technology operating under variable load conditions. The study examined the impact of variable boiler load on the techno-economic performance of the retrofitted power plant and analyzed the sensitivities of economic parameters. Furthermore, the study examined the cost implications of the energy penalty and additional capital investment. The potential for reducing the cost of CO2 capture was analyzed by decreasing energy penalties and extra capital investments, and early opportunities for demonstrations were briefly discussed.
2. System Description and Evaluation
2.1. System Description
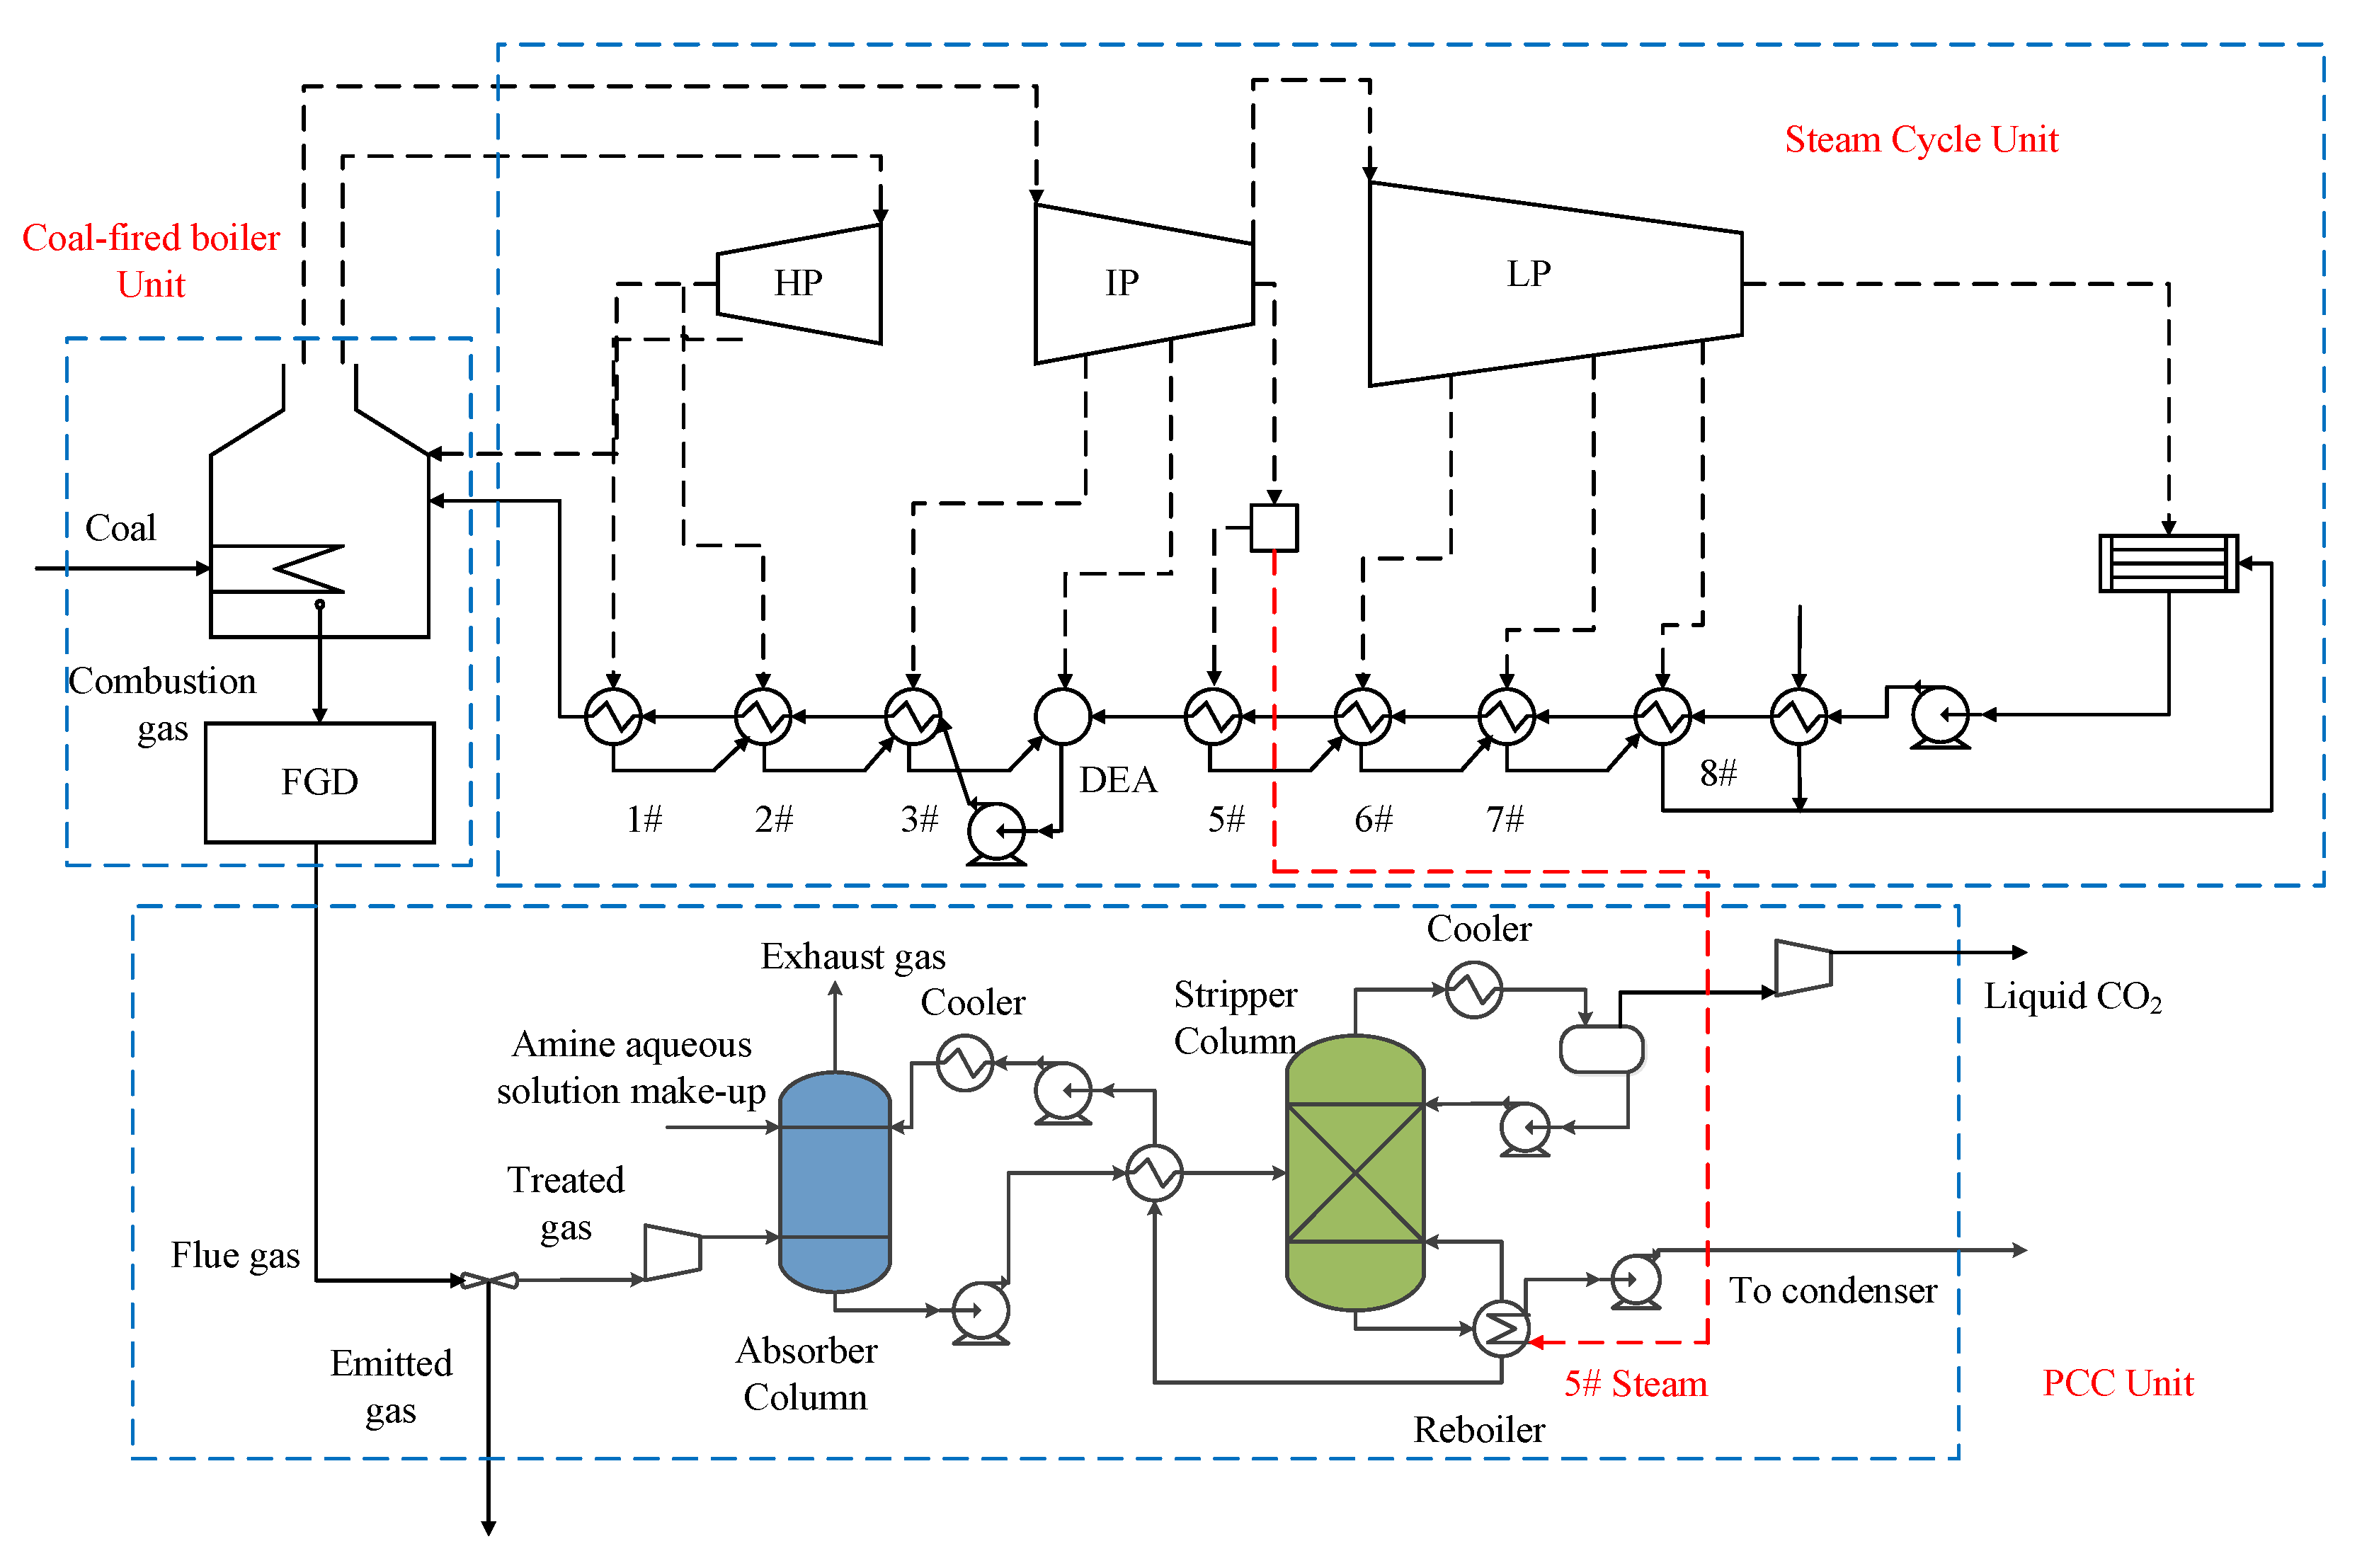
In this work, a 350 MW supercritical unit of the coal-fired power plant was selected as the reference system. The simplified diagram of the retrofitted power plant with CO2 capture is shown in Figure 1. The retrofitted power plant consisted of a coal-fired boiler unit, a PCC unit, and a steam cycle unit. In the coal-fired boiler unit, coal is combusted in the boiler with preheated air. Subsequently, the combustion gas is directed to the steam drum, where the sensible heat of the combustion gas is recovered to generate steam. After heat recovery, the steam generated in the steam drum was directed to the steam cycle unit, while the combustion gas was sent to undergo pollutant removal in the flue gas desulfurization (FGD) process. In the FGD process, NOx, toxic particles, SO2, and other harmful gases were eliminated to meet the emission standards. Following the FGD process, high-purity CO2 was separated from the flue gas in the PCC unit.
The steam cycle unit consisted of a reheat, six stages, and a dual exhaust and extraction condensing system with eight extractions. The extractions supplied steam for three high-pressure heaters (1#, 2#, 3#), a deaerator (DEA), four low-pressure heaters (5#, 6#, 7#, 8#), two pump turbines, and an auxiliary steam system. In the steam cycle unit, condensed water was pressurized by a low-pressure pump. Then, pressurized water was preheated in low-pressure heaters, DEA, and high-pressure heaters. The preheated water was then sent to the steam drum to exchange heat with the combustion gas. By absorbing sensible heat from the combustion gas, superheated steam with high pressure is generated and expands in the high-pressure (HP) steam turbines. After expansion, the exhaust steam was sent back to the boiler and reheated there. The reheated steam expanded in medium-pressure (MP) steam turbines, and the fifth-stage extraction steam from the MP cylinder was partially extracted to provide heat for the CO2 regeneration in the PCC unit. Subsequently, the exhaust steam from the medium-pressure (MP) steam turbine was directed to the low-pressure (LP) steam turbines. The exhaust steam from the low-pressure (LP) steam turbine was condensed in the condenser. Finally, the condensed water was pressurized in the pump, completing the steam cycle.
The PCC unit consisted of an amine-based CO2 capture process and a CO2 compression process. The treated flue gas was sent to the absorber column. In the absorber column, a countercurrent contact configuration was utilized between the treated flue gas and the absorbent (amine aqueous solution). The countercurrent contact configuration was beneficial for the reaction between the amine absorbent and CO2. After the absorption reaction, the exhaust gas with a low CO2 concentration was emitted, and the CO2-rich solvent was pumped into a heat exchanger. In the heat exchanger, the concentrated solvent was warmed by the diluted solvent before being introduced into the stripper column. In the stripper column, the rich solvent was regenerated, and CO2 was stripped. After regenerating the solvent, the lean solvent was recycled back to the absorber column. Generally, the temperature for CO2 stripping was approximately 115–120 °C. To meet the heat requirement for solvent regeneration, saturated steam was extracted from the MP steam turbine. Since the extracted steam at high temperatures could cause solvent decomposition, it is necessary to cool the extraction steam by desalting water to achieve the desired level of saturation. After the regeneration process in the reboiler, the steam was condensed into a liquid. Subsequently, it would be pumped to the deaerator to initiate a new steam flow cycle. After passing through the stripper column, the stripped CO2 stream was cooled in the CO2 condenser to eliminate moisture. Finally, the CO2 stream was compressed to a liquid state at 10 MPa for transport and storage. Considering the degradation of the amine, a small quantity of makeup amine solution was added to the absorber column. Through the amine-based CO2 capture process, approximately 90% of the CO2 in the treated flue gas was recovered.
2.2. Techno-Economic Performance Evaluation
In this section, the cost of electricity (COE) is calculated, and the cost of CO2 capture (COC) is selected to evaluate the cost penalties of the retrofitted power plant. The COE was defined as Equation (1).
In the numerator, the first item was the annual investment cost, while the second and third items were the annual operating and maintenance (O&M) cost and annual fuel cost, respectively. In addition, CF represented the capacity factor of the retrofitted power plant, and T indicated the annual operation hours (hours/year).
As shown in Equation (1), the annual investment cost was calculated by the total capital requirement (TCR) and capital recovery factor (CRF). TCR was composed of fixed capital requirements, construction period interest, and operating costs. CRF was associated with the discounted rate and the lifespan of the equipment, which could be calculated using Equation (2).
where i and n were the discounted rate and life of equipment in the retrofitted power plant, respectively.
For the reference coal-fired power plant without the PCC unit, the fixed static investment was estimated at 588.3 $/kW [19]. In the retrofitted power plant, the PCC unit was required, which included an amine-based CO2 capture process and CO2 compression process. The fixed capital investment requirement of the PCC unit could be calculated based on the scaling-up method, as demonstrated in Equation (3). The fixed capital investment requirement of the PCC unit was calculated based on a 90% CO2 capture ratio (CCR). The fixed capital investment requirement was constant and independent of the CCR and the boiler load.
where S was the scale of the equipment. Subscripts i and r and superscript f denoted the ith equipment of the system, reference equipment, and corresponding scale factor, respectively. The recommended scale factors of the amine-based CO2 capture unit and CO2 compression unit were 0.67 and 0.77, respectively [20].
Similarly, the cost of electricity (COEw) in the retrofitted power plant could be calculated by Equation (4):
where TCRw and Pw were the total capital requirements and net power output of the retrofitted power plant with CO2 capture, respectively.
To evaluate the increased cost caused by CO2 capture, the cost of CO2 capture (COC) was selected. The COC represents the cost required for CO2 capture per unit of power output, which can be calculated using Equation (5).
where COEw and COEwo were the cost of electricity of the retrofitted power plant and reference power plant without CO2 capture operating under the same boiler load condition, respectively. MCO2,captured represented the mass flow rate of CO2 captured from the flue gas, kg/s.
Combining with Equations (1), (4) and (5), COC could be calculated and decoupled into two items, as shown in Equations (6)–(8):
where the first item, COCC, was the cost contribution of extra capital investment, and the second item, COCP, was the cost contribution of energy penalty. In addition, the main assumptions for the economic analysis are presented in Table 1. The exchange rate between the USD dollar and RMB was determined based on the average in 2023 [21]. Besides, coal prices in different regions ranged from 40 to 110 $/t coal due to variations in transportation distances [22]. An average coal price is selected in this paper, which is also close to the literature [23].
2.3. Potential Evaluation Based on Learning Curves
The learning curve depicted the correlation between unit cost and cumulative output, which was typically used to predict the future trend of cost decline. The basic form was presented in Equation (9).
where Ccum denoted the unit cost when the cumulative output (i.e., cumulative experience) reached Cum, and C0 was the cost for the first unit. In Equation (9), b indicates the experience ratio.
The learning rate (LR) was defined as the cost reduction rate when cumulative production doubles. For a specific technology or sub-technology, the average cost was linked to the scale of utilization of the technology in the market. LR could be used to reflect potential cost reductions. The expression of the LR for unit investment was depicted in Equation (10).
Considering the varying technology maturity of each sub-system, the principle of the component-based learning curve aimed to break down the total cost of a complex system into its components. The potential for cost reduction of the entire system largely depended on technological breakthroughs and the cost-learning effect of key components. The power plant equipped with CCS could be regarded as a complex production system consisting of traditional coal-fired equipment and carbon capture devices. Considering that traditional coal-fired equipment has been widely deployed on a large scale, there are fewer plans for new coal-fired power plants to be built in China. Therefore, the cost reduction potential of traditional coal-fired equipment was neglected. The carbon capture device consisted of a CO2 separation and CO2 compression unit. According to the definition, the learning rate of the carbon capture devices can be calculated by Equation (11).
where the λS and λC represented the share of CO2 separation investment cost and CO2 compression investment cost in the carbon capture devices investment cost. LRS and LRC were the investment cost learning rates of CO2 separation and CO2 compression, respectively. The range of LRS and LRC were 0.06/0.11/0.18 (Low/Nominal/High) and 0.00/0.00/0.10 (Low/Nominal/High), respectively [27].
3. System Simulation and Model Validation
3.1. Reference Plant
In this section, the simulation of the retrofitted coal-fired power plant was conducted using Aspen Plus v8.4, and the PR-BM property method was selected as the global method to evaluate the process accurately. As shown in Figure 1, the retrofitted coal-fired power plant was divided into three units: a coal-fired boiler unit, a steam cycle unit, and a PCC unit. In the coal-fired boiler unit, coal is combusted in the combustion chamber. In this model, coal was designated as a nonconventional component. The ultimate analysis of coal is presented in Table 2, which shows the mass fractions of elements in the selected coal. The coal combustion process was divided into two sequential steps: pyrolysis and burning. The pyrolysis process was modeled by the RYield block, while the burning process was modeled by the RGibbs block. During the pyrolysis process, coal decomposes into elements such as C, H, O, N, and S [28]. The elements O, N, H, and S were vaporized into the gas phase, while the element C was converted to coke. In the burning process, reactions between pyrolysis products and air occur, and the Gibbs minimization status is eventually achieved. In the steam cycle unit, all turbines were simulated using Compr blocks set as isentropic turbines, and heat exchangers, including the condenser and steam generator, were modeled by HeatX blocks.
The main operating parameters of the retrofitted power plant under various turbine heat acceptance (THA) conditions are shown in Table 3. Since the turbine heat acceptance conditions change, the mainstream flow rate and pressure are also adjusted to satisfy the heat transfer requirement. The model validation results operating under variable load conditions are listed in Table 4. The simulation results and operating results, including the temperature and mass flow rate of key streams, are compared to validate the model. From Table 4, the relative errors of the main parameters between the operating and modeled plant were less than 5%, which implied the reliability of this model.
3.2. PCC Unit
For the simulation of the PCC unit conducted in this study, the specific calculation conditions were listed in Table 5. The simulation of the separation process was conducted using the rate-based model of the Radfrac module with 20 stages. The electrolyte NRTL property method was applied for the liquid phase, while the Redlich-Kwong equation of state was utilized for the vapor phase of the MEA-CO2-H2O systems in both the absorber and stripper units. The chemical reactions and kinetic constants used in this simulation were preconfigured in the Aspen simulation environment. In this study, the CO2 removal efficiency was set at 90%. The condenser temperature was fixed at 40 °C, ensuring over 96% purity of the outlet CO2. Water was used as the cooling agent, with its temperature increasing from 20 °C to 30 °C. A temperature difference of 10 °C was maintained at the condenser. The simulation results showed that the heat consumption required in the reboiler was 3.5 MJ/kg CO2 in this study, which aligned well with experimental results [29].
4. Results and Discussion
4.1. Techno-Economic Performance of the Retrofitted Plant Operating under Variable Conditions
Operating under variable boiler conditions had a significant effect on the performance of the retrofitted power plant. Therefore, the techno-economic performance was investigated when the retrofitted plant with 90% CCR operated under variable boiler load conditions. As depicted in Figure 2, when the boiler load decreased from 100% THA condition to 50% THA condition, the COC increased from 37.0 $/t CO2 to 57.0 $/t CO2. Additionally, the COCP increased from 20.6 $/t CO2 to 25.7 $/t CO2, and the COCC increased from 16.4 $/t CO2 to 31.3 $/t CO2. The COCC increased as the boiler load decreased, while the COCP increased slightly. The decrease in energy efficiency caused by the offset dimension from the design condition contributed to the increase in COCC. Furthermore, the ratio of COCP to COCC suggested that efforts to decrease capital investment and energy penalties for CO2 capture should receive equal attention, particularly when the retrofitted plant operated under low boiler load conditions.
The sensitivity analysis was conducted to examine how changes in economic parameters (discount rate, capacity factor, and coal price) would impact the cost of CO2 capture. Figure 3 illustrates the changes in COC, COCP, and COCC with variations in the discount rate (−/+10%), capital factor (+/−10%), and coal price (40–110 $/t coal). As depicted in Figure 3, coal price only influenced the COCP, while the discount rate and capacity factor affected both COCP and COCC. The capacity factor of the power plant had a larger impact on the cost than that the discount rate.
When the discount rate varied by ±10%, the COCC ranged from 29.2 to 33.4 $/t CO2, 20.1 to 23.0 $/t CO2, and 15.2 to 17.5 $/t CO2 for plant operation at 50%, 75%, and 100% THA conditions, respectively. Meanwhile, the COCP ranged from 25.1 to 26.3 $/t-CO2, 21.9 to 22.7 $/t CO2, and 20.3 to 20.9 $/t CO2 under the corresponding THA conditions. Consequently, the COC fell within the range of 54.3–59.7 $/t CO2, 42.0–45.7 $/t CO2, and 35.6–38.4 $/t CO2. It is crucial to secure favorable discounted cash flow rates, supported by government initiatives, to ensure a low CO2 capture cost. Additionally, when coal prices varied from 40 $/t coal to 110 $/t coal, the COC ranged from 49.1 to 64.9 $/t CO2, 36.1 to 51.5 $/t CO2, and 29.4 to 44.6 $/t CO2, while the COCP ranged from 17.8 to 33.6 $/t CO2, 14.6 to 30.0 $/t CO2, and 13.0 to 28.2 $/t CO2. Deploying CCS technology in regions with lower coal prices can effectively reduce the cost of CO2 capture, particularly during the early stages of development.
When the capacity factor of the retrofitted plant varied by ±10%, the COC ranged from 54.3 to 59.7 $/t CO2, 39.8 to 48.7 $/t CO2, and 33.6 to 41.1 $/t CO2 for operation at 50%, 75%, and 100% THA conditions, respectively, this variation in the capacity factor had the same impact on both COCP and COCC, as described by Equation (6). A decrease in the capacity factor resulted in less electricity being generated by the retrofitted power plant, leading to the need to sell electricity at a higher price. Thus, maintaining a high-capacity factor is crucial to ensure a relatively low COC. However, integrating renewable energy sources, which are intermittent and unstable, may intermittently reduce the capacity factor of the retrofitted coal-fired power plant, thereby increasing the COC. Therefore, optimization strategies for operation are necessary to effectively utilize the multi-energy supply system.
4.2. CO2 Capture Cost Reduction Potential
Improving separation efficiency and large-scale commercial deployment were recognized as effective measures to reduce the cost of CO2 capture. In this section, the potential for cost reduction under variable operating conditions was further analyzed by enhancing separation efficiency and implementing large-scale commercial deployment.
4.2.1. Cost Reduction Potential of Improving Separation Efficiency
The energy penalty associated with CO2 capture can be mitigated through advancements in separation efficiency, such as innovative absorbents and process improvements. Figure 4a illustrates the relationship between energy penalty and separation efficiency. As the separation efficiency increased from 20% (equivalent to 3.34 MJ heat/kg CO2) to 50% (considered the maximum separation efficiency ceiling for post-combustion CO2 capture [32]), the energy penalty decreased from 12.4% to 7.5%. Figure 4b–d demonstrate the potential reduction in the cost of CO2 capture (COC) under 50%, 75%, and 100% THA conditions, respectively. The results indicate that within the separation efficiency range of 0.15 to 0.5, the COCP decreased from 30.3 $/t CO2 to 15.2 $/t CO2, 26.3 $/t CO2 to 13.2 $/t CO2, and 24.7 $/t CO2 to 12.2 $/t CO2 for operation under 50%, 75%, and 100% THA conditions. However, according to Equation (6), the reduction in the energy penalty did not affect the COCC, which is consistent with the findings presented in Figure 4. The COCC remained stable at 33.1 $/t CO2 under 50% THA conditions, 25.6 $/t CO2 under 75% THA conditions, and 16.4 $/t CO2 under 100% THA conditions. Therefore, when the separation efficiency increased from 0.15 to 0.5, the overall cost of CO2 capture (COC) under 50%, 75%, and 100% THA conditions decreased from 61.6 $/t CO2 to 46.6 $/t CO2, 47.8 $/t CO2 to 34.8 $/t CO2, and 40.7 $/t CO2 to 28.6 $/t CO2, respectively. These results indicated that improving separation efficiency from 0.15 to 0.5 could achieve a 25 to 30% reduction in COC during variable operational conditions, assuming a coal price of 75 $/t coal.
4.2.2. Cost Reduction Potential of Large-Scale Commercial Deployment
According to Equation (6), the cost contribution of extra capital investment can be reduced after large-scale commercial deployment. Then, the COC continued to decline as the technology matured. In this section, the reduction potential of COC and COCC was investigated with a separation efficiency of 0.335 (heat consumption of 2.0 GJ/t-CO2), which has been achieved [33]. The LRCC calculated by Equation (9) were 0.05/0.08/0.16 (Low/Nominal/High), and the reduction potentials in COC and COCC operating under variable conditions were presented in Figure 5. In the case of a high investment learning rate, the COCC decreased from 31.3 $/t CO2 to 5.9 $/t CO2, 21.6 $/t CO2 to 4.1 $/t CO2, and 16.4 $/t CO2 to 3.1 $/t CO2 for operation under 50%, 75%, and 100% THA conditions. Consequently, the COC decreased from 50.3 $/t CO2 to 24.9 $/t CO2, 37.9 $/t CO2 to 20.4 $/t CO2, and 31.5 $/t CO2 to 18.2 $/t CO2. These results indicate that large-scale commercial deployment at a high investment learning rate can achieve a reduction of 42.2%-50.5% in COC during variable operational conditions, with a more pronounced effect observed under low boiler load conditions. On the other hand, in the case of a low investment learning rate, the COCC decreased from 31.3 $/t CO2 to 20.1 $/t CO2, 21.6 $/t CO2 to 13.8 $/t CO2, and 16.4 $/t CO2 to 10.5 $/t CO2 for operation under 50%, 75%, and 100% THA conditions. Subsequently, the COC decreased from 50.3 $/t CO2 to 39.1 $/t CO2, 37.9 $/t CO2 to 30.1 $/t CO2, and 31.5 $/t CO2 to 25.6 $/t CO2. Large-scale commercial deployment at a low investment learning rate can achieve a reduction of approximately 18.7–20.6% in COC. Overall, these findings demonstrate that large-scale commercial deployment, coupled with different investment learning rates, can significantly reduce the COC during variable operational conditions.
4.3. Early Demonstration Opportunities and Policy Suggestions
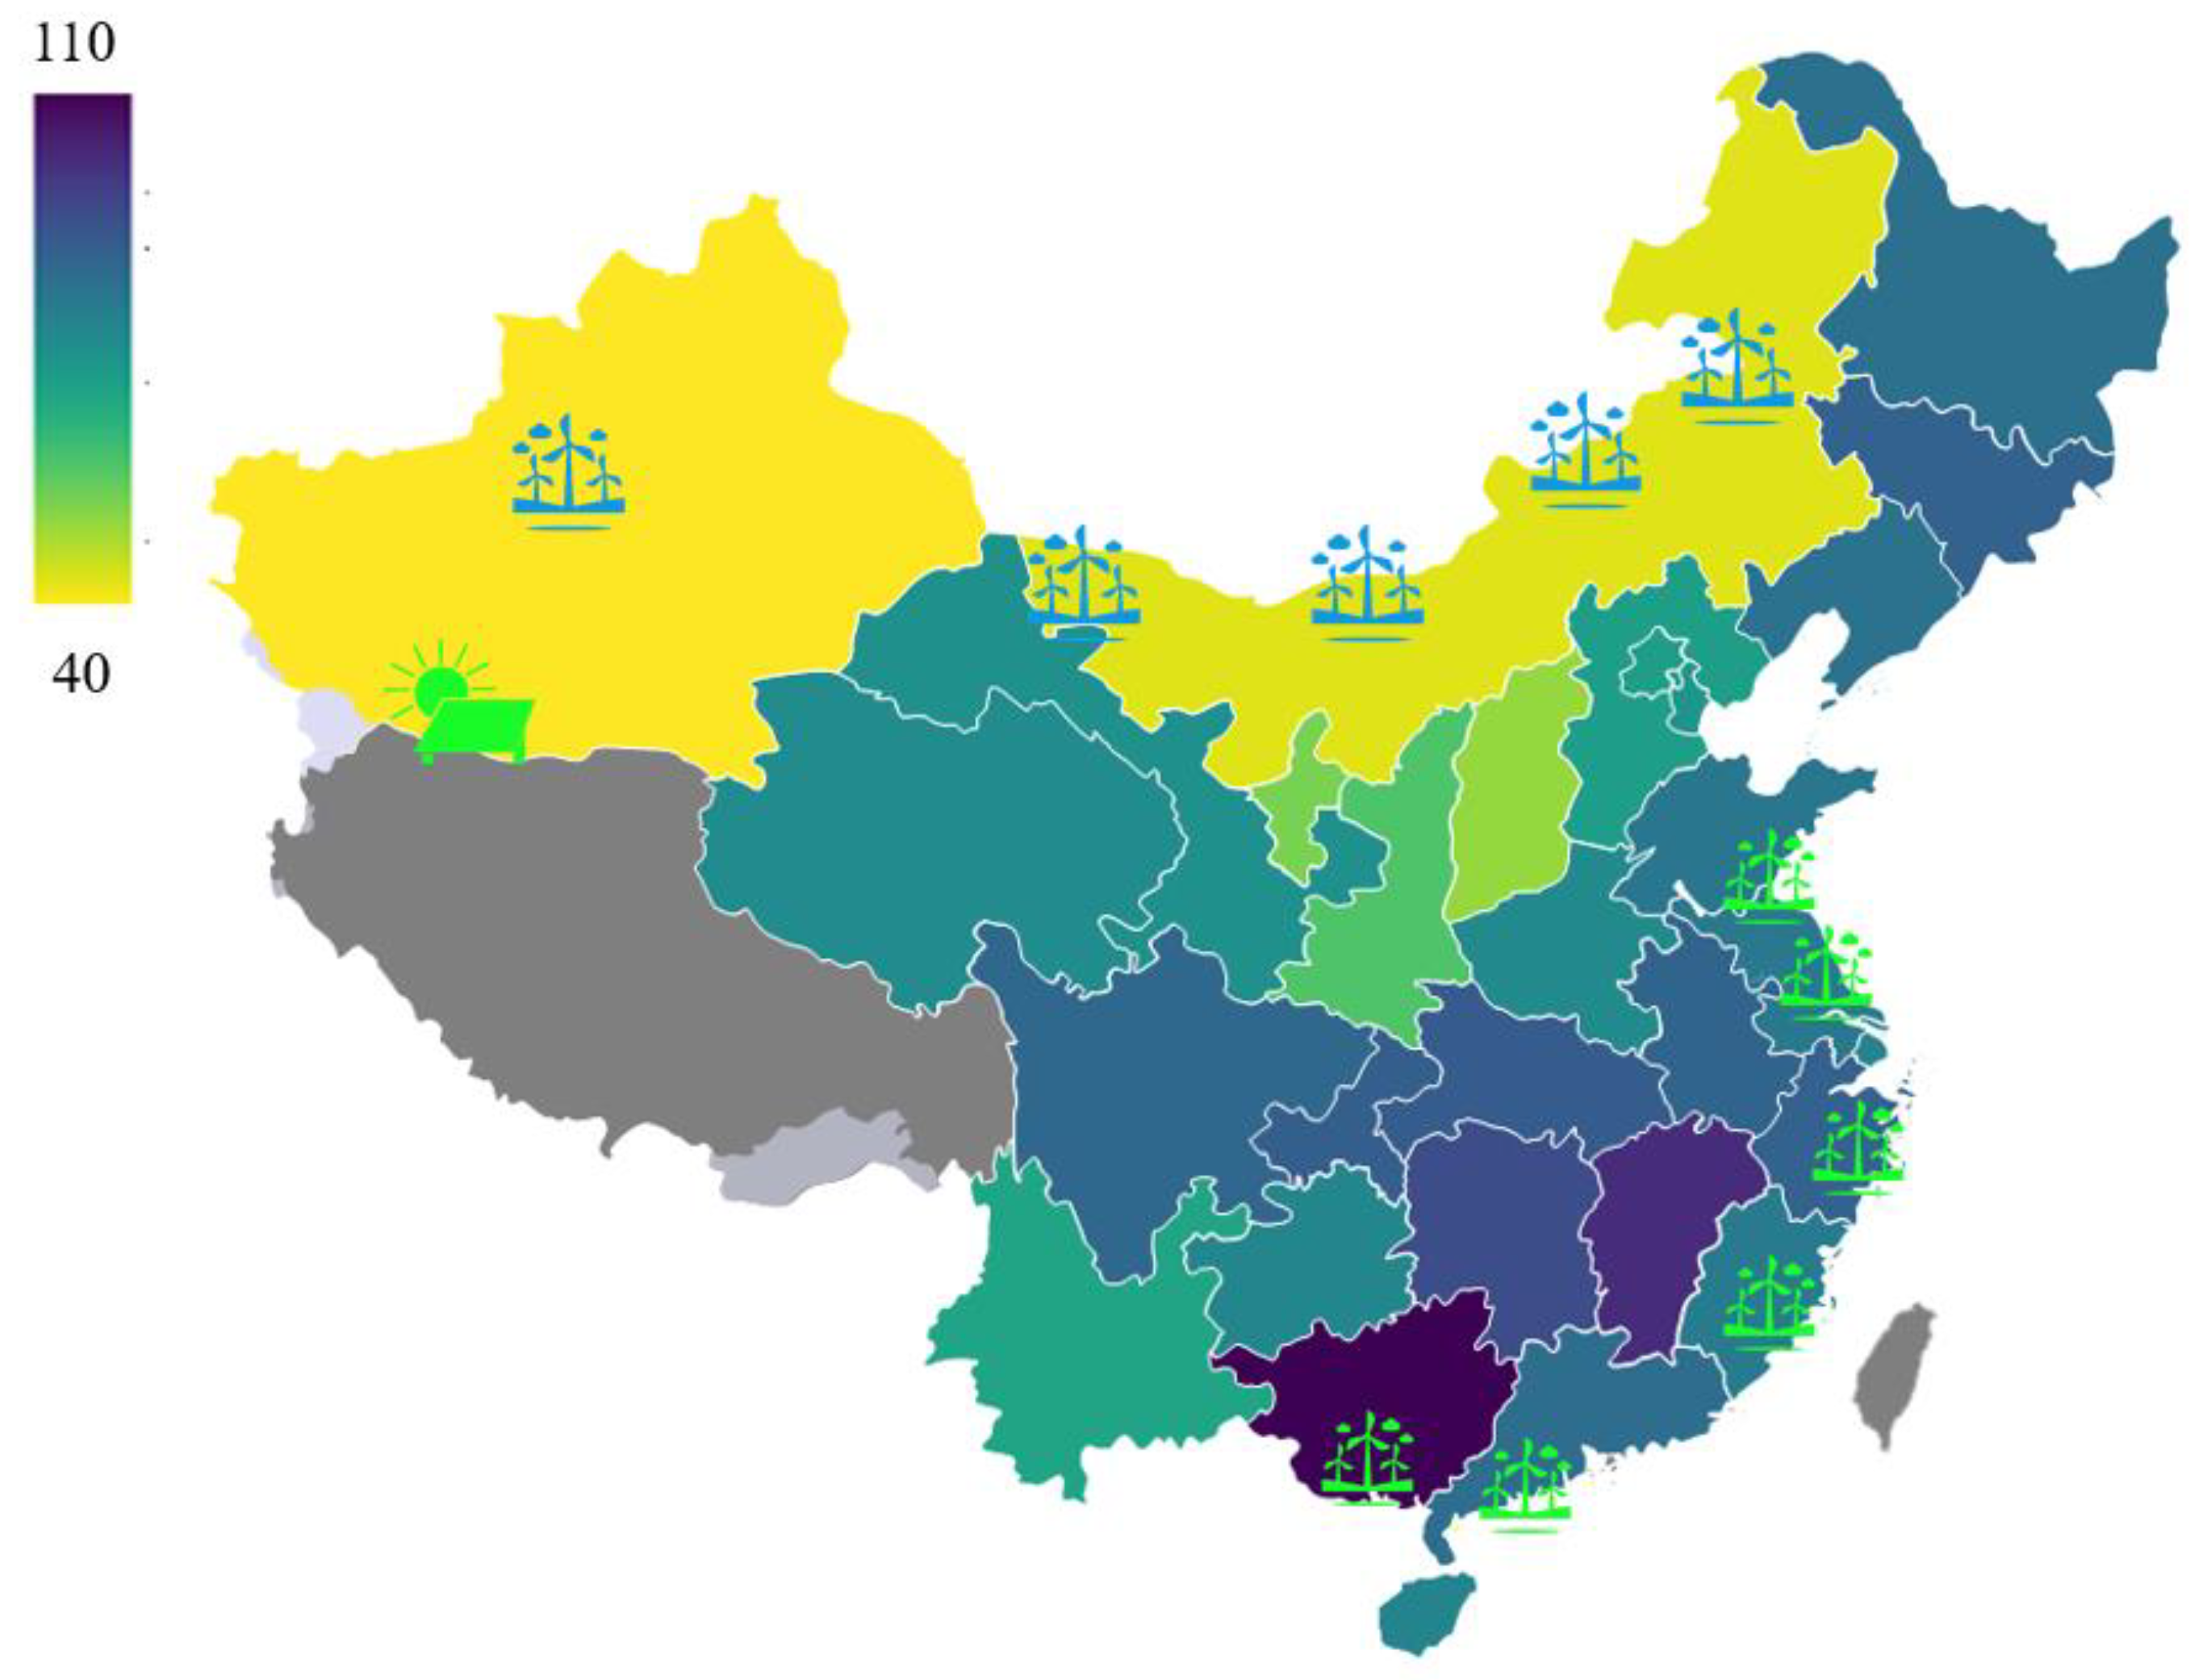
Based on the analysis conducted earlier, both coal price and the improvement of separation efficiency have a significant impact on the COCP. When the coal price is 75 $/t coal, the COCP ranges from 18.4 $/t CO2 to 16.0 $/t CO2. In the Northwestern region, with a coal price of 40 $/t coal, the COCP will decrease further and range from 9.8 $/t CO2 to 8.5 $/t CO2 when the separation efficiency increases to 0.5. Moreover, at a high investment learning rate, the COCC will decrease and range from 3.1 $/t CO2 to 5.9 $/t CO2 when the cumulative capacity reaches 250 GW. Therefore, considering the technological maturity after large-scale commercial deployment, the overall cost of CO2 capture (COC) during flexible operation is expected to decline to a range of 11.6 $/t CO2 to 15.7 $/t CO2 in the northern region (Inner Mongolia, Xinjiang) with a coal price of 40 $/t coal. These projections suggest the COC can be significantly reduced during flexible operational conditions as the technology matures after large-scale commercial deployment. Figure 6 depicts the distribution of renewable energy sources and coal prices in China [34]. The wind power resources are distributed mainly along the eastern coast (Shandong, Jiangsu) and in the northern area. The coal prices are low in the northern area while high in the eastern and southern areas. Therefore, the early demonstration projects of a multi-energy supply system should be given priority to the northern region with low coal prices and abundant renewable energy sources.
The energy structure of China is currently dominated by coal but is expected to shift towards primarily renewable energy sources. The first large-scale development of China’s domestic wind power and photovoltaic (PV) energy production started in 2010. A rapid decline in the cost of solar PV was achieved due to the implementation of subsidy policies and significant reductions in module prices caused by technological advancements. The current COE for the PV and onshore wind power has been reduced to almost the same level as that of coal power without CO2 capture. Furthermore, the installed capacity of renewable energy power generation increased, representing 43.41% of the total installed capacity by 2020 [35]. With the increasing penetration of renewable power into the power grid, the implementation of coal power CCS is a necessary way to reduce carbon emissions and ensure the stable operation of the power grid. However, there is still no demonstration of large-scale coal power CCS in China. The time window for coal power CCS to play a major role in CO2 emission reduction is closing. The Huaneng Shidongkou project was first constructed in 2009, with an annual CO2 capture capacity of 120,000 tons per year [36]. A 150,000-ton CO2 per year full-chain CCS demonstration project was implemented at the subcritical coal-fired power plant of Guonengjinjie in 2021 [37]. Despite several small-scale demonstrations operating successfully, there is still a lack of large-scale demonstrations involving over a million tons of CO2 per year. It is challenging for commercial operation due to the high energy penalty and the cost of CO2 capture. To accelerate the development of CCS technology and reduce the associated costs, policy support, and market mechanisms should be of equal importance to technical advancements. On the one hand, subsidies or carbon taxes should be formulated to incentivize the external driving of CCS. On the other hand, a complete whole-chain market mechanism should be established to make CO2 commodities valuable. This will provide an internal market driving force for CCS. For example, the combination of green hydrogen and CO2 utilization for chemical synthesis has been acknowledged as a promising method that integrates CCS and renewable energy in the chemical sector.
5. Conclusions
The effects of variable boiler load on the techno-economic performance of the retrofitted power plant during flexible operation were studied, taking into account the significant penetration of renewable power into the grid. The potential for reducing the cost of CO2 capture was then investigated. Furthermore, early demonstration opportunities and policy suggestions were discussed.
- (1)
- The cost contribution of extra capital investment (COCC) increased as the boiler load decreased, while the cost contribution of energy penalty (COCP) increased slightly. When the boiler load decreased from 100% THA condition to 50% THA condition, the cost of CO2 capture (COC) increased from 37.0 $/t CO2 to 57.0 $/t CO2. The COCP and COCC also increased from 20.6 $/t CO2 to 25.7 $/t CO2 and from 16.4 $/t CO2 to 31.3 $/t CO2, respectively. The offset from the design condition contributed to the increase in cost.
- (2)
- The cost reduction potential under variable operation conditions was further analyzed by improving separation efficiency and large-scale commercial deployment. With the range of separation efficiency from 0.15 to 0.5, a 25 to 30% reduction of COC during variable operation conditions can be achieved. Besides, large-scale commercial deployment could realize a 42.2–50.5% reduction of COC during variable operation conditions at a high investment learning rate case.
- (3)
- The COC during flexible operation is expected to decline the scope from 11.6 $/t CO2 to 15.7 $/t CO2 in the northern region as the technology matures after large-scale commercial deployment. According to the distribution of coal prices and renewable energy sources in China, the early demonstration projects of a multi-energy supply system should prioritize the northern region. With the increasing penetration of renewable power into the power grid, policy support in the form of subsidies and market mechanisms should be established to provide external and internal market driving forces for CCS technology.
Author Contributions
Conceptualization, S.H. and Y.Z.; methodology, S.H.; software, S.H.; validation, Y.Z.; formal analysis, S.H. and Y.Z.; investigation, S.H. and Y.Z. resources, S.H.; data curation, S.H.; writing—original draft preparation, S.H.; writing—review and editing, Y.Z.; supervision, S.H.; project administration, S.H.; funding acquisition, Y.Z. All authors have read and agreed to the published version of the manuscript.
Funding
This work is funded by a grant from Shenzhen Innovation and Technology Committee (KCXST20221021111609024).
Data Availability Statement
Data are contained within the article.
Conflicts of Interest
Author Yawen Zheng was employed by the company China Shenzhen Gas Corporation Ltd. The remaining authors declare that the research was conducted in the absence of any commercial or financial relationships that could be construed as a potential conflict of interest.
Nomenclature
| b | Experience ratio |
| C0 | Cost for the first unit |
| Ccum | unit cost of cumulative output |
| Cum | Cumulative output |
| CFUEL | Annual fuel cost |
| CCR | CO2 capture ratio |
| CCS | CO2 capture and storage |
| CF | Capacity factor |
| COE | Cost of electricity |
| COC | Cost of CO2 capture |
| COCC | Cost contribution of extra capital investment |
| COCP | Cost contribution of energy penalty |
| CRF | Capital recovery factor |
| DEA | Deaerator |
| FGD | Flue gas desulfurization |
| fi | Scale factor |
| GHG | Greenhouse gas |
| HP | High-pressure |
| Ii | Fixed capital investment requirement of ith equipment |
| Ii,r | Reference fixed capital investment requirement of ith equipment |
| i | Discount rate |
| LP | Low-pressure |
| LR | Learning rate |
| LRC | Learning rate of CO2 compression unit |
| LRS | Learning rate of CO2 separation unit |
| MCO2,captured | Mass flow rate of CO2 captured |
| Mm | Mass flow rate of model value |
| Mo | Mass flow rate of operating value |
| MP | Medium-pressure |
| n | Life of equipment |
| P | Power output |
| PCC | Post-combustion CO2 capture |
| PV | Photovoltaic |
| Si | Scale of ith equipment |
| Si,r | Reference scale of ith equipment |
| T | Annual operation hours |
| Tm | Temperature of model value |
| To | Temperature of operating value |
| THA | Turbine heat acceptance |
| TCR | Total capital requirement |
| XOM | Coefficient annual operating and maintenance cost |
| λC | Share of CO2 compression investment cost |
| λS | Share of CO2 separation investment cost |
References
- Masson-Delmotte, V.; Zhai, P.; Pörtner, H.O.; Roberts, D.; Skea, J.; Shukla, P.R.; Pirani, A.; Moufouma-Okia, W.; Péan, C.; Pidcock, R.; et al. Global Warming of 1.5 °C; IPCC: Geneva, Switzerland, 2018. [Google Scholar]
- Pirani, A.; Fuglestvedt, J.S.; Byers, E.; O’neill, B.; Riahi, K.; Lee, J.-Y.; Marotzke, J.; Rose, S.K.; Schaeffer, R.; Tebaldi, C. Scenarios in IPCC assessments: Lessons from AR6 and opportunities for AR7. Npj Clim. Action 2024, 3, 1. [Google Scholar] [CrossRef]
- Luo, F.; Guo, Y.; Yao, M.; Cai, W.; Wang, M.; Wei, W. Carbon emissions and driving forces of China’s power sector: Input-output model based on the disaggregated power sector. J. Clean. Prod. 2020, 268, 121925. [Google Scholar] [CrossRef]
- Zheng, Y.; Wang, J.; Liu, J.; He, S.; Zeng, X.; Yang, D.; Yang, G.; Li, L. Tracing the carbon capture energy distribution in a natural gas combined cycle power plant under variable operating conditions. Appl. Therm. Eng. 2024, 246, 123000. [Google Scholar] [CrossRef]
- BP Statistical Review of World Energy. 2019. Available online: https://www.bp.com/content/dam/bp/businesssites/en/global/corporate/pdfs/energy-economics/statistical-review/bp-stats-review-2019-full-report.pdf (accessed on 1 November 2019).
- IEA. An Energy Sector Roadmap to Carbon Neutrality in China; IEA: Paris, France, 2021. [Google Scholar]
- van der Wijk, P.C.; Brouwer, A.S.; van den Broek, M.; Slot, T.; Stienstra, G.; van der Veen, W.; Faaij, A.P. Benefits of coal-fired power generation with flexible CCS in a future northwest European power system with large scale wind power. Int. J. Greenh. Gas Control 2014, 28, 216–233. [Google Scholar] [CrossRef]
- Szima, S.; del Pozo, C.A.; Cloete, S.; Chiesa, P.; Alvaro, J.; Cormos, A.-M.; Amini, S. Finding synergy between renewables and coal: Flexible power and hydrogen production from advanced IGCC plants with integrated CO2 capture. Energy Convers. Manag. 2021, 231, 113866. [Google Scholar] [CrossRef]
- Xu, G.; Liang, F.; Wu, Y.; Yang, Y.; Zhang, K.; Liu, W. A new proposed approach for future large-scale de-carbonization coal-fired power plants. Appl. Therm. Eng. 2015, 87, 316–327. [Google Scholar] [CrossRef]
- Boot-Handford, M.E.; Abanades, J.C.; Anthony, E.J.; Blunt, M.J.; Brandani, S.; Mac Dowell, N.; Fernández, J.R.; Ferrari, M.C.; Gross, R.; Hallett, J.P.; et al. Carbon capture and storage update. Energy Environ. Sci. 2014, 7, 130–189. [Google Scholar] [CrossRef]
- Bui, M.; Adjiman, C.S.; Bardow, A.; Anthony, E.J.; Boston, A.; Brown, S.; Fennell, P.S.; Fuss, S.; Galindo, A.; Hackett, L.A.; et al. Carbon capture and storage (CCS): The way forward. Energy Environ. Sci. 2018, 11, 1062–1176. [Google Scholar]
- Wu, X.; Wang, M.; Liao, P.; Shen, J.; Li, Y. Solvent-based post-combustion CO2 capture for power plants: A critical review and perspective on dynamic modelling, system identification, process control and flexible operation. Appl. Energy 2020, 257, 113941. [Google Scholar] [CrossRef]
- Li, K.; Leigh, W.; Feron, P.; Yu, H.; Tade, M. Systematic study of aqueous monoethanolamine (MEA)-based CO2 capture process: Techno-economic assessment of the MEA process and its improvements. Appl. Energy 2016, 165, 648–659. [Google Scholar] [CrossRef]
- Chalmers, H.; Gibbins, J. Initial evaluation of the impact of post-combustion capture of carbon dioxide on supercritical pulverised coal power plant part load performance. Fuel 2007, 86, 2109–2123. [Google Scholar] [CrossRef]
- Chalmers, H.; Lucquiaud, M.; Gibbins, J.; Leach, M. Flexible operation of coal fired power plants with postcombustion capture of carbon dioxide. J. Environ. Eng. 2009, 135, 449–458. [Google Scholar] [CrossRef]
- Chalmers, H.; Leach, M.; Lucquiaud, M.; Gibbins, J. Valuing flexible operation of power plants with CO2 capture. Energy Procedia 2009, 1, 4289–4296. [Google Scholar] [CrossRef]
- Fernandez, E.S.; del Rio, M.S.; Chalmers, H.; Khakharia, P.; Goetheer, E.; Gibbins, J.; Lucquiaud, M. Operational flexibility options in power plants with integrated post-combustion capture. Int. J. Greenh. Gas Control 2016, 48, 275–289. [Google Scholar] [CrossRef]
- Rúa, J.; Bui, M.; Nord, L.O.; Mac Dowell, N. Does CCS reduce power generation flexibility? A dynamic study of combined cycles with post-combustion CO2 capture. Int. J. Greenh. Gas Control 2020, 95, 102984. [Google Scholar] [CrossRef]
- China Power Engineering Consulting Group Corporation. Reference Price Index of Thermal Power Engineering Design; China Electric Power Press: Beijing, China, 2016. (In Chinese) [Google Scholar]
- Hu, Y.; Xu, G.; Xu, C.; Yang, Y. Thermodynamic analysis and techno-economic evaluation of an integrated natural gas combined cycle (NGCC) power plant with post-combustion CO2 capture. Appl. Therm. Eng. 2017, 111, 308–316. [Google Scholar] [CrossRef]
- Exchange Rates.org. Available online: https://www.exchange-rates.org/zh/exchange-rate-history/usd-cny-2023 (accessed on 20 April 2024).
- Coalchina.org. Available online: http://www.coalchina.org.cn/index.php?m=content&c=index&a=show&catid=28&id=115461 (accessed on 15 December 2023).
- Zhou, Y.; Xu, Z.; Zhang, J.; Xing, J.; Jia, J.; Cui, P. Development and techno-economic evaluation of coal to ethylene glycol process and Allam power cycle and carbon capture and storage and integration process. Fuel 2023, 332, 126121. [Google Scholar] [CrossRef]
- Wang, D.; Li, S.; Liu, F.; Gao, L.; Sui, J. Post combustion CO2 capture in power plant using low temperature steam upgraded by double absorption heat transformer. Appl. Energy 2018, 227, 603–612. [Google Scholar] [CrossRef]
- Xu, C.; Li, X.; Xin, T.; Liu, X.; Xu, G.; Wang, M.; Yang, Y. A thermodynamic analysis and economic assessment of a modified de-carbonization coal-fired power plant incorporating a supercritical CO2 power cycle and an absorption heat transformer. Energy 2019, 179, 30–45. [Google Scholar] [CrossRef]
- Xu, C.; Li, X.; Xin, T.; Liu, X.; Xu, G.; Wang, M.; Yang, Y. Energy, exergy and economic analyses of a novel solar-lignite hybrid power generation process using lignite pre-drying. Energy Convers. Manag. 2018, 170, 19–33. [Google Scholar] [CrossRef]
- Kang, J.N.; Wei, Y.M.; Liu, L.; Han, R.; Chen, H.; Li, J.; Wang, J.W.; Yu, B.Y. The Prospects of Carbon Capture and Storage in China’s Power Sector under the 2 °C Target: A Component-based Learning Curve Approach. Int. J. Greenh. Gas Control 2020, 101, 103149. [Google Scholar] [CrossRef]
- Wang, D.; Li, S.; He, S.; Gao, L. Coal to substitute natural gas based on combined coal-steam gasification and one-step methanation. Appl. Energy 2019, 240, 851–859. [Google Scholar] [CrossRef]
- Moser, P.; Schmidt, S.; Sieder, G.; Garcia, H.; Stoffregen, T. Performance of MEA in a long-term test at the post-combustion capture pilot plant in Niederaussem. Int. J. Greenh. Gas Control 2011, 5, 620–627. [Google Scholar] [CrossRef]
- Duan, L.; Zhao, M.; Yang, Y. Integration and optimization study on the coal-fired power plant with CO2 capture using MEA. Energy 2012, 45, 107–116. [Google Scholar] [CrossRef]
- Oh, S.-Y.; Yun, S.; Kim, J.-K. Process integration and design for maximizing energy efficiency of a coal-fired power plant integrated with amine-based CO2 capture process. Appl. Energy 2018, 216, 311–322. [Google Scholar] [CrossRef]
- Rochelle, G.T. Amine scrubbing for CO2 capture. Science 2009, 325, 1652–1654. [Google Scholar] [CrossRef] [PubMed]
- Idem, R.; Supap, T.; Shi, H.; Gelowitz, D.; Ball, M.; Campbell, C.; Tontiwachwuthikul, P. Practical experience in post-combustion CO2 capture using reactive solvents in large pilot and demonstration plants. Int. J. Greenh. Gas Control 2015, 40, 6–25. [Google Scholar] [CrossRef]
- Chen, Q.; Lv, M.; Gu, Y.; Yang, X.; Tang, Z.; Sun, Y.; Jiang, M. Hybrid energy system for a coal-based chemical industry. Joule 2018, 2, 607–620. [Google Scholar] [CrossRef]
- Chai, S.; Liu, Q.; Yang, J. Renewable power generation policies in China: Policy instrument choices and influencing factors from the central and local government perspectives. Renew. Sustain. Energy Rev. 2023, 174, 113126. [Google Scholar] [CrossRef]
- Liu, L.; Fang, M.; Xu, S.; Wang, J.; Guo, D. Development and testing of a new post-combustion CO2 capture solvent in pilot and demonstration plant. Int. J. Greenh. Gas Control 2022, 113, 103513. [Google Scholar] [CrossRef]
- Zhao, R.; Zhang, Y.; Zhang, S.; Li, Y.; Han, T.; Gao, L. The full chain demonstration project in China—Status of the CCS development in coal-fired power generation in GuoNeng Jinjie. Int. J. Greenh. Gas Control 2021, 110, 103432. [Google Scholar] [CrossRef]
Figure 1.
T Diagram of the 350 MW retrofitted coal-fired power plant.

Figure 2.
Cost contributions of the retrofitted plant operating under variable load conditions.

Figure 3.
Sensitivity analysis of economic parameters on COC, COCP, and COCC.

Figure 4.
The reduction potential of COC operating under variable conditions.

Figure 5.
The reduction potential of COC operating under variable conditions.

Figure 6.
Renewable energy and coal prices distribution in China.


Table 1.
Main assumptions for the economic analysis.
| Items | Value |
|---|---|
| Exchange rate ($/¥) | 7.08 [21] |
| Actual interest rate for the credit (%) | 4.9 [24] |
| Discount rate (%) | 12 [24] |
| Share of investment obtained from commercial credit (%) | 70 [24] |
| Capacity factor, CF | 0.85 [24] |
| Annual operation time (hours/year) | 7446 [24] |
| Coal price ($/t) | 75 [22] |
| Depreciation times (years) | 15 [24] |
| Operation times (years) | 30 [25] |
| Construction times (years) | 3 [24] |
| Share of investment cost in respective years of construction (%) | 30/40/30 [24] |
| Operation and Maintenance Cost | 4% of the TCR [25,26] |
Table 2.
Coal composition analysis.
| Ultimate Analysis, wt% | |||||||
|---|---|---|---|---|---|---|---|
| Car 1 | Har 1 | Oar 1 | Nar 1 | Sar 1 | ASHar 1 | Mar 1 | LHV, MJ/kg |
| 43.21 | 2.62 | 8.64 | 0.57 | 0.17 | 15.49 | 29.30 | 15.75 |
1 is represented on an as-received basis.
Table 3.
Main operating parameters of the retrofitted power plant under various load conditions.
| Items | 100% THA | 75% THA | 50% THA |
|---|---|---|---|
| Main stream flow rate (t/h) | 994.2 | 717.7 | 473.6 |
| Inlet pressure of main steam (MPa) | 24.2 | 19.1 | 12.7 |
| Inlet temperature of main steam (°C) | 566 | 566 | 566 |
| Mass flow rate of reheated steam (t/h) | 840.7 | 619.3 | 416.5 |
| Inlet temperature of reheated steam (°C) | 566 | 566 | 566 |
| Inlet pressure of reheated steam (MPa) | 4.214 | 3.121 | 2.103 |
Table 4.
Model validation.
| Operating Conditions | 100% THA Condition | 75% THA Condition | 50% THA Condition | |||||||||
|---|---|---|---|---|---|---|---|---|---|---|---|---|
| Physical Parameters | To (°C) a | Tm (°C) a | Mo (t/h) a | Mm (t/h) a | To (°C) a | Tm (°C) a | Mo (t/h) a | Mo (t/h) a | To (°C) a | Tm (°C) a | Mo (t/h) a | Mm (t/h) a |
| Inlet of HP cylinder | 566.0 | 566.0 | 991.9 | 995.1 | 566.0 | 566.0 | 717.7 | 714.0 | 566.0 | 566.0 | 472.3 | 471.0 |
| Inlet of IP cylinder | 566.0 | 566.0 | 840.7 | 857.3 | 566.0 | 566.0 | 619.3 | 626.9 | 555.0 | 555.0 | 416.5 | 421.9 |
| Inlet of reheater | 313.8 | 313.7 | 840.7 | 857.3 | 312.8 | 312.7 | 619.3 | 626.9 | 321.7 | 321.5 | 416.5 | 421.9 |
| 1# high-pressure heater b | 251.6 | 240.5 | 994.2 | 995.1 | 234.3 | 222.9 | 717.7 | 714.0 | 213.4 | 209.7 | 473.5 | 471.0 |
| 2# high-pressure heater b | 213.8 | 208.5 | 777.8 | 778.7 | 199.4 | 192.5 | 717.7 | 714.0 | 181.7 | 182.0 | 473.5 | 471.0 |
| 3# high-pressure heater b | 176.6 | 172.1 | 777.8 | 778.7 | 164.5 | 157.8 | 717.7 | 714.0 | 149.6 | 150.1 | 473.5 | 471.0 |
| Inlet of deaerator b | 150.6 | 143.7 | 777.8 | 778.7 | 140.4 | 134.9 | 577.0 | 577.0 | 127.8 | 122.7 | 391.3 | 391.3 |
| 5# low-pressure heater b | 118.4 | 113.8 | 777.8 | 778.7 | 109.9 | 106.2 | 577.0 | 577.0 | 99.4 | 96.4 | 391.3 | 391.3 |
| 6# low-pressure heater b | 85.4 | 82.7 | 777.8 | 778.7 | 78.3 | 76.0 | 577.0 | 577.0 | 69.4 | 67.3 | 391.3 | 391.3 |
| 7# low-pressure heater b | 60.6 | 59.1 | 777.8 | 778.7 | 54.8 | 53.4 | 577.0 | 577.0 | 47.5 | 46.2 | 391.3 | 391.3 |
| 8# low-pressure heater b | 33.7 | 32.8 | 777.8 | 778.7 | 33.9 | 32.9 | 577.0 | 577.0 | 34 | 32.8 | 391.3 | 391.3 |
a T and M were temperatures and mass flow rate of streams, respectively. Subscripts m and o denoted the model value and operation value, respectively. b Parameters of the heaters and deaerator were for the waterside.
Disclaimer/Publisher’s Note: The statements, opinions and data contained in all publications are solely those of the individual author(s) and contributor(s) and not of MDPI and/or the editor(s). MDPI and/or the editor(s) disclaim responsibility for any injury to people or property resulting from any ideas, methods, instructions or products referred to in the content. |
© 2024 by the authors. Licensee MDPI, Basel, Switzerland. This article is an open access article distributed under the terms and conditions of the Creative Commons Attribution (CC BY) license (https://creativecommons.org/licenses/by/4.0/).
Share and Cite
MDPI and ACS Style
He, S.; Zheng, Y. CO2 Capture Cost Reduction Potential of the Coal-Fired Power Plants under High Penetration of Renewable Power in China. Energies 2024, 17, 2050. https://0-doi-org.brum.beds.ac.uk/10.3390/en17092050
AMA Style
He S, Zheng Y. CO2 Capture Cost Reduction Potential of the Coal-Fired Power Plants under High Penetration of Renewable Power in China. Energies. 2024; 17(9):2050. https://0-doi-org.brum.beds.ac.uk/10.3390/en17092050
Chicago/Turabian StyleHe, Song, and Yawen Zheng. 2024. "CO2 Capture Cost Reduction Potential of the Coal-Fired Power Plants under High Penetration of Renewable Power in China" Energies 17, no. 9: 2050. https://0-doi-org.brum.beds.ac.uk/10.3390/en17092050
Note that from the first issue of 2016, this journal uses article numbers instead of page numbers. See further details here.