Article

Experimental Study on a Photovoltaic Direct-Drive and Municipal Electricity-Coupled Electric Heating System for a Low-Energy Building in Changchun, China

1
School of Energy and Power, Changchun Institute of Technology, Changchun 130012, China
2
School of Energy and Environmental Engineering, Jilin University of Architecture and Technology, Changchun 130114, China
3
Urban Construction College, Changchun University of Architecture and Civil Engineering, Changchun 130604, China
*
Author to whom correspondence should be addressed.
Current address: Construction Energy Supply and Indoor Environment Control Engineering Research Center of Jilin Province, Changchun 130012, China.
Submission received: 15 March 2024 / Revised: 19 April 2024 / Accepted: 22 April 2024 / Published: 25 April 2024
(This article belongs to the Topic Building Energy and Environment, 2nd Volume)

Abstract

:
This paper takes a low-energy building in Changchun, China, as an object to test and study the characteristics of two heating modes, AC/DC (Alternative current/Direct current) switching and AC/DC synthesis, from the perspectives of temperature change, irradiation intensity, power generation, electricity consumption, etc. Firstly, the experimental research was conducted under two heating cable modes by establishing mathematical models and a test rig, and it was found that the photoelectric conversion efficiency on sunny, cloudy, and overcast days was 18%, 14.5%, and 12%, respectively. A simulation model was established by TRNSYS to run an ultra-low-energy building throughout the year. It was found that the highest and lowest monthly power generation occurred in February and July, respectively. The annual power generation of the system was 6614 kWh, and the heating season power generation was 3293.42 kWh. In the current research, the DC electricity consumption was slightly higher than the AC electricity consumption. Under conditions of similar radiation intensity and power generation, the indoor temperature of the AC/DC synthesis cable heating mode were 1.38% higher than the AC/DC switching heating able mode, and the electricity consumption were 10.9% and 4.76% higher, respectively, than those of the AC switching heating cable mode. This is of great significance for clean-energy heating, energy savings, and emissions reduction in northern China.

1. Introduction

As a result of rapid economic and social development, the demand for energy [1,2,3,4] is increasing day by day. According to the bp Energy Outlook 2023 edition [5], the share of renewables in global primary energy will increase from around 10% in 2019 to between 35 and 65% by 2050, driven by the improved cost competitiveness of renewables, together with the increasing prevalence of policies encouraging a shift to low-carbon energy. The guidance on energy work in 2024 issued by the National Energy Administration [6] proposed that the proportion of installed power generation from non-fossil energy should be increased to about 55%. Wind and solar power generation accounts for more than 17% of China’s electricity generation, non-fossil energy accounts for about 18.9 percent of total energy consumption, and the share of terminal electricity consumption continues to rise. According to the 2023 China Building Energy Consumption and Carbon Emission Research Report [7], the building operation stage carbon emissions are 2.30 billion tCO2, accounting for 21.6% of the country’s total energy-related carbon emissions and 56.6% of the whole process of energy carbon emissions. With the cost of photovoltaics falling dramatically in recent years and the need for carbon reduction driven by global climate change, photovoltaic power generation is growing at a considerable rate [8]. It is expected that, in the next five years, the installed capacity of photovoltaic systems will surpass that of hydropower, natural gas, and coal, becoming the world’s foremost energy source for power generation [9]. By the end of the 21st century, renewable energy applications will account for more than 80%, of which photovoltaic power generation will account for more than 60% [10], indicating that the global energy structure is undergoing drastic changes, whereby clean, renewable energy—especially solar energy—is becoming the dominant type of energy.
In recent years, with the continuous technological breakthroughs and ongoing policy support, the costs of the photovoltaics industry have been reduced year after year. The installation of photovoltaic systems can provide electricity for buildings and reduce energy consumption. Photovoltaic direct-drive and mains-coupled electric heating systems can give full play to the characteristics of photovoltaic power generation and supply buildings with energy. Such systems not only have high energy and economic benefits but they also meet the urgent needs of the ecological environment and sustainable development, which are of great significance for promoting the achievement of the dual carbon goals and the high-quality development of clean energy in the north.
Charlie Dou et al. [11] analyzed the potential of distributed photovoltaic power generation on the roofs of rural residential buildings in China in 2023, and the installed capacity could reach at least 348 GW and up to 696 GW. This requires the cooperation of technology, policy, and market conditions, but once the conditions are mature, its market potential will have great room for development. Scholars such as Green MA [12] have shown through research that the photoelectric conversion efficiency of thin-film solar cells can reach 24% or higher, and it is easy to install them on the external walls of buildings, making full use of solar energy while also improving the buildings’ aesthetic quality. Ammar Alkhalidi et al. [13] evaluated the thermal efficiency and performance efficiency of PV/T in different connection configurations, open-loop and closed-loop connections, and found that the total efficiency of the system in the open-loop configuration was significantly higher than that in the closed-loop configuration due to the improved thermal efficiency.
For most single-family homes in Sweden, electric heating has become the primary method of heating, replacing oil heating [14]. Lorenzo Nespoli et al. [15] used a multi-objective energy management system to analyze and control electric boilers in order to reduce energy consumption costs and relieve the peak pressure on the grid. The simplified water consumption model and thermodynamic model were used to simulate the system, and the results showed that the algorithm could effectively transfer the power consumption of electric boilers according to voltage and price.
Umar Hanif Ramadhani et al. [16] studied the orientation and inclination of photovoltaic panels on roofs, demonstrating through simulation that the model could improve the analytical quality and carrying capacity of the polymer photovoltaic power generation model. Pedro I. Hancevic et al. [17] evaluated the current state of operation of the residential power sector in Mexico, quantifying household expenditures, subsidies, pollution, and water use using DPVG (distributed photovoltaic generation) systems, and found that the economic and environmental impacts were positive; J.M. Pearce [18] integrated combined heat and power generation with photovoltaic power generation and found that the new system could improve energy efficiency and increase the share of photovoltaic power generation compared to traditional centralized power generation systems. Baran Yildiz et al. [19] developed and tested an intelligent hot-water control tool to artificially improve the self-use of distributed PV and reduce the impact on the grid voltage and reverse power flow. The results showed that D-PV power generation of 2.4 kWh, 1.8 kWh, and 3.4 kWh was used for water heating using the IWHC, timer, and diverter, respectively. Jiangjiang Wang et al. [20] put forward combined solar PV/collector power and steam systems; the exergic efficiency of the systems was 56.8% and 33.4%, respectively, under design conditions. Compared with a traditional electric boiler steam system, the cost per ton of steam was about 9.4%. Ahmad Zarei et al. [21] studied the system performance of combined solar heating/cooling systems using photovoltaic collectors in residential buildings and found the system performance could be improved by changing the refrigerant and optimizing the water flow. T.t. cohow et al. [22] established a numerical model of a photovoltaic thermosiphon collector system, and they conducted experiments to verify its accuracy. The results showed that the device could improve the application potential of photovoltaic systems. Wei He et al. [23] carried out theoretical and experimental research on the operation mode of a thermoelectric cooling and heating system driven by a heat-pipe photovoltaic panel in winter. Through an analysis of energy and exergy, they found that the average performance coefficient of the thermoelectric module reached about 1.7, the electrical efficiency of the photovoltaic panel reached 16.7%, and the thermal efficiency reached 23.5%. Khaled Touafek et al. [24] and Daniele Testi et al. [25] proposed a new type of heating scheme with positive significance in terms of system energy savings and reducing carbon emissions. Guohui Gan et al. [26] integrated PCMs as a heat storage medium to regulate the temperature of photovoltaics. The electrical efficiency of the photovoltaic panels also differed with the thickness of the phase-change materials, and the authors found that adding metal fins to the PCM layer could also improve heat transfer. Based on a survey of more than 1 MW of electric heat pumps in Europe, Andrei David et al. [27] studied the heat-pump heating routes in Europe and their application potential in other parts of Europe, and they found that although the technology is mature, more government policy support and market incentives are still needed. Jérémie Léger et al. [28] studied the heating systems of three types of electric heating equipment with a power rating of 1000 W and evaluated the environment through thermal comfort indicators. The research showed that the heat distribution mode affects the effectiveness of the heating equipment. Lutero Carmo de Lima et al. [29] studied the performance of a grid-connected PV system with a peak value of 2.2 kW. During the test, it was found that the average annual array efficiency, system efficiency, and inverter efficiency of the system were 13.3%, 12.6%, and 94.6%, respectively. The total output energy during the measurement period was 3708.2 kWh, and the rated energy output was 1685.5 kWh/kWp. Through experimental research analyzing photovoltaic grid-connected systems in Algeria, S.Bouacha et al. [30] found the efficiency of the photovoltaic modules, system, and inverter to be 8.62%, 8.29%, and 96%, respectively, and found that the reasons for low system productivity were proximity to shadows and the use of inverters. Yuhe Gao et al. [31] conducted experimental and numerical research on a photovoltaic direct-drive refrigeration/heating system, verified the model using MATLAB, and found that it can not only use solar energy efficiently but can also improve the cooling capacity of the system. Huaxu Liang et al. [32] performed solar spectrum beam splitting according to wavelength matching to improve the photoelectric and photothermal conversion of solar energy, and they used nanofluid, nano thin films, and translucent photovoltaic cells to achieve SBS technology to improve the photoelectric conversion efficiency. According to the research of Kexiang Hu et al. [33], the photoelectric conversion efficiency can also be improved by using nanoarrays.
This paper studied the performance of a PV and mains-coupled heating system by combining experiments and simulations in cold regions of China:
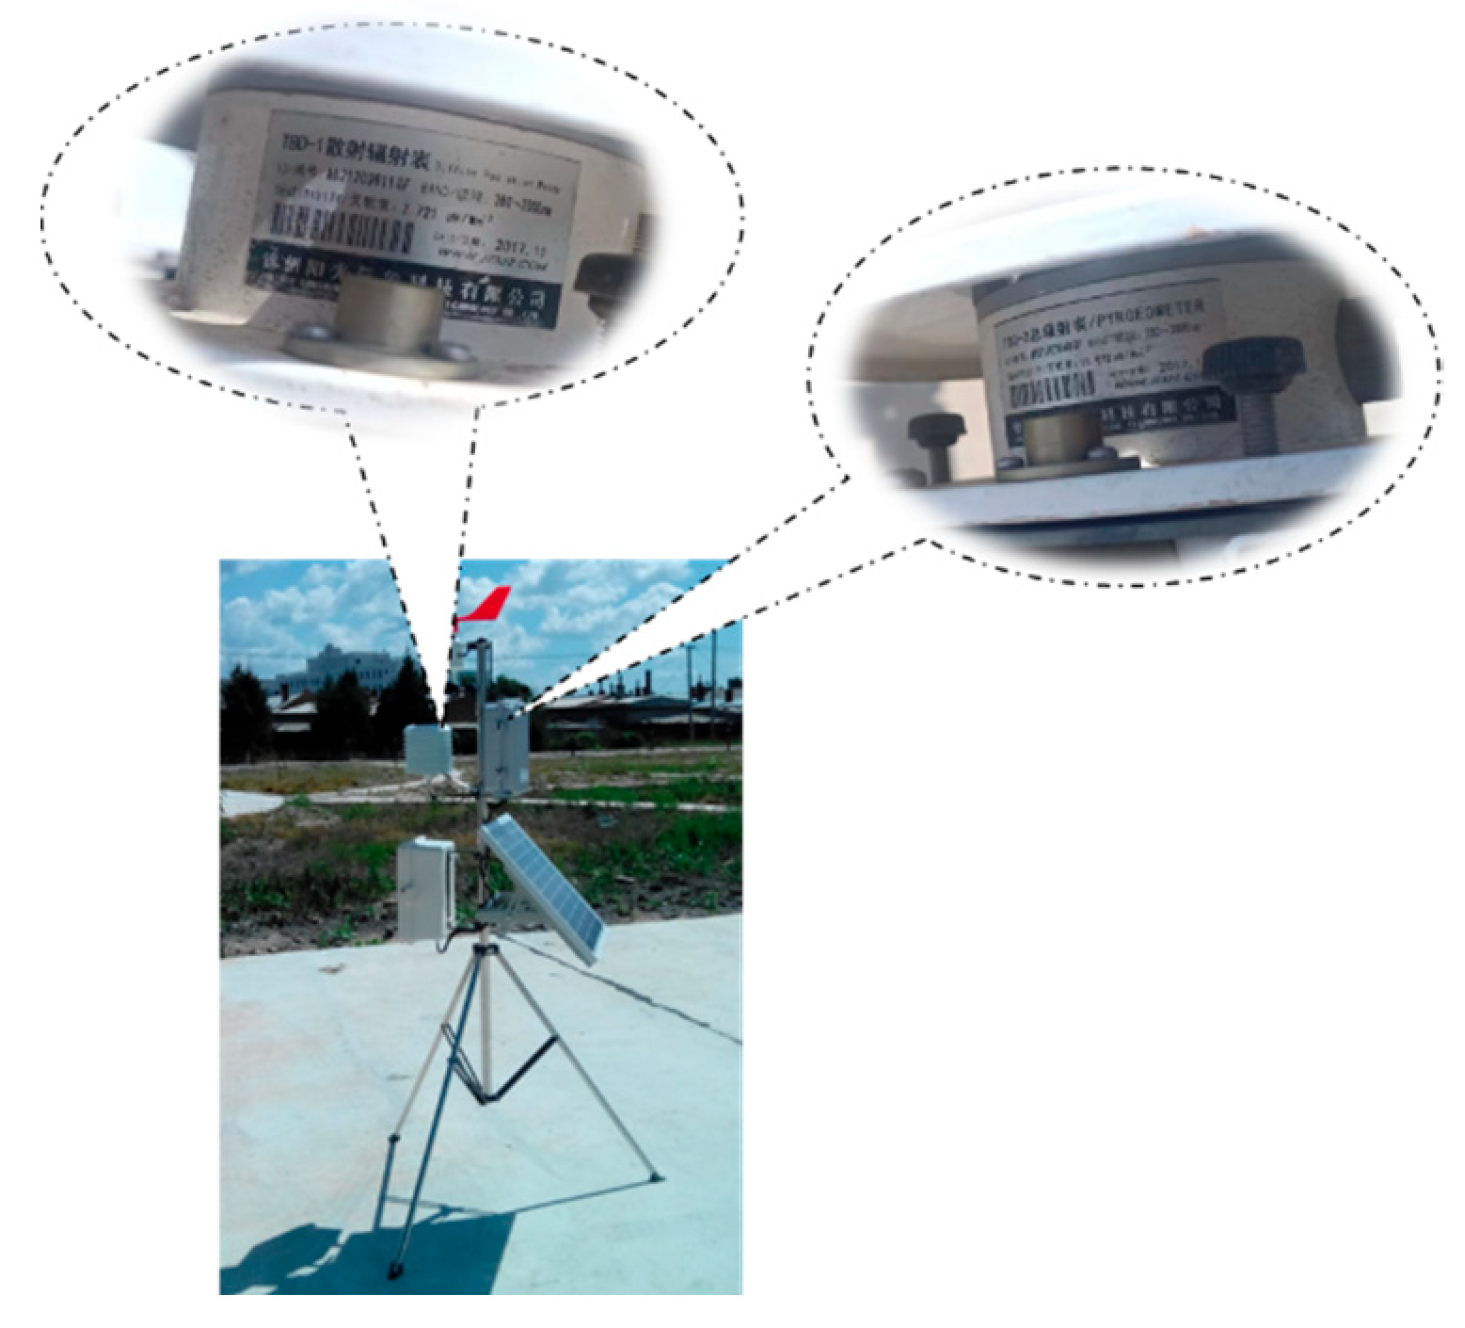
  • Firstly, the solar radiation-related parameter monitoring system was built to test the power generation performance of the photovoltaic system under typical climate conditions.
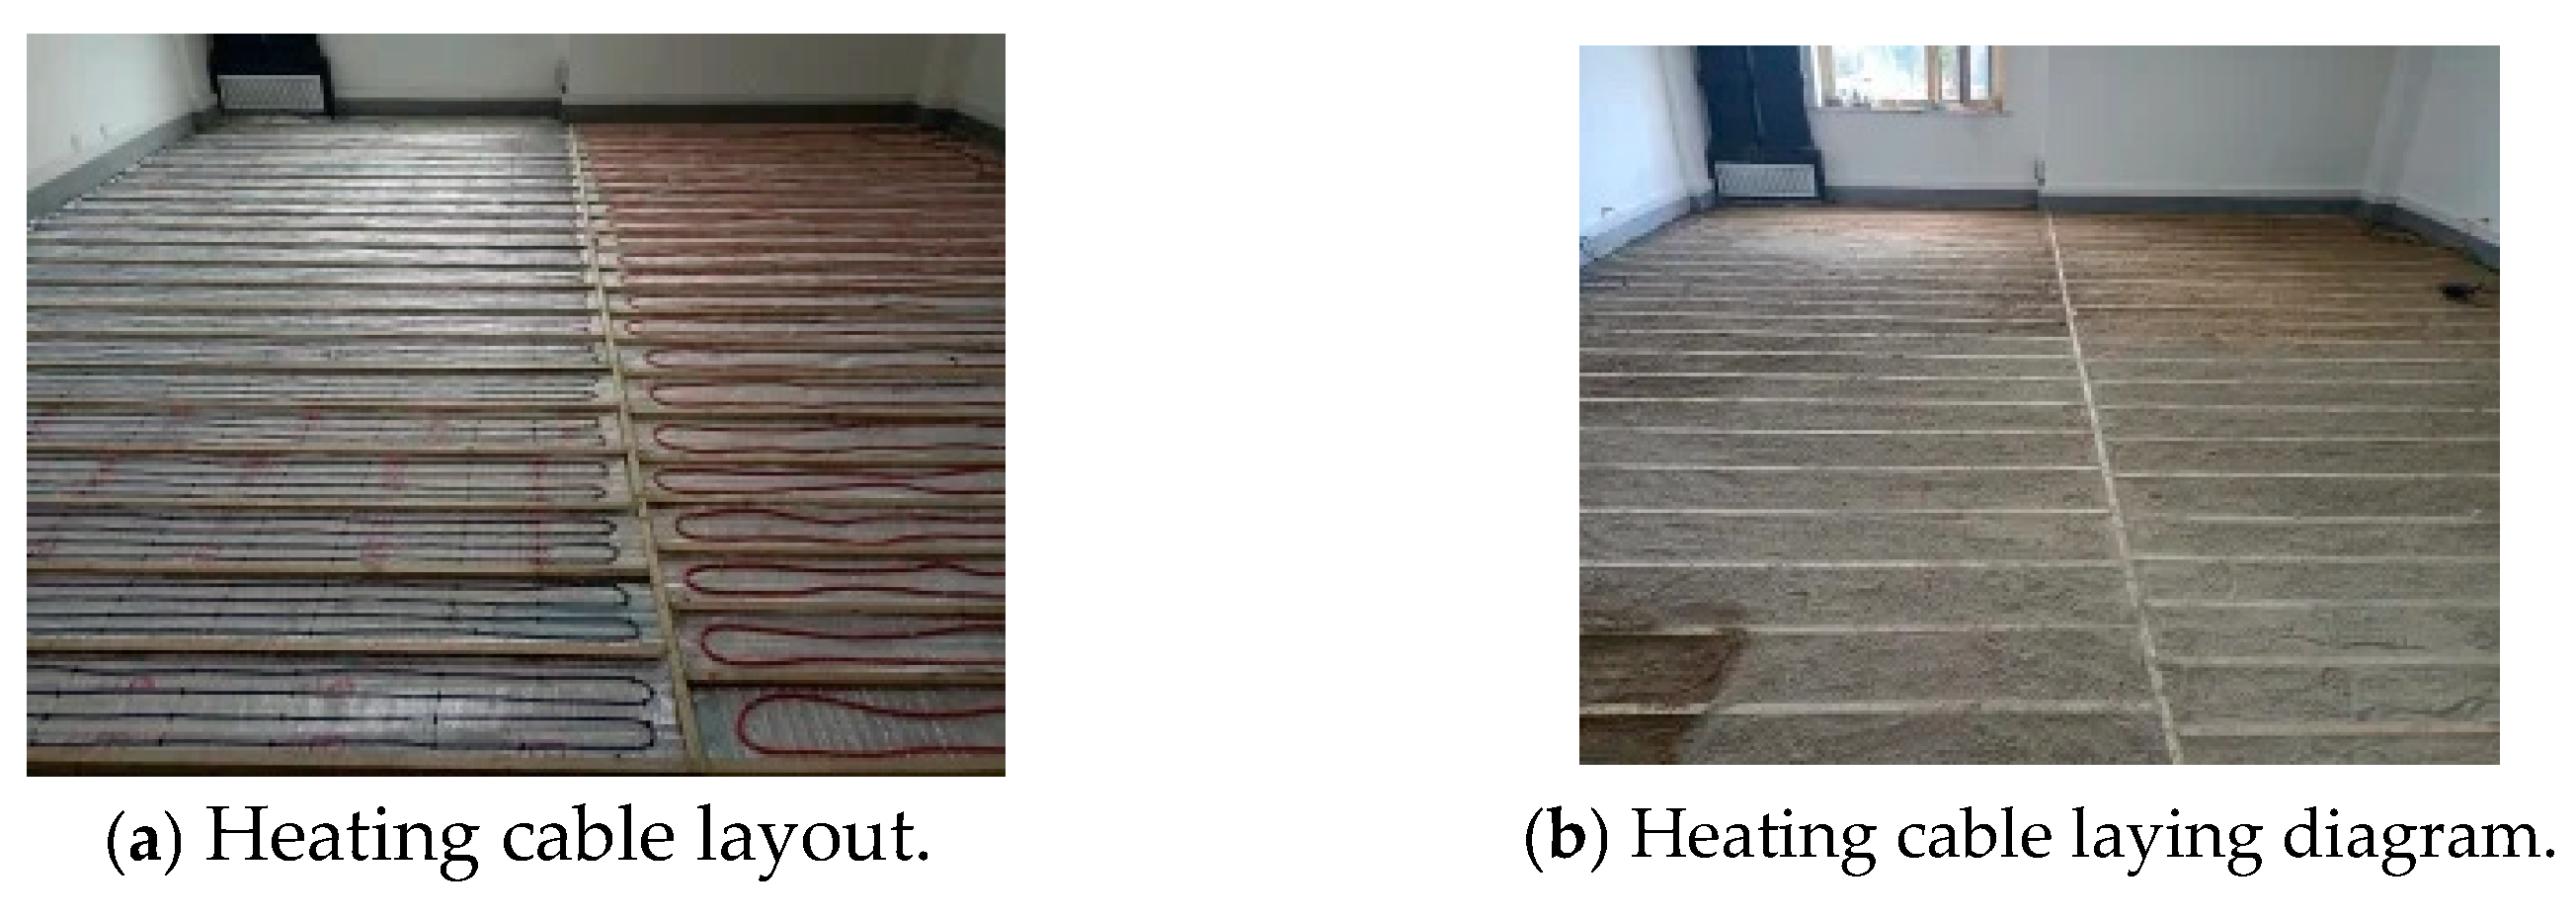
  • According to the experimental building conditions of the school, two kinds of heating cable mode (AC/DC switching heating cable, AC/DC synthetic heating cable) were set up in the test room, and the power generation and heating characteristics under typical working conditions were obtained.
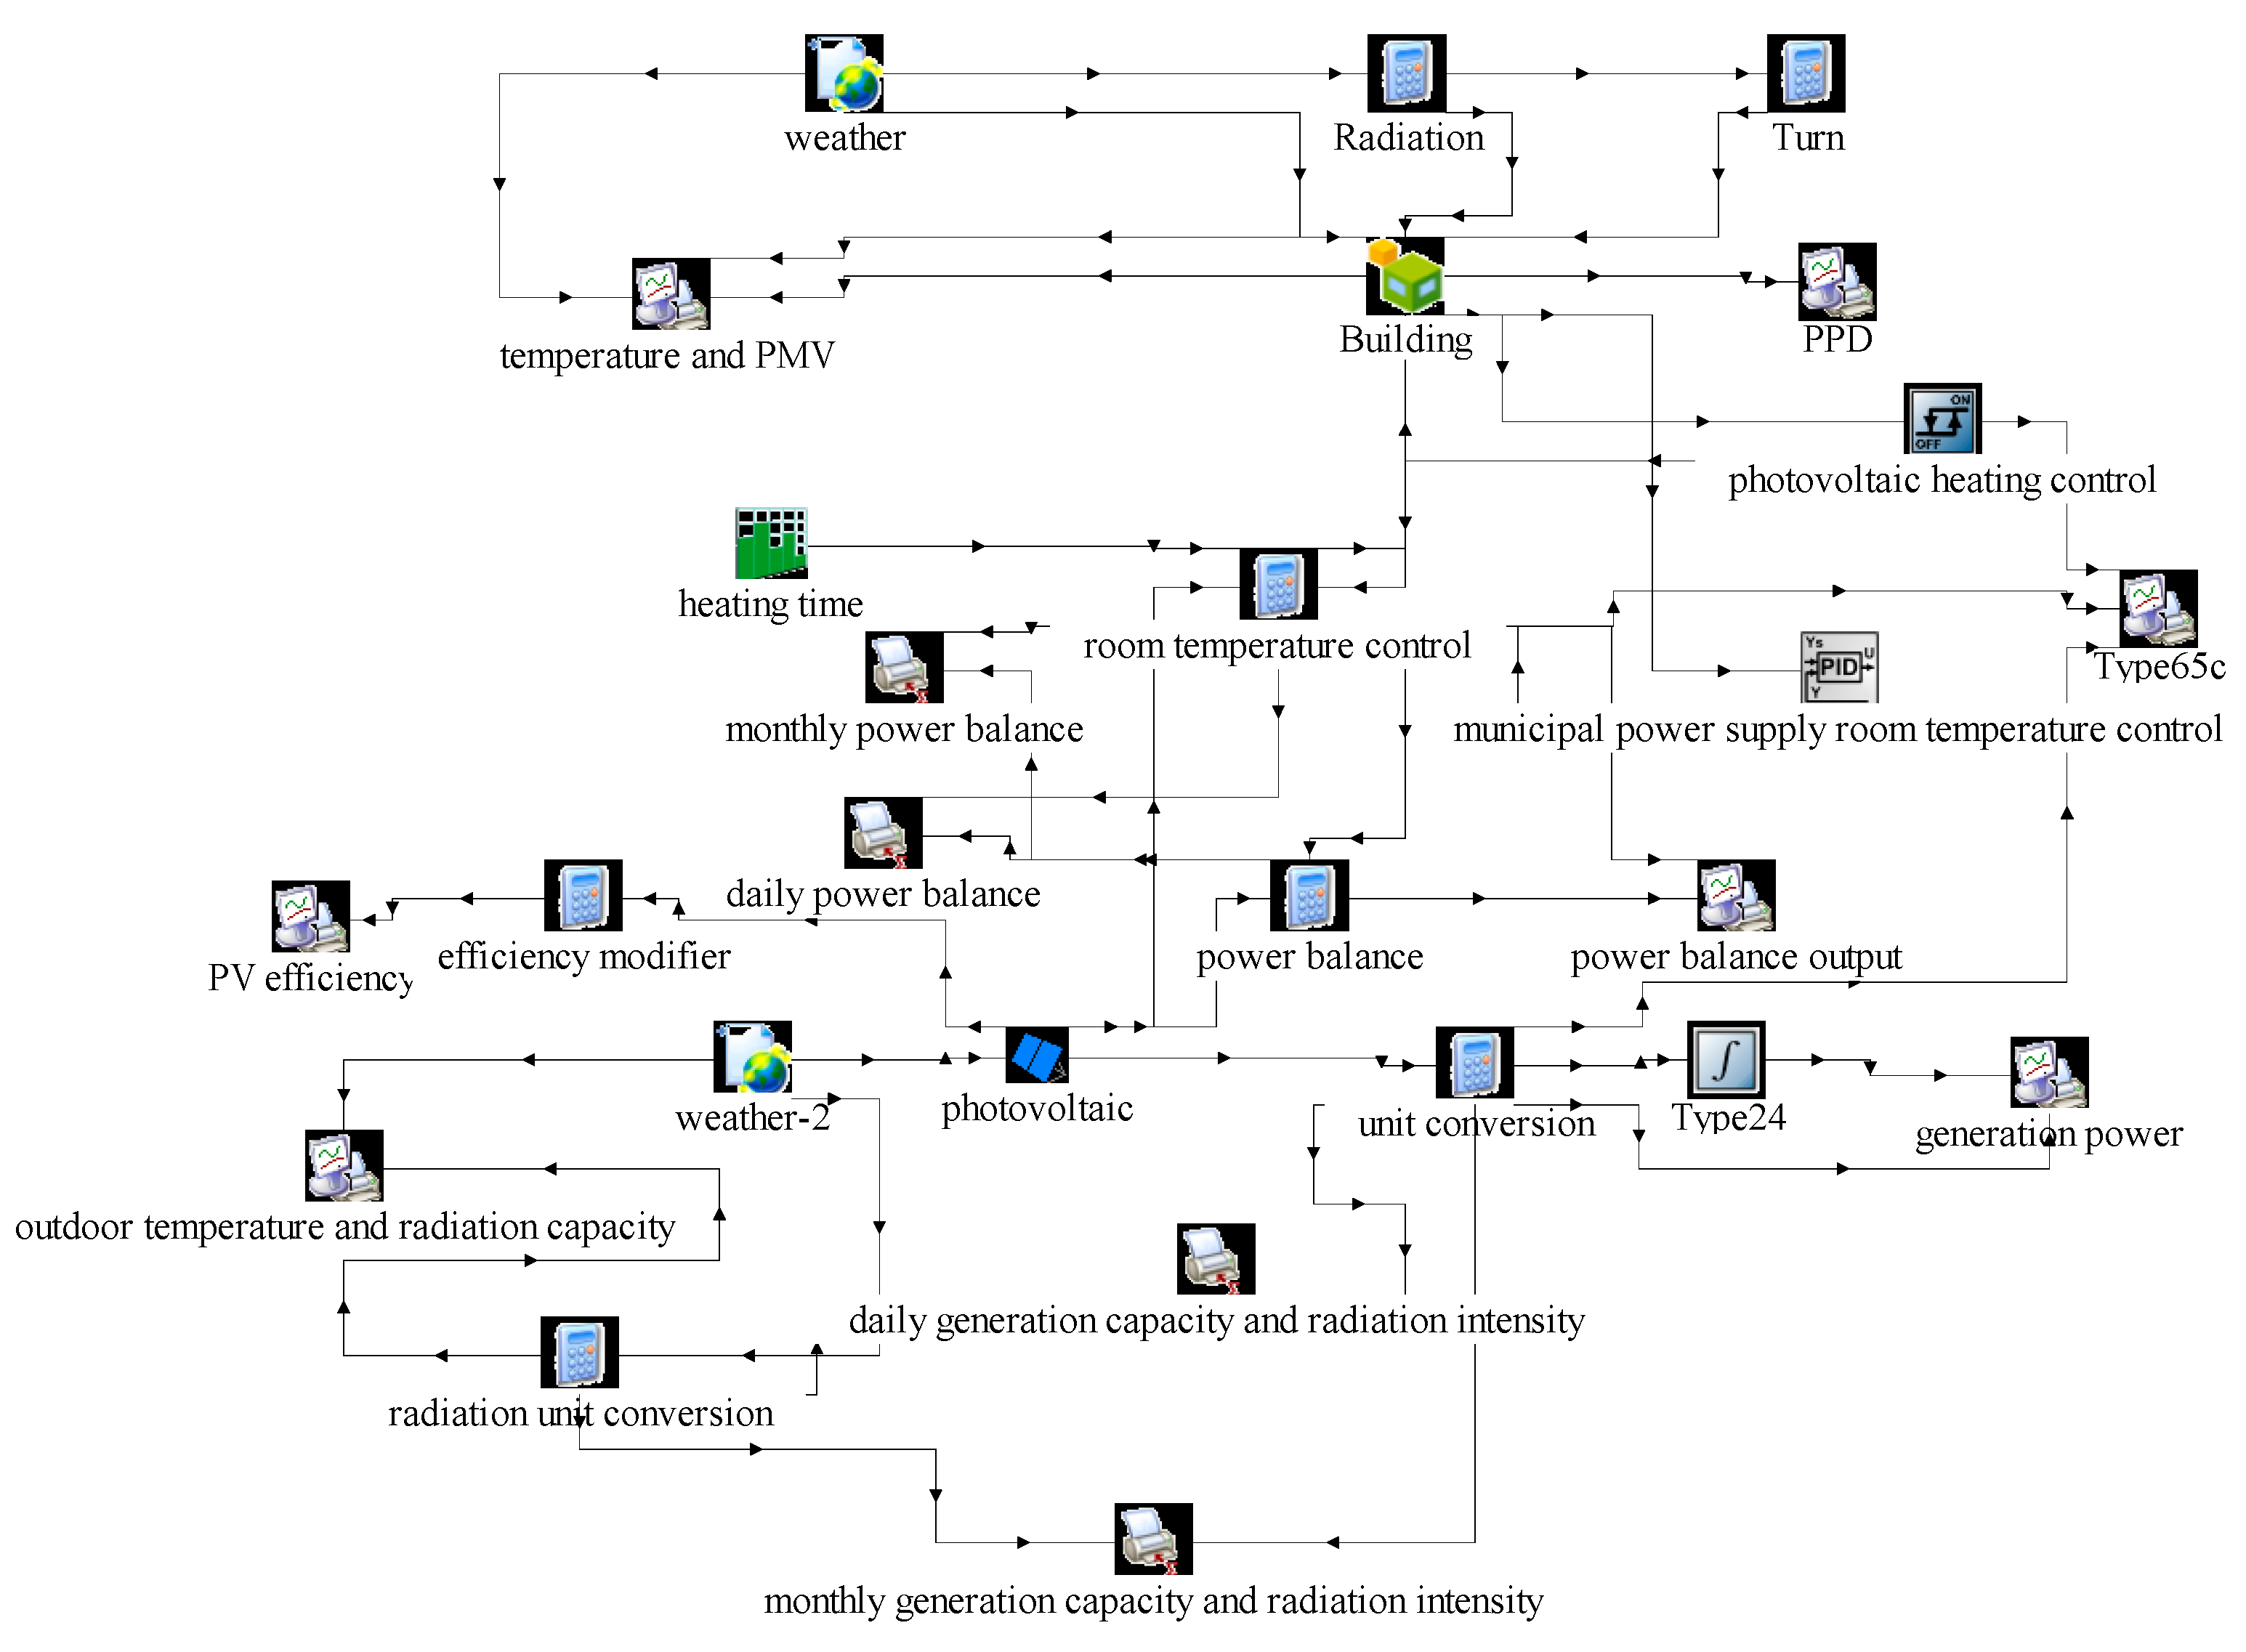
  • Through TRNSYS dynamic simulation calculation, the dynamic characteristics and energy consumption of the heating system under the coupling mode of the two heating cables and mains in the heating period were determined, and their economy is briefly compared.
This study reduced the operating cost of electric heating by using photovoltaic power generation and low-cost grain electricity to achieve the purposes of low-carbon heating, energy saving, and emission reduction and provides a certain basis for the popularization and application of solar and mains-coupled heating.

2. Theoretical Model of the PVDD and GC Electric Heating System

2.1. Photovoltaic Surface Radiation Intensity

When installing photovoltaic panels, the local dimensions and installation inclination angle should be considered, and the latter should be set to 44° [34]. The solar radiation intensity is composed of three parts: direct solar radiation intensity E z , sky-scattered radiation intensity E t , and ground-scattered radiation intensity E d [35] (unit W / m 2 ).
E = E z + E t + E d

2.2. Intensity of Direct Solar Radiation

The direct solar radiation intensity EZ on the inclined surface of the photovoltaic panel can be calculated by Equation (2):
E Z =   E f c o s   θ =   E f   c o s   ( ϕ - β )   c o s   δ   c o s   h   + s i n   ( ϕ - β ) s i n   δ
where E f indicates the normal radiation intensity on the inclined surface of a photovoltaic panel, θ is the incidence angle of the inclined surface of the photovoltaic panel, ϕ is the latitude of Changchun, β is the photovoltaic panel’s installation angle (44°), δ is the declination angle of the sun, and h is the hour angle.
The hour angle is usually used to indicate the angle of the Sun with respect to a certain longitude of the Earth; it is defined as follows:
h = 15   H
The declination angle is the angle between the sun’s rays and the Earth’s equatorial plane. The size of the declination angle depends on the observer’s location, along with the date and time, and is denoted by δ ; it can be calculated using the Cooper equation [36]:
δ = 23.45 s i n   ( 360   ·   284 + n 365 )
where n is the day of the year.

2.3. Intensity of Sky-Scattered Radiation

The radiation intensity E t scattered from the Sun to the sky by the slanted surface of the photovoltaic panel can be calculated by Equation (5):
E t =   E s s   ( 1 + c o s β 2 )
where   E s s represents the sky-scattered radiation intensity.

2.4. Ground-Scattered Radiation Intensity

The radiation intensity E d scattered from the Sun to the ground by the inclined surface of the photovoltaic panel can be calculated by Equation (6):
E d = ρ   E s   1     c o s β 2 = ρ ( E s z + E s s )   ( 1     c o s β 2 )
where ρ is the ground’s reflectance, E s is the horizontal radiation intensity, and E s s is the horizontal direct radiation intensity.
According to the aforementioned calculations and analysis, the solar radiation intensity on the inclined surface of the photovoltaic panel can be calculated using Formula (7):
E = E f cos ( φ β ) cos 23.45 sin ( 360 ° 284 + n 365 ) cos h + sin ( φ β ) sin 23.45 sin ( 360 ° 284 + n 365 ) + E s s ( 1 + cos β 2 ) + ρ ( E s z + E s s ) ( 1 cos β 2 )

2.5. Photovoltaic Panel Output Power

The mathematical model for photovoltaic power generation mainly considers the dependency of conversion efficiency on temperature, the composite of the direct and scattered components of incident light, and the influence of the Sun’s position. The specific calculation method can be determined based on Equation (8):
P = A ·   G ·   η
where P is the power generation (watts, W), A is the surface area of the photovoltaic panel (square meters, m²), G is the solar radiation intensity (watts per square meter, W/m²), and η is the efficiency of the photovoltaic cell (%).

2.6. The Calculation of the Photovoltaic Conversion Efficiency

The photoelectric conversion efficiency is usually calculated by Equation (9):
η = P o u t P i n · 100 %
where η represents the photoelectric conversion efficiency, P o u t represents the output electrical energy of the photovoltaic panel, and P i n represents the light energy of input to the photovoltaic panel, which can be determined from the irradiation intensity and light absorption area.

2.7. Load Calculation of the Experimental Room

According to the GB 50736-2012 Design code for heating, ventilation and air conditioning of civil buildings [37], the heat load of the experimental room is mainly from the building envelope, and the load was calculated by the following equations:
Q 1 = A ·   k ·   ( t w   t n )
Q 2 = 0.278 ρ w · C p   ·   V ·   ( t w   t n )
where Q 1 and Q 2 are the hourly heat load of the building and heat load due to cold air infiltration, W; A is the building envelope area, m 2 ; k is the coefficient of the heat transfer, W / ( m 2 · K ) ;   t w and t n are the outdoor and indoor calculated temperatures, K; ρ w is the density of air, m 3 / kg ;   C p   is the specific heat, J / ( kg ·   K ) ; and V is the cold air penetration volume, m 3 .

3. The Establishment of the PVDD and GC Electrical Heating System

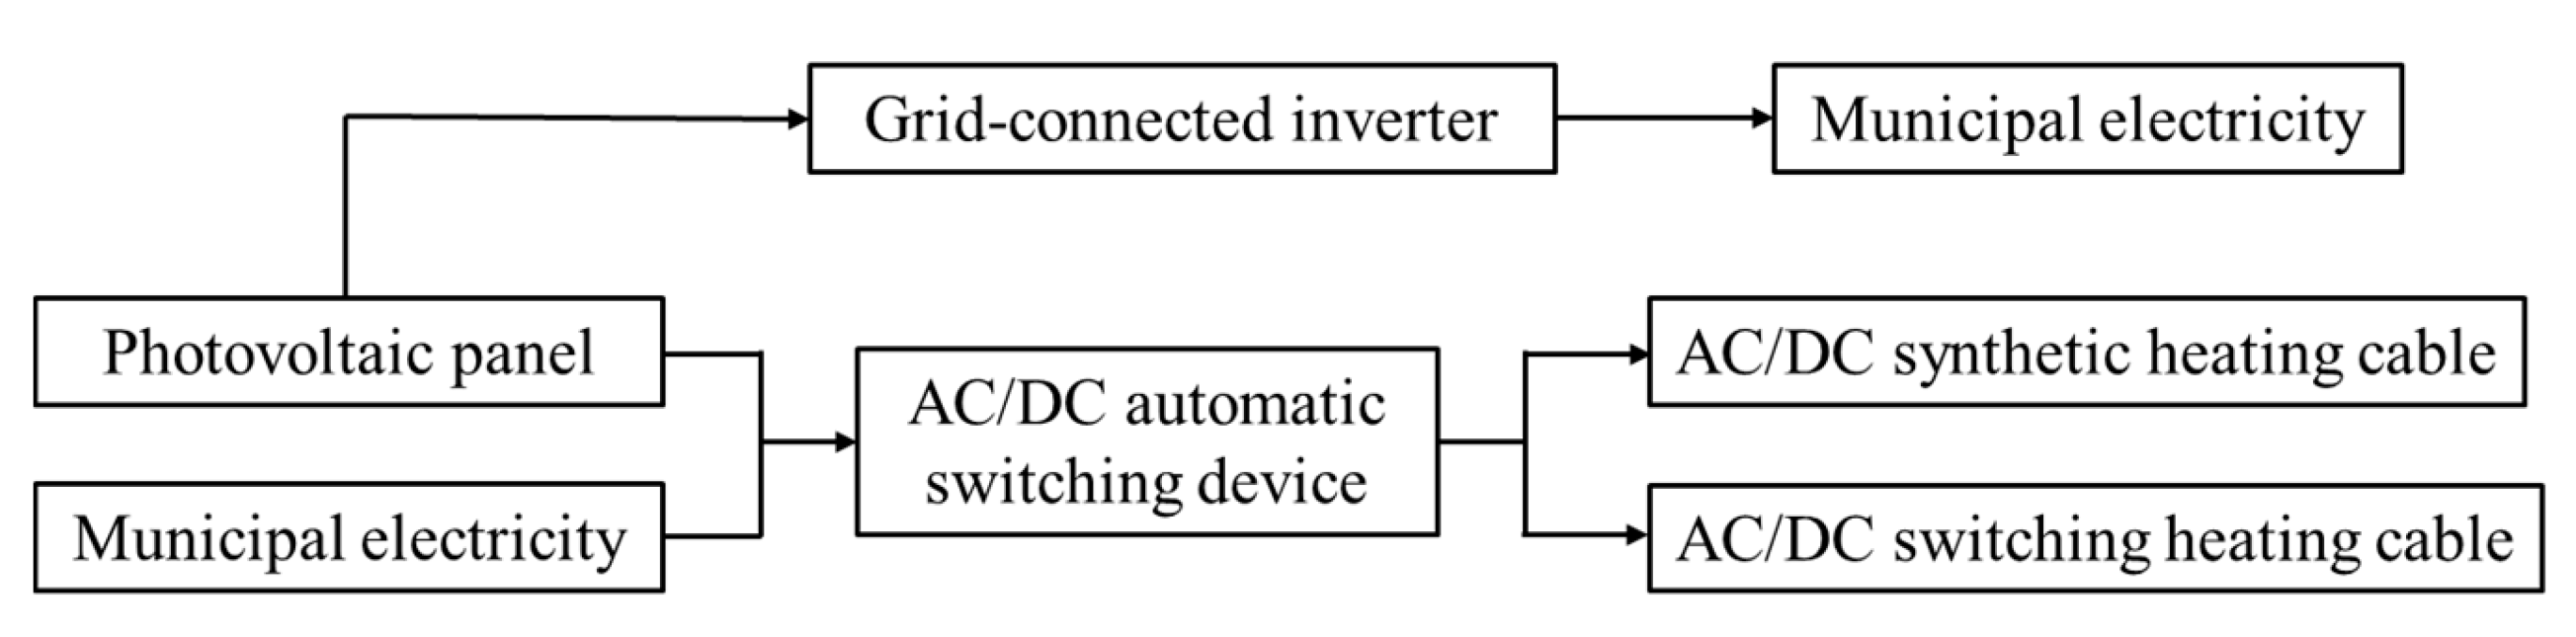
3.1. System Structure and Working Mode

The structure of the photovoltaic direct-drive and grid-coupled heating system (PVDD and GC) is shown in Figure 1, through photovoltaic power generation for building heating, effectively reducing building energy consumption [38]. This system mainly consists of a photovoltaic power generation system, municipal power supply system, and heating terminal system. The main components include photovoltaic panels, inverters, AC/DC switching devices, data monitoring devices, and heating terminal devices; the parameters of the photovoltaic panel, inverter, and Figure 2 exhibits the flow chart of each section.
According to the building’s heating load and temperature variations, the system prioritizes using photovoltaic power generation to supply the heating terminal devices. When the DC power is insufficient, it switches to the municipal power supply to meet the heating demand. Both the AC/DC switching heating cables at the terminal and the AC/DC composite heating cables can utilize photovoltaic DC power. During non-heating periods, excess electricity can be fed back to the grid.
The operation modes of the system include photovoltaic standalone power mode, municipal power supply standalone mode, and coupled photovoltaic–municipal power supply power supply mode:
(1)
When the solar irradiation intensity is high, the DC power is sufficient, and the photovoltaic direct current alone provides electric energy for the indoor heating device.
(2)
When the solar radiation intensity and the DC power are insufficient and the photovoltaic direct current alone is not enough to meet the indoor temperature demand, the photovoltaic direct current supplies the indoor heating device, while the municipal AC power provides part of the electric power, and the photovoltaic direct current and AC power supply the heating terminal device at the same time.
(3)
At night (or on overcast days), when the irradiation intensity is zero or very poor and there is no DC power, the indoor heating load is solely borne by the municipal AC power.
The AC/DC synthetic heating cable contains three independent electric heating lines, of which one DC heating line is rated at 3 kW, while the other two lines are AC lines with rated power of 2 kW and 1 kW, respectively. These three lines are separated by insulation inside the cable and do not affect one another.
In operation, the AC/DC composite heating cable can be heated by both direct current and alternating current in proportion. For example, when the direct-current power is 1 kW, a 2 kW AC line can be started, and the two can be combined to achieve a heating output of 3 kW. If the DC power gradually rises, it can also start the 1 kW AC line to achieve power compensation again. The three circuits can be flexibly combined according to the real-time change in the DC power in order to ensure the stability of the system output power, not only maximizing the advantages of photovoltaic power, but also ensuring the heating effect [39].

3.2. Construction of the Experimental PVDD and GC Electric Heating System

1.
Project profile
The test site was in an ultra-low-energy public building at a university in Changchun, Jilin Province, China. Ultra-low-energy buildings are the primary form of near-zero energy buildings, and for public buildings, the energy consumption level needs to be reduced by more than 50% compared with the “GB 50189-2015 Energy Efficiency Design Standard for Public Buildings” [40]. By optimizing the building envelope to improve the use of renewable energy in the building system [41], compared with traditional buildings, this building type can achieve energy savings of more than 80%−90%, which is considered to be the most effective way to reduce buildings’ energy consumption, reduce carbon emissions, and improve indoor thermal comfort [42]. The building has a single-sided walkway with a flat roof on the second floor. The test room is located on the south side of the second floor (Figure 3), with a construction area of 65.45 m2 and a building height of 3.6 m.
The enclosure structure meets the thermal insulation requirements of low-energy public buildings, and the door, window, electrical junction box, and pipeline penetration are air-tight. Through the above measures, the air-exchange frequency was found to be less than 0.6/h under the condition of a 50 Pa pressure difference between indoors and outdoors. The heat transfer coefficients of each enclosure are shown in Table 1.
2.
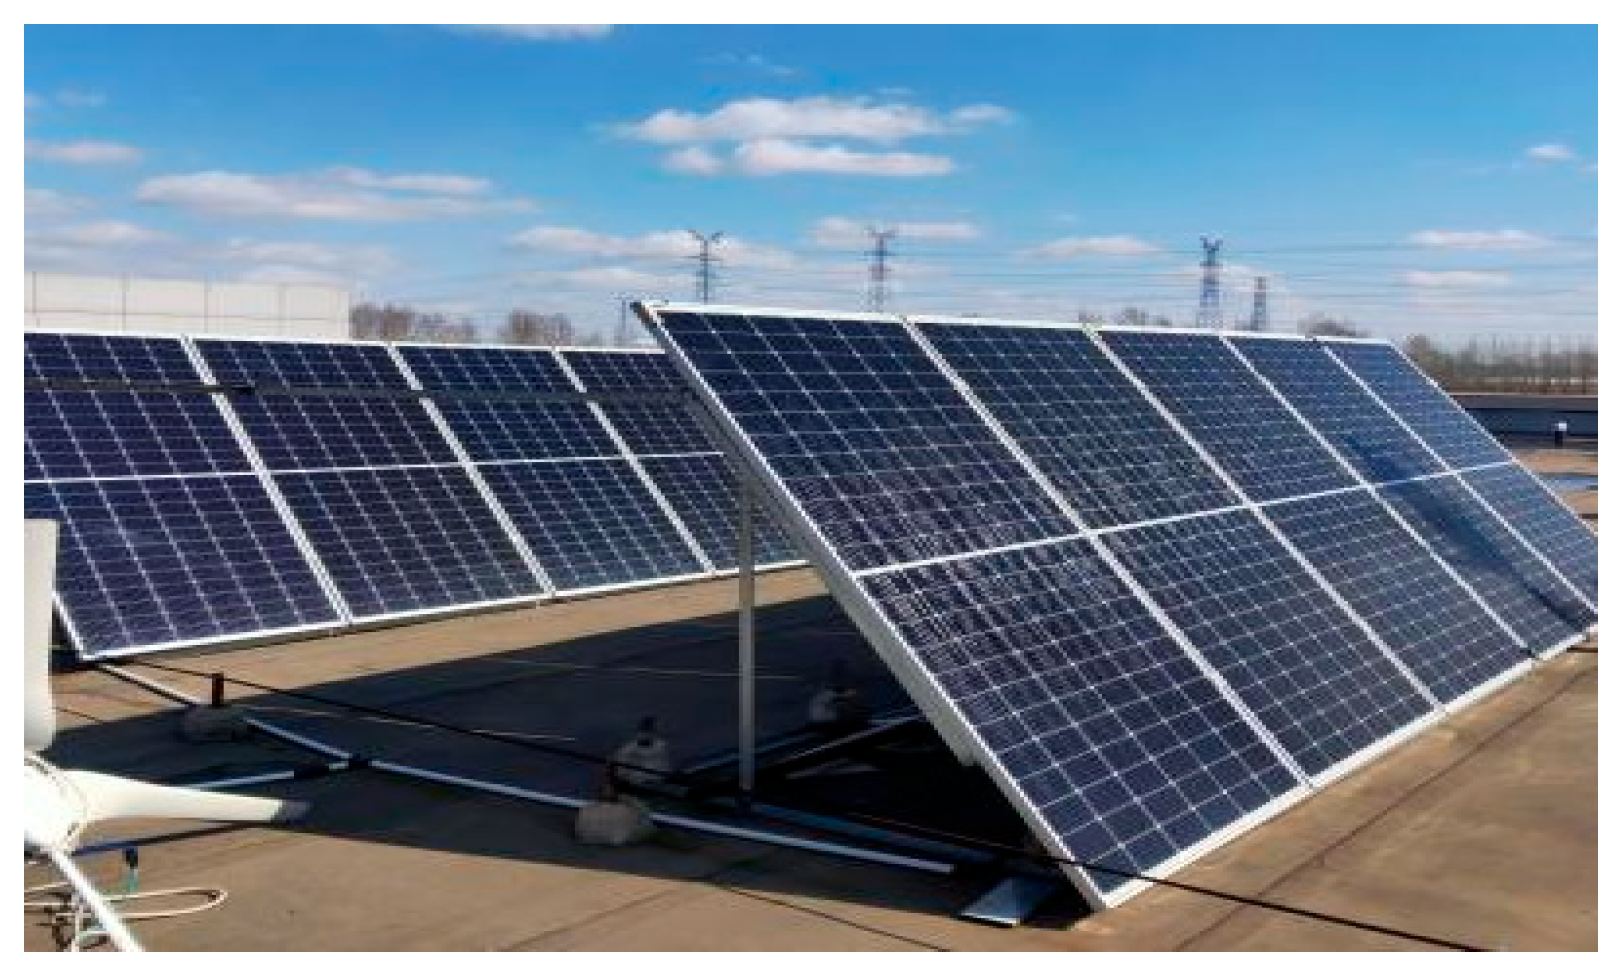
Photovoltaic panel selection
We selected 10 SVM-450 W monocrystalline silicon solar panels according to the power of the photovoltaic modules. Table 2 shows the specific model parameters. To stay consistent with the voltage and current of the original photovoltaic panels in the low-energy building, the 10 photovoltaic panels were connected in parallel in two groups, each consisting of 5 panels, on the second-floor roof of the low-energy building; the total installed power was 4500 W, the azimuth was 0° to the south, and the inclination was 44°.
3.
Inverter selection
Considering the matching photovoltaic array capacity, grid-connected standards, inverter efficiency, and economy, we selected a capacity of 6 kW, which not only meets the requirements under the maximum power point, but also maintains a high efficiency within a wide power range. The parameters of the grid-connected inverters are shown in Table 3.
4.
Heating cables
Based on the heat load calculation results, the heating cables’ installation power was designed and calculated to be 3000 W. The significant advantage of these cables is that the variable-power heating cable can automatically adjust the electric heating output at different frequencies, and the working principle is similar to that of a frequency-conversion air conditioner, realizing true energy savings. Figure 4 shows the heating cables.
The maximum spacing between the heating cables should be no greater than 300 mm, the minimum spacing between the heating cables and the internal walls should be no less than 100 mm, the inner surface of the external wall should be no less than 100 mm, and the density should be increased in the area near the external wall and the external window where the local heat load is large.

3.3. Determination of Solar Radiation Intensity

Through the integration of the small weather station and the monitoring system, the solar radiation intensity and ambient temperature were measured, the input and output of the photovoltaic panel were calculated, and the photovoltaic conversion efficiency was determined. Figure 5 shows a continuous collection device for solar irradiation intensity.

4. Research and Analysis of the System Heating Performance

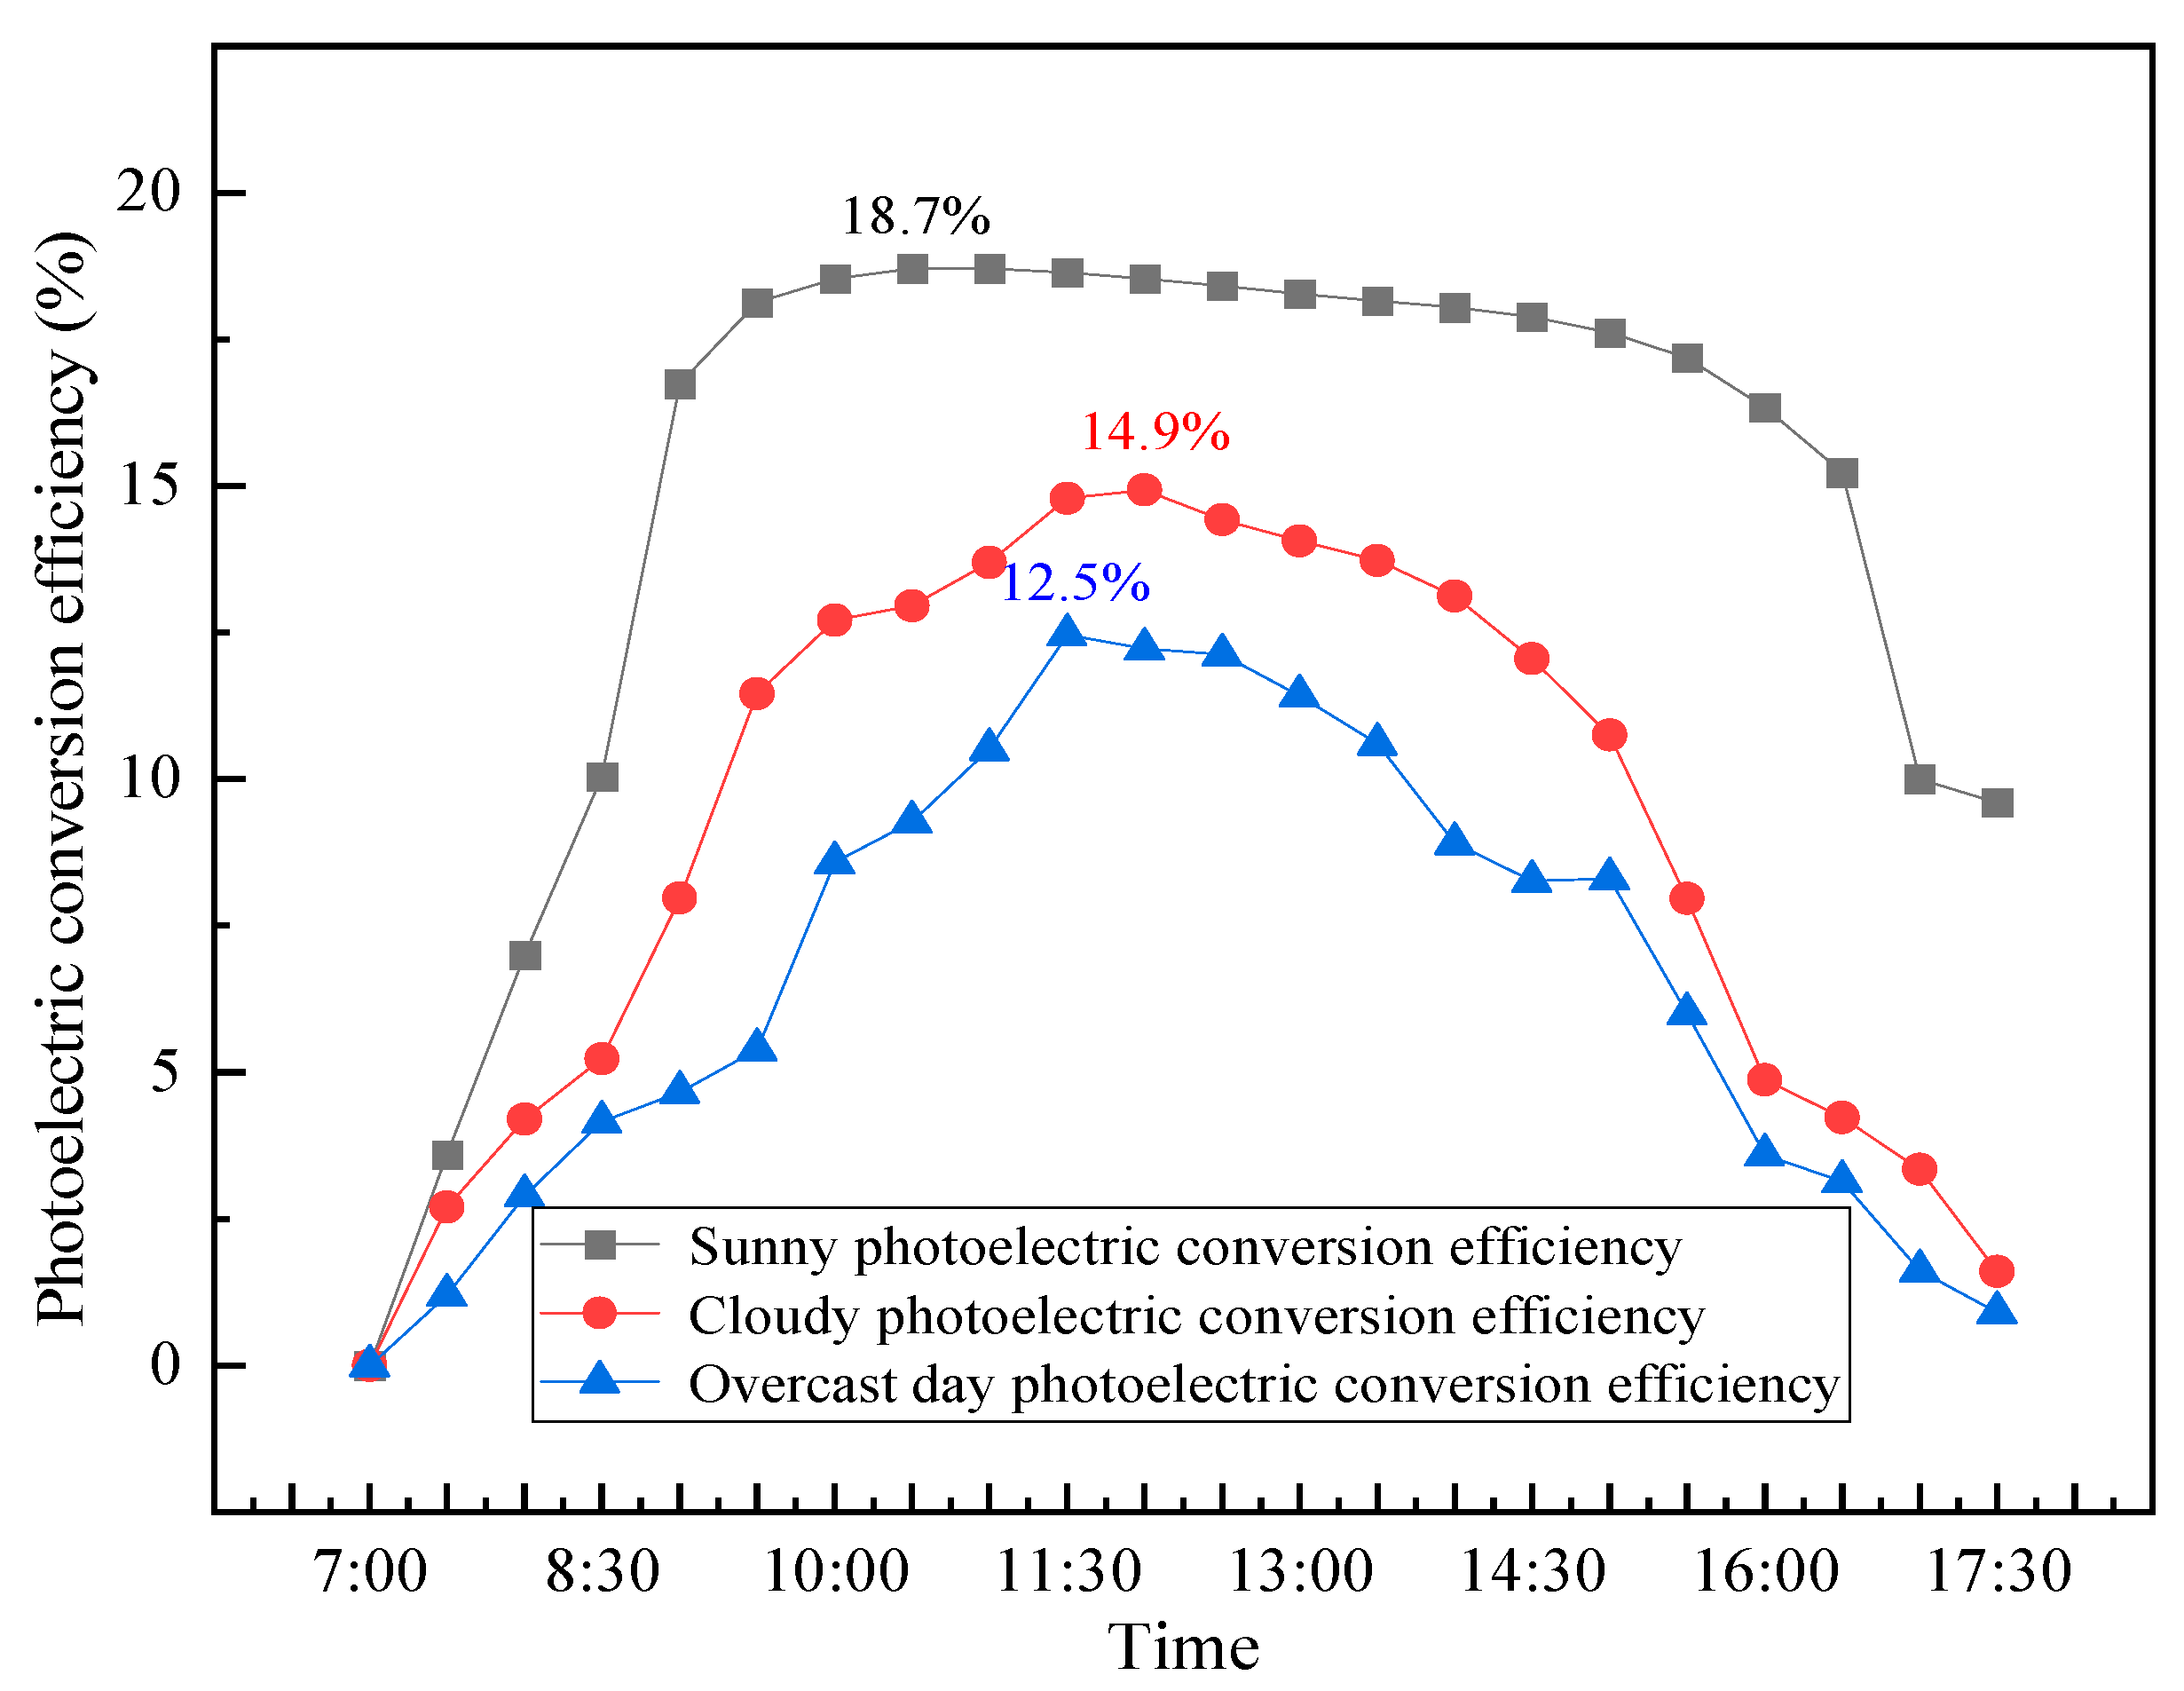
4.1. Photovoltaic Power Generation System

Figure 6 shows the photovoltaic power generation system, which consists of photovoltaic modules, photovoltaic brackets, photovoltaic junction boxes, and grid-connected inverters. As the core components, the photovoltaic modules are made of monocrystalline silicon, with a conversion efficiency of 20%. In order to ensure the maximum irradiation intensity, the tilt angle of the photovoltaic brackets was set to 44°.

4.2. Heating System

Table 4 shows the length, rated power, coverage area, and spacing of the electric heating cable. As shown in Figure 7, the heating cable was laid under the floor of the room at parallel intervals, covering an area of 20 m 2 , and the cable spacing was 113 mm. Due to the differences in power supply and thermal power, this arrangement can balance the heating effect.

5. Results and Analysis

The three heating methods in the system were tested and analyzed. During the heating season from 25 October 2022 to 10 April 2023, the middle and end of the heating season, with rainy weather and poor lighting conditions, were selected for testing and analysis. According to the working hours of workers in the low-energy building (from 8:30 to 17:00), in order to ensure a comfortable working environment, the heating time was set to 7:00–17:00, for a total of 10 h; the indoor heating temperature was set to 20 °C.
Figure 8 shows the hourly power generation of the photovoltaic panels on sunny, cloudy, and overcast days; the maximum power generation was 4.49 kW, 1.5 kW, and 0.72 kW, respectively, while the minimum power generation was 0.03 kW, 0.02 kW, and 0.39 kW, respectively, during the heating season in Changchun.
As shown in Figure 9, the highest photoelectric conversion efficiency of the photovoltaic panels was at noon on sunny days, reaching as high as 18.7%; the lowest occurred in the morning and afternoon, reaching only 1.23%, with an irradiance of 0.01 kW/m2.

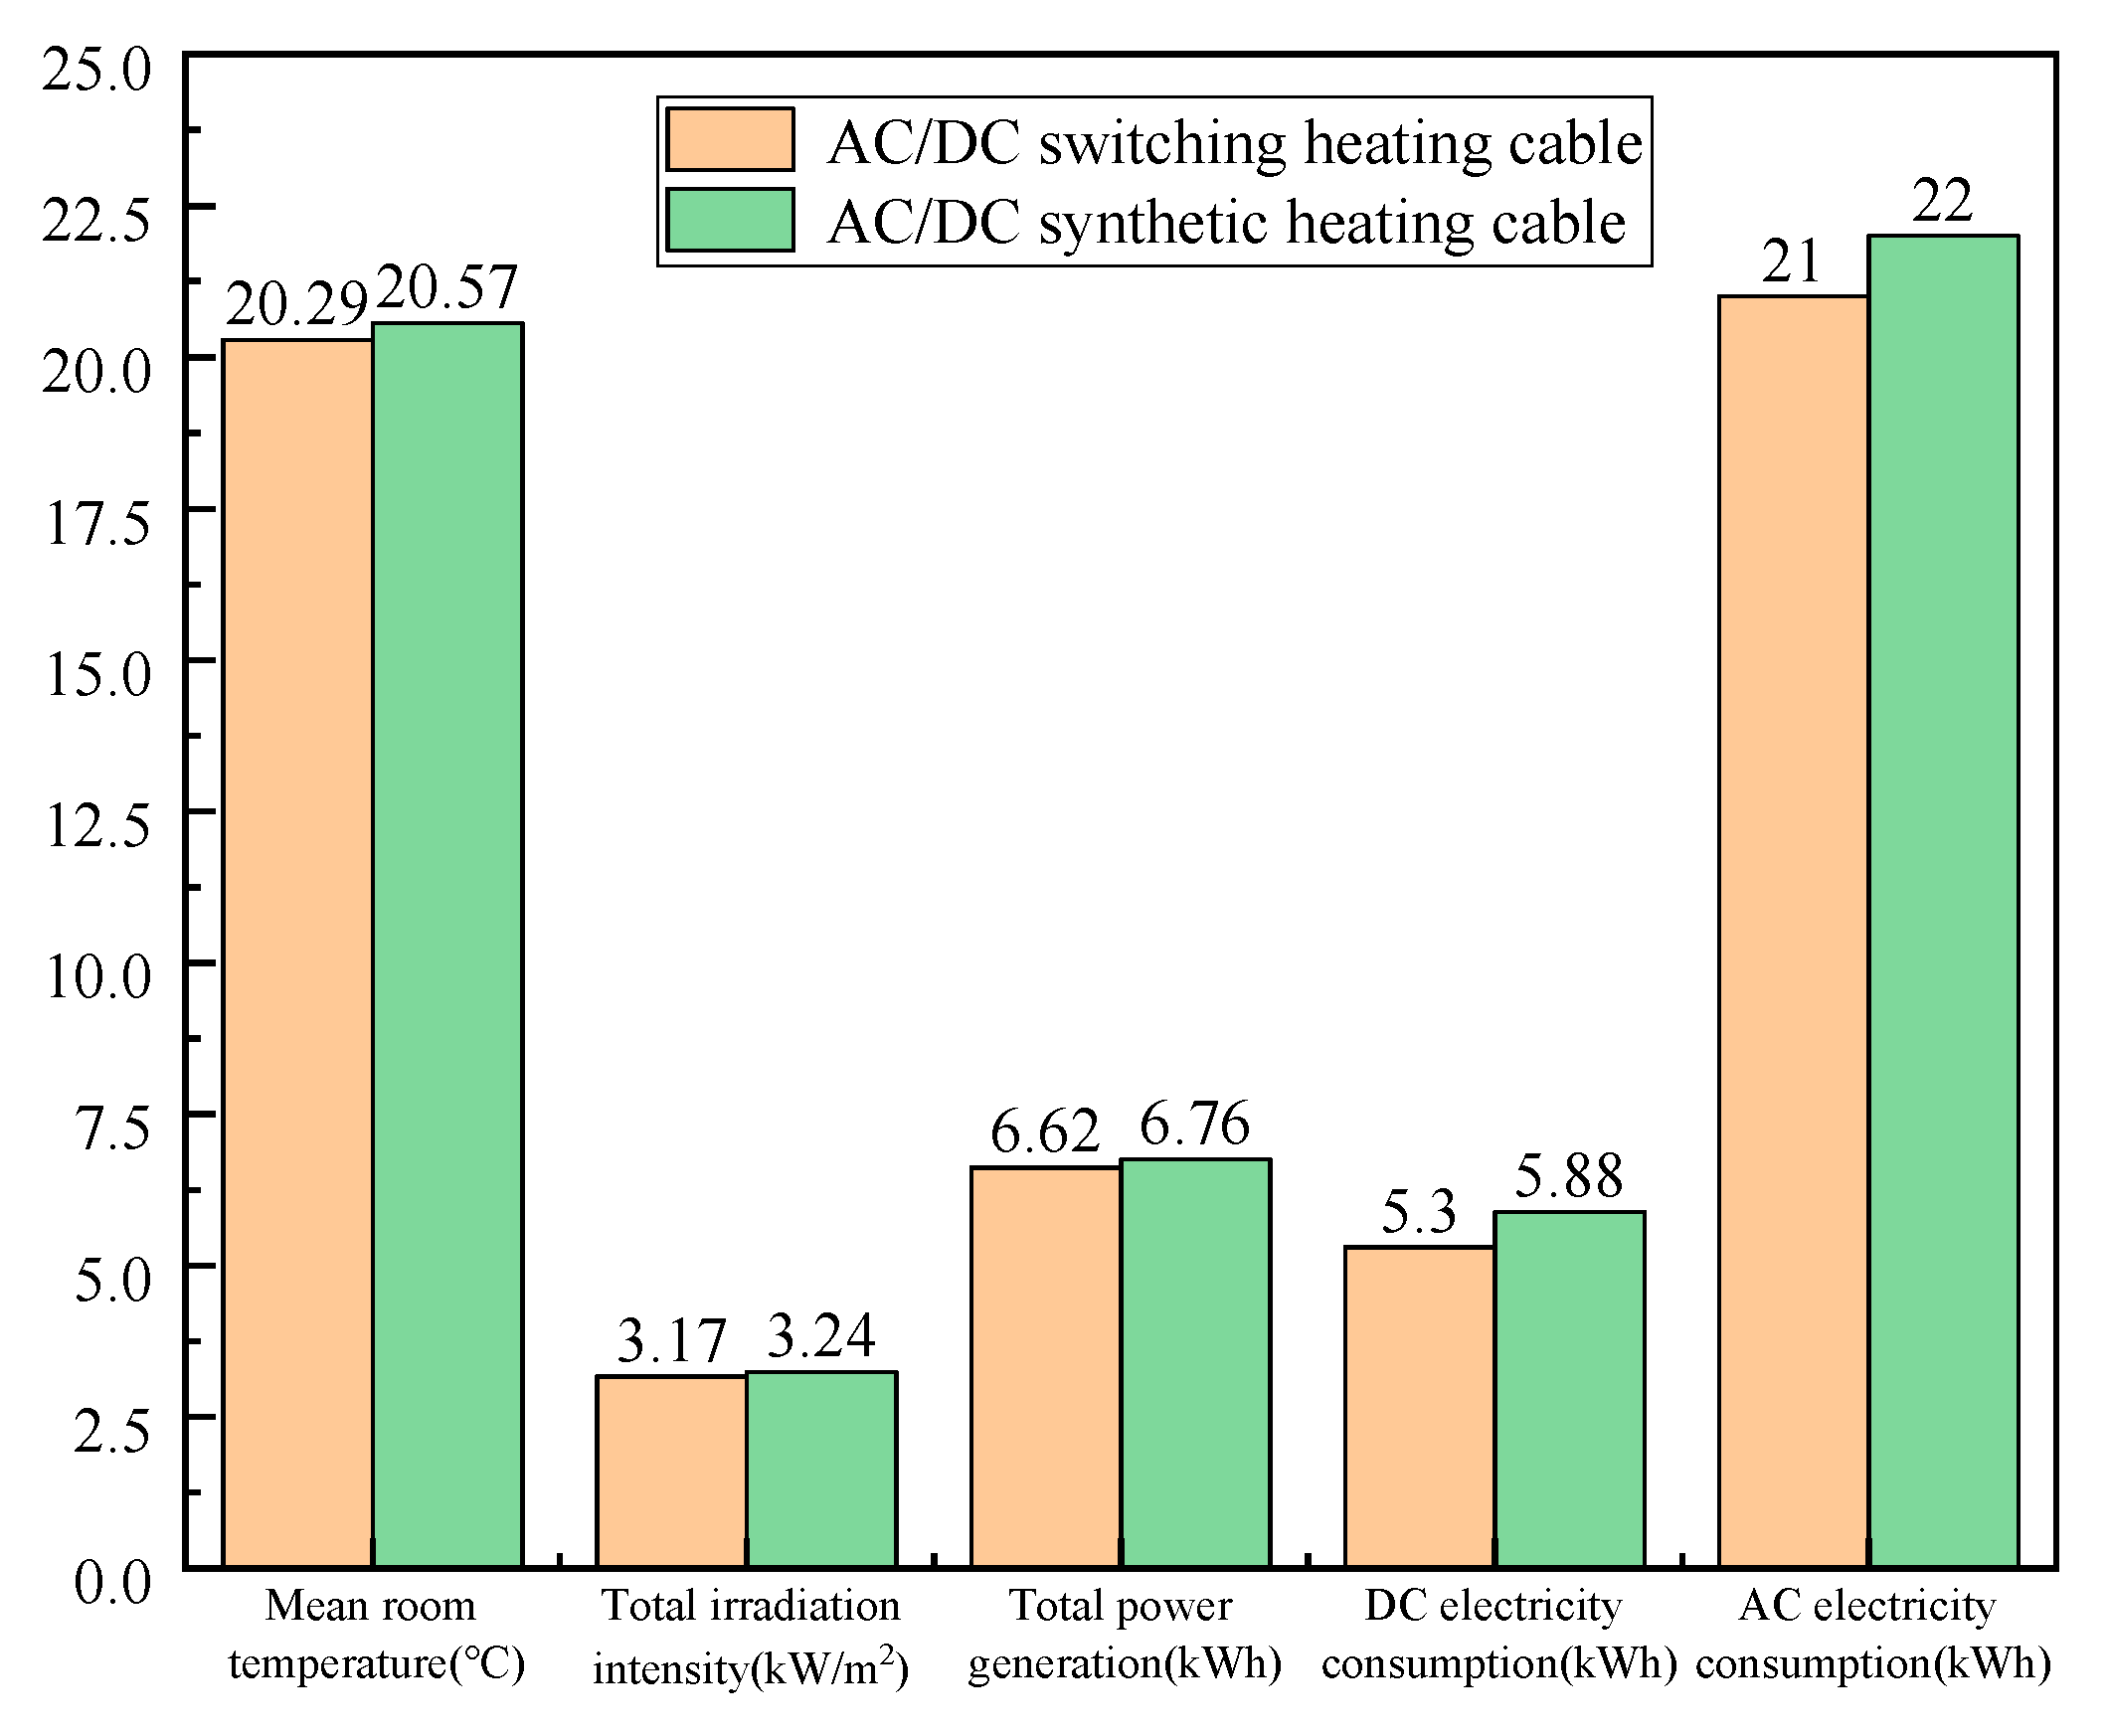
5.1. AC/DC Switching Heating Cable Mode

The AC/DC switching heating cable contains two independent electric heating lines with a rated power of 3 kW. When the photovoltaic power generation cannot meet the heating demand, the system can quickly switch to the AC power line and rely on the municipal power grid to supplement the indoor temperature.
As shown in Figure 10, before the heating cable was started on a sunny day, the indoor temperature was 16.2 °C, the outdoor temperature was 19.3 °C, and the surface temperature of the heating cable was 20.73 °C. After the heating cable was turned on, the indoor temperature increased slowly, reaching a maximum of 22.81 °C, and the temperature of the heating cable reached 48.5 °C. On overcast days, the indoor temperature was 16.3 °C, and the outdoor temperature was −20.4 °C. At this time, the temperature of the heating cable was 20.73 °C. After the heating cable was turned on, the indoor temperature reached a maximum of 23.9 °C, and the temperature of the heating cable was 49.13 °C. After the heating was finished, the indoor temperature was 23.39 °C, and the heating cable temperature was 48 °C.
As shown in Figure 11, the irradiation intensity of the outdoor photovoltaic panels reached the peak value of 0.97 kW/m2 on the same day, and the indoor temperature at this time was 21.3 °C, which was different from the subsequent peak value of 23.15 °C, indicating that the indoor temperature and outdoor irradiation conditions did not change simultaneously, which was caused by the thermal inertia and the heat capacity of the internal space and structural components of the building. When the AC/DC switching heating cable system continued to heat until 1:30 PM, the indoor temperature reached 21.5 °C, at which time the light intensity dropped to 0.89 kW/m2; the radiation intensity was unstable and uneven on overcast days, and the radiation intensity was only 0.11 kW/m2, i.e., 79% lower than that on sunny days (0.52 kW/m2).
As shown in Figure 12, in the middle of the heating period, with the increase in solar radiation intensity, the photovoltaic conversion efficiency of the photovoltaic power generation system also gradually increased. At 12 o’clock, the power generation reached the highest value of 4.4 kWh, and the indoor temperature rose to 20.8 °C, while the highest temperature of the whole day was reached at 16 o’clock, indicating that after the radiation intensity weakened, the photovoltaic conversion efficiency of the photovoltaic power generation system also gradually increased. The heat stored in the heating system continued to be released, delaying the appearance of the peak temperature. In the event of insufficient photovoltaic power generation on overcast days, the municipal power supply was turned on, and the indoor temperature increased from 16.1 °C to 22.9 °C, reaching its highest value at 4:30 p.m. (higher than the room temperature on sunny days).
As shown in Figure 13, in the initial stage of heating, the municipal power grid was used as the power supply to heat the room. From 9 o’clock, the light intensity received by the photovoltaic panel gradually increased, and the power output of the system also significantly increased. Due to the large temperature difference between indoors and outdoors, the heating load increased. At this time, the photovoltaic power supply was switched to the heat source. Under this heating method, the indoor temperature met the heating demand; the maximum indoor temperature reached 23.14 °C, and the total consumption of direct current during the whole heating period was 18.75 kWh. The total AC usage was 7.5 kWh.

5.2. AC/DC Synthetic Heating Cable Mode

As shown in Figure 14, before starting the electric heating system on sunny days, the indoor temperature was 16.7 °C, and the heating cable’s surface temperature was stable at 20.77 °C. After the system was started, the indoor temperature increased synchronously with the cable’s surface temperature; at 15:30, the indoor temperature peaked at 22.94 °C, and the cable’s surface temperature reached the highest point of the whole day at 14:30 (46.47 °C). With the weakening of the radiation intensity, the photovoltaic power generation, cable temperature, and indoor temperature all decreased, but the indoor temperature could still be maintained at 22 °C, When the test was conducted on overcast days, the maximum temperature reached 23.7 °C, the maximum temperature of the heating cable reached 47.8 °C, the indoor temperature could still be maintained 22.36 °C when the heating was stopped, and the maximum indoor temperature difference was 0.76 °C under different weather conditions.
As shown in Figure 15, on sunny days, although the radiation intensity on the photovoltaic surface weakened, the indoor temperature continued to rise, indicating that the heat transfer had a certain lag, and the indoor temperature reached its peak at 4 p.m. On overcast days, although the radiation intensity on the photovoltaic surface was weak, with the support of municipal electricity, the indoor temperature was higher than that on sunny days.
As shown in Figure 16, during the heating period, the indoor temperature and power generation of the AC/DC synthetic heating cable were tested. On sunny days, the indoor power generation reached the maximum value of 4.46 kW at 13:00, and the indoor temperature reached 22.46 °C at 16:30; the energy generation began to decline with the weakening of the irradiation intensity, and the indoor temperature was not affected due to the AC supplementation, indicating that in the middle stage of the heating period under good irradiation conditions, the photovoltaic power generation could meet the heating demand, while on overcast days the radiation intensity was insufficient and the power generation was uneven, with the maximum power generation reaching only 1.4 kW.
As shown in Figure 17, the working time of photovoltaic DC was 8 h, and the heating cable ran at full power for 2.5 h. When the DC generated by the photovoltaic panel was not enough to meet the indoor heating demand, municipal electricity was used as a supplement. With the gradual increase in the irradiation intensity, the DC heating was only used when the photovoltaic power generation was sufficient, and the indoor temperature reached 23.1 °C. The total use of direct current during the heating period was 20.39 kWh, and the total use of alternating current was 5.5 kWh.

6. System Simulation Results

TRNSYS was used to conduct a dynamic simulation of the system, mainly including the performance evaluation of photovoltaic power generation, power generation, power generation efficiency, municipal power supply, etc. The mathematical relationships between parameters were established through component connection using TRNSYS 17. Figure 18 shows the system schematic diagram built in TRNSYS 17.

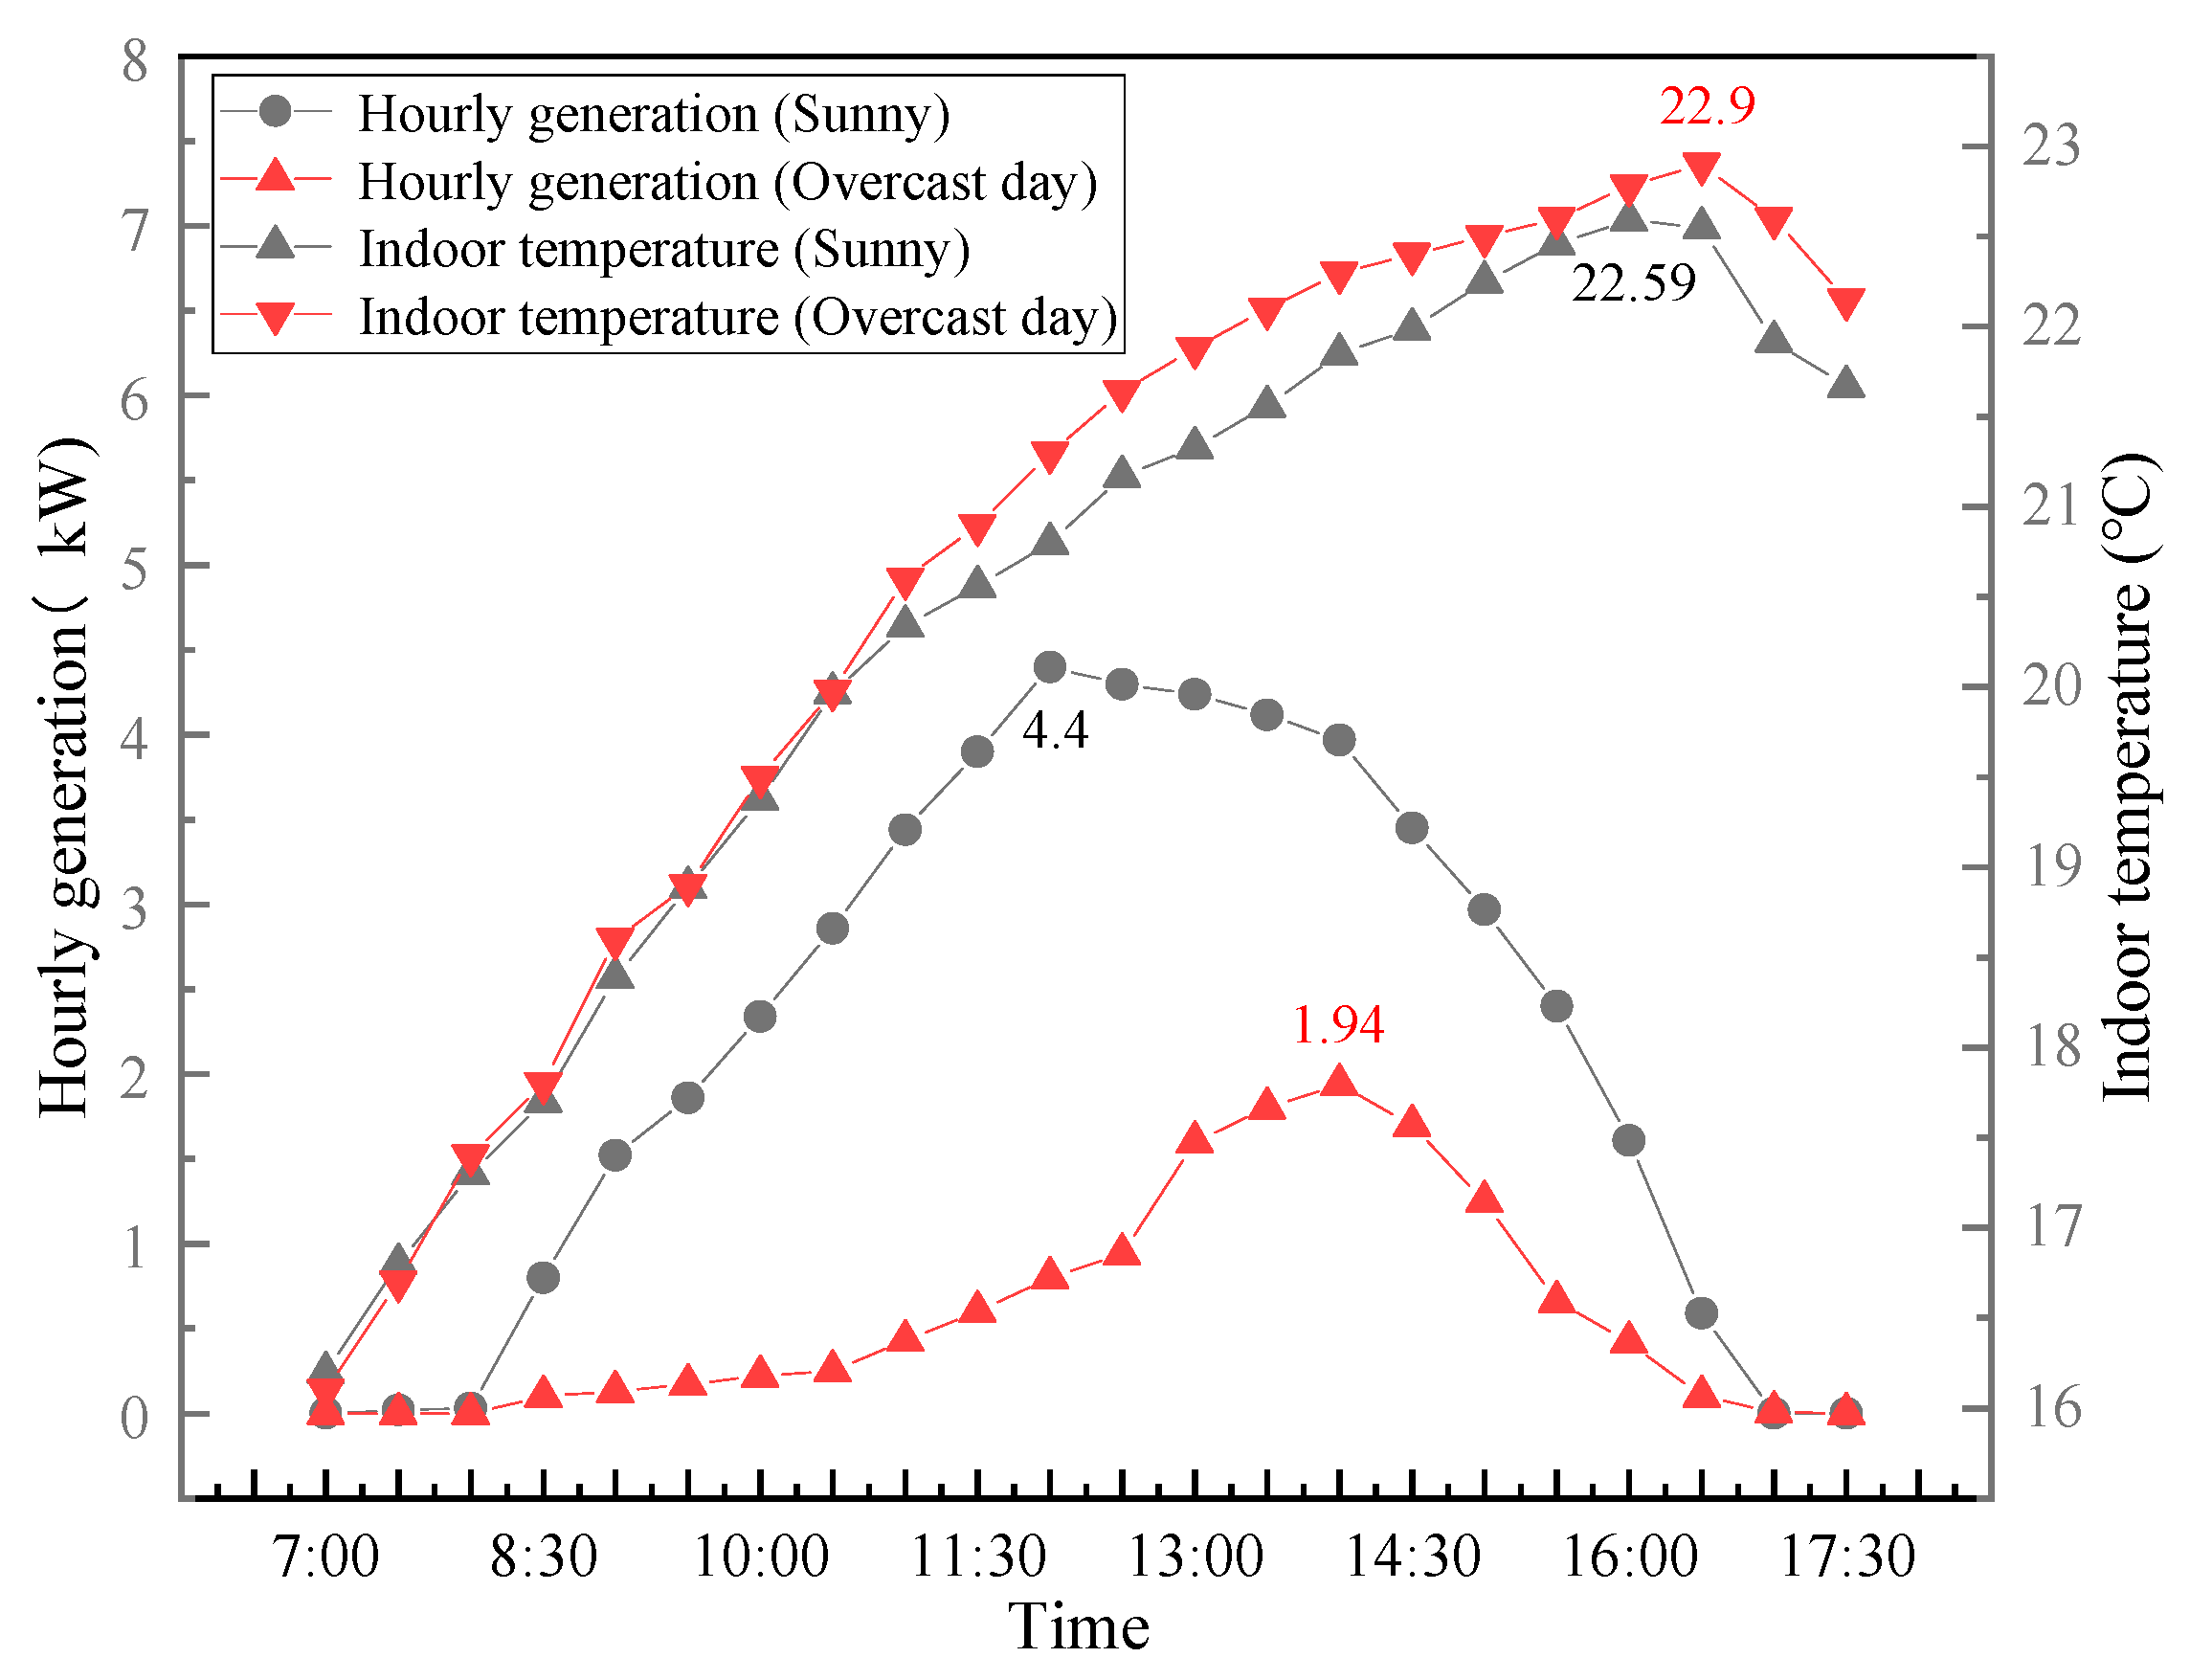
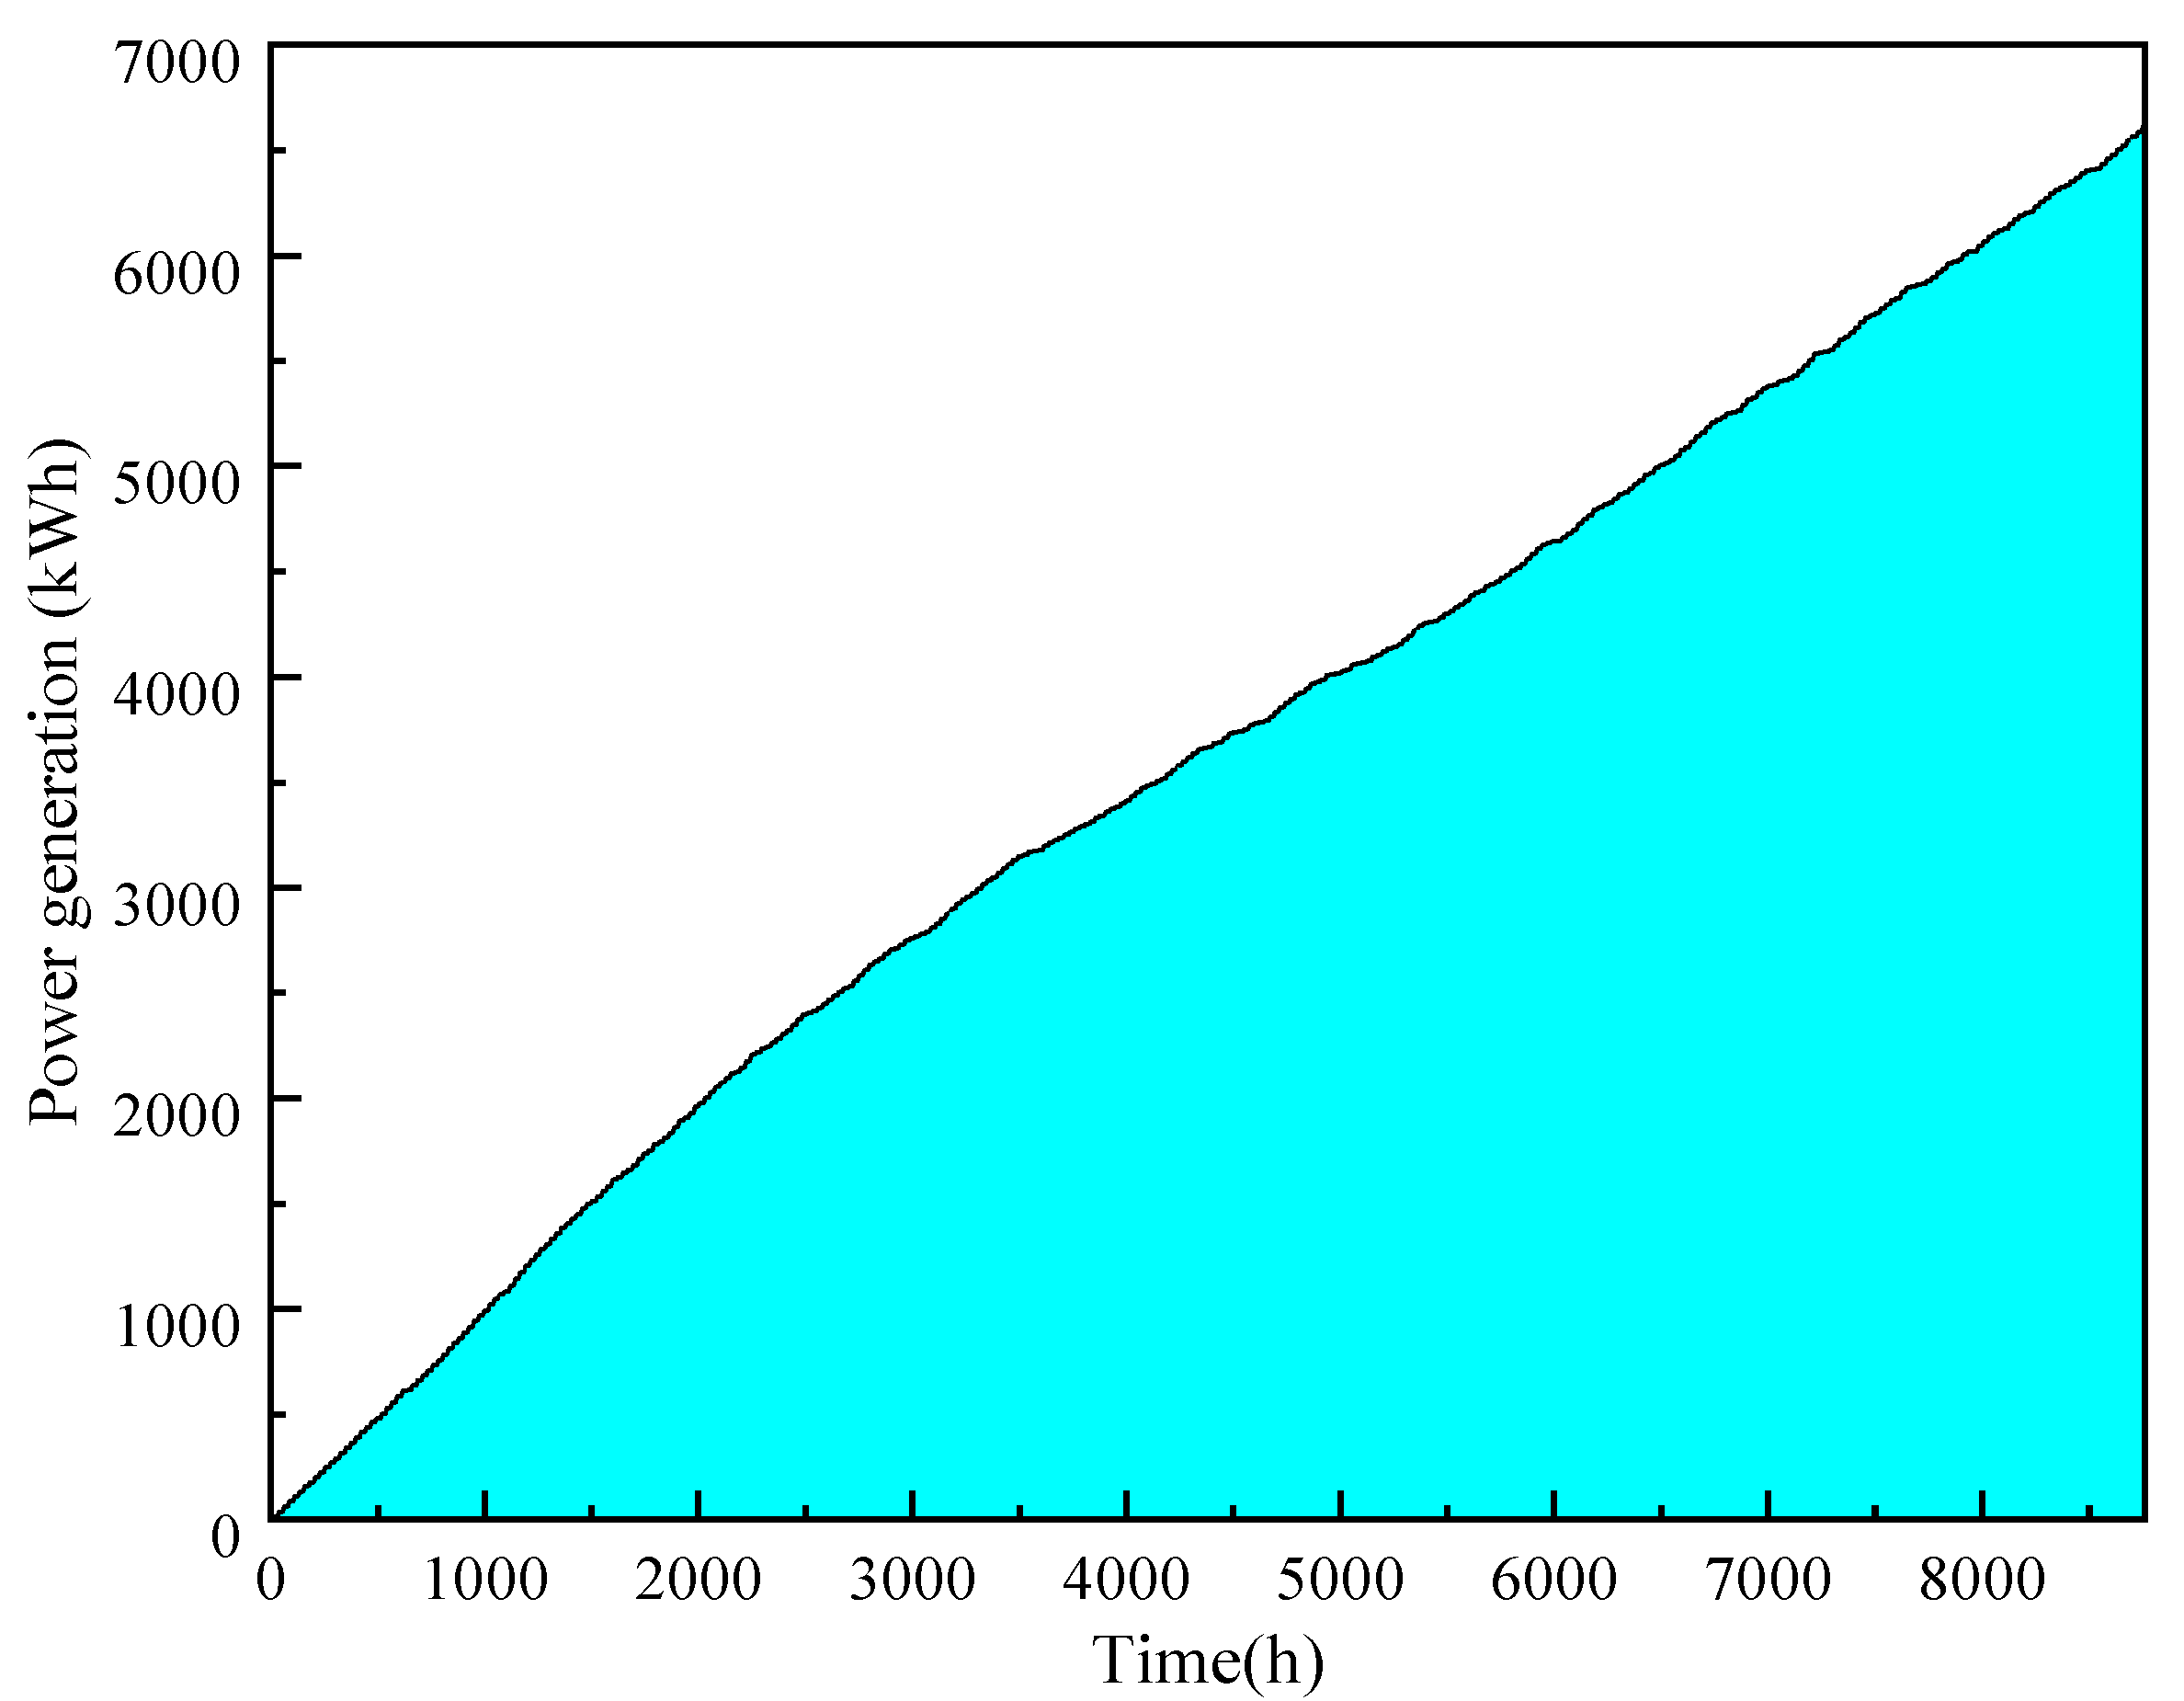
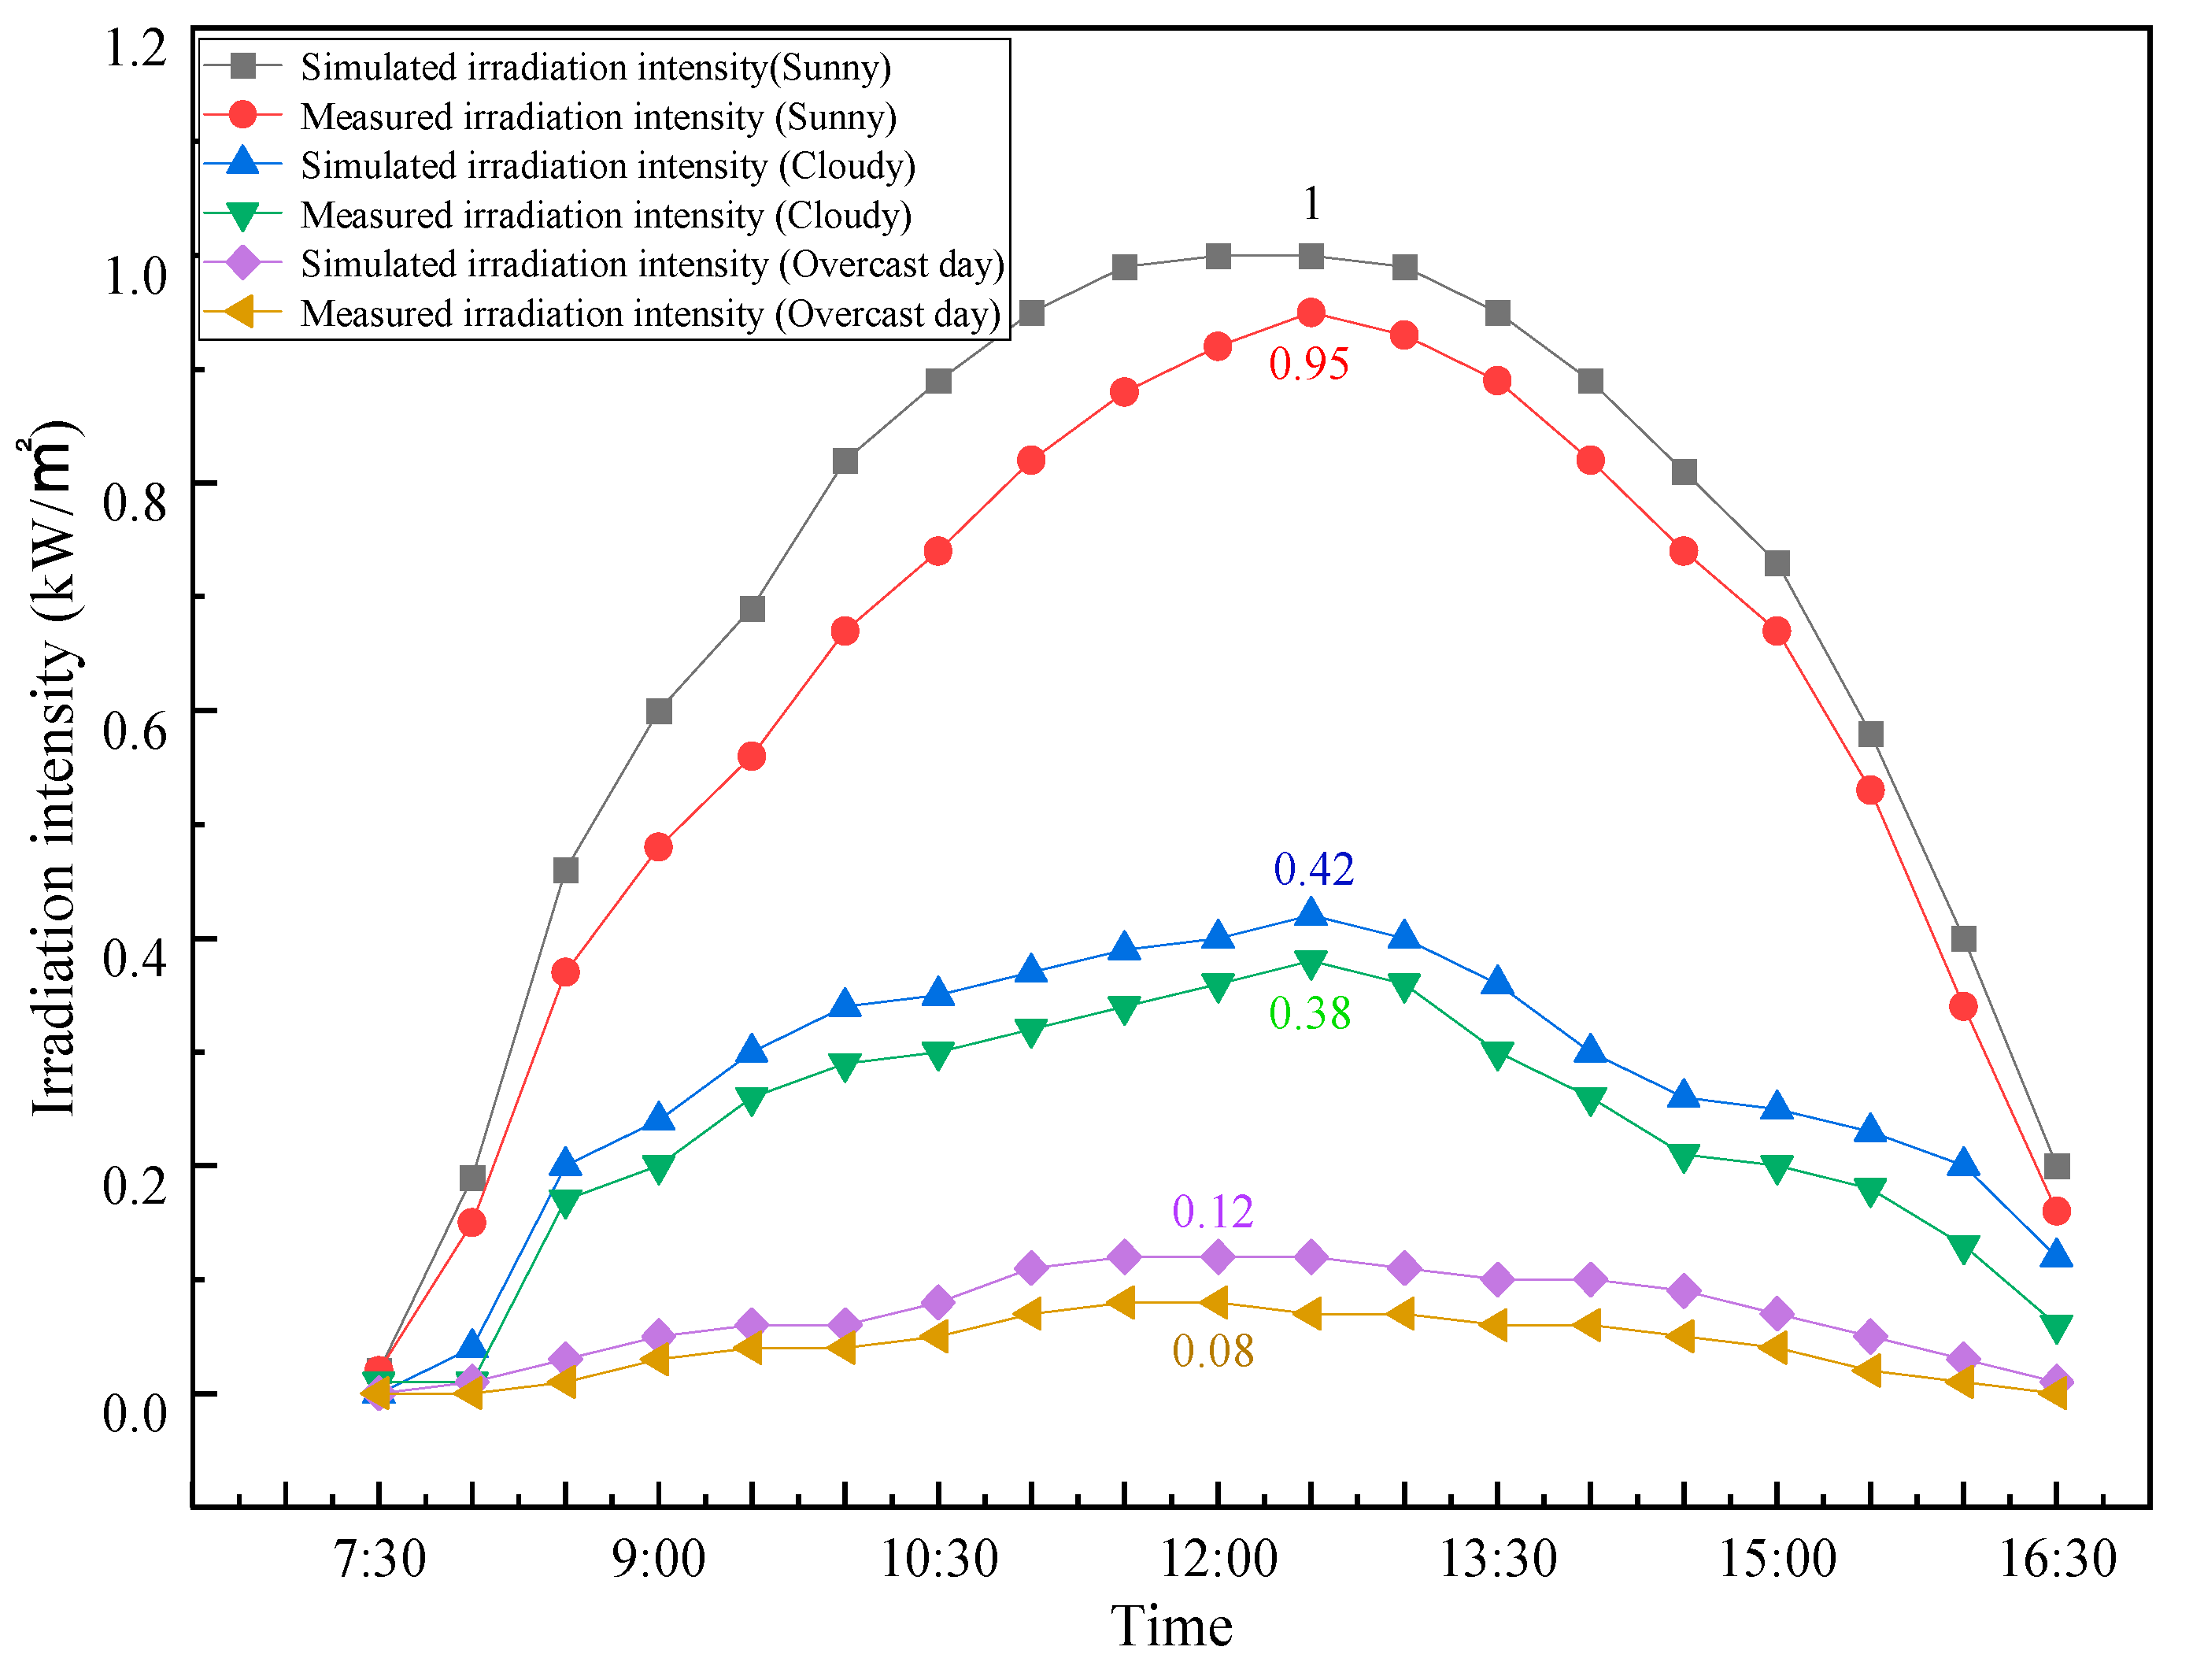
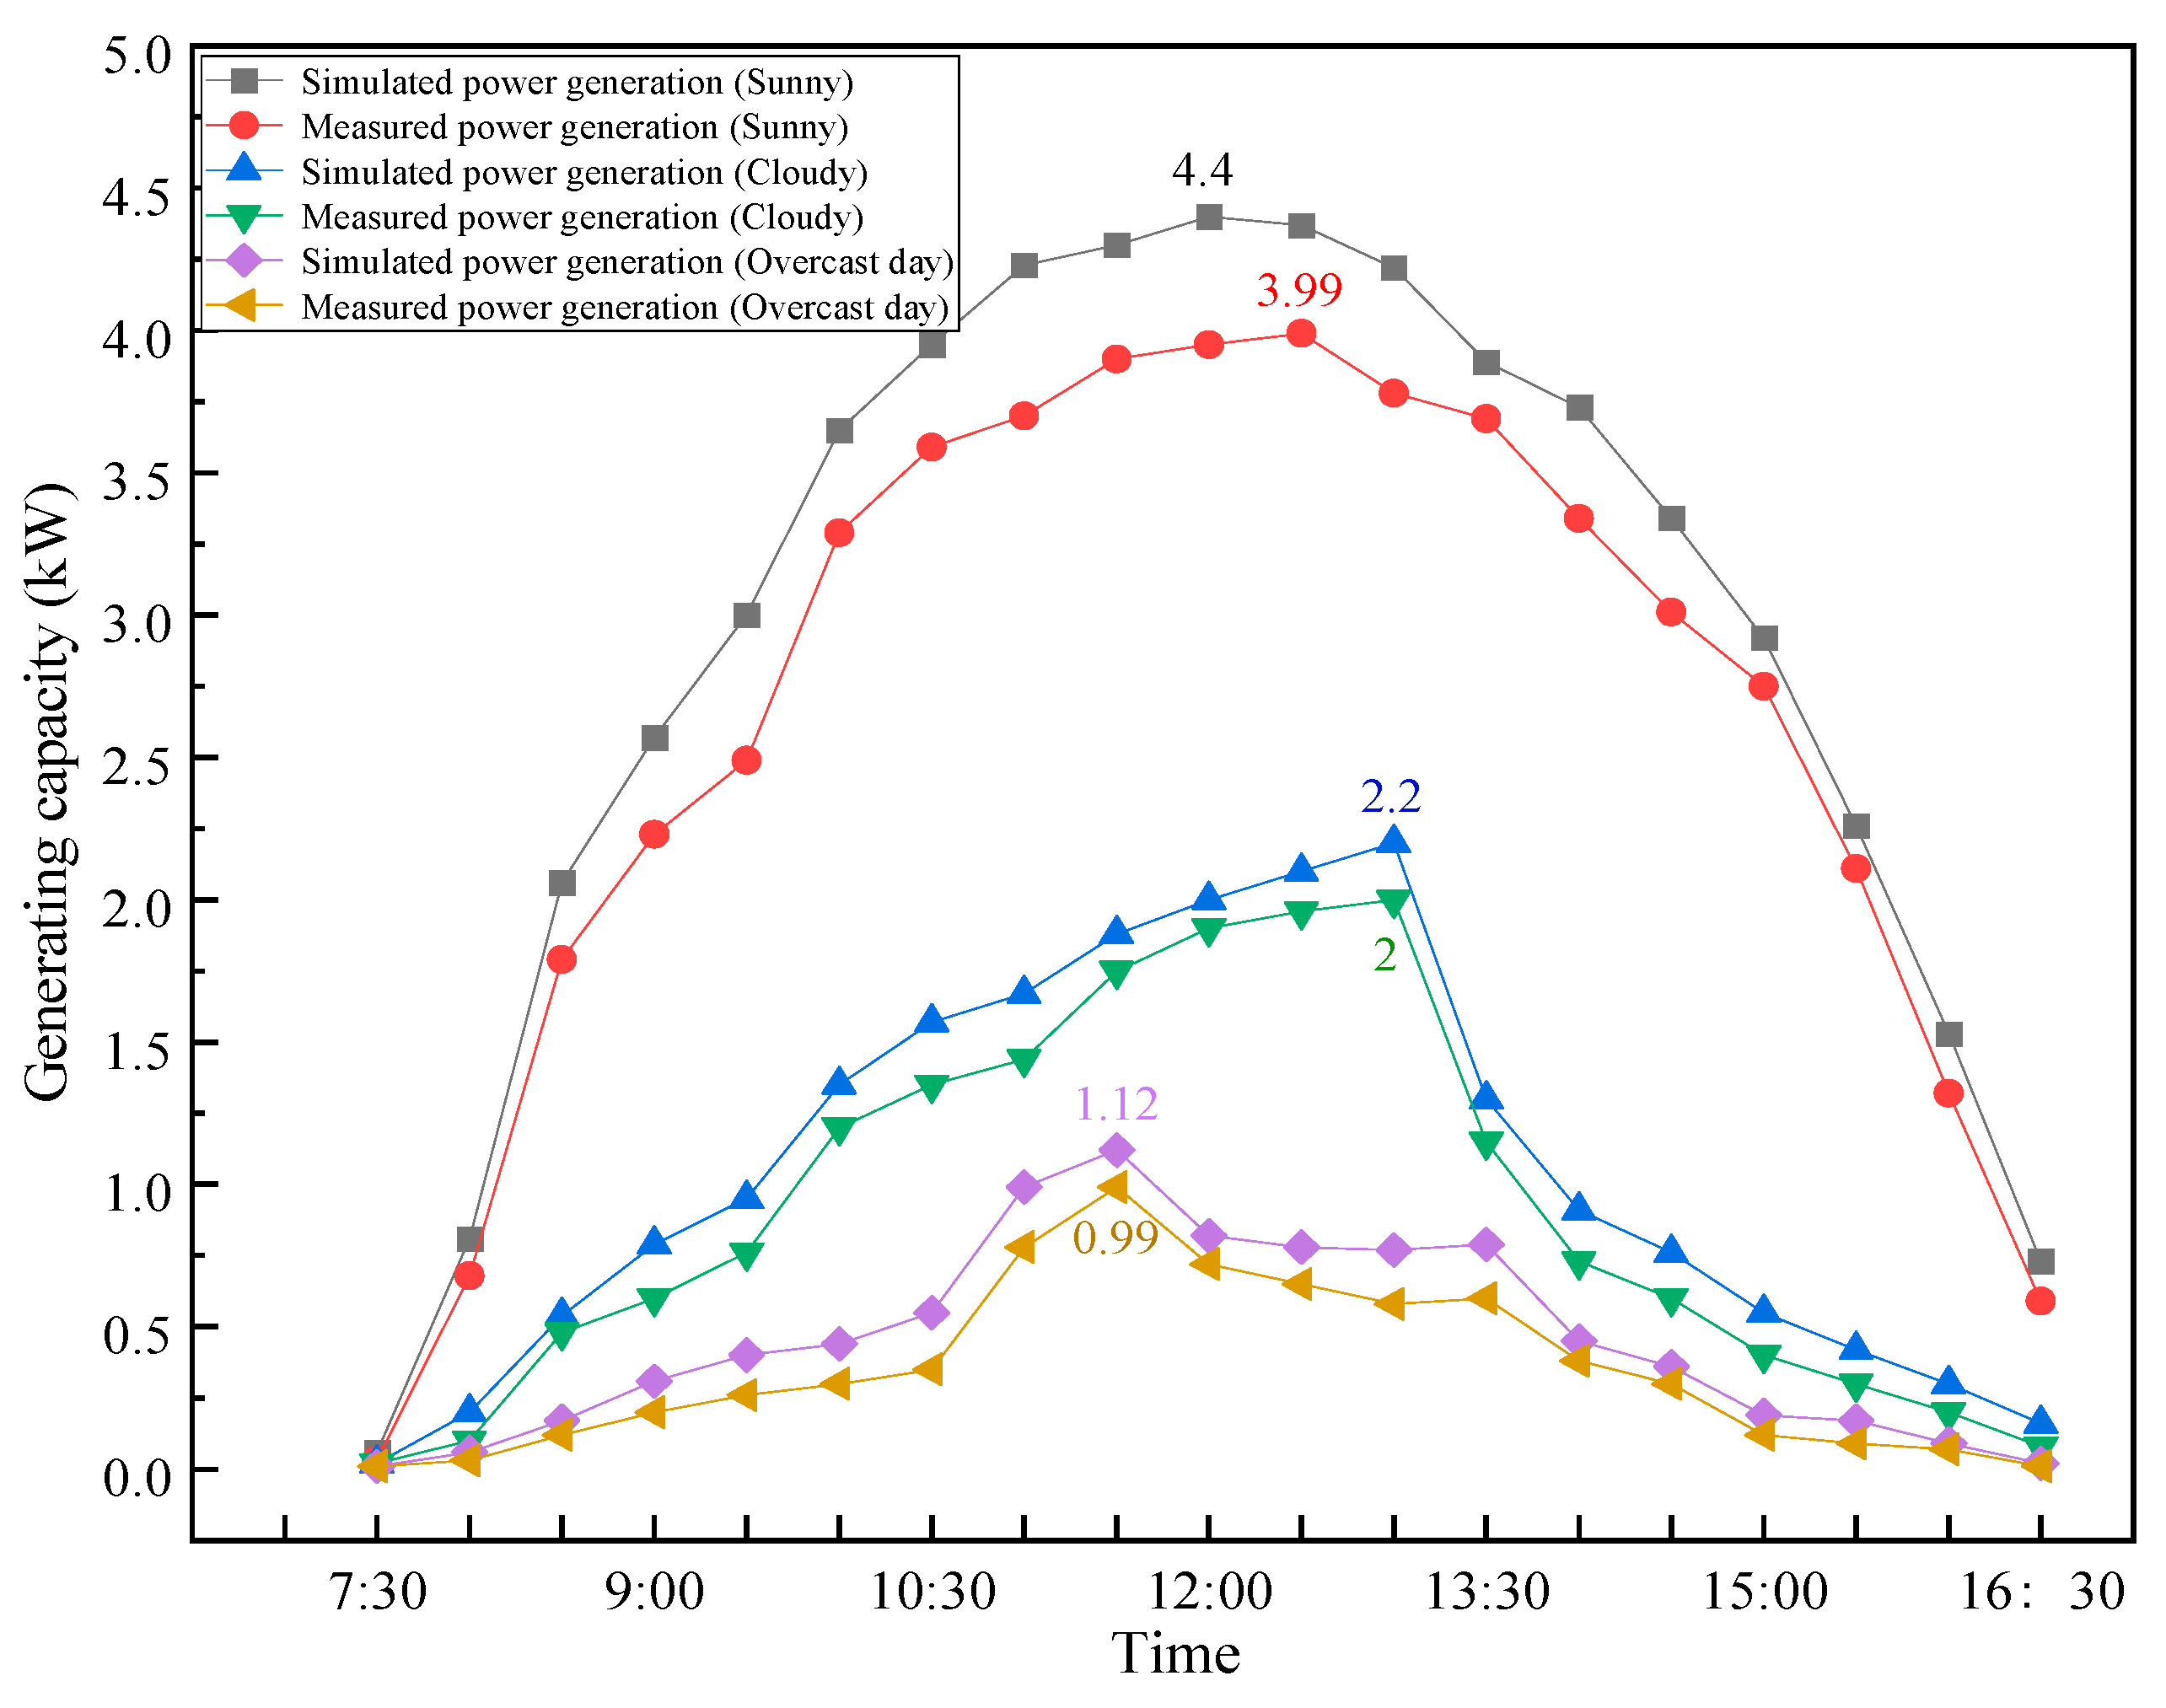
6.1. Power Generation and Radiation Intensity

The monthly power generation and monthly radiation intensity on the photovoltaic surface simulated by the system are shown in Figure 19 and Figure 20, respectively. The highest monthly power generation was 721.08 kWh in February, while the lowest was 408.65 kWh in July. The maximum monthly radiation intensity on the photovoltaic slope was 165.87 kW/m2 in March, and the minimum was 121.52 kW/m2 in July. The annual power generation of the system was 6614.6 kWh, of which the power generation in the heating season was 3293.42 kWh.
The simulated and measured outdoor radiation intensity and power generation in the heating season were compared, as shown in Figure 21 and Figure 22, respectively, and the test time was from 7:30–16:30. The simulated values of radiation intensity and power generation were higher than the measured values, but the change trend was consistent, and they had a high degree of fitting. The differences between the simulated and measured values were mainly due to the weather software used in the simulation; the output is the meteorological conditions of typical weather, and there was a certain error with the real-time meteorological conditions. The maximum error between the measured and simulated solar radiation intensity was 7.31%. The maximum error between the measured and simulated photovoltaic power generation was 7.48%.

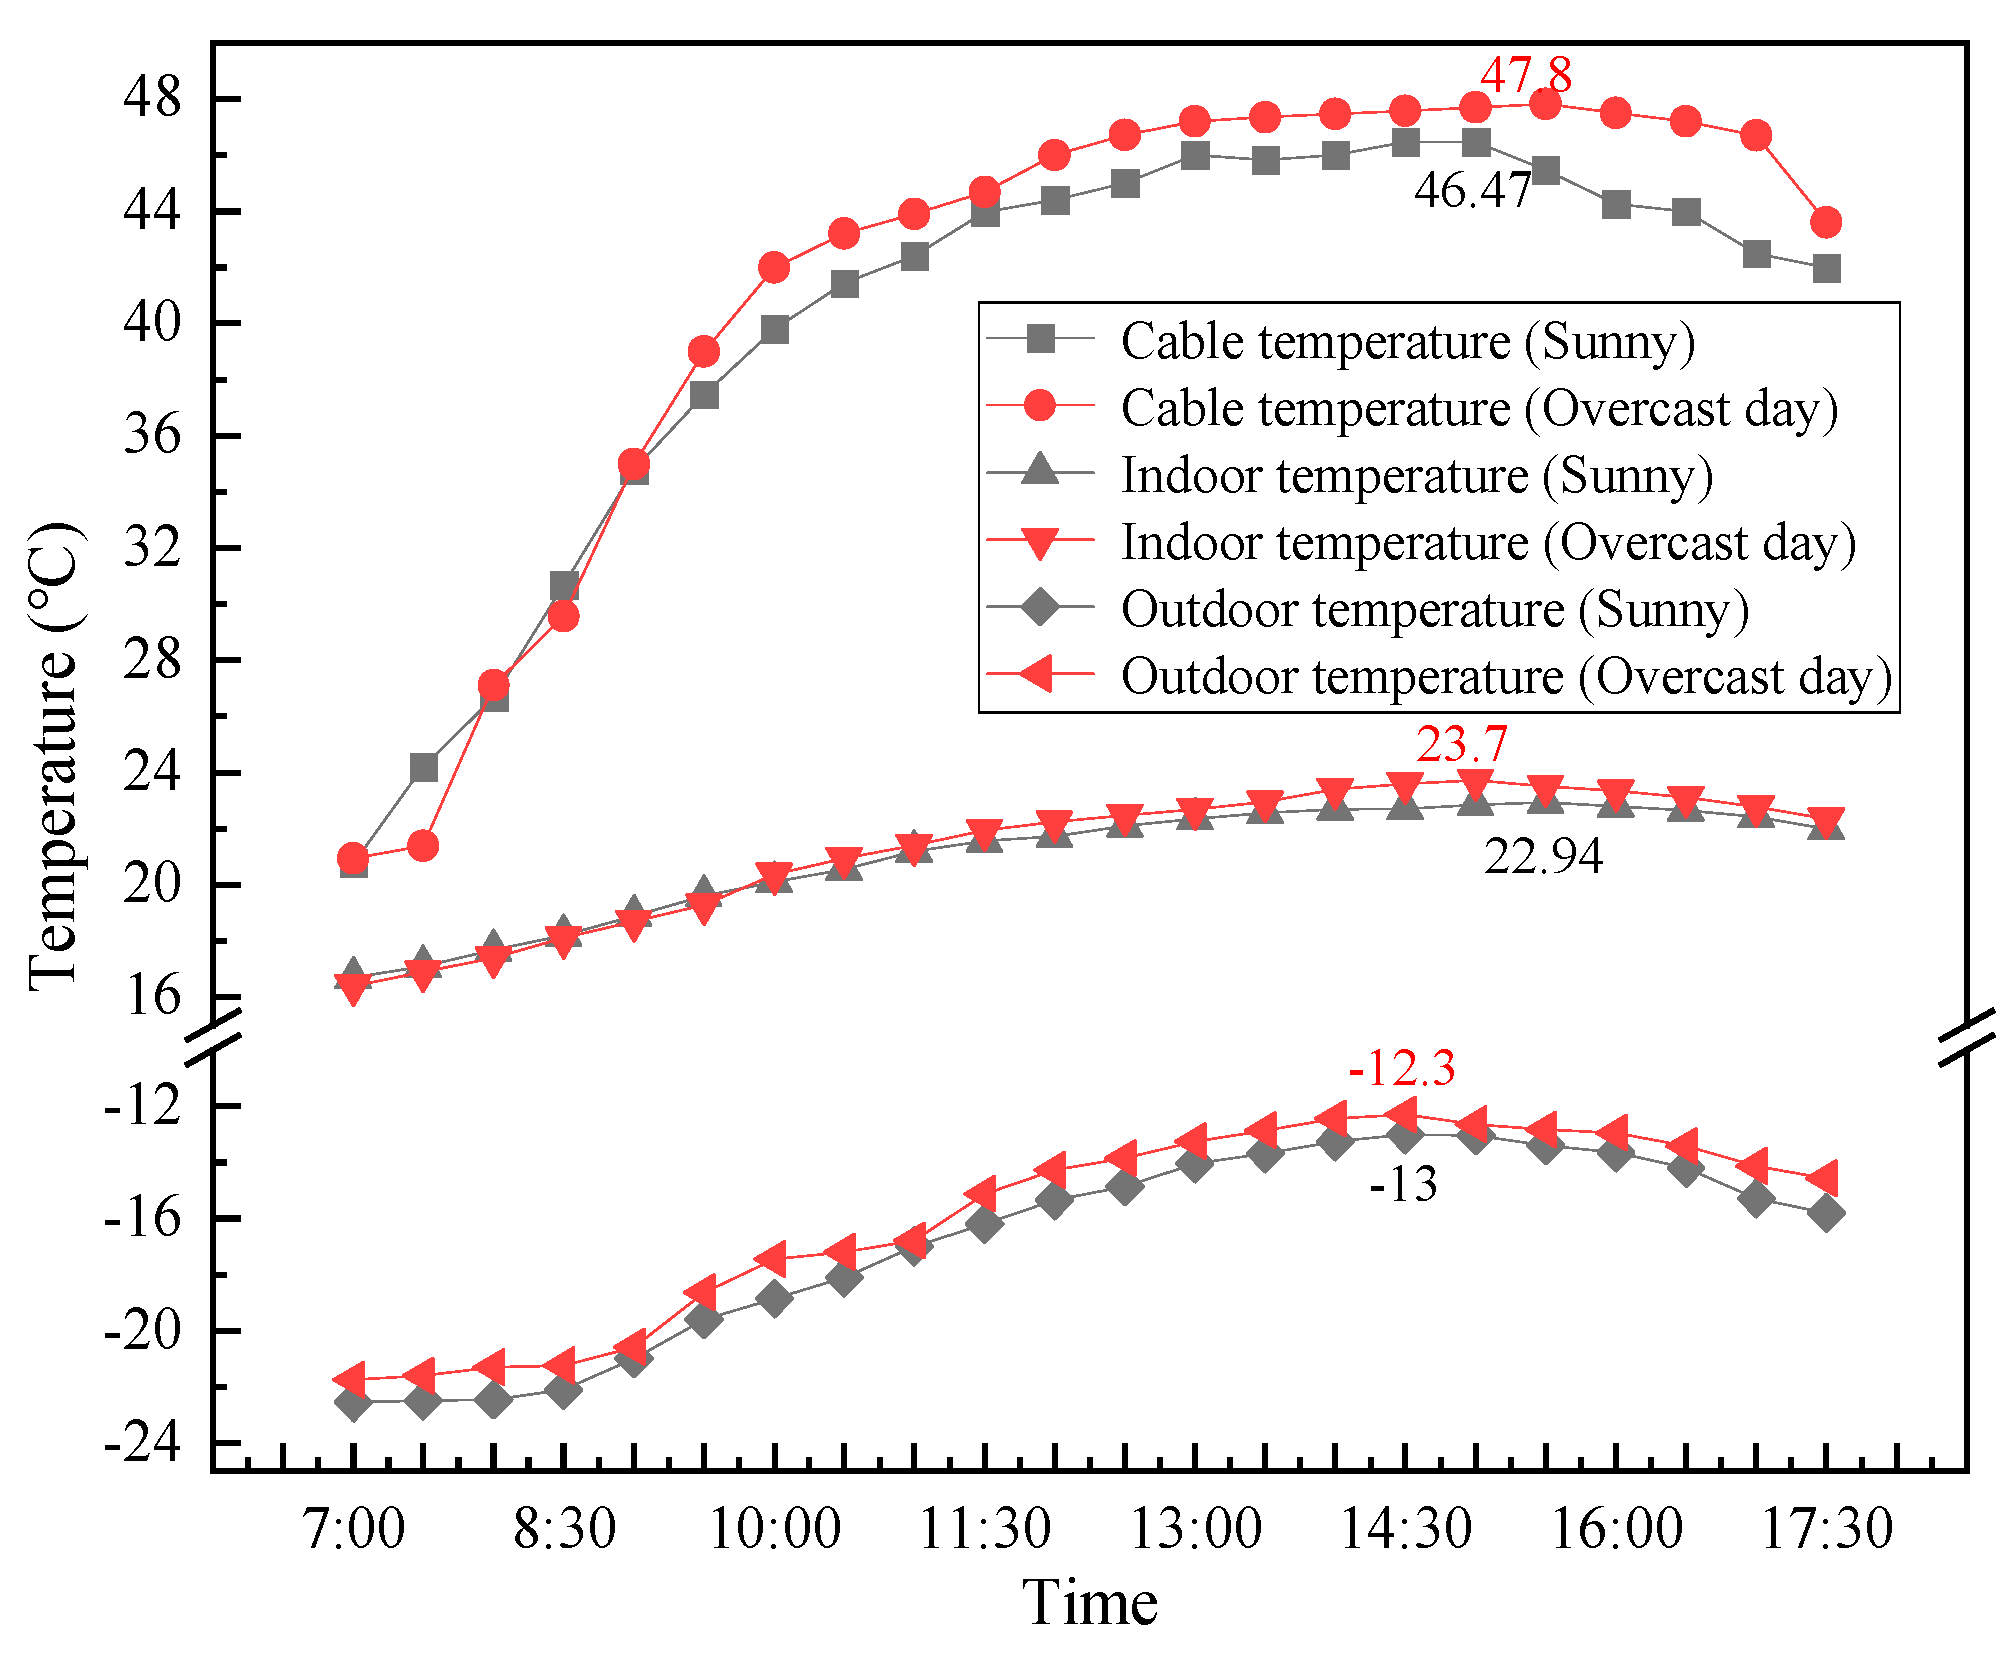
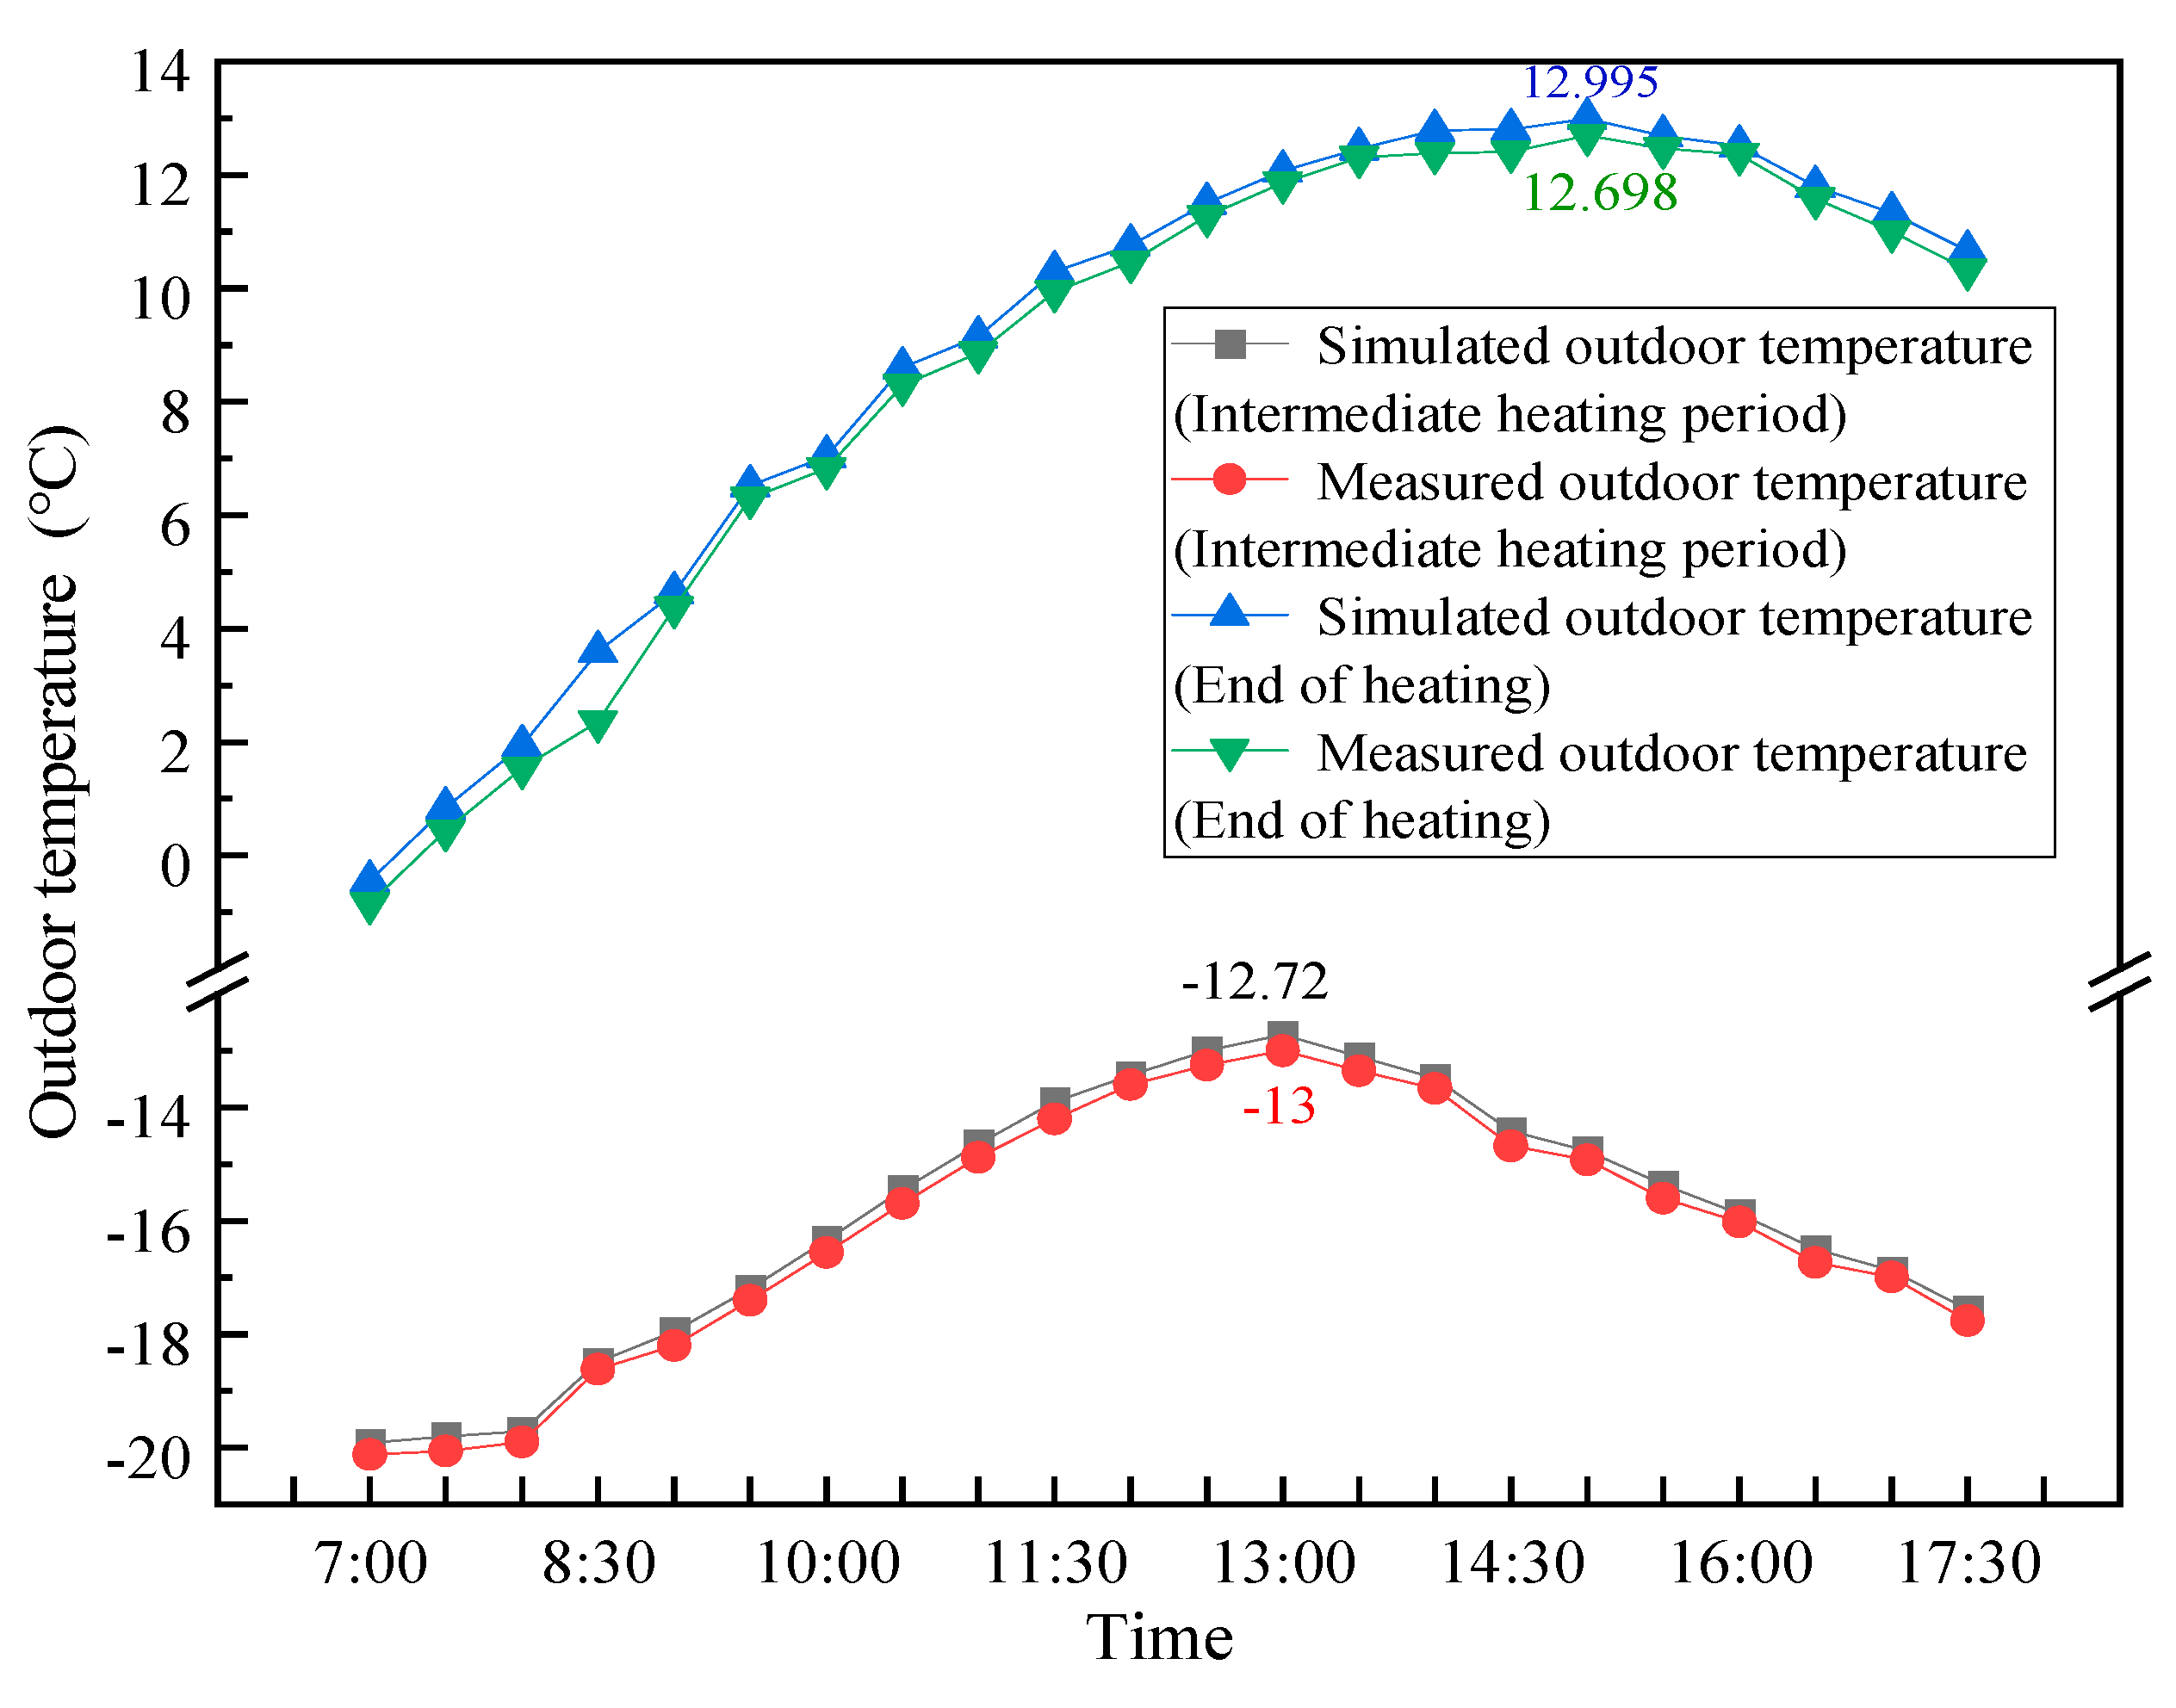
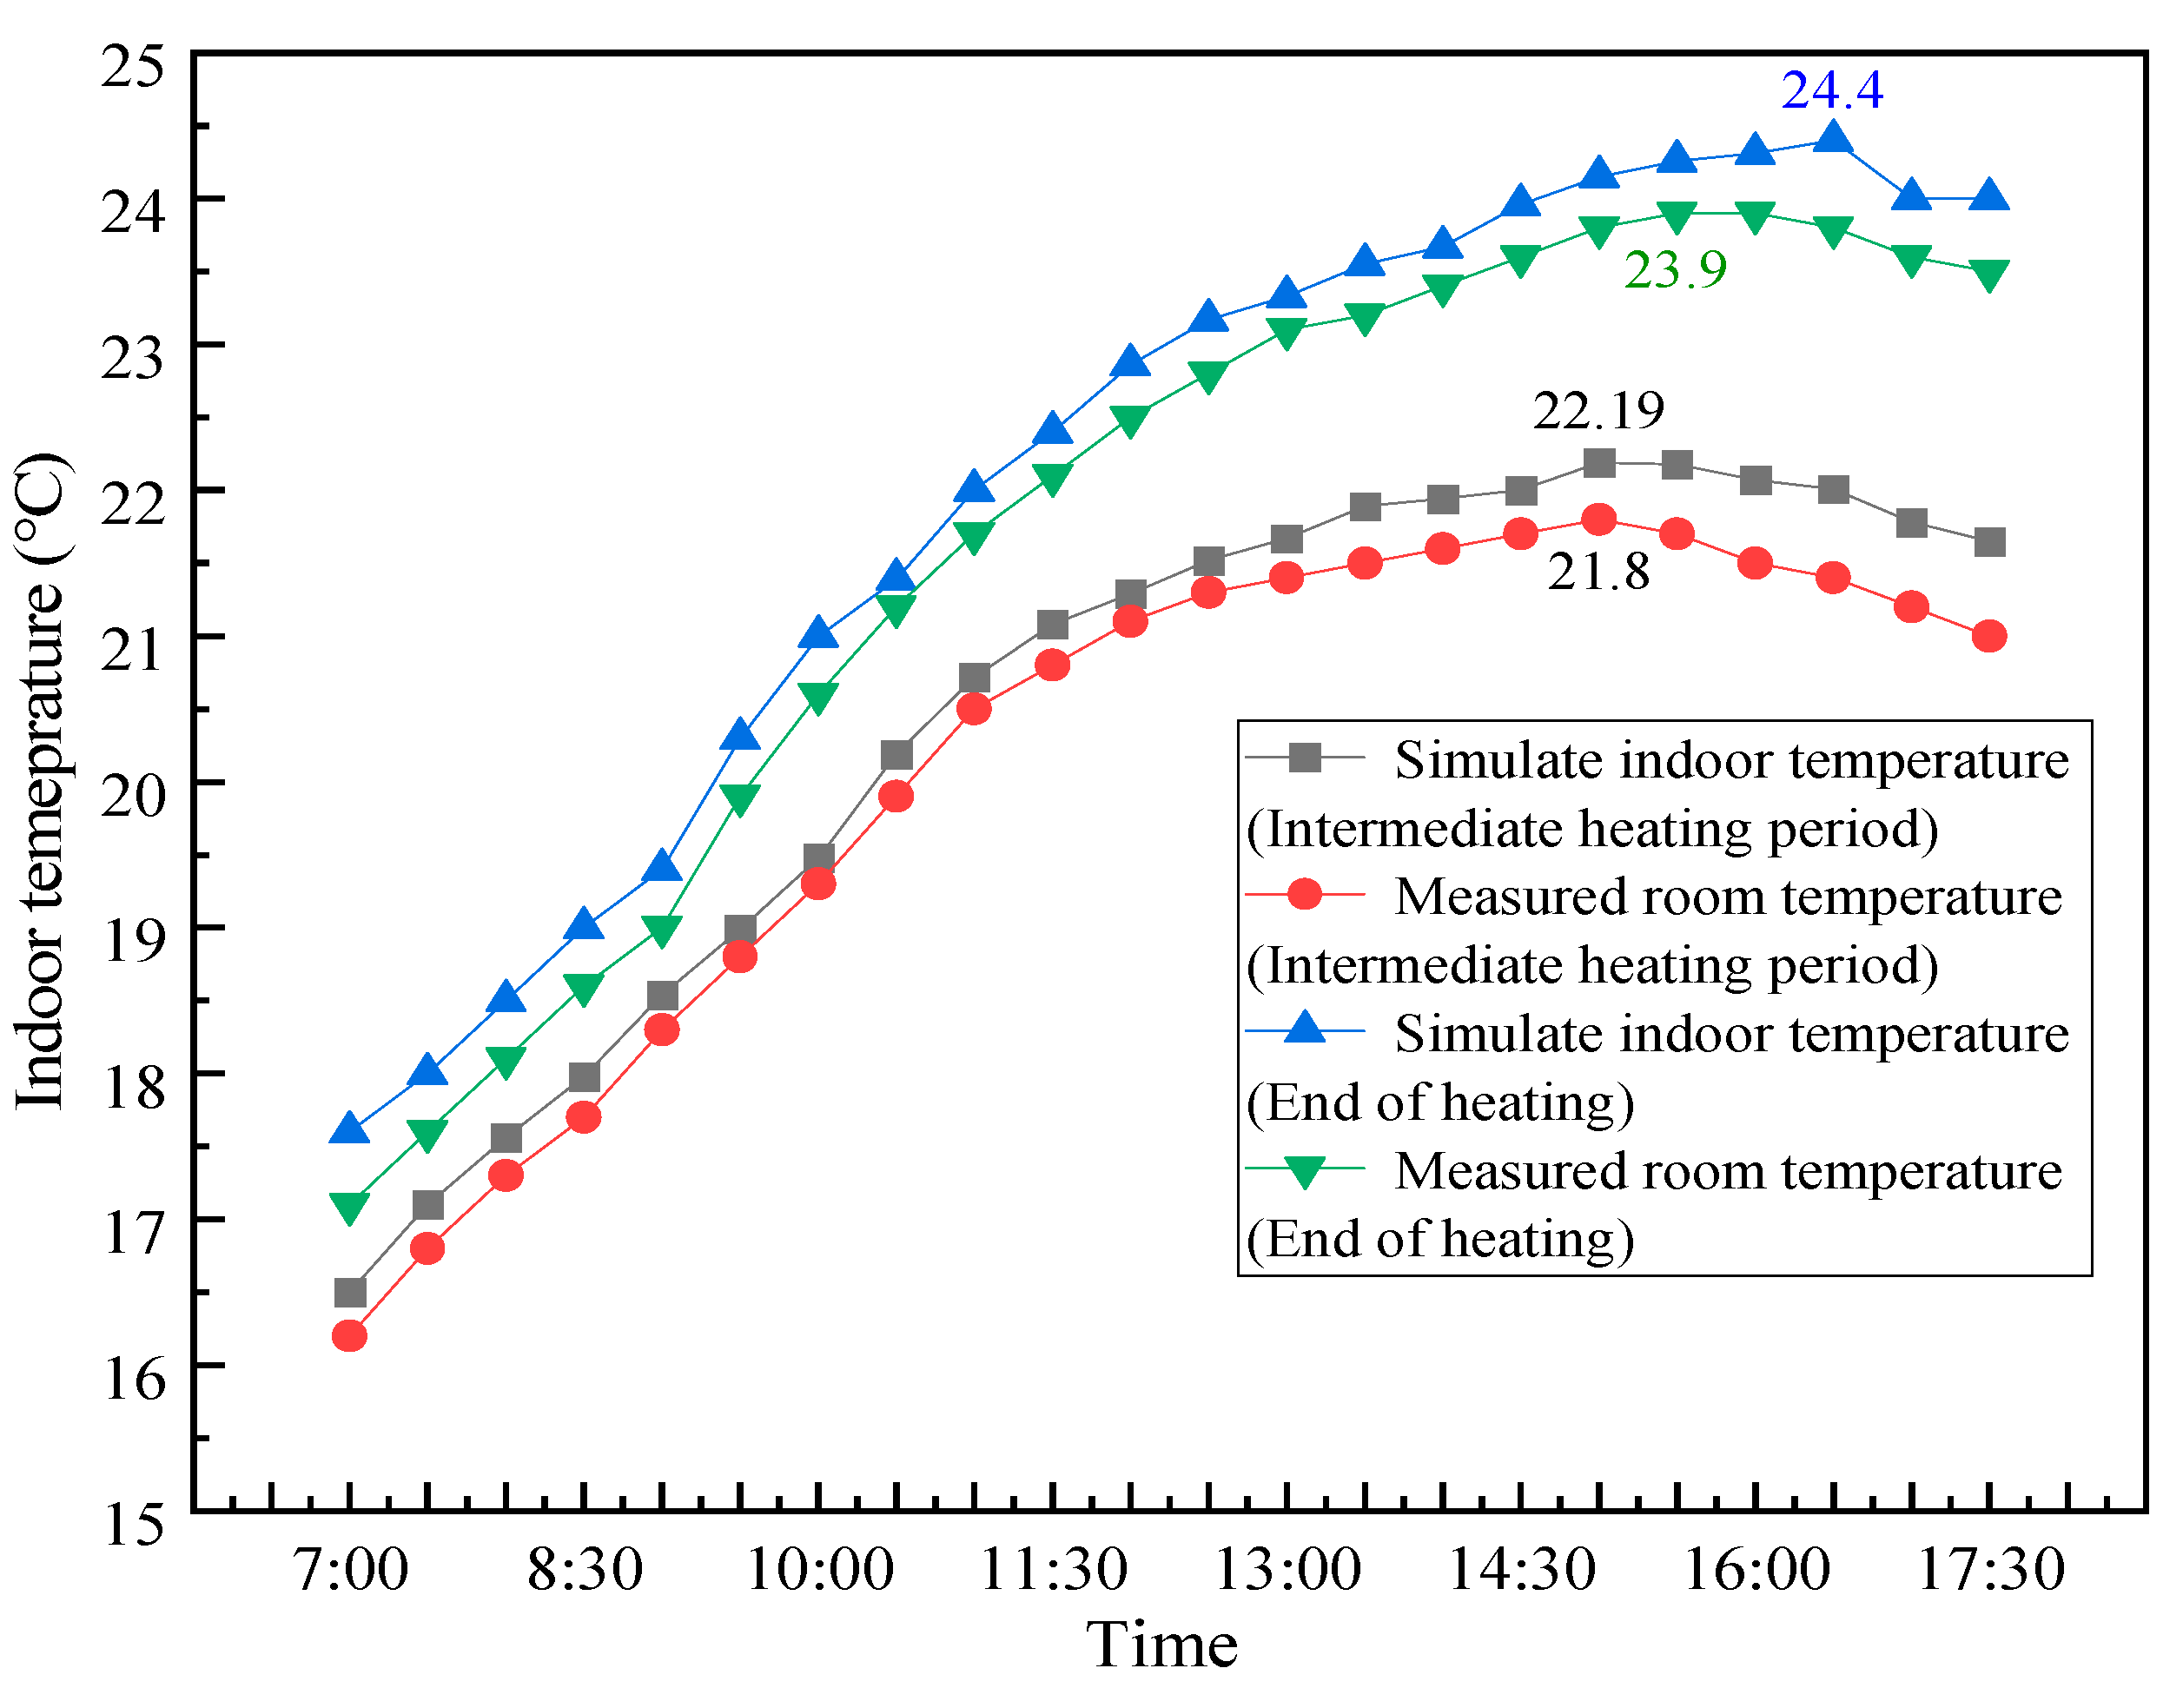
6.2. Comparative Analysis of Temperature

The outdoor temperature of the system was simulated and analyzed in the middle and end of the heating period. As shown in Figure 23, although the simulated outdoor temperature was higher than the measured outdoor temperature, the temperature change curve was fully fitted, and the average outdoor temperature error of a typical day in the middle of the heating period was only 1.36%, while the average outdoor temperature error of a typical day at the end of heating period was only 3.84%.
Figure 24 shows the indoor temperature changes with the two kinds of heating cables in the middle and late stages of the heating period, and the indoor temperature change curves were generally fitted. The relative error between the measured room temperature and the simulated room temperature of the AC/DC composite heating cable model was the largest, i.e., 2.58%. The relative error between the measured room temperature and the simulated room temperature under the AC/DC switching heating cable mode at the end of the heating period was the largest, at 1.75%.

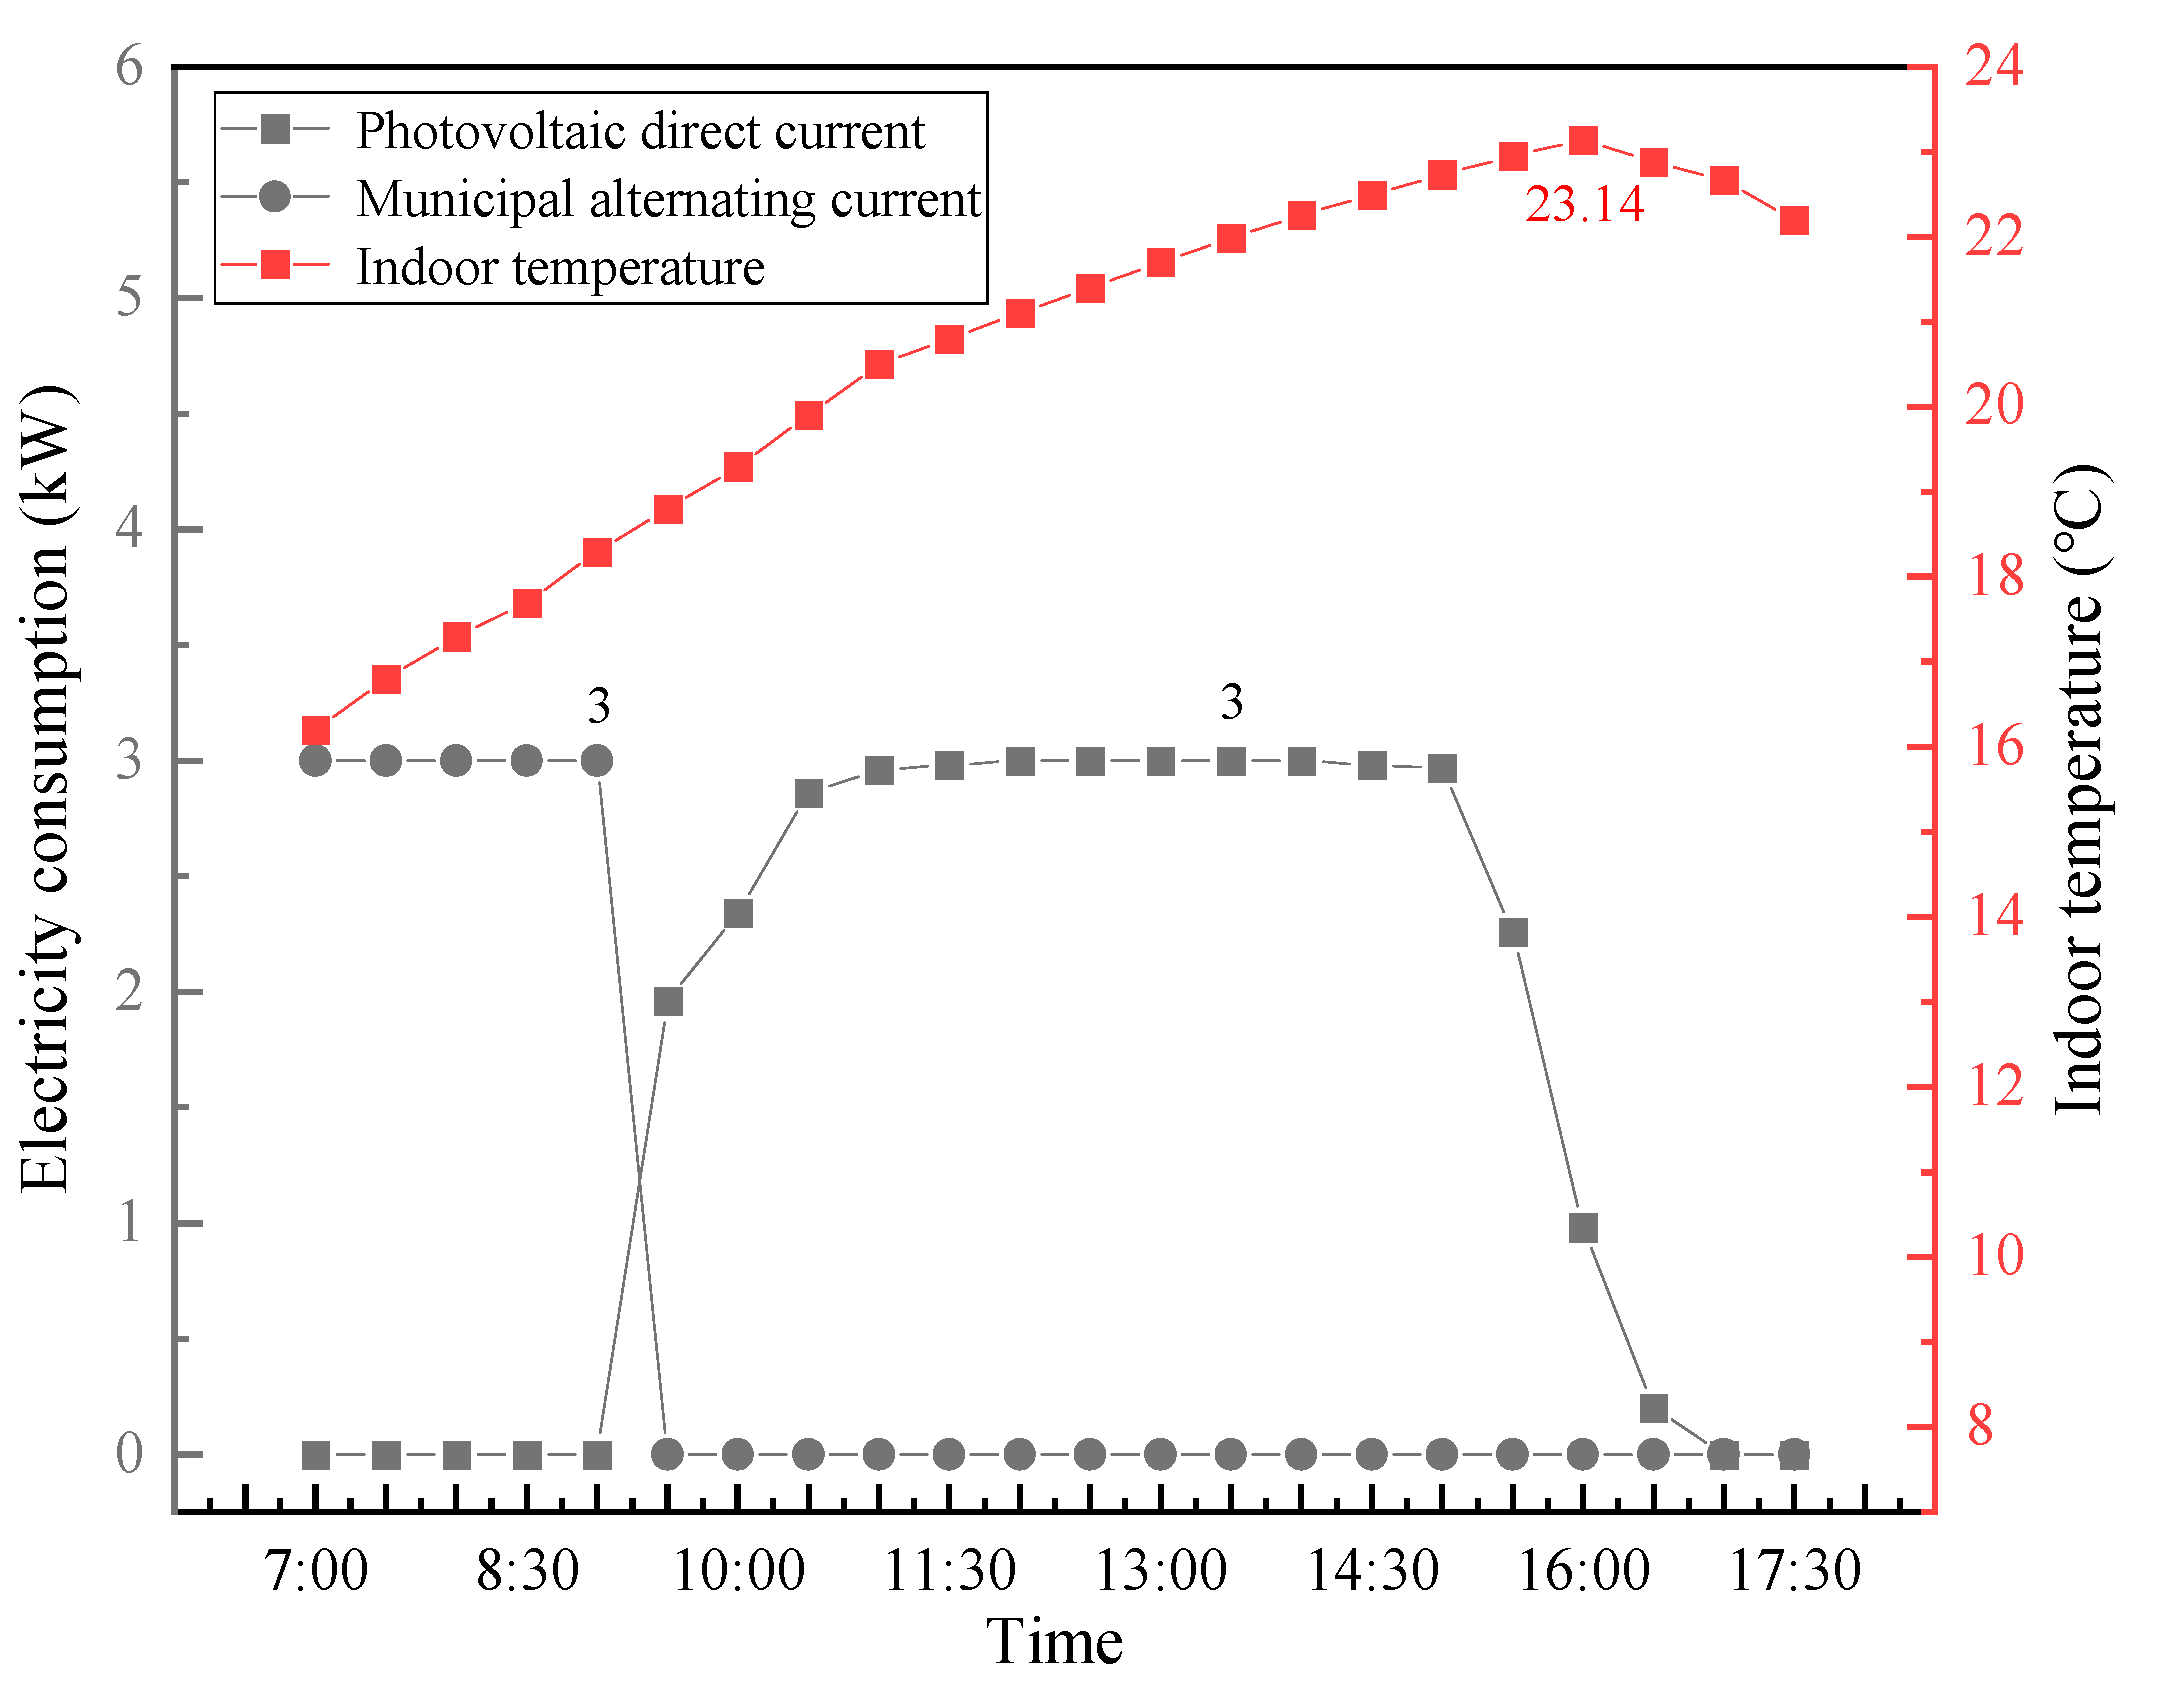
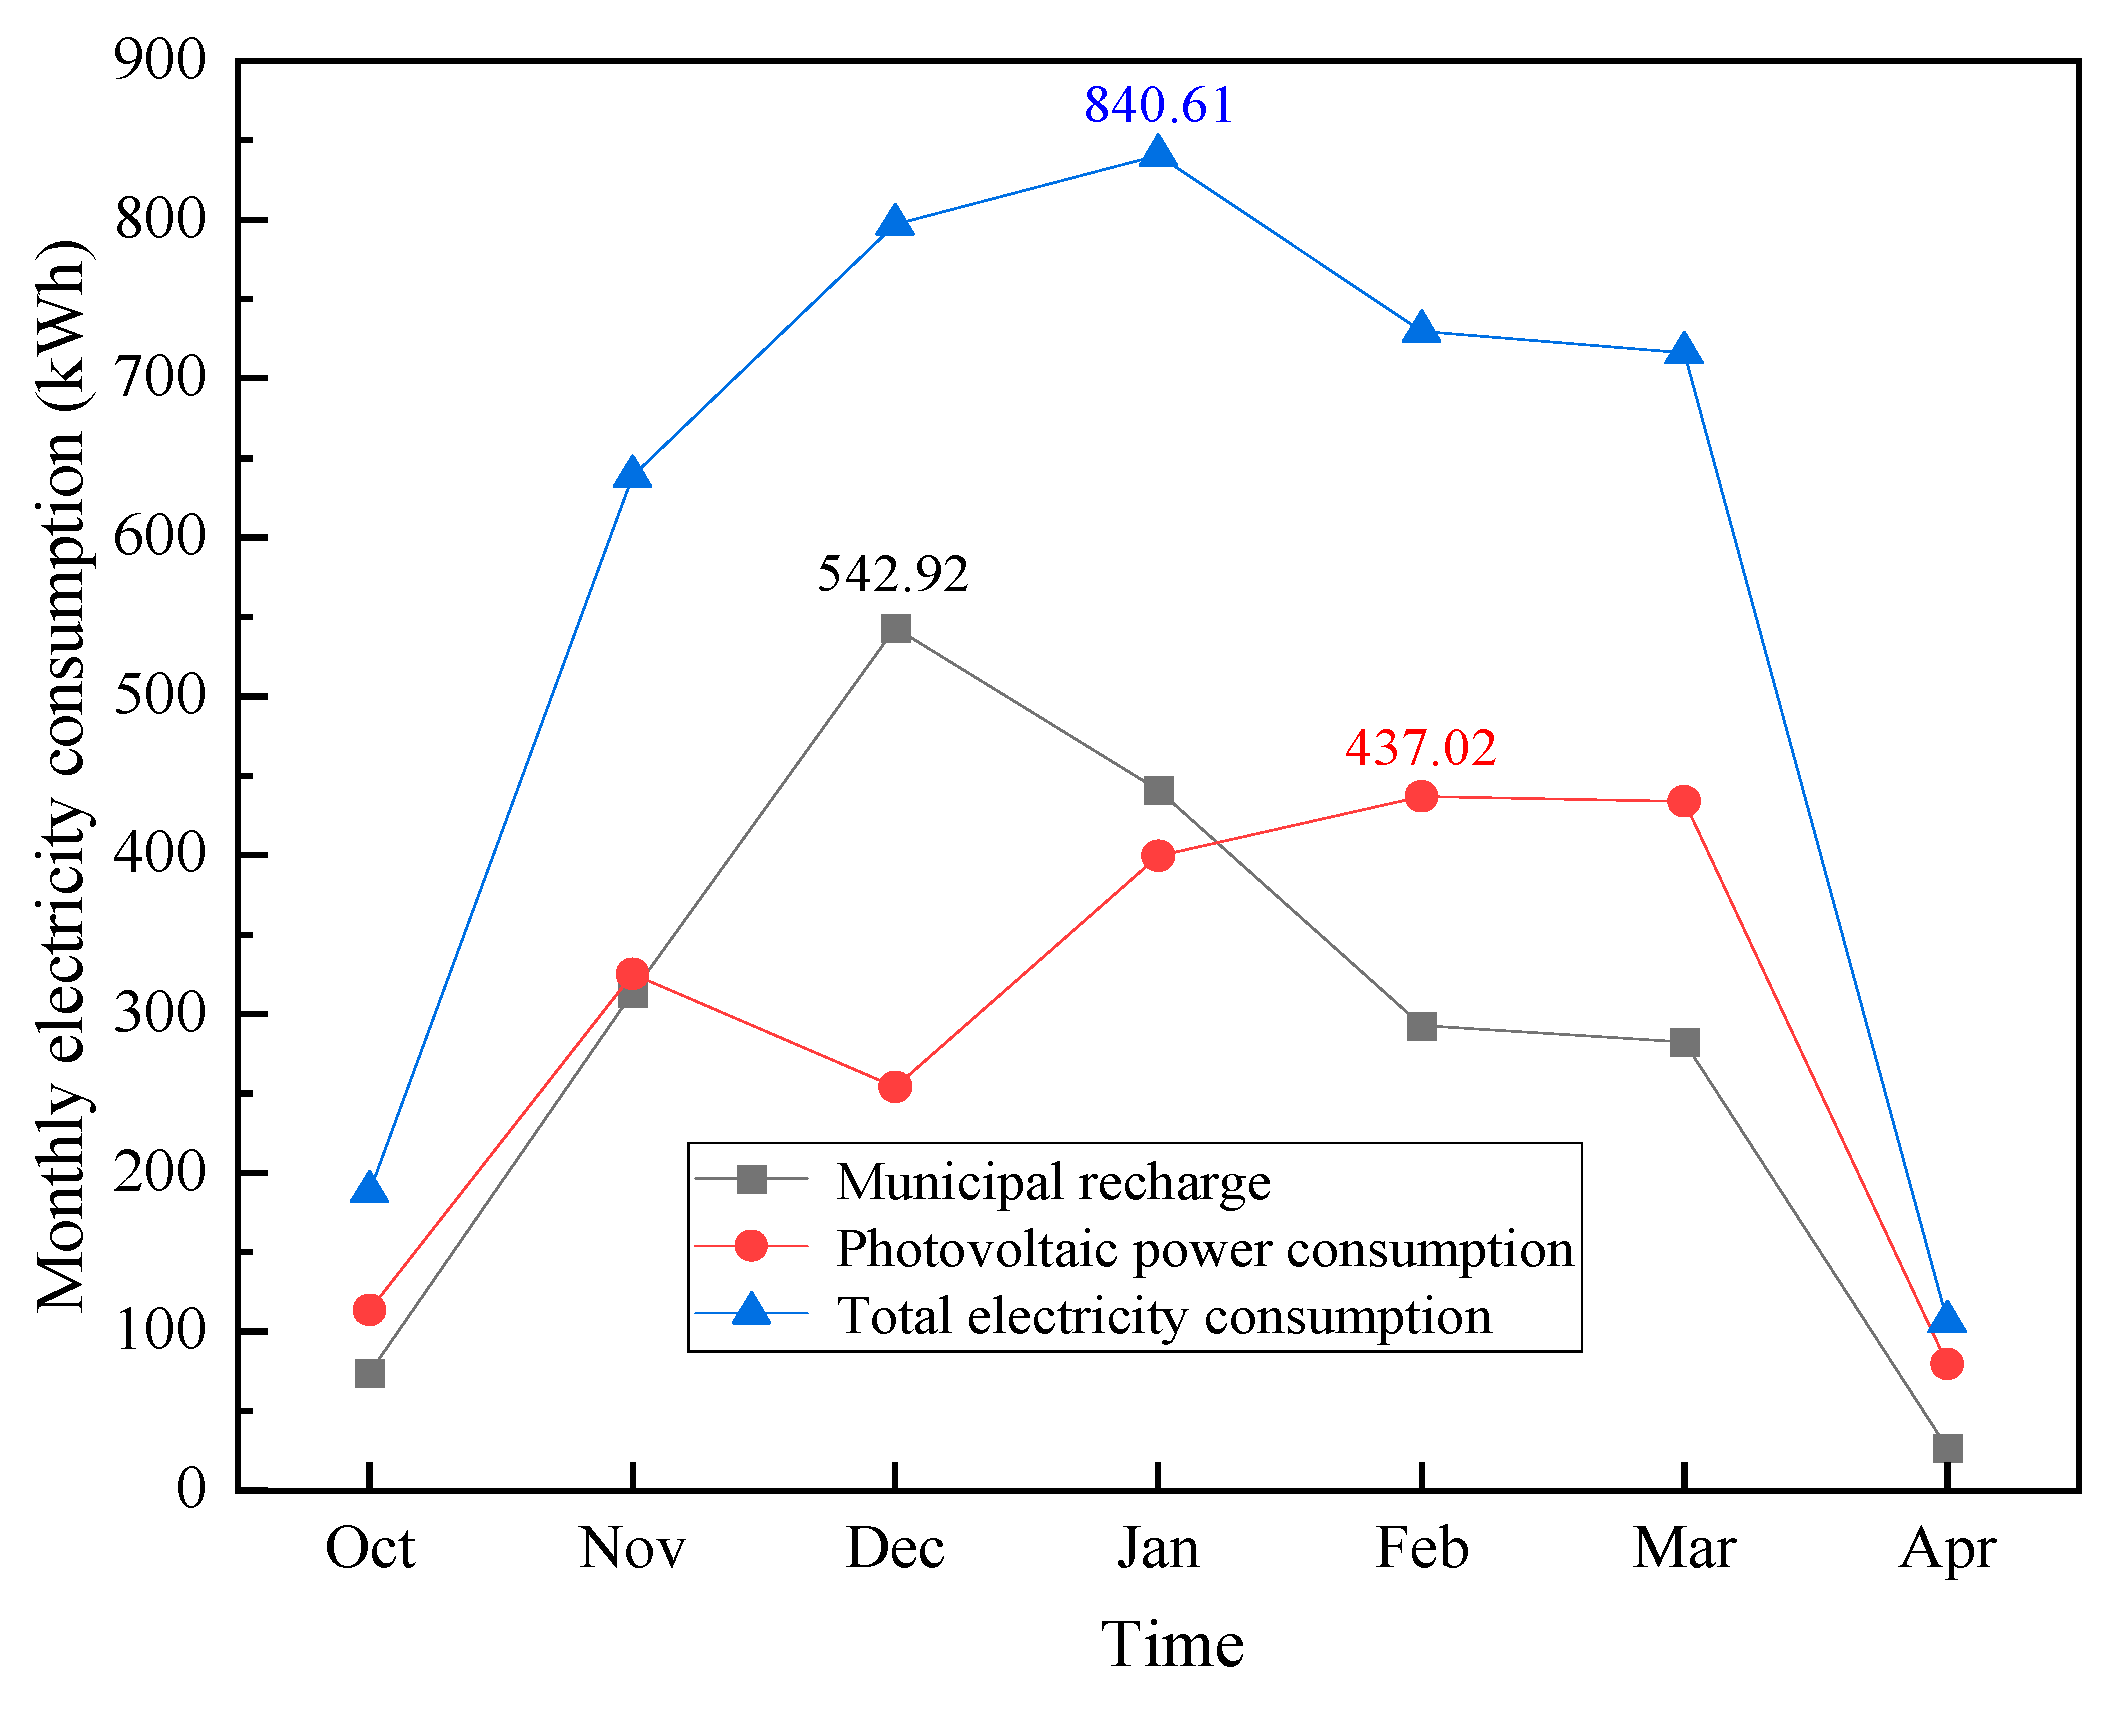
6.3. Electricity Consumption Analysis

Figure 25 and Figure 26 show the simulated electricity consumption of the switching and synthetic heating cable methods, respectively, during the heating period on a typical day. The AC power consumption was high under the AC/DC switching heating cable mode, and 3 kW of constant power was used to recharge it; under the AC/DC synthetic heating cable mode, the use of direct current was insufficient and had to be supplemented. At the end of the heating period, due to the increase in outdoor ambient temperature, only the photovoltaic direct-current heating ensured that the room temperature was maintained, so the DC electricity used under the two heating modes was the same, depending on the DC electricity generated by the photovoltaic panel on the day.
The monthly electricity consumption of the switching and synthetic heating cable mode is shown in Figure 27 and Figure 28, respectively. The AC/DC switching heating cable mode and the AC/DC synthetic heating cable mode both had the highest recharge in December, with values of 542.92 kWh and 334.11 kWh, respectively, and they both had the least recharge in April (the last month of heating), with values of 26.69 kWh and 12.47 kWh, respectively. The total electricity consumption of the two heating modes in the heating period did not differ much, as shown in Table 5.

7. Comparison of Test Results

As shown in Figure 29, under the two heating cable modes, the average indoor temperature of the AC/DC synthetic heating cable mode was 2.91% higher than that of the AC/DC switching heating cable mode. Under the same all-day irradiation intensity and total power generation, the utilization rate of direct current generated by the photovoltaic panels was high, the DC power of the AC/DC synthetic heating cable was 8.75% higher, and the AC power consumption was 26.67% lower than that of the AC–DC switching heating cable.
As shown in Figure 30, when the two heating cables were heated on overcast days, the indoor temperature under the AC/DC synthetic heating cable mode was 1.38% higher than that under the AC/DC switching heating cable mode, and the DC electricity consumption of the AC/DC synthetic heating cable was 10.9% higher than that of the AC/DC switching heating cable, while the AC power consumption was 4.76% higher than that of the AC/DC switching heating cable.

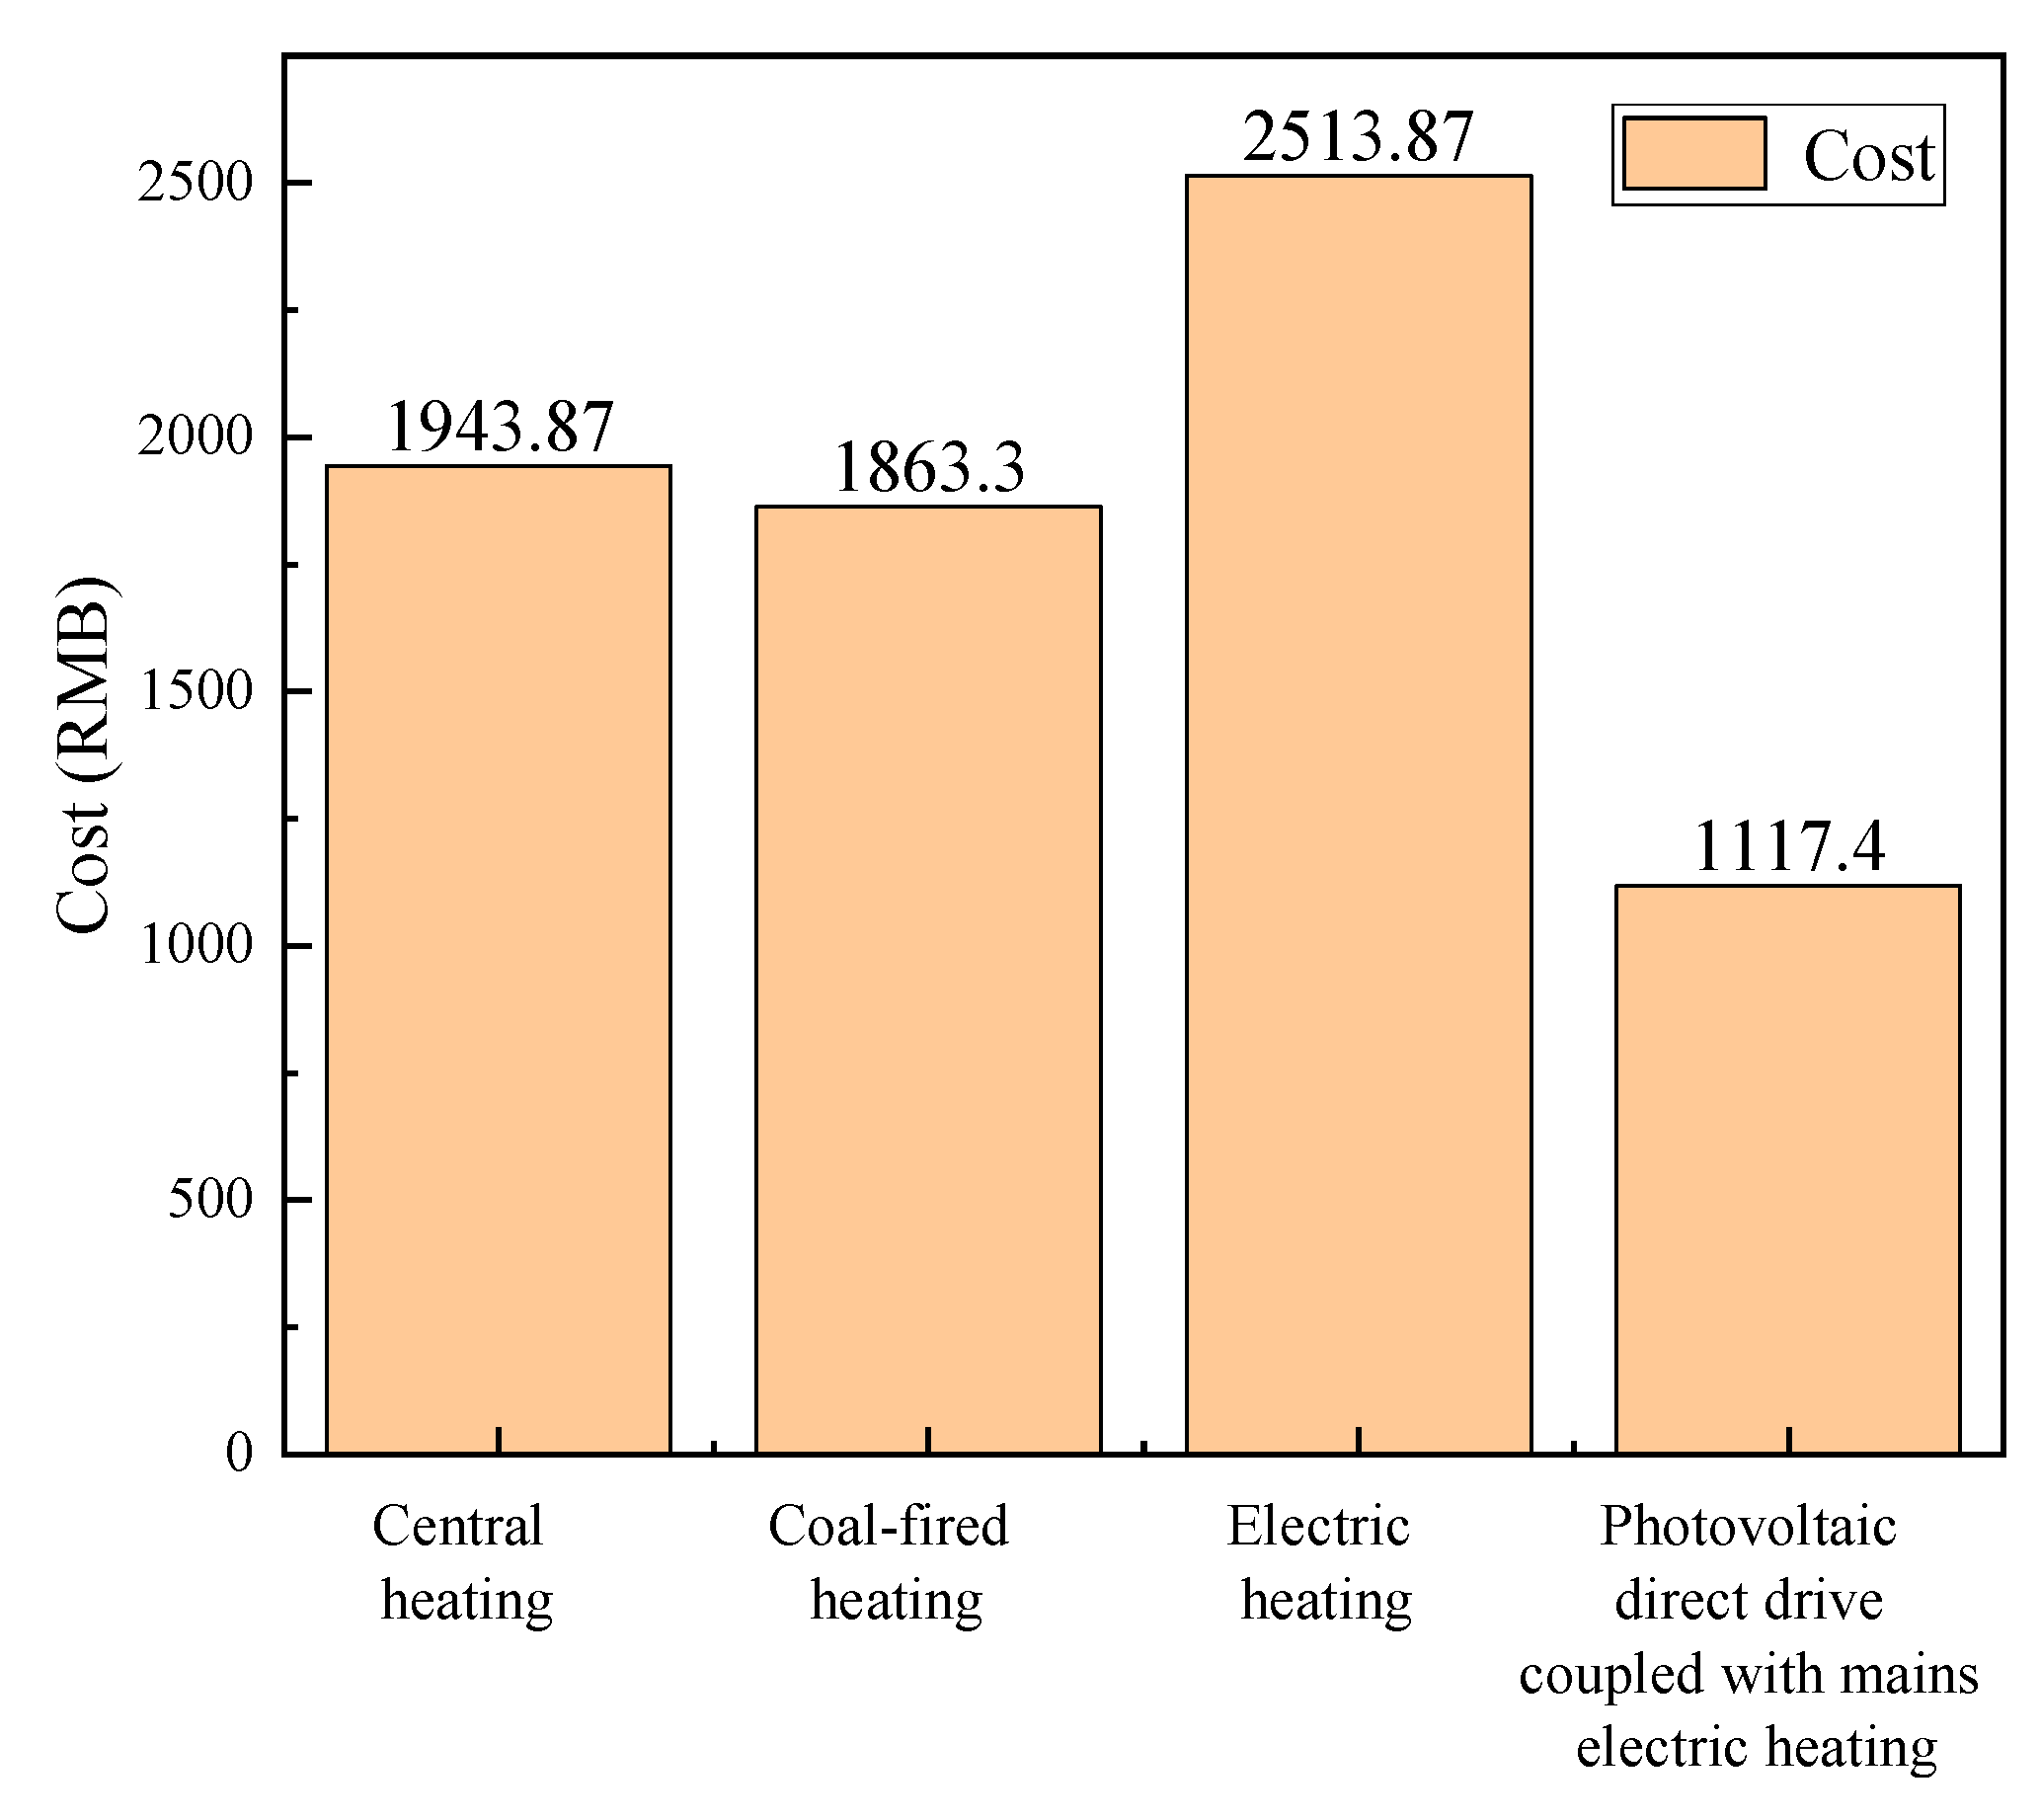
System Economic Performance Analysis

The initial investment in PV direct-drive and mains-coupled electric heating systems includes photovoltaic panels, grid-connected inverters, two heating cables, distribution boxes, and construction and installation costs. The specific costs are shown in Table 6. The initial investment cost of the system was RMB 20380, of which the two heating cables totaled RMB 4800, and the cost of heating cables locally can be calculated as described in [43,44].
As shown in Figure 31, based on a comparison of the economic performance of four heating modes, the power generation of the system during the heating period was all used for heating, and the power generation was connected to the grid in the non-heating season to determine the price. Because the recharge time was mostly at night, more electricity was taken into account when calculating the heating cost. It can be seen that the PV direct-drive and mains-coupled electric heating systems had the best economic performance during the heating period, and their operating cost was the lowest, which was RMB 1117.4.

8. Conclusions

In this study, we took a low-energy building in Changchun, China, as an object to test and study the characteristics of two heating modes (AC/DC switching and AC/DC synthesis), focusing on the comparative analysis of temperature changes, irradiation intensity, power generation, power consumption, and other aspects.
The results show that the change curves of irradiation intensity and photovoltaic power generation were the same. The photoelectric conversion efficiency on sunny, cloudy, and overcast days was 18%, 14.5%, and 12%, respectively. In a test on a typical day in the middle of the heating period, the power consumption of the AC/DC synthetic heating cable mode was slightly higher than that of the AC/DC switching heating cable mode, and the total difference was no more than 2 kWh. The indoor temperature under the AC/DC synthetic heating cable mode was slightly higher, and the difference in the indoor temperature between the two heating modes was no more than 0.5 °C. Under conditions of similar radiation intensity and power generation, the DC power consumption and AC power consumption under the AC/DC synthetic heating cable mode were 1.38% higher, and they were 10.9% higher and 4.76% higher, respectively, than those under the AC/DC switching heating cable mode. TRNSYS software was used to build the system model, and the output of the system was 6614.6 kWh over the whole year, 3293.42 kWh in the heating season, and 3321.18 kWh in the non-heating season. The respective maximum and minimum errors of the radiation intensity in the simulations and experimental tests were 7.31% on cloudy days and 3.8% on sunny days. The maximum and minimum errors of power generation were 7.48% on cloudy days and 3.23% on sunny days, respectively, because solar energy cannot be fully absorbed by photovoltaic panels in experimental tests.
In this study, the heating performances of two cable heating modes in a coupled grid were studied; however, it was found that some problems remain, including the following: the research method is not widely applied, there is a lack of in-depth research, and there is poor adoption in traditional buildings. The renovation of existing buildings still lacks a lot of research, so it is necessary to study the laws of traditional architecture so that they can be applied to future architecture. In future work, the photovoltaic panel angle and the building saving-energy technology will be improved by algorithmic models, and the building envelope, the load optimization, and the optimization of the building heating equipment are the key factors to consider in building energy conversation; therefore, this paper can be further studied through these aspects. The test results shown in this paper can provide a basic research foundation for the application of PV direct-drive and mains-coupled electric heating in low-energy buildings in northern China.

Author Contributions

Methodology, Q.Z.; Validation, X.L.; Formal analysis, H.J.; Investigation, X.L.; Resources, J.T.; Data curation, S.G.; Writing—original draft, X.L.; Writing—review & editing, Wende Wu; Visualization, S.G.; Project administration, S.M. All authors have read and agreed to the published version of the manuscript.

Funding

This work was supported by the 13th Five-Year Science and Technology Project of Jilin Provincial Department of Education (No. JJKH20200624KJ) and by the Science and Technology Development Plan Project of Jilin Province (No. 20230402065GH).

Data Availability Statement

The original contributions presented in the study are included in the article, further inquiries can be directed to the corresponding author.

Conflicts of Interest

The authors declare no conflict of interest.

References

  1. Zhang, C.; Xie, Y.; Zhang, H.; Gu, Y.; Zhang, X. Optimal design and performance assessment for a solar powered electricity, heating and hydrogen integrated energy system. Energy 2023, 262, 125453. [Google Scholar]
  2. Rao, C.; Zhang, Y.; Wen, J.; Xiao, X.; Goh, M. Energy demand forecasting in China: A support vector regression-compositional data second exponential smoothing model. Energy 2023, 263, 125955. [Google Scholar] [CrossRef]
  3. Peng, Z.; Cheng, Y.; Jiang, M.; Shu, S.; Geng, X. Potential combination strategies to establish a low-energy ventilation system for school buildings in the cold climate zone of China-a demand-oriented review. J. Build. Eng. 2023, 76, 107065. [Google Scholar] [CrossRef]
  4. Zhu, Y.; Wu, S.; Li, J.; Jia, Q.; Zhang, T.; Zhang, X.; Han, D.; Tan, Y. Towards a carbon-neutral community: Integrated renewable energy systems (IRES)–sources, storage, optimization, challenges, strategies and opportunities. J. Energy Storage 2024, 83, 110663. [Google Scholar] [CrossRef]
  5. bp Energy Outlook 2023 Edition. 2023. Available online: https://www.bp.com/content/dam/bp/business-sites/en/global/corporate/pdfs/energy-economics/energy-outlook/bp-energy-outlook-2023.pdf (accessed on 14 March 2024).
  6. Xinhua Net. Available online: http://www.news.cn/energy/20240322/f518f02a55394a8086fa3739a5be3640/c.html (accessed on 14 March 2024).
  7. Special Committee on Building Energy Consumption and Carbon Emission Data of China Building Energy Efficiency Association. 2023 China Building Energy Consumption and Carbon Emission Research Report; Chongqing University: Chongqing, China, 2023. [Google Scholar]
  8. Center for Environmental and Economic Policy Research, Ministry of Ecology and Environment. China’s Carbon Peak Carbon Neutral Policy and Action; Center for Environmental and Economic Policy Research, Ministry of Ecology and Environment: Beijing, China, 2023. [Google Scholar]
  9. Zhang, Y. The rapid development of photovoltaic industry calls for rational and differentiated competition. China Bus. J. 2023, B15, 5–29. [Google Scholar]
  10. Hai, T.; He, J. (Eds.) Application of Solar Building Integration Technology (Photovoltaic Part); Science Press: Beijing, China, 2015; pp. 2–3. [Google Scholar]
  11. Dou, C.; Zuo, C.; Jia, Y.; Jiang, L.; Zheng, L. Analysis on the development potential of distributed photovoltaic power generation on roofs of residential buildings in rural China. Sol. Energy 2023, 1, 5–16. [Google Scholar]
  12. Green, M.A.; Zhao, J.; Wang, A.; Wenham, S.R. Progress and outlook for high-efficiency crystalline silicon solar cells. Sol. Energy Mater. Sol. Cells 2001, 65, 9–16. [Google Scholar] [CrossRef]
  13. Alkhalidi, A.; Salameh, T.; Al Makky, A. Experimental investigation thermal and exergy efficiency of photovoltaic/thermal system. Renew. Energy 2024, 222, 119897. [Google Scholar] [CrossRef]
  14. Werner, S. District Heating in Sweden 1948–2000. Fernwarerme Int. 2001, 20, 53–62. [Google Scholar]
  15. Nespoli, L.; Giusti, A.; Vermes, N.; Derboni, M.; Rizzoli, A.E.; Gambardella, L.M.; Medici, V. Distributed demand side management using electric boilers. Comput. Sci. Res. Dev. 2016, 32, 35–47. [Google Scholar] [CrossRef]
  16. Ramadhani, U.H.; Lingfors, D.; Munkhammar, J.; Widén, J. On the properties of residential rooftop azimuth and tilt uncertainties for photovoltaic power generation modeling and hosting capacity analysis. Sol. Energy Adv. 2023, 3, 100036. [Google Scholar] [CrossRef]
  17. Hancevic, P.I.; Nuñez, H.M.; Rosellón, J. Distributed photovoltaic power generation: Possibilities, benefits, and challenges for a widespread application in the Mexican residential sector. Energy Policy 2017, 110, 478–489. [Google Scholar] [CrossRef]
  18. Pearce, J.M. Expanding photovoltaic penetration with residential distributed generation from hybrid solar photovoltaic and combined heat and power systems. Energy 2009, 34, 1947–1954. [Google Scholar] [CrossRef]
  19. Yildiz, B.; Roberts, M.; Bilbao, J.I.; Heslop, S.; Bruce, A.; Dore, J.; MacGill, I.; Egan, R.J.; Sproul, A.B. Assessment of control tools for utilizing excess distributed photovolta. Appl. Energy 2021, 300, 117411. [Google Scholar] [CrossRef]
  20. Wang, J.; Chen, H.; Deng, H.; Dong, F. A combined power and steam system integrated with solar photovoltaic/thermal collector: Thermodynamic characteristics and cost-benefit analyses. Case Stud. Therm. Eng. 2022, 39, 102477. [Google Scholar] [CrossRef]
  21. Zarei, A.; Liravi, M.; Rabiee, M.B.; Ghodrat, M. A Novel, eco-friendly combined solar cooling and heating system, powered by hybrid Photovoltaic thermal (PVT) collector for domestic application. Energy Convers. Manag. 2020, 222, 113198. [Google Scholar] [CrossRef]
  22. Chow, T.T.; He, W.; Ji, J. Hybrid photovoltaic-thermosyphon water heating system for residential application. Sol. Energy 2006, 80, 298–306. [Google Scholar] [CrossRef]
  23. He, W.; Zhou, J.; Chen, C.; Ji, J. Experimental study and performance analysis of a thermoelectric cooling and heating system driven by a photovoltaic/thermal system in summer and winter operation modes. Energy Convers. Manag. 2014, 84, 41–49. [Google Scholar] [CrossRef]
  24. Touafek, K.; Haddadi, M.; Malek, A. Design and modeling of a photovoltaic thermal collector for domestic air heating and electricity production. Energy Build. 2013, 59, 21–28. [Google Scholar] [CrossRef]
  25. Testi, D.; Schito, E.; Conti, P. Cost-optimal Sizing of Solar Thermal and Photovoltaic Systems for the Heating and Cooling Needs of a Nearly Zero-energy Building: Design Methodology and Model Description. Energy Procedia 2016, 91, 517–527. [Google Scholar] [CrossRef]
  26. Gan, G.; Xiang, Y. Experimental investigation of a photovoltaic thermal collector with energy storage for power generation, building heating and natural ventilation. Renew. Energy 2019, 150, 12–22. [Google Scholar] [CrossRef]
  27. David, A.; Mathiesen, B.V.; Averfalk, H.; Werner, S.; Lund, H. Heat Roadmap Europe: Large-Scale Electric Heat Pumps in District Heating Systems. Energies 2017, 10, 578. [Google Scholar] [CrossRef]
  28. Léger, J.; Rousse, D.R.; Le Borgne, K.; Lassue, S. Comparing electric heating systems at equal thermal comfort: An experimental investigation. Build. Environ. 2018, 128, 161–169. [Google Scholar] [CrossRef]
  29. De Lima, L.C.; de Araújo Ferreira, L.; de Lima Morais, F.H.B. Performance analysis of a grid connected photovoltaic system in northeastern Brazil. Energy Sustain. Dev. 2017, 37, 79–85. [Google Scholar] [CrossRef]
  30. Bouacha, S.; Malek, A.; Benkraouda, O.; Arab, A.H.; Razagui, A.; Boulahchiche, S.; Semaoui, S. Performance analysis of the first photovoltaic grid-connected system in Algeria. Energy Sustain. Dev. 2020, 57, 1–11. [Google Scholar] [CrossRef]
  31. Gao, Y.; Ji, J.; Han, K.; Zhang, F. Experimental and numerical study of a PV/T direct-driven refrigeration/heating system. Energy 2021, 230, 120793. [Google Scholar] [CrossRef]
  32. Hu, K.; Wangyang, P.; Chen, L.; Zhao, Z.; Wang, Q. Progress in full spectrum solar energy utilization by spectral beam splitting hybrid PV/T system. Renew. Sustain. Energy Rev. 2021, 141, 110785. [Google Scholar]
  33. Hu, K.; Wangyang, P.; Chen, L.; Zhao, Z.; Wang, Q. Study on the photoelectric conversion efficiency of solar cells with light trapping arrays. Optik 2017, 135, 313–319. [Google Scholar] [CrossRef]
  34. Global Solar Atlas. Available online: https://globalsolaratlas.info/map (accessed on 14 March 2024).
  35. Chow, T.T. A review on photovoltaic/thermal hybrid solar technology. Appl. Energy 2010, 87, 365–379. [Google Scholar] [CrossRef]
  36. Lan, L. Analysis on Characteristics and Economic Type of New Energy Power Generation. Ph.D. Thesis, North China Electric Power University, Beijing, China, 2014. [Google Scholar]
  37. GB 50736; Design Code for Heating, Ventilation and Air Conditioning of Civil Buildings. Ministry of Housing and Urban-Rural Development, People’s Republic of China, Beijing, China, 2012.
  38. Zhang, Q.; Zhou, Z.; Liu, Y.; Cheng, X.; Yu, Z.; Yuan, T. Design and operational strategy optimization of a hybrid electric heating system with phase change materials for energy storage in nearly zero energy buildings. J. Energy Storage 2024, 82, 110528. [Google Scholar] [CrossRef]
  39. Zhang, Q.; Liu, T.; Cheng, X.; Liu, Y.; Zhang, W.; Zhang, Q. Experimental research of photovoltaic-valley power hybrid heating system with phase change material thermal storage. J. Build. Eng. 2024, 87, 108788. [Google Scholar] [CrossRef]
  40. GB 50189; Design Standard for Energy Efficiency of Public Buildings. Ministry of Housing and Urban-Rural Development, People’s Republic of China: Beijing, China, 2015.
  41. Zhang, Z.; Wang, W.; Song, J.; Wang, Z.; Wang, W. Multi-Objective Optimization of Ultra-Low Energy Consumption Buildings in Severely Cold Regions Considering Life Cycle Performance. Sustainability 2022, 14, 16440. [Google Scholar] [CrossRef]
  42. Liu, Y.; Chen, D.; Wang, J.; Dai, M. Energy-Saving and Ecological Renovation of Existing Urban Buildings in Severe Cold Areas: A Case Study. Sustainability 2023, 15, 12985. [Google Scholar] [CrossRef]
  43. Rehman, S.; Bader, M.A.; Al-Moallem, S.A. Cost of solar energy generated using PV panels. Renew. Sustain. Energy Rev. 2007, 11, 1843–1857. [Google Scholar] [CrossRef]
  44. Zhao, X.-G.; Wang, Z. Technology, cost, economic performance of distributed photovoltaic industry in China. Renew. Sustain. Energy Rev. 2019, 110, 53–64. [Google Scholar]
Figure 1. Structure of the PVDD and GC electric heating system.
Energies 17 02048 g001
Figure 2. The flow chart of the experiment and simulation system.
Energies 17 02048 g002
Figure 3. Experimental site.
Energies 17 02048 g003
Figure 4. Images of the heating cables.
Energies 17 02048 g004
Figure 5. Irradiation intensity collection device.
Energies 17 02048 g005
Figure 6. Photovoltaic power generation system.
Energies 17 02048 g006
Figure 7. Heating cable construction drawing.
Energies 17 02048 g007
Figure 8. Graph of hourly power generation under different weather conditions.
Energies 17 02048 g008
Figure 9. Changes in photoelectric conversion efficiency over time under different weather conditions.
Energies 17 02048 g009
Figure 10. Changes in the temperature in the middle of the heating period over time under the AC/DC switching heating cable mode.
Energies 17 02048 g010
Figure 11. The relationship between indoor temperature and radiation intensity during the heating period under the AC/DC switching heating cable mode.
Energies 17 02048 g011
Figure 12. The relationship between indoor temperature and hourly power generation under the AC/DC switching heating cable mode in the middle of the heating period.
Energies 17 02048 g012
Figure 13. Analysis of electricity consumption and room temperature under the AC/DC switching heating cable mode during the heating period.
Energies 17 02048 g013
Figure 14. The temperature changes over time in the middle of the heating period under the AC/DC synthetic heating cable.
Energies 17 02048 g014
Figure 15. The relationship between indoor temperature and irradiation intensity during the heating period under the AC/DC synthetic heating cable mode.
Energies 17 02048 g015
Figure 16. The relationship between indoor temperature and power generation during the heating period under the AC/DC synthetic heating cable mode.
Energies 17 02048 g016
Figure 17. Analysis of electricity consumption and room temperature during the heating period under the AC/DC synthetic heating cable mode.
Energies 17 02048 g017
Figure 18. Simulation model of the PV direct-drive and mains-coupled electric heating system.
Energies 17 02048 g018
Figure 19. Monthly radiation intensity and monthly power generation of the system.
Energies 17 02048 g019
Figure 20. Annual system power generation.
Energies 17 02048 g020
Figure 21. Simulated and measured irradiation intensity.
Energies 17 02048 g021
Figure 22. Simulated and measured power generation.
Energies 17 02048 g022
Figure 23. Simulation and measurement of indoor temperature.
Energies 17 02048 g023
Figure 24. Simulation and measurement of indoor temperature under the AC/DC switching heating cable mode.
Energies 17 02048 g024
Figure 25. Electricity consumption in the middle of the heating period under the AC/DC switching heating cable mode.
Energies 17 02048 g025
Figure 26. Electricity consumption in the middle of the heating period under the AC/DC synthetic heating cable mode.
Energies 17 02048 g026
Figure 27. Monthly electricity consumption under the AC/DC switching heating cable mode.
Energies 17 02048 g027
Figure 28. Monthly electricity consumption under the AC/DC synthetic heating cable mode.
Energies 17 02048 g028
Figure 29. Interim heating data comparison.
Energies 17 02048 g029
Figure 30. Comparison of data using two different kinds of cables on overcast days.
Energies 17 02048 g030
Figure 31. Economic analysis of four heating modes.
Energies 17 02048 g031
Table 1. Heat transfer coefficients of the envelope structure.
TypeConstructionHeat Transfer Coefficient (W/(m2·K)
External wall190 mm aerated concrete block + 80 mm thick rock wool + 140 mm thick benzene board + 50 mm thick thermal insulation mortar + exterior finish0.1
Roof200 mm reinforced concrete roof + 300 mm EPS insulation board0.1
WindowThree-glass two-chamber double low-E argon- filled insulating glass and warm edge spacer1.0
Roofing200 mm reinforced concrete roof + 300 mm EPS insulation board0.1
Table 2. Photovoltaic panel power parameters.
TypeParameter
TypeSFM-450 W
Peak power (Pmax)450 W
Peak voltage (Vmp)41 V
Open-circuit voltage (Voc)49.6 V
Peak current (Imp)10.98 A
Short-circuit current (Isc)11.53 A
External dimensions2094×1034×35×35 mm
Table 3. Inverter parameter.
TypeParameter
TypeGW6000-DNS-30
Maximum efficiency97.1%
Maximum output current28.8 A
Rated output voltage220 V
Rated output power6000 W
Table 4. Experimental bench heating system cable parameters.
TypeCable Length
(m)
Rated Power
(W/m)
Cable Spacing
(mm)
Covered Area
(m2)
Value17761711320
Table 5. Total electricity consumption of the two heating modes in the heating period.
Heating ModeTotal Electricity
Consumption (kWh)
Alternating Current
Power (kWh)
Direct Current
Power (kWh)
AC/DC switching heating cable mode4017.122043.161973.96
AC/DC synthetic heating cable mode4034.151110.712923.44
Table 6. Initial system investment.
Project NameSpecificationTotal Price (RMB)
Photovoltaic panelSingle-crystal silicon 450 W4680
Grid-connected inverterGW6000-DNS-30-6 kW1650
Heating cableAC/DC switching/synthesis4800
Distribution boxPower protection, switching circuit7500
ConstructionWiring, construction, and installation1750
Total cost 20,380
Disclaimer/Publisher’s Note: The statements, opinions and data contained in all publications are solely those of the individual author(s) and contributor(s) and not of MDPI and/or the editor(s). MDPI and/or the editor(s) disclaim responsibility for any injury to people or property resulting from any ideas, methods, instructions or products referred to in the content.

