Article

Electromobility Stage in the Energy Transition Policy—Economic Dimension Analysis of Charging Costs of Electric Vehicles

by
Wojciech Lewicki
1,*,
Mariusz Niekurzak
2,* and
Ewelina Sendek-Matysiak
3
1
Faculty of Economics, West Pomeranian University of Technology Szczecin, Żołnierska 47, 71-210 Szczecin, Poland
2
Faculty of Management, AGH University of Krakow, Antoniego Gramatyka 10, 30-067 Krakow, Poland
3
Faculty of Management and Computer Modeling, Kielce University of Technology, al. Tysiąclecia Państwa Polskiego 7, 25-314 Kielce, Poland
*
Authors to whom correspondence should be addressed.
Submission received: 5 March 2024 / Revised: 6 April 2024 / Accepted: 8 April 2024 / Published: 18 April 2024

Abstract

:
The available literature emphasizes that by 2040, electric vehicles may constitute up to 50% of the fleet of all passenger vehicles. This process will be one of the elements of the energy transformation and, at the same time, consistent with the idea of sustainable transport. As part of this research, the actual energy consumption and the range of electric vehicles were determined. This research was carried out using a selected group of electric cars from the most popular segments of passenger cars. The calculations were based on three charging scenarios: a home electrical network, a public alternating current (AC) charging station that allows charging with single-phase alternating current or alternating current, and a public direct current (DC) charging station that allows charging with direct current. The obtained results were compared with the results of cars with internal combustion and diesel engines after driving a 100-kilometer section of the route. In a broader scope, this research addresses the entities responsible for the energy transformation and the electromobility development strategy. In a narrower sense, vehicle users are considering the purchase of this type of vehicle for political, economic and technological reasons.

1. Introduction

The road transport sector is one of the better-developing sectors of the global market. With the increasing number of vehicles in the world, there is an increasing problem with the emission of harmful substances into the atmosphere. It is also directly related to the emission of greenhouse gases, as well as the impact on the natural environment of man. One of the greenhouse gases is carbon dioxide. Its excessive emission directly contributes to the increase in the greenhouse effect. It is high time to improve air quality as well, and this requires, among other things, less-emission transport. Meanwhile, the European Union (EU) climate policy is accelerating again. In September 2020, the European Commission proposed to raise the target of reducing greenhouse gas emissions to at least 55% by 2030 [1]. Over the next several years, Poland must modernize its energy sector and initiate changes, e.g., in the transport sector, because there is no escaping the challenges.
This is necessary not only to reduce carbon dioxide (CO2) emissions, but also because to improve air quality and give the economy a new development impulse [2]. Decarbonization of the transport sector is a big challenge, taking into account the projected trajectories of its development. On the one hand, the International Energy Agency (IEA) predicts that the demand for mobility in the EU will increase by approximately 60% in 2050. On the other hand, the EU transport sector needs to reduce its greenhouse gas emissions by 30% by 2030 to ensure that the EU’s agreed national contributions rise to 60% in 2050.
Transport in Poland is already responsible for over 15% of greenhouse gas emissions, which, moreover, has more than tripled over the last 30 years. The same trend can be seen in other EU countries [3]. Therefore, without a clearly defined strategy for this sector, the EU objectives will not be achieved. So far, no road map for transport decarbonization has appeared in Poland, but it is clear that a solution that can be applied on a large scale is, among others, electrification. With the simultaneous decarbonization of the energy mix, this is the key to success in reducing emissions. It is assumed that the decarbonization of transport will partly result from the use of electric drives in passenger cars [4]. The efficiency of electric motors is approximately 3-fold higher than internal combustion engines, and more and more electricity comes from renewable sources. Electric vehicles could therefore significantly reduce the total demand for fuels (liquid and gaseous). With the fall in battery costs and stronger regulatory support, already 10–30% of all light vehicles sold in the world in 2025–2040 could be electric vehicles. Car manufacturers must ensure that each vehicle they produce emits no more than 95g CO2/km on average. According to data from the European Commission, the average emissions of new cars in the EU in 2018 was 120.4 g CO2/km [5,6]. This means the need to achieve over 20% reduction in the coming years. Meanwhile, new reduction targets for 2025 and 2030 are already in force. They are, respectively, 15% and 37.5% reduction from the reference level set in 2021. From the point of view of reducing emissions, electrification is the most important way to decarbonize transport, as electricity can be obtained from emission-free sources. There are many myths and misconceptions about electric cars. Meanwhile, from year to year, electric cars are becoming a more and more sensible alternative to electric cars diesel drive. The differences in prices between electric cars and those powered by internal combustion engines are gradually decreasing, the ranges of this type of car are increasing, and the number of charging stations is increasing [7]. Of course, electric cars are still not an option for everyone. Before buying, it is worth analyzing several technical and economic aspects that will explain this article. Probably, however, it is not free parking in the city or the possibility of using the bus lane that determines the purchase of an electric car by a potential investor [8,9]. One of the key arguments for purchasing an electric vehicle may be the low cost of energy/fuel consumption compared to vehicles powered by combustion engines. This argument is particularly important in urban traffic and over short distances, where the fuel consumption of the combustion engine is particularly high. In the case of fully electric cars, moving around the city is not very costly. For example, the cost of driving a distance of 100 km by an electric car in an urban area is estimated at between EUR 0.7 and EUR 2.3 in the price realities of the analyzed country [10]. This amount is incomparably less than the consumption of even five liters of unleaded petrol. Furthermore, in some models of electric cars, energy is recuperated during braking, and this means a free dose of power for this type of vehicle. Electric cars can now be charged quickly, providing a very good range. For example, the new Mazda MX-30 electric car needs only 40 min to be fully charged at a fast charging station. This translates into approximately 200 km of range, so it is a very good result among the electric cars currently available on the market. In turn, with the help of a regular mains charger, the car will be fully ready to drive in 4.5 h [11]. You can also choose the option of overnight charging with a home installation, which takes just over 14 h. However, the issue of charging electric cars looks completely different than refueling with petrol or diesel, which costs similarly at all stations [12,13]. Electricity prices at different stations are very diverse and depend not only on the station operator but also on whether we have a subscription or not, whether we have chosen a fast or slow charger and how long the car will block position.
The presented considerations fill the research gap in the literature on the subject. This study extends existing research in the field of electromobility. The developed results give a clear answer to the reader whether electric vehicles, apart from being ecological, are also economical to use in comparison to cars powered by gasoline or oil. As part of the conducted research, the authors determined how energy consumption is shaped over various distances in urban and extra-urban traffic and on the expressway, and how much it costs to drive 100 km in an electric car. This research was conducted using five segments of the most popular cars used in Poland. The calculations were based on three loading scenarios [14,15]:
  • Home power grid,
  • Charging on a public AC charger station, and
  • Charging at a public DC charging station.
The presented considerations are important in terms of shaping economic strategies for the development of electromobility within the framework of the idea of energy transition policy. The demand side, i.e., the potential user of the vehicle, can become acquainted with the results of specific proposed solutions and the resulting analysis of selected costs—fuel costs/electricity prices. This problem will become crucial after the planned liberalization of energy prices in 2024. Unfreezing them will undoubtedly involve a significant increase in the costs of 1 kW. This will translate into a higher price for charging an electric car not only at home but also at AC/DC stations. Given the fact that the prospect of a significant increase in energy prices may effectively discourage people considering buying a new car from choosing an “electric vehicle” To our knowledge, this is the first research approach to this topic. In short, this article brings a new look at the existing literature in the following areas: (I) electric vehicles, (II) economic strategies for the development of electromobility, (III) charging cost analyses, and (IV) infrastructure selection.
This article is organized as follows. Section 2 contains a detailed description of the research approach based on the latest literature on the subject. Section 3 describes the research methodology used. Section 4 presents the experimental results and their interpretations. Section 5, on the other hand, contains the conclusions of this research, indicating its limitations, practical application and future directions of research in this field.

2. Literature Review

One of the basic arguments cited by the supporters of electric cars is the cost of driving 100 km less than 3-fold less than a combustion car [16]. It is a fact that the current high price of gasoline encourages vehicle users to look for savings in the form of more efficient engines, and hybrid solutions such as combined electric and internal combustion engines or electric cars. Increasing the share of electric cars in traffic will force the necessity of installing their charging stations [17,18]. These stations should be able to implement modes of fast and nominal charging with current adapted to the type of battery. Depending on the development of the power grid and its adaptation to cooperation with electric vehicles may also allow the use of battery traction as local network energy storage [19,20]. Infrastructure development charging electric cars involves the need to modernize them and case the need to build new connections to the distribution network [21,22]. It will also be necessary to adapt the transmission network and generation systems to the increased demand.
Global trends in sustainable development and related activities to improve air quality and search for alternative energy sources result in strong social pressure directed at the development of electromobility, the advantages of which include [23]:
  • The ability to produce energy from any source;
  • No emission of gaseous or solid pollutants into the atmosphere;
  • Higher energy efficiency compared to traditional drive units combined with high efficiency of converting electrical energy into mechanical energy;
  • The ability to recover kinetic energy generated during braking into electricity, which can be used to recharge the batteries, which has a direct impact on the driving range and efficiency;
  • Low operating costs depending on the speed of the vehicle and the price of 1 kWh of energy;
  • Eliminating the risk of fuel explosion in the event of a collision.
Road transport has been present in sustainable development strategies for a long time. Its nuisances are analyzed, such as land consumption [24,25], accident rate, urban nuisance [26,27], resource consumption or high infrastructural costs [28,29]. However, the development of this branch of transport is aimed at overcoming centuries-old infrastructural neglect in the development of transport [30,31], its impact on increasing social mobility, equalizing regional competitiveness in the developmentally diverse space of the country [32,33], reducing the cost of living socio-economically [34,35,36] and export of transport services [37]. An interesting review of the research on the importance of various factors in purchasing preferences for electric cars is presented by [5,38,39,40]. Among many conditions in research, there were also psychological and social factors, such as pro-environmental attitudes, innovation as an attitude, treating the car as a symbol of social status, as well as emotions and various risks associated with electric vehicles. However, there was not much research on the significance of individual phenomena. In Poland, surveys on attitudes towards electric cars were also conducted. In one of the studies [41], the five most important factors encouraging the use of such vehicles were distinguished. These are low costs of use (64% of respondents), the ability to drive 300 km on a single battery charge (55%), co-financing the purchase from the state (50%), “environmental friendliness” (28%) and a tax relief related to the use of such a car (24%). The most discouraging are the price (81% of respondents), insufficient infrastructure (67%) and the need for frequent charging (63%). In another study [42,43], 91.6% of Polish drivers are interested in electric cars, but 12.4% considered buying one soon. Convincing incentives to buy such a car would be state support in terms of subsidizing the purchase (70.6% of respondents), tax deductions (41.1%), but also facilitating use, such as free parking spaces (57.6%) or using bus lanes (30.5%). Purchase costs (57.3% of respondents), lack of charging infrastructure (47.4% of respondents) and a shorter range than conventional cars (29.8%) were indicated as the main obstacles [3,44,45]. However, so far no analyses have shown more complex relationships than the presentation of results to questions asked directly to the respondents. A separate area of the research by scientists is the issue of technological progress and related economic aspects. The future of electromobility seems to be solutions based on proton-exchange membrane fuel cells (PEMFC), a highly promising renewable energy conversion technology. However, durability issues hamper the process of their large-scale commercialization. Predicting performance degradation is an important element of PEMFC forecasting and health management, and is also critical to extending the life of the fuel cell [46]. In another work, researchers innovatively proposed a learning-based predictive model (L-MPC) of EMS for a fuel cell hybrid electric bus (FCHEB) with health-aware control. This method effectively combines the advantages of control theory and machine learning [47].
Analyzing the literature on the subject, the authors state that the profitability of using electric cars on a mass scale (especially in Eastern Europe) has not yet been fully developed and analyzed in terms of selected economic parameters, e.g., fuel/energy prices. Reports published in the form of post-conference studies contain a lot of important information about the potential economic benefits resulting from the use of this type of car. However, experiments described in the literature often do not reveal the issue of differences in electricity prices depending on a given supplier. Identification of financial, but also legal, technical and technological barriers to the development of the electric car market will reduce the risk associated with its future functioning. Emerging concerns about cost increases related to the possibility of charging electric cars prompt the authors to develop effective, economic and pro-ecological methods of assessing the profitability of their use in mass transport on the Eastern European market. Although not all factors shaping the development of electromobility are predictable, familiarizing yourself with certain trends (e.g., analysis of vehicle charging costs using available infrastructure) will certainly help the demand side make decisions and prepare for the upcoming changes.

3. Materials and Methods

Assumptions Adopted for the Analysis

There are several dozen models of electric cars available on the Polish market, which differ in operational and technical parameters. The choice of this market was not accidental, as it is one of the most dynamically developing electric vehicle markets in Central Europe. The following assumptions were made to achieve the aim of the work:
  • The most popular models of electric cars available on the Polish market were examined.
  • Car models are divided depending on the installed net battery capacity into three segments: (A): 30–50 kWh, (B): 51–70 kWh, and (C): 71–100 kWh.
  • An average rate of EUR 0.16/kWh was used for calculations (energy price when charging from a socket).
  • The maximum charging power with a direct current of 100 kW was used.
  • For the list, the prices in the largest GreenWay network in Poland were adopted in two variants: without a subscription, with higher rates (EUR 19.30) and with a subscription including multiple charging (EUR 6.43), for kWh.
  • Charges for blocking the charger for power consumed, charging time and parking above the set limit are not included.
  • It should be noted that several factors can affect the charging speed of an electric car. On the one hand, there is the output power of the station, and on the other, there are the input limitations of the vehicle itself. Outside temperature, occupancy charging station, vehicle’s state of charge and other factors, which are difficult to assess reliably according to operators of infrastructure for charging electric vehicles Therefore, to maintain logical correctness, they were not included in the presented data analysis.
As part of this research, the following was calculated for each electric car in a given segment. The individual parameters and the formulas used were based on data from charging station manufacturers:
1.
The charging power depending on the battery capacity was calculated according to the following formula:
Charging power (single-phase AC):
Charging power (3.7 kW) = phases (1) × voltage (230 V) × current (16 A)
Charging (three-phase AC), star connection:
Charging power (22 kW) = phases (3) × voltage (230 V) × current (32 A)
Alternative: charging power (three-phase AC), delta connection:
Charging power (22kW) = root (3) × voltage (400V) × current (32A)
2.
Charging time
The net battery capacity has been taken into account for the calculation of the battery charging time due to the optimal operating conditions of the battery. In practice, this means the need to protect the battery against both overcharging and total discharge. The charging time was calculated by dividing the battery capacity by the charging power of the electric car. However, during the charging process, the charging power is not constant; may be limited depending on the battery condition. For this reason, half an hour was added to the calculation.
Charging time = battery capacity/charging power
3.
The electric vehicle range was calculated according to the following formula:
The battery capacity was divided by power consumption and the sum was multiplied by 100. The results obtained are theoretical values because the actual range depends on the operating mode and the use of electrical loads such as heating, air conditioning and driving style. Moreover, the full capacity is often not available to protect the battery.
Range = battery capacity/energy load × 100
For example: 469 km = 85 kWh/(18.1 kWh/100 km) · 100
4.
Electricity consumption.
Just like in a car, the average fuel consumption in liters per 100 kilometers is converted, so in electric cars, the value of kilowatt hours is used for kilometers. Depending on the model or driving style, these values are different. For these studies, it was assumed that electric city cars consume approximately 15 kWh/100 km, and larger, electric SUVs—20–25 kWh/100 km.
5.
The costs of charging the electric car were calculated:
  • In the city according to average rates:
    • Connector AC—0.28 EUR/kWh,
    • Connector DC (40 kW)—0.49 EUR/kWh, and
    • Connector DC(>50/100/150 kW)—0.54 EUR/kWh.
In this case, it should be noted that the price of charging an electric car also depends on the service provider itself, i.e., the company operating a specific charger, so it is different from the price of energy when charging, e.g., from a home socket. These companies have their margins, but also various subscription systems and loyalty programs. Moreover, costs also vary depending on the type of charger and its power. The average prices valid in the analyzed period were used for the analysis. The differences in prices for individual electric vehicles result from the different energy consumption processes of individual vehicles. At a later stage of the numerical experiment, common consumption assumptions of 6 L/100 km for conventionally powered vehicles were also made.
By charging the car at a public AC station, where the cost of 1 kWh is EUR 0.28, the cost of driving an electric car for 100 km will cost, respectively: in urban traffic (14.5 kWh)—EUR 4.07, in suburban traffic (13.5 kWh)—3.79 EUR, on the highway (20 kWh)—EUR 4.15. The cost of energy available in a fast DC charger with a power of up to 40 kW is currently EUR 0.49/kWh and EUR 0.54/kWh for charging with a power of 40–150 kW. In such a situation, the costs of driving 100 km in an electric car will be as follows: in city traffic (14.5 kWh)—EUR 7.83, in suburban traffic (13.5 kWh)—EUR 7.29, on the motorway (20 kWh)—EUR 10.80. The cost of energy available in a fast DC charger with a power of up to 40 kW is currently EUR 0.49/kWh and EUR 0.54/kWh for charging with a power of 40–150 kW. In such a situation, the costs of driving 100 km in an electric car will be as follows: in city traffic (14.5 kWh)—EUR 7.83, in suburban traffic (13.5 kWh)—EUR 7.29, on the motorway (20 kWh)—EUR 10.80.
  • At home according to average rates:
Assuming that the average price of electricity in Poland in 2022 ranges from EUR 0.15 to EUR 0.19 per kWh, i.e., averaging EUR 0.16 per kWh, the cost of driving an electric car for 100 km will be kWh)—EUR 2.30; in suburban traffic (13.4 kWh)—EUR 2.15; on the motorway (20 kWh)—EUR 3.21. These costs can be significantly reduced in several ways. One of them is the use of energy suppliers’ night tariffs, which offer lower rates, e.g., from 10 pm to 5 am. Another method of reducing car charging costs is charging from a photovoltaic installation. From the point of view of operation, the lowest cost of driving an electric car 100 km is when charging the car at home. However, to speed up this process, you should invest in a Wallbox or portable wall charger, powered from a power socket, such as Zencar. Public charging stations are perfect for longer journeys. However, they do not offer electric car drivers such great financial benefits [48]. For the cost analysis, electric car models were indicated, which are the most frequently purchased vehicles in Poland, and the electric vehicle with the largest range (Mercedes EQS). Energy consumption is achieved in the combined cycle with normal driving. The list of technical parameters of the cars taken for the analysis of the problem is presented in Table 1.
Individual combustion cars were selected in such a way that they could be considered as a competitor of the electric version. The comparison was made based on such characteristics as maximum permissible weight, car class, power, number of passengers and year of production. The average price of Pb 95 petrol was assumed for the calculations at the a rate of Kb = EUR 1.42. Because it is much cheaper than Pb98 gasoline. However, for more powerful engines, manufacturers may require the use of a more expensive version. This is due to the need to ensure the appropriate values required for the motor. In turn, the average cost of diesel in 2022 was Kd = EUR 1.53. The average cost of a home charging station is approximately Ks = EUR 750. For this work, the purchase of the “Green Wallbox Smart 22 kW Type 2” device was assumed, the price of which is EUR 728. The power supply of the charger is 22 kW, which allows you to load the battery in just a few hours [49]. The assumed cost is EUR 750, which includes the purchase price and installation of the station.

4. Results and Discussion

The driver at this stage must decide how he will charge his vehicle. You can choose from the following options:
  • Charging at home directly from the socket,
  • Charging at home using a charging station, and
  • Charging at an electric vehicle charging station.
  • Assumptions:
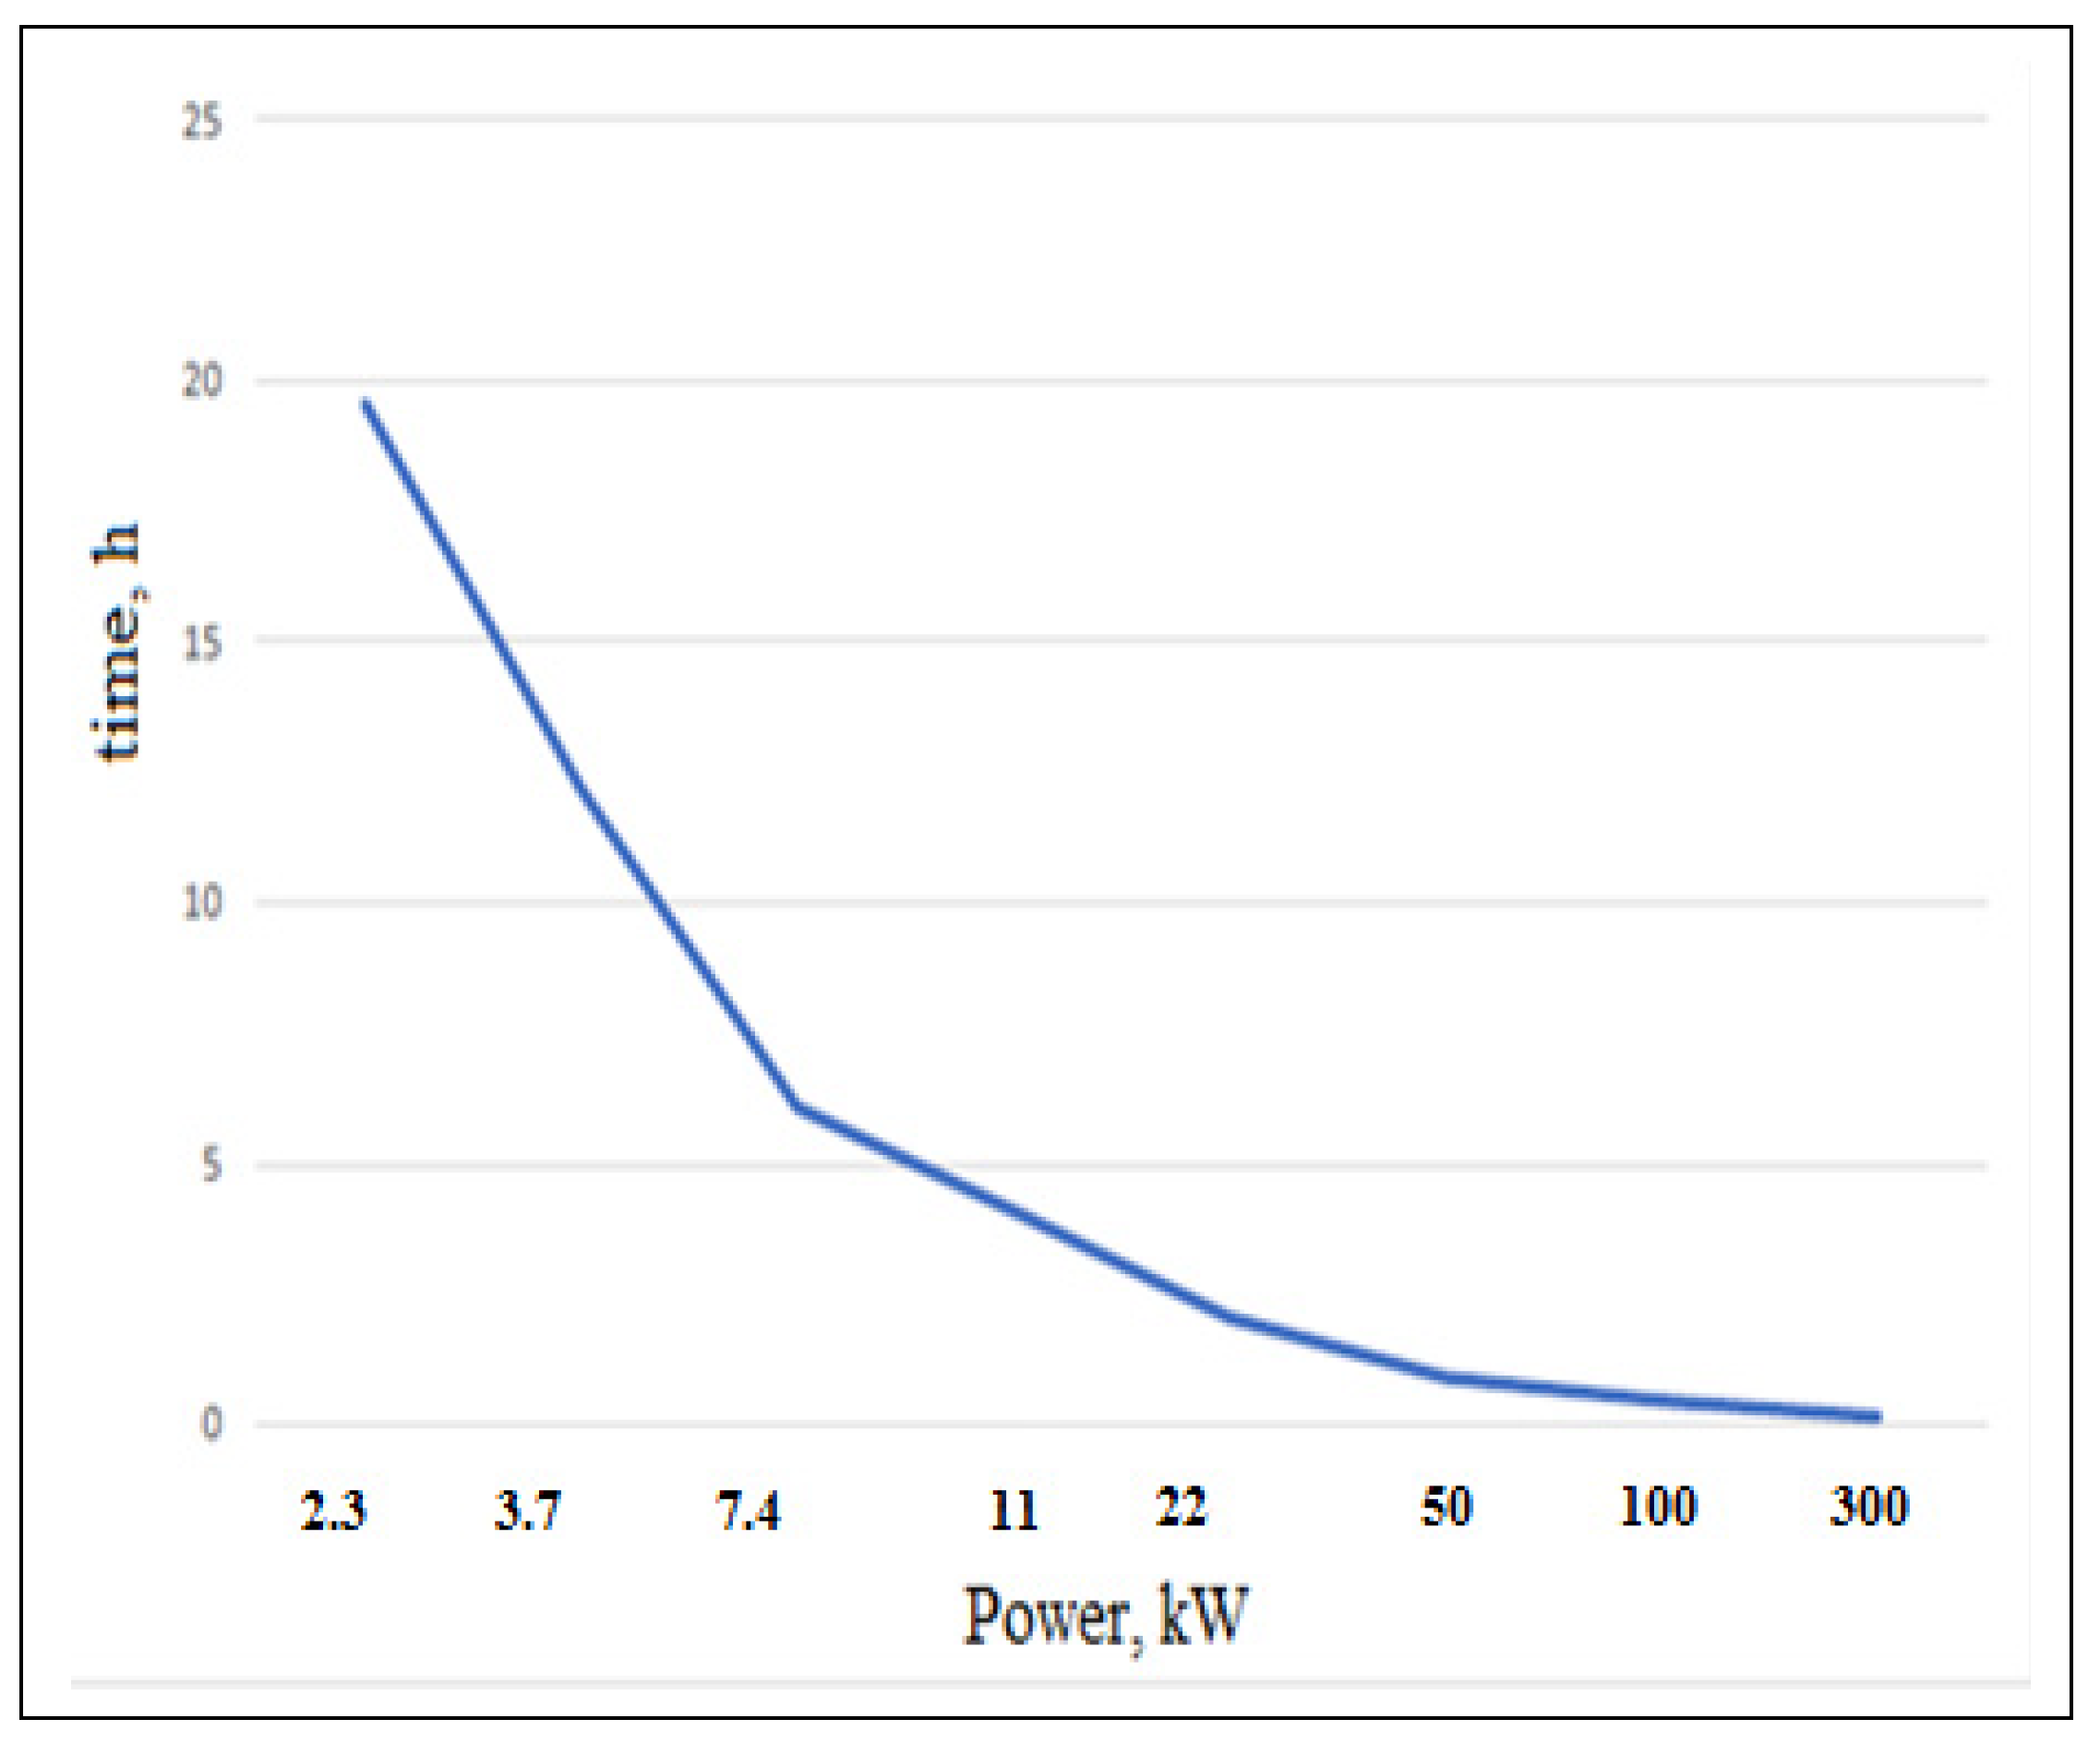
    • Battery capacity: X = 45 kWh
  • For charging directly from the socket
    • Data:
    • Voltage [U] ≈ 230 V
    • Current [I] ≈ 10 A
    • Power [P] = U·I = 230 V·10 A ≈ 2300 W = 2.3 kW
    • Time [T] = X/P = 45 kWh/2.3 kW ≈ 19 h 33 min
  • For the purchased charging station
    • Data:
    • P1 = 3.7 kW
    • P2 = 7.4 kW
    • P3 = 11 kW
    • P4 = 22 kW
    • T1 = 45 kWh/3.7 kW ≈ X/P1 ≈ 12 h 10 min
    • T2 = 45 kWh/7.4 kW ≈ X/P2 ≈ 6 h 5 min
    • T3 = 45 kWh/11 kW ≈ X/P3 ≈ 4 h 5 min
    • T4 = 45 kWh/22 kW ≈ X/P4 ≈ 2 h 3 min
  • For the charging station
    • Data:
    • P1 = 50 kW
    • P2 = 100 kW
    • P3 = 350 kW
    • T1 = 45 kWh/50 kW ≈ X/P1 ≈ 54 min
    • T2 = 45 kWh/100 kW ≈ X/P2 ≈ 27 min
    • T3 = 45 kWh/300 kW ≈ X/P3 ≈ 9 min
Based on the above calculations, it appears that the most advantageous option for charging the car battery is charging it at stations. However, the choice is also influenced by the availability and price of energy at the station. Using this solution is optimal for drivers who:
  • They cannot charge the car at home.
  • They cover long distances and they care about time.
For the average driver, it is enough to charge the car at home using the purchased AC charging station. By plugging the car in at night, he will be sure that the next day he will have a fully charged battery at his disposal, which, depending on the vehicle, will allow him to cover several hundred kilometers. The least optimal way to charge electric vehicles is charging directly from the socket. A driver using such a solution would have to cover very short distances so that he would not have to worry about not having time to charge the vehicle for the next trip. This is a good option as a backup solution, for example when going on vacation, where there may be no access to charging at the station. Charging times may deviate from the assumed values, because the computer of the electric car, controlling the charging process, will adjust the power so as not to overload or overheat the battery. In addition, it depends on the car how much power it can take, so even if the driver uses ultra-fast charging up to 350 kW, it may turn out that the car will be charged with 50 kW [12,50]. The charging time depends on the power of the device that we will use for this process. As the power increases, the charging time decreases, as shown in Figure 1.
After the driver has selected the method of charging, connect the car to the charger. He must use the appropriate connector to be able to fully use the capabilities of the charging station and the vehicle. After connecting the cable, the transfer of electricity begins; during communication between the vehicle and the station, the systems in the vehicle determine the charging power to ensure the safety of the process. This prevents possible damage to the vehicle. For safety reasons, most cars cannot be disconnected while charging. You must first complete the process on the vehicle side. The vehicle or charging station in most cases has systems that allow you to determine the level of loading of the vehicle or the time it can spend on charging after reaching a predetermined limit [36]. The process is then automatically terminated. This limit can be set through dedicated applications offered by station manufacturers. If the driver does not will declare the limit, the charging process ends automatically when it reaches 100% capacity. For the cost analysis, energy/fuel expenses were indicated for the following distances: 100 km, 1000 km, 10,000 km, 50,000 km, 100,000 km, 200,000 km and 500,000 km. A payback period has been set for the purchase of charging stations for home use about the costs obtained at AC and DC charging stations. The costs of using internal combustion and electric cars were compared.
  • For variant I
The car is charged at home using the G11 tariff when purchasing a home charging station. Table 2 shows the energy costs for a specific distance driven, taking into account the cost of purchasing the station.
In addition, Table 3 presents the total costs for the energy consumed after travelling a certain distance. The calculations include the cost of purchasing an AC charging station. Calculation method:
K = ze·d·Ke/100 + Ks
where
  • ze—energy consumption, kWh/100 km, and
  • d—distance travelled, km.
Table 3. Energy costs per distance travelled for AC stations.
kmNissan Leaf, EURBMW i3,
EUR
Renault Zoe, EURTesla Model 3,
EUR
Mercedes EQS,
EUR
1004.765.884.244.535.72
100047.5658.8042.4145.3157.20
10,000475.56588.02424.15453.06571.95
50,0002377.792940.102120.732265.322859.77
100,0004755.575880.204241.464530.655719.54
150,0007133.368820.306362.196795.978579.31
200,0009511.1511,760.409061.299061.2911,439.08
500,00023,777.8629,401.0122,653.2422,653.2428,597.70
Source: own.
Example:
K1 = 14.8 × 100 × 0.77100 + 750 = 14.8 × 0.77 + 750 = 761.40 EUR
  • For variant 2
The electric car is charged at the charging station using an AC charger.
Calculation method:
K = ze × d × KAC/100
Example:
K1 = 14.8 × 100 × 0.32/100 = 14.8 × 0.32 = 4.74 EUR
  • For variant 3
The electric vehicle is charged at the charging station using a DC charger.
Calculation method:
K = ze × d × KDC/100
Example:
K1 = 14.8 × 100 × 0.50/100 = 14.8 × 0.50 = 7.40 EUR
The distance that needs to be travelled by car for a return on investment was calculated based on the formula:
d = 100 × Ks/ze × ΔCe
where
  • Ks—station purchase cost,
  • ze—energy consumption,
  • ΔCe—energy cost difference, and
d1–d8—a specific number of kilometers.
d 1 = 100 · K s z e · C e = 6939.49 d 2 = 100 · K s z e · Δ C e = 5612.43 d 3 = 100 · K s z e · Δ C e = 7780.72 d 4 = 100 · K s z e · Δ C e = 7284.17 d 5 = 100 · K s z e · Δ C e = 70,034.60 d 6 = 100 · K s z e · Δ C e = 3311.12 d 7 = 100 · K s z e · Δ C e = 2677.69 d 8 = 100 · K s z e · Δ C e = 3712.35
Based on the above calculations, it was found that as the cost of charging at the station increases, the distance needed to return the investment in the home charging station decreases. The increase in the vehicle’s electricity consumption also affects the road needed to pay back the investment. As the energy consumption of an electric vehicle increases, the distance travelled decreases. Table 4 and Table 5 show example charging costs for electric cars over a distance of 100,000 and 200,000 km.
Based on the obtained results, it was shown that in the tested sample, over a distance of 100,000 km, charging a vehicle at an AC charging station, with the adopted assumptions, is 45–56% more expensive, depending on the vehicle. Charging at a DC station is also more expensive, where the difference compared to the variant of charging the vehicle at home is 122–139%. Similarly, in the case of driving 200,000 km, the differences are 66–73% and 155–166%, respectively. It has been shown that charging the car at home is the most economical option. Table 6 presents the results of calculations regarding the comparison of costs of combustion and diesel-powered vehicles after driving a distance of 200,000 km.
After analyzing the data in Table 7, it can be concluded that the use of an electric vehicle is cheaper by 119–196% compared to a petrol-powered vehicle. When comparing oil-powered and electric vehicles, it was noticed that the cost difference in the second category of vehicles is only 13% in favor of electric vehicles. In other cases, the difference is in the range of 70–132% in favor of electric vehicles. At a distance of 200,000 km, a much higher percentage of savings was observed compared to a distance of 100,000 km. This is due to the settlement of the cost of purchasing a charging station over a longer distance. In addition, it was found that if the driver covers the above-mentioned distance, he will save approximately EUR 12,852.90.
Assuming that a compact class car equipped with a diesel engine consumes on average approximately 6 liters of fuel per 100 kilometers, driving such a distance costs EUR 9. The same distance behind the wheel of an electric car that consumes energy at a rate of 15 kWh/100 km, with electricity costs of EUR 0.16/kWh (average daily tariff price in Poland), gives a bill of EUR 2.41. It is also worth noting that there are points where you can charge your car for free (as part of promoting eco-friendly drivers), so it is easy to avoid even such a small cost. In Poland, the average driver covers approximately 15,000 km per year. Using a diesel-powered car, over twelve months, the user will spend EUR 899.70 on fuel and just over EUR 235.64 on electricity. Therefore, on this basis, it is possible to present a forecast (assuming constant prices of energy carriers) of what the costs of purchasing fuels/energy will be like in eight years. That is, during the declared warranty period for batteries in electric cars. These amounts will be EUR 7197.62 for fuel and EUR 1927.93 for electricity, respectively. It is important to emphasize that, taking into account the forecast increase in energy costs by 60% from mid-2024, the cost analysis is still more favorable for an electric car. Therefore, when comparing only the costs of purchasing fuel/energy, the economic calculation supports the choice of an electric car. At this stage of consideration, one should remember other economic factors that were not analyzed in this study, including higher costs of purchasing an electric vehicle compared to conventionally powered vehicles, higher costs of replacing the drive unit, including traction batteries after 8 years of operation and higher costs of third-party liability insurance for the vehicle owner and optional auto insurance compared to conventionally powered vehicles.

5. Conclusions

Bearing in mind the decision to stop selling new vehicles powered by conventional fuels after 2035, the tightening regulations on greenhouse gas emissions, the growing share of energy produced from renewable sources, as well as the continuous development of electricity storage technologies [51,52,53], the electrification of road transport seems to be an inevitable process [10,54,55]. At the same time, it will be an important element of the sustainable development idea. The authors postulate that the changes taking place in these areas will become a determinant of the energy transformation of the modern economy. This process will be irreversible for the entire automotive industry and related sectors. The current increase in electric vehicles is most noticeable in the field of individual transport policy, and more precisely in the production and sale of passenger cars. Currently, in 2023, most vehicle manufacturers offer several models with the hybrid drive or only electric drive, which is certainly a response to the needs of the global market. However, in the opinion of the authors, there are still some limitations in this respect, in particular relating to the issue of vehicle charging costs which determine the dynamic development of electromobility development processes. Based on the conducted research, the following conclusions were drawn.
  • Assuming that the vehicle user travels approximately 15,000 km per year, and comparing only fuel/energy prices in the period under study, the economic calculation supports the choice of an electric car. It is worth emphasizing that this postulate does not change even taking into account the forecast increase in electricity prices by 60% from mid-2024.
  • The release of market prices for energy at the turn of 2024 will undoubtedly involve a significant increase in the costs of 1 kW of energy. This will directly translate into a higher price for charging an electric car not only at home but also at public AC/DC stations. However, charging in an electric socket will still be less costly than using the commercial infrastructure of individual operators.
  • Owning a wall box charging station offers some opportunities to reduce the costs of vehicle charging. Indeed, the economic analysis must take into account how much an electric car charger and its installation costs, but energy costs can be reduced by, for example using solar panels. With a properly developed photovoltaic installation, it is possible to fully meet energy needs.
  • Charging the vehicle directly from the home network socket is a low-cost process, but too long-lasting and can be used as a backup method when there is no other possibility of access to specialized infrastructure in the form of the so-called wall box or charging station.
  • Using an electric vehicle in terms of fuel and energy consumption about the distance travelled can be 3-fold less costly than using vehicles powered by conventional fuels.
  • Charging a vehicle at a DC-type station is much faster, depending on the vehicle, it may take from several to several dozen minutes, but it is the most cost-intensive process of the available charging options.
  • Charging at a DC station can be a more cost-intensive process than the process of refueling a car with conventional fuel, in terms of fuel and energy consumption about the distance travelled.
To sum up, in the coming years, we should expect a dynamic development of the electric car segment. The main reason for this trend is the gradual levelling of the prices of electric vehicles, caused primarily by a decrease in the prices of lithium-ion cells. Currently, the cost of lithium-ion batteries is on average approximately 30% of the price of an average-sized electric car. According to Bloomberg New Energy Finance (BNEF) forecasts, by 2025, this share will fall below 20%. As a consequence, the purchase price of an electric vehicle will decrease. Another important factor influencing the increase in the popularity of this category of vehicles will be emerging state incentives in the form of financial instruments supporting the purchase of electric vehicles for the demand side and tightening regulations in the field of individual transport, in particular within city centers.
The presented research focused on the assessment of transport electrification as one of the forms of energy transformation. Against the background of scientific considerations, the question should be answered whether the economic dimension in the form of an analysis of the charging costs of this category of vehicles can contribute to changes in the modern economy. According to the researchers, it certainly is. Rising electricity prices may lead to a situation where driving an electric vehicle may be economically unprofitable. This determinant may be crucial in the process of transforming individual transport. Where the fundamental goal is to achieve a synergy effect by combining economic and environmental aspects. However, the question remains which strategy in the area of shaping electricity prices will be adopted by each of the countries’ economies both in the coming years and after 2030?
The analyses in this document are based on data on several models of electric vehicles differing in operational and technical parameters, assuming three selected charging methods and subscription fees including the cost of charging. Certainly, much broader analysis and research will be needed shortly, especially on the interactions between user behavior, transport networks and electricity networks. both with the increase in the market share of electric vehicles and forecast electricity prices. Moreover, further research on this topic should focus on aspects related to the behavioral patterns of electric vehicle users in terms of choosing the place, time and method of charging electric vehicles [56]. At a later stage, an important element seems to be the assessment of social costs resulting from the resignation from conventional engines in favor of emission-free ones and the impact of these changes on other sectors of the economy [57,58].
Summing up the presented considerations regarding the electrification of transport as one of the forms of energy transformation of the modern economy, the economic dimension of the analysis of the costs of charging electric vehicles does not fully exhaust the essence of the issue. They are only an incentive for further research in this matter. Certainly, this topic requires further analysis to understand both the essence of the impact of the energy transformation on the modern economy and the role that the electrification of transport plays in this process, and in particular the costs of charging and the costs of charging and emerging electricity prices. Therefore, such analyses will be the subject of future work to determine and identify key factors for the implementation of electromobility development plans on the way to implementing the idea of sustainable development.

Author Contributions

Conceptualization, M.N. and W.L.; methodology, M.N. and W.L.; software, M.N. and W.L.; validation, M.N.; formal analysis, M.N. and W.L.; investigation, M.N. and W.L.; resources, M.N.; data curation, M.N., W.L. and E.S.-M.; writing—original draft preparation, M.N., W.L. and E.S.-M.; writing—review and editing, M.N., W.L. and E.S.-M.; visualization, M.N.; supervision, W.L. and M.N.; project administration, M.N. and W.L. funding acquisition, M.N., W.L. and E.S.-M. All authors have read and agreed to the published version of the manuscript.

Funding

This research was partially financed as part of a project implemented at the Faculty of Economics of the West Pomeranian University of Technology in Szczecin called “Green Lab. Research and Innovation”.

Data Availability Statement

Data are contained within the article.

Conflicts of Interest

The authors declare no conflict of interest.

References

  1. CNN. These Countries Want to Ban Gas and Diesel Cars. 2017. Available online: http://money.cnn.com/2017/09/11/autos/countries-banning-diesel-gas-cars/index.html (accessed on 12 April 2023).
  2. Hu, X.; Zhang, K.; Liu, K.; Lin, X.; Dey, S.; Onori, S. Advanced Fault Diagnosis for Lithium-Ion Battery Systems: A Review of Fault Mechanisms, Fault Features, and Diagnosis Procedures. IEEE Ind. Electron. Mag. 2020, 14, 65–91. [Google Scholar] [CrossRef]
  3. Institute of Transport Economics. Norwegian Centre for Transport Research. 2023. Available online: https://www.toi.no/ (accessed on 12 April 2023).
  4. Li, L.; Wang, Z.; Gao, F.; Wang, S.; Deng, J. A family of compensation topologies for capacitive power transfer converters for wireless electric vehicle charger. Appl. Energy 2020, 260, 114156. [Google Scholar] [CrossRef]
  5. Kim, H.; Park, K.-Y.; Hong, J.; Kang, K. All-graphene-battery: Bridging the gap between supercapacitors and lithium ion batteries. Sci. Rep. 2014, 4, 5278. [Google Scholar] [CrossRef] [PubMed]
  6. Park, J.; Kim, Y. Supervised-Learning-Based Optimal Thermal Management in an Electric Vehicle. IEEE Access 2020, 8, 1290–1302. [Google Scholar] [CrossRef]
  7. Rahman, I.; Vasant, P.M.; Singh, B.S.M.; Abdullah-Al-Wadud, M.; Adnan, N. Review of recent trends in optimization techniques for plug-in hybrid, and electric vehicle charging infrastructures. Renew. Sustain. Energy Rev. 2016, 58, 1039–1047. [Google Scholar] [CrossRef]
  8. Sendek-Matysiak, E.; Pyza, D.; Łosiewicz, Z.; Lewicki, W. Total Cost of Ownership of Light Commercial Electrical Vehicles in City Logistics. Energies 2022, 15, 8392. [Google Scholar] [CrossRef]
  9. Niekurzak, M. The Potential of Using Renewable Energy Sources in Poland Taking into Account the Economic and Ecological Conditions. Energies 2021, 14, 7525. [Google Scholar] [CrossRef]
  10. Małek, A.; Taccani, R. Innovative Approach to Electric Vehicle Diagnostics. Arch. Automot. Eng. Arch. Mot. 2021, 92, 49–67. [Google Scholar] [CrossRef]
  11. Qian, J.; Henderson, W.A.; Xu, W.; Bhattacharya, P.; Engelhard, M.; Borodin, O.; Zhang, J.G. High rate and stable cycling of lithium metal anode. Nat. Commun. 2015, 6, 6362. [Google Scholar] [CrossRef]
  12. Bhatti, A.R.; Salam, Z.; Aziz, M.J.B.A.; Yee, K.P.; Ashique, R.H. Electric vehicles charging using photovoltaic: Status and technological review. Renew. Sustain. Energy Rev. 2016, 54, 34–47. [Google Scholar] [CrossRef]
  13. Niekurzak, M.; Lewicki, W.; Drożdż, W.; Miązek, P. Measures for Assessing the Effectiveness of Investments for Electricity and Heat Generation from the Hybrid Cooperation of a Photovoltaic Installation with a Heat Pump on the Example of a Household. Energies 2022, 15, 6089. [Google Scholar] [CrossRef]
  14. Hu, J.; Morais, H.; Sousa, T.; Lind, M. Electric vehicle fleet management in smart grids: A review of services, optimization and control aspects. Renew. Sustain. Energy Rev. 2016, 56, 1207–1226. [Google Scholar] [CrossRef]
  15. Tran, M.-K.; Fowler, M. A Review of Lithium-Ion Battery Fault Diagnostic Algorithms: Current Progress and Future Challenges. Algorithms 2020, 13, 62. [Google Scholar] [CrossRef]
  16. Sbordone, D.; Bertini, I.; Di Pietra, B.; Falvo, M.C.; Genovese, A.; Martirano, L. EV fast charging stations and energy storage technologies: A real implementation in the smart microgrid paradigm. Electr. Power Syst. Res. 2015, 120, 96–108. [Google Scholar] [CrossRef]
  17. García-Álvarez, J.; González, M.A.; Vela, C.R. Metaheuristics for solving a real-world electric vehicle charging scheduling problem. Appl. Soft Comput. 2018, 65, 292–306. [Google Scholar] [CrossRef]
  18. Li, Y.; Liu, K.; Foley, A.M.; Zülke, A.; Berecibar, M.; Nanini-Maury, E.; Van Mierlo, J.; Hoster, H.E. Data-driven health estimation and lifetime prediction of lithium-ion batteries: A review. Renew. Sustain. Energy Rev. 2019, 113, 109254. [Google Scholar] [CrossRef]
  19. Shuai, W.; Maille, P.; Pelov, A. Charging electric vehicles in the smart city: A survey of economy-driven approaches. IEEE Trans. Intell. Transp. Syst. 2016, 17, 2089–2106. [Google Scholar] [CrossRef]
  20. Tan, K.M.; Ramachandaramurthy, V.K.; Yong, J.Y. Integration of electric vehicles in smart grid: A review on vehicle to grid technologies and optimization techniques. Renew. Sustain. Energy Rev. 2016, 53, 720–732. [Google Scholar] [CrossRef]
  21. Chan, C.C. The state of the art of electric, hybrid, and fuel cell vehicles. Proc. IEEE 2007, 95, 704–718. [Google Scholar] [CrossRef]
  22. Das, H.S.; Rahman, M.M.; Li, S.; Tan, C.W. Electric vehicles standards, charging infrastructure, and impact on grid integration: A technological review. Renew. Sustain. Energy Rev. 2020, 120, 109618. [Google Scholar] [CrossRef]
  23. Electric Car Use by Country. The Electric Vehicles World Sales Database. 2023. Available online: http://www.ev-volumes.com/ (accessed on 12 April 2023).
  24. Cheng, H.; Wang, L.; Xu, L.; Ge, X.; Yang, S. An Integrated Electrified Powertrain Topology With SRG and SRM for Plug-In Hybrid Electrical Vehicle. IEEE Trans. Ind. Electron. 2019, 67, 8231–8241. [Google Scholar] [CrossRef]
  25. Vasant, P.; Marmolejo, J.A.; Litvinchev, I.; Aguilar, R.R. Nature-inspired meta-heuristics approaches for charging plug-in hybrid electric vehicle. Wirel. Netw. 2019, 26, 4753–4766. [Google Scholar] [CrossRef]
  26. Habib, S.; Kamran, M.; Rashid, U. Impact analysis of vehicle-to-grid technology and charging strategies of electric vehicles on distribution networks—A review. J. Power Sources 2015, 277, 205–214. [Google Scholar] [CrossRef]
  27. Zhang, G.; Tan, S.T.; Wang, G.G. Real-Time Smart Charging of Electric Vehicles for Demand Charge Reduction at Non-Residential Sites. IEEE Trans. Smart Grid 2017, 9, 4027–4037. [Google Scholar] [CrossRef]
  28. Jing, W.; Yan, Y.; Kim, I.; Sarvi, M. Electric vehicles: A review of network modelling and future research needs. Adv. Mech. Eng. 2016, 8. [Google Scholar] [CrossRef]
  29. Sessa, S.D.; Crugnola, G.; Todeschini, M.; Zin, S.; Benato, R. Sodium nickel chloride battery steady-state regime model for stationary electrical energy storage. J. Energy Storage 2016, 6, 105–115. [Google Scholar] [CrossRef]
  30. Hawkins, T.R.; Gausen, O.M.; Strømman, A.H. Environmental impacts of hybrid and electric vehicles—a review. Int. J. Life Cycle Assess. 2012, 17, 997–1014. [Google Scholar] [CrossRef]
  31. Torres-Sanz, V.; Sanguesa, J.A.; Martinez, F.J.; Garrido, P.; Marquez-Barja, J.M. Enhancing the charging process of electric vehicles at residential homes. IEEE Access 2018, 6, 22875–22888. [Google Scholar] [CrossRef]
  32. Berjoza, D.; Jurgena, I. Effects of change in the weight of electric vehicles on their performance characteristics. Agron. Res. 2017, 15, 952–963. [Google Scholar]
  33. Mahmud, K.; Town, G.E.; Morsalin, S.; Hossain, M.J. Integration of electric vehicles and management in the Internet of Energy. Renew. Sustain. Energy Rev. 2018, 82, 4179–4203. [Google Scholar] [CrossRef]
  34. Blázquez Lidoy, J.; Martín Moreno, J.M. Eficiencia energética en la automoción, el vehículo eléctrico, un reto del presente. Econ. Ind. 2010, 377, 76–85. [Google Scholar]
  35. Liu, K.; Li, Y.; Hu, X.; Lucu, M.; Widanage, W.D. Gaussian Process Regression With Automatic Relevance Determination Kernel for Calendar Aging Prediction of Lithium-Ion Batteries. IEEE Trans. Ind. Inform. 2020, 16, 3767–3777. [Google Scholar] [CrossRef]
  36. Yong, J.Y.; Ramachandaramurthy, V.K.; Tan, K.M.; Mithulananthan, N. A review of the state-of-the-art technologies of electric vehicles, its impacts and prospects. Renew. Sustain. Energy Rev. 2015, 49, 365–385. [Google Scholar] [CrossRef]
  37. Lukic, S.; Pantic, Z. Cutting the Cord: Static and Dynamic Inductive Wireless Charging of Electric Vehicles. IEEE Electrif. Mag. 2013, 1, 57–64. [Google Scholar] [CrossRef]
  38. Albatayneh, A.; Assaf, M.N.; Alterman, D.; Jaradat, M. Comparison of the Overall Energy Efficiency for Internal Combustion Engine Vehicles and Electric Vehicles. Environ. Clim. Technol. 2020, 24, 669–680. [Google Scholar] [CrossRef]
  39. Liu, L.; Kong, F.; Liu, X.; Peng, Y.; Wang, Q. A review on electric vehicles interacting with renewable energy in smart grid. Renew. Sustain. Energy Rev. 2015, 51, 648–661. [Google Scholar] [CrossRef]
  40. Zhao-Karger, Z.; Fichtner, M. Magnesium–sulfur battery: Its beginning and recent progress. MRS Commun. 2017, 7, 770–784. [Google Scholar]
  41. Statista. Electric Vehicles Worldwide. Available online: https://0-www-statista-com.brum.beds.ac.uk/study/11578/electric-vehicles-statista-dossier/ (accessed on 12 April 2023).
  42. Newsweek. Electric Cars Only: California Bill Would Ban Gas-Powered Cars by 2040. 2017. Available online: http://www.newsweek.com/california-ban-gas-powered-cars-2040-740584 (accessed on 12 April 2023).
  43. Panchal, S.; Gudlanarva, K.; Tran, M.-K.; Fraser, R.; Fowler, M. High Reynold’s Number Turbulent Model for Micro-Channel Cold Plate Using Reverse Engineering Approach for Water-Cooled Battery in Electric Vehicles. Energies 2020, 13, 1638. [Google Scholar] [CrossRef]
  44. Jungst, R.G. Recycling of electric vehicle batteries. In Used Battery Collection and Recycling; Pistoia, G., Wiaux, J.P., Wolsky, S., Eds.; Elsevier: Amsterdam, The Netherlands, 2001; Volume 10, pp. 295–327. [Google Scholar]
  45. Richardson, D.B. Electric vehicles and the electric grid: A review of modelling approaches, Impacts, and renewable energy integration. Renew. Sustain. Energy Rev. 2013, 19, 247–254. [Google Scholar] [CrossRef]
  46. Jia, C.; He, H.; Zhou, J.; Li, K.; Li, J.; Wei, Z. A performance degradation prediction model for PEMFC based on bi-directional long short-term memory and multi-head self-attention mechanism. Int. J. Hydrogen Energy 2024, 60, 133–146. [Google Scholar] [CrossRef]
  47. Jia, C.; He, H.; Zhou, J.; Li, J.; Wei, Z.; Li, K. Learning-based model predictive energy management for fuel cell hybrid electric bus with health-aware control. Appl. Energy 2024, 355, 122228. [Google Scholar] [CrossRef]
  48. Dai, J.; Ludois, D.C. A Survey of Wireless Power Transfer and a Critical Comparison of Inductive and Capacitive Coupling for Small Gap Applications. IEEE Trans. Power Electron. 2015, 30, 6017–6029. [Google Scholar] [CrossRef]
  49. Adelhelm, P.; Hartmann, P.; Bender, C.L.; Busche, M.; Eufinger, C.; Janek, J. From lithium to sodium: Cell chemistry of room temperature sodium–air and sodium–sulfur batteries. Beilstein J. Nanotechnol. 2015, 6, 1016–1055. [Google Scholar] [CrossRef] [PubMed]
  50. Manshadi, S.D.; Khodayar, M.E.; Abdelghany, K.; Uster, H. Wireless Charging of Electric Vehicles in Electricity and Transportation Networks. IEEE Trans. Smart Grid 2018, 9, 4503–4512. [Google Scholar] [CrossRef]
  51. Małek, A.; Dudziak, A.; Stopka, O.; Caban, J.; Marciniak, A.; Rybicka, I. Charging Electric Vehicles from Photovoltaic Systems—Statistical Analyses of the Small Photovoltaic Farm Operation. Energies 2022, 15, 2137. [Google Scholar] [CrossRef]
  52. Sechilariu, M.; Molines, N.; Richard, G.; Martell-Flores, H.; Locment, F.; Baert, J. Electromobility Framework Study: Infrastructure and Urban Planning for EV Charging Station Empowered by PV-Based Microgrid. IET Electr. Syst. Transp. 2019, 9, 176–185. [Google Scholar] [CrossRef]
  53. Skrúcaný, T.; Kendra, M.; Stopka, O.; Milojević, S.; Figlus, T.; Csiszár, C. Impact of the Electric Mobility Implementation on the Greenhouse Gases Production in Central European Countries. Sustainability 2019, 11, 4948. [Google Scholar] [CrossRef]
  54. Dižo, J.; Blatnický, M.; Melnik, R.; Karľa, M. Improvement of Steerability and Driving Safety of an Electric Three-Wheeled Vehicle by a Design Modification of its Steering Mechanism. LOGI–Sci. J. Transp. Logist. 2022, 13, 49–60. [Google Scholar] [CrossRef]
  55. Madina, C.; Zamora, I.; Zabala, E. Methodology for Assessing Electric Vehicle Charging Infrastructure Business Models. Energy Policy 2016, 89, 284–293. [Google Scholar] [CrossRef]
  56. Szumska, E.; Skuza, A.; Jurecki, R. The Analysis of Energy Recovered by an Electric Vehicle during Selected Braking Manoeuvres. Arch. Automot. Eng. Arch. Mot. 2023, 99, 18–29. [Google Scholar] [CrossRef]
  57. LaMonaca, S.; Ryan, L. The State of Play in Electric Vehicle Charging Services—A Review of Infrastructure Provision, Players, and Policies. Renew. Sustain. Energy Rev. 2022, 154, 111733. [Google Scholar] [CrossRef]
  58. Černá, J.; Lejsková, P.; Ližbetinová, L.; Matúšová, J.G. Transformation of Marketing Macro-Economic Environment of Tourism with Emphasis on Changes in Mobility During COVID-19 Pandemic. LOGI—Sci. J. Transp. Logist. 2022, 13, 186–197. [Google Scholar] [CrossRef]
Figure 1. Dependence of charging time on charger power. Source: own.
Energies 17 01934 g001
Table 1. List of selected electric vehicles.
NoElectric Car ModelBattery Capacity,
KWh
Range,
km
Energy Consumption, kWh/100 km
1Nissan Leaf4027014.8
2BMW i34223018.3
3Renault Zoe5239513.2
4Tesla Model 35035414.1
5Mercedes EQS10760117.8
Source: based on data provided by vehicle dealers.
Table 2. Energy costs for the distance travelled, taking into account the cost of purchasing the station.
KmNissan Leaf, EURBMW i3,
EUR
Renault Zoe, EURTesla Model 3,
EUR
Mercedes EQS,
EUR
100752.19752.77751.93752.08752.69
1000773.96779.76771.53773.01779.11
10,000993.871051.60967.48982.331043.36
50,0001970.352259.001838.391912.622217.77
100,0003190.953768.362927.033075.483685.78
150,0004411.545277.514015.674238.355153.80
200,0005632.146786.765104.325401.226621.81
500,00012,955.7215,842.2711,636.1612,378.4115,429.91
Source: own.
Table 4. Energy costs per distance travelled for DC stations.
kmNissan Leaf, EURBMW i3,
EUR
Renault Zoe, EURTesla Model 3,
EUR
Mercedes EQS,
EUR
1007.289.026.506.958.77
100072.9290.16303.6069.4787.70
10,000729.19901.63650.36694.70877.00
50,0003645.944508.153251.783473.504384.98
100,0007291.889016.316503.576946.998769.96
150,00010,937.8213,524.469755.3510,420.4913,154.94
200,00014,583.7618,032.6213,007.1313,893.9817,539.92
500,00036,459.3945,081.5532,517.8434,734.9643,849.81
Source: own.
Table 5. Summary of charging costs for electric cars over a distance of 100,000 km.
Distance
100,000 km
Nissan LeafBMW i3Renault ZoeTesla 3Mercedes EQS
Charging at home, EUR3190.953768.262927.033075.483685.78
AC stations, EUR4755.575880.204241.674530.655719.54
DC stations, EUR7291.889016.316503.576946.998769.96
Savings of the station relative to AC, %4956454755
Savings of the station relative to DC, %129139122126138
Source: own.
Table 6. List of charging costs for electric cars over a distance of 200,000 km.
Distance
200,000 km
Nissan LeafBMW i3Renault ZoeTesla 3Mercedes EQS
Charging at home, EUR5632.146786.765104.325401.226621.81
AC stations, EUR9511.1511,760.408482.919061.2911,439.08
DC stations, EUR14,583.7618,032.6213,007.1313,893.9817,539.92
Savings of the station relative to AC, %6973666873
Savings of the station relative to DC, %159166155157165
Source: own.
Table 7. List of costs of using selected vehicles over a distance of 100,000 km.
Vehicle Type12345
Electric, EUR5632.146786.765104.325401.226621.81
Petrol, EUR13,960.3917,664.1712,820.7718,233.9820,513.23
Diesel, EUR10,826.438547.1813,105.6714,245.3016,524.55
Electric—Petrol, %148160151238210
Electric—Diesel, %9226157164150
Source: own.
Disclaimer/Publisher’s Note: The statements, opinions and data contained in all publications are solely those of the individual author(s) and contributor(s) and not of MDPI and/or the editor(s). MDPI and/or the editor(s) disclaim responsibility for any injury to people or property resulting from any ideas, methods, instructions or products referred to in the content.

