Iterative Auction for P2P Renewable Energy Trading with Dynamic Energy Storage Management


1
School of Energy and Power Engineering, Huazhong University of Science and Technology, Wuhan 430074, China
2
Department of Systems Science and Industrial Engineering, Binghamton University, Binghamton, NY 13902, USA
*
Author to whom correspondence should be addressed.
Energies 2020, 13(18), 4963; https://0-doi-org.brum.beds.ac.uk/10.3390/en13184963
Submission received: 11 August 2020
/
Revised: 4 September 2020
/
Accepted: 21 September 2020
/
Published: 22 September 2020
(This article belongs to the Section A1: Smart Grids and Microgrids)
Abstract
:In this paper, a peer-to-peer (P2P) renewable energy trading mechanism for microgrids when energy suppliers are equipped with storage devices is studied. A dynamic energy storage management strategy based on the local trading price is proposed and each supplier decides the amount of energy to be sold and stored in real time. An iterative auction algorithm is presented to obtain the market equilibrium and optimal energy allocation schedule. The economic analysis of introducing energy storage devices in this trading market is further studied. Numerical examples of two 7 × 24-h energy trading scenarios with 20 consumers and 20 solar energy producers are used to illustrate the feasibility of this proposed trading mechanism, with sensitivity analysis of different parameters on social welfare. A comparison of the hourly optimal local trading price of these two markets is demonstrated to explain the dynamic process. It is found that in those days with high solar radiation, compared with the market with no storage device, the total cost for buyers in the market when storage devices are used shows a decline of 1.52% and the total profit for sellers shows an increase of 1.27%, which leads to a substantial relative improvement of 118.94% in the overall social welfare. Moreover, a brief economic analysis shows that the advantage of using energy storage in this example is guaranteed after five years of operation. Longer operation time does not mean more benefits considering the deterioration of battery packs and increase of operation and maintenance costs, and the profit reaches its maximum value at the 15th year.
1. Introduction
A microgrid is a small-scale smart grid that integrates various advanced technologies such as distributed energy resources (DERs), energy storage systems (ESSs), demand side management (DSM), smart power electronics, and modern information and communication techniques [1]. It has emerged as a disruptive yet promising technology for future energy development [2]. Different from conventional energy systems that are characterized by centralized energy generation and unidirectional energy flows, a microgrid provides an open and flexible framework for developing and utilizing energy resources and facilitates the transformation of the current power grid from a centralized, producer-centered network to one that is more distributed and consumer-interactive [3,4]. Distributed energy suppliers (DESs) and end-users (EUs) within a microgrid can conduct peer-to-peer (P2P) energy trading directly and autonomously based on their personal preferences without the intervention of a third party, which increases the overall efficiency, reduces the operation cost, and brings benefits to the entire microgrid community.
However, unlike the top-down pricing model adopted by conventional energy systems, there still lacks an effective energy trading mechanism where energy suppliers and users can be actively involved in the trading process. The allocation of energy, price regulation, and dynamic decision making are still some challenges that need to be addressed. To this day, many efforts in these aspects have been made, and existing studies can be categorized into two groups: game theory-based and auction-based.
Game theory (cooperative and non-cooperative) has been recognized as a powerful mathematical tool in energy trading management for its ability to capture the possible outcomes and resulting equilibrium of competitive market participants [5]. A contribution-based energy trading mechanism was designed in [1], where the surplus energy was gathered and distributed to consumers based on their historical contribution level. The decision-making problem among the distributors and consumers was described as a non-cooperative game. An energy trading mechanism based on game theory was proposed in [6], where sellers set the selling price and buyers chose the best seller by considering energy price and transmission cost to minimize their energy bills. A coalitional game theory based on the asymptotic Shapley value to determine the electricity pricing schemes was proposed in [7]. The number of market participants and statistical demand and supply information were the only parameters required in their model, and simulation results validated the asymptotic analysis. An energy trading framework that modeled the decision-making process of electricity suppliers and consumers was presented in [8] with simulation results to verify the effectiveness of the proposed scheme. A cake-cutting game that discriminated the energy price among different EUs was proposed in [9]. Properties of the cake-cutting game and a socially optimal solution were studied and validated.
As an important non-cooperative game, the Stackelberg game in particular has been utilized to study the hierarchical interactions within a microgrid or among different microgrids by dividing the market participants into leaders and followers according to the sequence of their actions [10]. A non-cooperative Stackelberg game between residential units and a shared facility controller was discussed in [11], in which the shared facility controller worked as a leader to determine the buying price and residential units reacted in response to the buying price to optimize their payoffs. The existence of a strategy-proof and unique Stackelberg equilibrium was proven. A Stackelberg game in a DSM problem between utility companies and EUs that maximized the utility function of both sides was presented in [12]. A distributed algorithm that converges to the Stackelberg equilibrium with local information was further developed. The Stackelberg game can be further divided into the single-leader multi-follower model and the multi-leader multi-follower model based on the number of participants in the decision. A single-leader multi-follower Stackelberg game model for energy sharing management within microgrids was proposed in [13]. Ref. [14] presented a multi-leader multi-follower Stackelberg game model for real-time energy trading and simulation results showed the effectiveness of this model.
On the other hand, the auction-based theory has also been widely researched and utilized in fluctuant energy trading markets for solving energy trading problems among different participants without knowledge of the market parameters. The trading price and allocation of energy are real-time, market-based, and directly determined as long as the ask quotes match the bid quotes under preset conditions. A decentralized electricity trading model for microgrids that use the continuous double auction mechanism was discussed in [15]. Market participants adjusted their quotes continuously according to transaction outcomes that use adaptive aggressive strategy. A localized electricity trading model among plug-in hybrid electric vehicles (PHEVs) was proposed in [16]. The electricity trading price and quantity were determined based on an iterative double auction algorithm. Another decision-making process for PHEVs in a power market was studied in [17]. The trading price between the PHEVs and the smart grid was determined using a strategy-proof double auction. A real-time reverse auction game theory model for microgrid market operations was presented in [18]. A double auction mechanism for energy trading in microgrids between buying and selling agents was studied in [19].
The uncertainties brought by DERs may lead to a significant mismatch between energy supply and demand with the widespread deployment of these resources. For example, in a microgrid with photovoltaic (PV) solar panels, the energy supply is greatly influenced by many weather factors (solar irradiance, humidity, ambient and module temperature, wind speed and direction, longitude, and latitude) and the energy generation within the microgrid is not fixed at different time of the day. Any surplus or deficiency energy of the microgrid must be balanced by trading with the external main grid. To build a more self-sustaining microgrid, energy storage devices will be needed to store electricity for the future transaction when generation is abundant, instead of trading energy with the main grid [20,21]. Much work has been done to explore the active roles of storage devices in smart grids for reducing the peak-to-average ratio (PAR), balancing power supply and demand, and increasing the social welfare. An advanced battery model was proposed in [22] for a DSM program, where residential users played a scheduling game to lower their electricity costs, which resulted in the reduction of the PAR value of the aggregated neighborhood load. A novel approach for optimal allocation and economic operation of ESSs in microgrids was presented in [23] that uses the matrix real-coded genetic algorithm. The net present value was used to estimate the quality of optimization in different conditions. An energy-sharing controller based on a distributed ESS architecture was presented in [24]. Additionally, storage devices have also been adopted in the dynamic decision-making processes of energy trading to better the interests of market participants by balancing the amount of electricity to be traded and stored. A generalized treatment of storage in the DSM problem with a novel cost function was provided in [5]. The cost function was viewed as a generalization of more common quadratic and linear functions. Ref. [25] defined a novel utility function that captures the profits of buying/selling energy at the current known price and uncertain future profits from selling stored energy. A Stackelberg game was further formulated and the prospect theory was used to model the subjective behavior. A modified auction-based mechanism was designed and used in [26] to assist residential units in storing electricity with real-time auction price and energy storage allocation. A non-cooperative game between storage units was formulated in [27] and each supplier decided the amount of energy to sell to maximize its own profit. An advanced retail electricity market for the optimal operation of home microgrids within active distribution networks was proposed in [28], where storage devices were accommodated.
In general, the papers that study storage devices in energy trading management always introduce a utility function, mostly quadratic, linear, or logarithmic, to approximately evaluate future economic benefits of stored energy in the dynamic decision process. The optimal energy allocations to be stored and sold are calculated through the game process between energy suppliers and EUs. However, market parameters cannot be accurately obtained in advance in reality due to the highly variable nature of many components in the microgrid energy trading markets, which challenges the effective management of energy storage devices. Furthermore, market participants may be reluctant to publicly disclose their trading preferences due to privacy concerns. To address the above-mentioned issues, this paper studies an energy trading mechanism for a microgrid when energy suppliers are equipped with storage devices. A dynamic energy storage management strategy based on the local trading price is proposed and each supplier decides the amount of energy to be sold and stored in real time. An iterative auction algorithm is further presented to obtain the market equilibrium and the optimal energy allocation schedule. The economic analysis of introducing energy storage devices in this trading market is further studied. Numerical examples are used to illustrate the feasibility of this proposed trading mechanism and economic advantages of the introduction of energy storage devices. The effects of different parameters on social welfare are also demonstrated, together with a brief economic analysis of the introduction of energy storage devices in microgrids energy trading and a comparative analysis with other works.
The main contribution of this paper are in three parts:
- (1)
- A dynamic energy storage management strategy based on the local trading price is proposed.
- (2)
- An iterative auction algorithm is presented to obtain the market equilibrium and the optimal energy allocation schedule.
- (3)
- Economic analysis of using energy storage devices in trading market is further studied.
The rest of this paper is organized as follows: In Section 2, the system model of P2P renewable energy trading with storage devices is presented in detail. Section 3 depicts a specific example to illustrate the application of the approach in the real world. The conclusions and future work are provided in Section 4.
2. System Model
In this section, the system model of P2P microgrid renewable energy trading with storage devices is discussed in detail, which includes the dynamic energy storage management strategy, iterative auction algorithm, and economic analysis.
2.1. Microgrid Renewable Energy Trading
We consider a P2P renewable energy trading microgrid that consists of multiple DESs and EUs, where DESs can sell the electricity they generate directly to EUs to meet their demand. Each participant is equipped with a smart meter and a communication unit to monitor and forecast energy production/consumption in real time and implement the information exchange with each other. We assume that the prediction of generation and demand in the next time slot is reasonably accurate.
Let and denote the sets of sellers and buyers, respectively, within the microgrid trading market. The trading period is divided into a total of T time slots, with a resolution of one hour. For each seller and each buyer , the amounts of energy generation and demand at each time slot t ≤ T are and , respectively. In this paper, we investigate a scenario that does not interrupt the habits of the consumers, who will not curb their own electricity demand to save costs. Instead, each seller i owns an energy storage device of capacity Qmax,i and the initial stored energy at each time slot t is . The introduction of storage devices enables the sellers to adjust the amount of energy to be traded based on their personal preferences. The charging/discharging efficiency of storage devices is assumed to be 100% in this paper.
Sellers and buyers can conduct direct local transactions within the microgrid; they can also trade with the main grid. The energy sold from seller i to buyer j at time t is and the corresponding trading price is . Any surplus or deficiency is balanced by trading electricity with the main grid at the wholesale price (feed-in tariff) fout (the superscript “out” means this is an outflow from the perspective of the microgrid) or retail price (current electricity price) fin (the superscript “in” means this is an inflow from the perspective of the microgrid), where fout < fin.
The total profit of seller i to sell its energy at time t is
where is the actual supply amount (from generation and/or storage) in a trading process for seller i at time slot t, which is subject to
Equation (2) represents operational constraints of storage devices with the minimum and maximum values of the actual supply amount. To simplify the subsequent analytical and simulation process, the rare case that some sellers may become buyers at one time slot with huge energy storage needs is not considered in this paper. Thus, the actual supply of a seller shall not be negative, as shown in Equation (3).
Similarly, the total cost of buyer j to meet its energy demand at time t is
From a global perspective, the social welfare (defined as the total benefit of this microgrid trading with main grid, subtracting from ) of the whole microgrid at time t is
subject to
A positive social welfare value indicates that the microgrid sells surplus electricity after local trading to the main grid for profits, while a negative value shows deficiency within the microgrid after local trading. The maximal social welfare is achieved when the optimal allocation of energy ensures the maximal self-consumption () in the local market during any time slot t.
To enable the energy suppliers and consumers to be actively involved in the microgrid energy trading process, the double auction algorithm is introduced to obtain the local trading price and reasonable energy allocation, where the auctioneer sorts the quotes from each agent (seller/buyer) in an order book based on the “price-first and time-first” principle with the ask (i.e., selling) quotes from low to high and the bid (i.e., buying) quotes from high to low [29]. A transaction occurs when the highest price of bids is greater or equal to the lowest price of asks [15].
The linear approximations of the demand and supply curves in a microgrid with a sufficiently large number of sellers and buyers’ separate matching process are presented in Figure 1 [30]. The middle point that is marked by a black dot is the equilibrium point of the market where the last local transaction occurs. The equilibrium price is the clearing price (the local trading price ), and the equilibrium quantity is the clearing quantity (the total amount of local transactions, which is equal to mentioned above), solved as
Any surplus or deficiency in microgrid is balanced by trading electricity with the main grid. Thus, the total profit sellers within the microgrid can earn at time t is
The total cost buyers within the microgrid should pay at time t is
The social welfare of the whole microgrid at time t is
A proportional sharing-based distribution scheme is further introduced here, which states the profit/cost a seller/buyer can earn/pay is totally proportional to the energy it supplies/demands. Therefore, Equations (1) and (4) are transformed into
From Equation (9) we can see that the local trading price (i.e., the equilibrium price) lies between the wholesale price and the retail price under the condition fout < fin, which ensures both sellers and buyers can obtain monetary benefits from local energy trading within the microgrid. However, the value of greatly relies on the total supply and total demand . During hours when residential electricity consumption is relatively low compared to the solar energy generation (e.g., 10 a.m. to 6 p.m.), the total energy supply in the microgrid is greater than the total demand, which results in a small local trading price; this is the other way around when electrical appliances are largely used (e.g., 6 p.m. to 11 p.m.). The local trading price can be seen as a good measure for the market energy supply and demand.
For energy sellers with storage devices, they can choose to store electricity when the supply is sufficient and use that energy to supply EUs when there is great demand in the market to better their profits. However, the future profits in a fluctuant market are uncertain and the impact of sacrificing current interests in exchange for longer-term returns should be carefully justified, together with specified management strategies. A dynamic energy storage management strategy based on the local trading price is presented and discussed below in Section 2.2.
2.2. Dynamic Energy Storage Management Strategy
We define an intermediate variable to represent the operation condition of battery storage for seller i at time t, which is the difference between the actual supply amount and energy generation, given as
subject to
A positive value of indicates a discharging state of the battery, while a negative value shows a charging state. Energy sellers with storage devices can adjust their amount of energy supply in the trading process by controlling the charging/discharging volume based on the local trading price to better their profits. When the market supply is greater than the demand and the local trading price is relatively low, sellers can choose to store energy for future trading and the intermediate variable is negative. Similarly, sellers can increase the supply of energy when there is great demand in the market with a large local trading price and the intermediate variable is positive. Therefore, charging/discharging volume for seller i at time t can be recognized as a piece-wise function of the local trading price , shown as
where is the discharging threshold and is the charging threshold for seller i under the condition
The intermediate state is when the total supply equals the total demand in the market and the local trading price is .
As the local trading price increases, the desire to discharge the battery increases and the charging decreases. If the local trading price lies between the discharging threshold and charging threshold, the function is considered to be in the marginal position and equals zero. Therefore, the function is non-decreasing, convex in the discharging interval and concave in the charging interval. Mathematically,
In this paper, a piece-wise quadratic function is introduced to describe the charging/discharging function with the extreme point at (pchar, 0) and (pdisc, 0), shown in Figure 2. Additionally, when the local trading price is fin or fout, the discharging or charging volume reaches its maximum value Qmax,i.
The expression of the piece-wise quadratic charging/discharging function can be derived
From Equations (2), (3) and (16), we can further have
To obtain the market equilibrium and the optimal energy allocation schedule, an iterative auction algorithm is proposed that does not require the agents to have much knowledge about the market or other participants. In a microgrid energy trading market, once the market is open for the next time slot energy trading, each agent submits its initial quote to the auctioneer. The initial local trading price is obtained, together with the profit and cost for seller i and buyer j, respectively. Seller i with a storage device can get the charging/discharging volume based on Equations (22) with the constrains (23) and (24) to adjust the amount of energy it supplies. The dynamic adjustment processes of demand and supply curves with a small/large local trading price are presented in Figure 3. These new allocations together with the local trading price as well as the profit and cost in the n th iteration are announced back to sellers and buyers. The iterative auction Algorithm 1 will terminate if the newest local trading price satisfies the convergence criteria or the iteration number exceeds the predefined maximum value.
| Algorithm 1. Iterative Auction Algorithm |
| 1: Initialization: nmax, ε, . 2: Input Set of sellers S, set of buyers B, and their initial supply/demand, ask/bid. 3: While the market is open for the next time slot energy trading Do 4: Allocation of energy in the order book with , and . 5: If and n ≤ nmax, Then 6: Sellers adjust and resubmit their quotes based on Equations (22) with the constrains (23) and (24). 7: . 8: Else 9: Break 10: End If 11: End While 12: Output: Allocation of energy, local trading price, total cost, total profit, overall social welfare |
2.3. Economic Analysis
In this section, a brief economic analysis of the introduction of energy storage devices in microgrids energy trading is conducted to explain profitable incomes of energy sellers and buyers with purchase and operation costs of storage devices.
Let and denote the social welfare of the microgrid with/without energy storage devices at time t, respectively. Thus, the economic benefit of using energy storage in energy trading markets can be obtained as
It is clear that the performance of energy storage equipment gradually decreases with the increase of operation time (mainly reflected in the gradual decrease of the charging/discharging efficiency, which is previously assumed to be 100% in this paper). A parameter is introduced here to comprehensively reflect the impact of degradation, and the total economic benefit over a long period of time is modified as
where η(t) is a time-based, decreasing, and concave function between 0 and 1, which indicates negative impacts of device degradation on social welfare of the microgrid.
On the other hand, the total cost of introducing the energy storage devices consists of the purchase cost CP and routine operation and maintenance cost , given as
The purchase cost CP is determined by energy storage demands in the microgrid (mainly the maximum storage capacity) and the routine operation and maintenance cost is related to the maintenance actions taken and initial purchase cost. The longer the service age is, the greater the difficulty of operation and maintenance are. Usually, the routine operation and maintenance cost can be estimated as a proportion of the purchase cost with a parameter function and the total cost is transformed into
where α(t) is a time-based, non-negative increasing function, which represents the fact that the operation and maintenance cost increases year by year with degradation of devices and increase of operation and maintenance difficulty.
The economic analysis of introduction of energy storage devices can be realized by obtaining the estimation of parameter functions (η(t) and α(t)) through the analysis of battery degradation and operation and maintenance data, and acquiring the long-term evaluation of economic benefit and costs with microgrid energy trading simulation results.
3. Numerical Examples
3.1. Case Description
In this section, we consider a P2P renewable energy trading microgrid to evaluate the feasibility of this proposed trading mechanism based on a real database from the Smart* Project [31] of the University of Massachusetts, Amherst, USA. The data contains minute-level electricity usage information from over 400 anonymous homes with solar generation data. Forty agents (20 consumers and 20 producers) are included in this market. The wholesale price fout is 21.8 ¢/kWh (cents per kilowatt hour) and the retail price fin is 33.2 ¢/kWh. Each producer is equipped with a storage battery with a maximum capacity of 500 kWh. To simplify the simulation process, the discharging threshold and charging threshold are set to be the same for all sellers with the value of 29 ¢/kWh and 26 ¢/kWh, respectively. The convergence threshold ε is 10−4 and the maximal iteration number nmax is 40. Two 7 × 24-h energy trading scenarios with different lighting conditions are simulated based on the above algorithm and parameter settings, which use real power consumption and generation data from the Smart* Project. The total generation and consumption data of the 40 agents for these two 7 × 24-h periods are represented in Figure 4 with different irradiation.
Figure 5a shows the convergence evolution of local trading price achieved by the Iterative Auction Algorithm for 12 noon energy trading on 1 February 2016 when the solar radiation is extremely intense and the total generation is larger than total demand in local grid, and Figure 5b is the comparison of total profit for sellers, the total cost for buyers and social welfare over the iteration. It can be noted that the local trading price rapidly converges close to the optimal one after 36 iterations when the value is 9.65 × 10⁻⁵, together with the total cost for buyers, total profit for sellers and social welfare. This trading scenario at 12 noon is an example trading scenario when residential electricity consumption is low and the total energy supply in the microgrid is greater than the total demand. Energy sellers tend to store the energy generated, and the local trading price gradually increases over the iteration. The trading volume for sellers is decreasing as shown in Figure 3a with a small local trading price, which results in a gradual reduction of the total profit for sellers. On the other hand, the total cost for buyers is increasing with an increase in trading price.
A further comparison of the hourly optimal local trading price of these two markets with different irradiation values are demonstrated in Figure 6, which represent similar tendency. Specially, in the market with no storage device used, a distinct U-shape curve of the optimal local trading price is displayed for every day in the seven-day period, which illustrates the obvious impact of renewable energy on the trading market. During the daytime when the solar radiation intensity is high, the total energy generation is greater than the demand, which leads to a relatively low local trading price that approaches the wholesale price of 21.8 ¢/kWh. The local trading price is equal to the retail price of 33.2 ¢/kWh at dark when this microgrid can only be served by the main grid. However, the use of energy storage devices, which sellers can choose to store electricity when the supply is sufficient and use that energy for future trading, helps to moderate the fluctuant market with a less sharp curve of the optimal local trading price. Specifically, the blue line is higher than the red line during the daytime, because sellers with storage devices start to store part of the generated energy when the charging threshold (26 ¢/kWh in this case) is reached. The sharp drop in the blue line near 8 p.m. everyday represents the trigger of discharging strategy when the threshold (29 ¢/kWh in this case) is met.
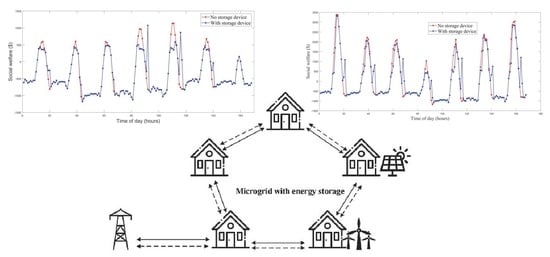
To illustrate the economic advantages of the introduction of energy storage devices in energy trading, a comparison of 7 × 24-h simulation results of two markets with different irradiation values are shown in Figure 7. The stored energy for each seller at the start and end of this trading scenario is both zero, which provides a premise of fair comparison. The effects of the energy storage devices on the social welfare in Figure 7 are similar to those on the optimal local trading price in Figure 6.
The summary of the results of these two 7 × 24-h simulation scenarios are presented in Table 1. In the scenario when the solar radiation intensity is high, the total cost for buyers shows a decline of 1.52% in the market with storage devices, compared to that when no storage device is used. Meanwhile, the total profit for sellers shows an increase of 1.27%, leading to a substantial relative improvement of 118.94% in social welfare. It is quite clear that the introduction of energy storage devices brings benefits to both sides of the trading market. In contrast, the economic advantage is not obvious in the scenario with low irradiation values when the solar power generation cannot meet the electricity demand in this local grid. It can be easily deduced that the solar power is consumed immediately once produced in most cases and storage devices have no proper chance to play their due roles, as shown in Figure 6a and Figure 7a that polylines are mostly overlapping with/without storage devices. The results of this comparison also illustrate effects of the number of users actively participating in the auction system, number and installed capacity of PV systems on the economic advantage from the side. In microgrids with more energy demand (the number of users is large), the economic advantage is relatively lower. However, in microgrids with larger number or installed capacity of PV systems, the role of energy storage devices is reflected to the greatest extent to balance power supply and demand, and increase the social welfare.
3.2. Sensitivity Analysis
In this section, the effects of different parameters on the social welfare of the market with energy storage devices are presented using the 7 × 24-h simulation scenario with high irradiation values described above.
Figure 8 illustrates the effects of the maximum capacity of energy storage on the social welfare of the trading market for 12 noon energy trading on 1 February 2016. Specially, the point with a zero maximum capacity corresponds to the case where the energy storage device is not considered. Initially, the social welfare increases rapidly as the maximum capacity increases, which shows the economic advantages of the use of storage devices. However, after a certain point, further increases in the maximum capacity do not lead to more economic benefits but have the opposite effects. It is mainly because the charging/discharging volume for each seller in one decision process is related to the maximum capacity of the storage battery with which it is equipped while the energy generated is fixed. An excessive value of the maximum capacity means that sellers tend to store most of the generated energy in the daytime and release it when residential electricity consumption is low. The energy generated within the microgrid is not supplied to EUs preferentially, which lowers the total amount of local transactions and social welfare.
Furthermore, the joint effects of the charging and discharging thresholds on social welfare are presented in Figure 9. The point with the maximum value of the discharging threshold and minimum charging threshold corresponds to the case where the energy storage device is not considered. The optimal discharging threshold and charging threshold are both 27.5 ¢/kWh in this example, which is the average of fout and fin (21.8 ¢/kWh and 33.2 ¢/kWh, respectively).
3.3. Economic Analysis
Specially, a long period of one year energy trading simulation with 40 agents (20 consumers and 20 producers) presented above is implemented from 1 February 2016 to 31 January 2017 as a reference. Figure 10 presents the weekly economic benefit of this trading market over one year and OY axis refers to the system without energy storage devices. The changing curve shows significant periodicity and volatility that the economic benefit is relatively higher in summer/autumn than that in winter/spring. Two continuous zero points are seen in the 14th and 15th week when the solar panel power generation system was shut down for routine operation and maintenance according to maintenance log.
Moreover, a real and specific energy storage device, made up of several rechargeable lithium iron phosphate battery packs is presented here, with the cycle life over 3000 times, nominal voltage of 48 V, electric quantity of 100 kWh and boundary dimension of 600 mm × 600 mm × 1400 mm. More detailed information can be seen in [32] and the purchase cost for each device is priced at $20,000.
An exponential parameter factor is introduced here as η(t) = 0.95t to present negative impacts of device degradation on social welfare and a linear function α(t) = 0.05 + 0.005t is used to approximately calculate the operation and maintenance cost over time, where t is the operation time in years. The total economic benefit of using energy storage devices and its corresponding cost over operation time are presented in Figure 11. The total economic benefit of using energy storage devices and corresponding cost both gradually increases with the growth of operation time but at different rates. An intersection point appears after about five years of operation when the economic benefit offsets the purchase and routine operation and maintenance costs, which means that the introduction of energy devices is not profitable if the number of charging cycles reached the maximum value and operation year is below the intersection point. After that, the economic benefit curve is above the cost curve and the maximum separation is reached at 15th year. Longer operation time does not generate more revenue because of battery degradation and equipment aging; thus, the total cost converges towards the total economic benefit. The deviation curve (the difference between total economic benefit and cost) demonstrates the above relations visually and intuitively.
In summary, the profit of use of energy storage in this example is guaranteed after five years of operation and reaches its maximum value at the 15th year by comparing the economic benefit curve and cost curve. When the operating time further increases, the profit will gradually decline considering the decrease of the charging/discharging efficiency and increase of routine operation and maintenance cost.
3.4. Comparative Analysis
In exiting papers that study storage devices in energy trading [5,25,26,27,28], the total profit of energy seller is composed of two main parts, revenue from trading energy with buyers and profits from energy stored, which is usually described by a quadratic, linear, or logarithmic function, shown as [25]
where is the proportion of energy for trading, is the total generated energy, is the transaction price, is the utility function of stored energy, and η is the adjustment factor. The optimal energy allocations to be stored and sold (reflected in ) are calculated through the game process between energy sellers and buyers by maximizing total profit. It is easy to understand that the second term of the above formula is a rough estimate of returns in future energy trading markets. However, as stated above, market parameters cannot be accurately obtained in advance in reality due to the highly variable nature of many components in the microgrid energy trading markets. The adjustment factor η is constantly changing and cannot be accurately assessed, which challenges the effective management of energy storage devices. Furthermore, market participants may be reluctant to publicly disclose their trading preferences due to privacy concerns and parameters, such as and are not easy to get.
In this paper, the total profit of seller i to sell its energy at time t is defined in Equation (1), including direct local transactions within the microgrid and trading with the main grid. The introduction of energy storage devices helps sellers to adjust the amount of energy to be traded. A dynamic energy storage management strategy is proposed and each supplier decides the amount of energy to be sold and stored in real time based on the local trading price. Compared with models proposed, no private information is further needed and the profit is an accurate value for real-time evaluation.
4. Conclusions
In this paper, a P2P renewable energy trading mechanism for microgrids when energy suppliers are equipped with storage devices is studied. A dynamic energy storage management strategy based on the local trading price is proposed and each supplier decides the amount of energy to be sold and stored in a time slot. An iterative auction algorithm is presented to obtain the market equilibrium and optimal energy allocation schedule. The economic analysis of introducing energy storage devices in this trading market is further studied. Two 7 × 24-h energy trading scenarios with 20 consumers and 20 solar energy producers are simulated using real power consumption and generation. A comparison of the hourly optimal local trading price of these two markets is further demonstrated. In those days with high solar radiation intensity, compared with the market with no storage device, the total cost for buyers in the market when storage devices are used shows a decline of 1.52% and the total profit for sellers shows an increase of 1.27%, which leads to a substantial relative improvement of 118.94% in the overall social welfare. However, the economic advantage is not obvious in the scenario with low irradiation values for the reason that the solar power is consumed immediately once produced in most cases and storage devices have no proper chance to play their due roles. Moreover, the effects of the maximum capacity of the battery and discharging/charging threshold on the social welfare of the market with energy storage devices are also presented. It is found that the social welfare increases rapidly as the maximum capacity increases in the beginning, while after a certain point, further increases in the maximum capacity do not lead to more economic benefits but have the opposite effects. The optimal discharging threshold and charging threshold is 27.5 ¢/kWh respectively in the rendered trading scenario. A brief economic analysis of the introduction of energy storage devices in microgrids energy trading is further conducted with a one-year energy trading simulation from 1 February 2016 to 31 January 2017 as a reference, and a real and specific energy storage device made up of several rechargeable lithium iron phosphate battery packs. An exponential parameter factor is introduced to present negative impacts of device degradation on social welfare and a linear function is used to approximately calculate the operation and maintenance cost over time. In the example presented, the profit of use of energy storage in this example is guaranteed after five years of operation and reaches its maximum value at the 15th year by comparing the economic benefit curve and cost curve. When the operating time further increases, the profit will gradually decline considering the decrease of the charging/discharging efficiency and increase of routine operation and maintenance cost. At last, a comparative analysis of model proposed in this paper with other works is illustrated.
It should be clarified that the simulation results discussed above are strongly related to the trading scenarios we chose. To provide guidance for microgrids trading market participants, a broader sample of data needs to be adopted, and this will be one of our future research efforts. More detailed and precise economic analysis of the introduction of energy storage devices in microgrids energy trading could also be another relevant research extension of this paper.
Author Contributions
Conceptualization, C.Z. and Y.W.; Methodology, C.Z.; Validation, Y.W. and T.Y.; Formal Analysis, Y.W.; Resources, T.Y.; Data Curation, Y.W.; Writing—Original Draft Preparation, C.Z.; Writing—Review & Editing, Y.W.; Supervision, T.Y.; Funding Acquisition, T.Y. All authors have read and agreed to the published version of the manuscript.
Funding
This research received no external funding.
Conflicts of Interest
The authors declare no conflict of interest.
References
- Park, S.; Lee, J.; Bae, S.; Hwang, G.; Choi, J. Contribution based energy trading mechanism in micro-grids for future smart grid: A game theoretic approach. IEEE Trans. Ind. Electron. 2016, 63, 4255–4265. [Google Scholar] [CrossRef]
- Lee, J.; Guo, J.; Choi, J.K.; Zukerman, M. Distributed Energy Trading in Microgrids: A Game-Theoretic Model and Its Equilibrium Analysis. IEEE Trans. Ind. Electron. 2015, 62, 3524–3533. [Google Scholar] [CrossRef]
- Zhou, Z.; Xiong, F.; Huang, B.; Xu, C.; Jiao, R.; Liao, B.; Yin, Z.; Li, J. Game-Theoretical Energy Management for Energy Internet with Big Data-Based Renewable Power Forecasting. IEEE Access 2017, 5, 5731–5746. [Google Scholar] [CrossRef]
- Cui, T.; Wang, Y.; Nazarian, S.; Pedram, M. An Electricity Trade Model For microgrid Communities in Smart Grid. In Proceedings of the Innovative Smart Grid Technologies Conference, Istanbul, Turkey, 12–15 October 2014; pp. 1–5. [Google Scholar]
- Soliman, H.M.; Leon-Garcia, A. Game-Theoretic Demand-Side Management with Storage Devices for the Future Smart Grid. IEEE Trans. Smart Grid 2014, 5, 1475–1485. [Google Scholar] [CrossRef]
- Yaagoubi, N.; Mouftah, H.T. Energy trading in the smart grid: A distributed game-theoretic approach. Can. J. Electr. Comput. Eng. 2017, 40, 57–65. [Google Scholar]
- Lee, W.; Xiang, L.; Schober, R.; Wong, V.W.S. Direct Electricity Trading in Smart Grid: A Coalitional Game Analysis. IEEE J. Sel. Areas Commun. 2014, 32, 1398–1411. [Google Scholar] [CrossRef]
- Zhang, B.; Jiang, C.; Yu, J.-L.; Han, Z. A Contract Game for Direct Energy Trading in Smart Grid. IEEE Trans. Smart Grid 2018, 9, 2873–2884. [Google Scholar] [CrossRef]
- Tushar, W.; Yuen, C.; Smith, D.B.; Poor, H.V. Price Discrimination for Energy Trading in Smart Grid: A Game Theoretic Approach. IEEE Trans. Smart Grid 2017, 8, 1790–1801. [Google Scholar] [CrossRef]
- Wei, F.; Jing, Z.; Wu, P.Z.; Wu, Q. A Stackelberg game approach for multiple energies trading in integrated energy systems. Appl. Energy 2017, 200, 315–329. [Google Scholar] [CrossRef]
- Tushar, W.; Chai, B.; Yuen, C.; Smith, D.B.; Wood, K.L.; Yang, Z.; Poor, H.V. Three-Party Energy Management with Distributed Energy Resources in Smart Grid. IEEE Trans. Ind. Electron. 2014, 62, 2487–2498. [Google Scholar] [CrossRef] [Green Version]
- Maharjan, S.; Zhu, Q.; Zhang, Y.; Gjessing, S.; Başar, T. Dependable Demand Response Management in the Smart Grid: A Stackelberg Game Approach. IEEE Trans. Smart Grid 2013, 4, 120–132. [Google Scholar] [CrossRef]
- Liu, N.; Yu, X.; Wang, C.; Wang, J. Energy Sharing Management for Microgrids With PV Prosumers: A Stackelberg Game Approach. IEEE Trans. Ind. Inform. 2017, 13, 1088–1098. [Google Scholar] [CrossRef]
- Paudel, A.; Chaudhari, K.; Long, C.; Gooi, H.B. Peer-to-Peer Energy Trading in a Prosumer-Based Community Microgrid: A Game-Theoretic Model. IEEE Trans. Ind. Electron. 2018, 66, 6087–6097. [Google Scholar] [CrossRef]
- Wang, J.; Wang, Q.; Zhou, N.; Chi, Y. A Novel Electricity Transaction Mode of Microgrids Based on Blockchain and Continuous Double Auction. Energies 2017, 10, 1971. [Google Scholar] [CrossRef] [Green Version]
- Kang, J.; Yu, R.; Huang, X.; Maharjan, S.; Zhang, Y.; Hossain, E. Enabling Localized Peer-to-Peer Electricity Trading Among Plug-in Hybrid Electric Vehicles Using Consortium Blockchains. IEEE Trans. Ind. Inform. 2017, 13, 3154–3164. [Google Scholar] [CrossRef]
- Saad, W.; Han, Z.; Poor, H.V.; Başar, T. A Noncooperative Game for Double Auction-Based Energy Trading between PHEVs and Distribution Grids. In Proceedings of the 2011 IEEE International Conference on Smart Grid Communications (SmartGridComm), Brussels, Belgium, 17–20 October 2011; pp. 267–272. [Google Scholar]
- Cintuglu, M.H.; Martin, H.; Mohammed, O.A. Real-Time Implementation of Multiagent-Based Game Theory Reverse Auction Model for Microgrid Market Operation. IEEE Trans. Smart Grid 2015, 6, 1064–1072. [Google Scholar] [CrossRef]
- Majumder, B.P.; Faqiry, M.N.; Das, S.; Pahwa, A. An Efficient Iterative Double Auction for Energy Trading in Microgrids. In Proceedings of the 2014 IEEE Symposium on Computational Intelligence Applications in Smart Grid (CIASG), Orlando, FL, USA, 9–12 December 2014; pp. 1–7. [Google Scholar]
- Mondal, A.; Misra, S.; Obaidat, M.S. Distributed Home Energy Management System with Storage in Smart Grid Using Game Theory. IEEE Syst. J. 2015, 11, 1857–1866. [Google Scholar] [CrossRef]
- Nguyen, H.K.; Song, J.B.; Han, Z. Distributed Demand Side Management with Energy Storage in Smart Grid. IEEE Trans. Parallel Distrib. Syst. 2014, 26, 3346–3357. [Google Scholar] [CrossRef]
- Pilz, M.; Al-Fagih, L.; Pfluegel, E. Energy Storage Scheduling with an Advanced Battery Model: A Game–Theoretic Approach. Inventions 2017, 2, 30. [Google Scholar] [CrossRef] [Green Version]
- Chen, C.; Duan, S.; Cai, T.; Liu, B.; Hu, G. Optimal Allocation and Economic Analysis of Energy Storage System in Microgrids. IEEE Trans. Power Electron. 2011, 26, 2762–2773. [Google Scholar] [CrossRef]
- Huang, W.; Qahouq, J.A.A. Energy Sharing Control Scheme for State-of-Charge Balancing of Distributed Battery Energy Storage System. IEEE Trans. Ind. Electron. 2014, 62, 2764–2776. [Google Scholar] [CrossRef]
- El Rahi, G.; Etesami, S.R.; Saad, W.; Mandayam, N.B.; Poor, H.V. Managing Price Uncertainty in Prosumer-Centric Energy Trading: A Prospect-Theoretic Stackelberg Game Approach. IEEE Trans. Smart Grid 2019, 10, 702–713. [Google Scholar] [CrossRef] [Green Version]
- Tushar, W.; Chai, B.; Yuen, C.; Huang, S.; Smith, D.B.; Poor, H.V.; Yang, Z. Energy Storage Sharing in Smart Grid: A Modified Auction-Based Approach. IEEE Trans. Smart Grid 2016, 7, 1462–1475. [Google Scholar] [CrossRef] [Green Version]
- Wang, Y.; Saad, W.; Han, Z.; Poor, H.V.; Başar, T. A Game-Theoretic Approach to Energy Trading in the Smart Grid. IEEE Trans. Smart Grid 2014, 5, 1439–1450. [Google Scholar] [CrossRef] [Green Version]
- Marzband, M.; Javadi, M.; Pourmousavi, S.A.; Lightbody, G. An advanced retail electricity market for active distribution systems and home microgrid interoperability based on game theory. Electr. Power Syst. Res. 2018, 157, 187–199. [Google Scholar] [CrossRef]
- Vytelingum, P.; Ramchurn, S.D.; Voice, T.D.; Rogers, A. Trading Agents for the Smart Electricity Grid. In Proceedings of the International Conference on Autonomous Agents & Multiagent Systems, International Foundation for Autonomous Agents and Multiagent Systems, Toronto, ON, Canada, 10–14 May 2010; Volume 1, pp. 897–904. [Google Scholar]
- Lam, A.Y.S.; Huang, L.; Silva, A.; Saad, W. A Multi-Layer Market for Vehicle-to-Grid Energy Trading in the Smart Grid. In Proceedings of the 2012 Proceedings IEEE INFOCOM Workshops, Orlando, FL, USA, 25–30 March 2012; pp. 85–90. [Google Scholar]
- Smart* Data Set for Sustainability. Available online: http://traces.cs.umass.edu/index.php/Smart/Smart (accessed on 10 June 2019).
- GreenBatt Rechargeable Lithium Iron Phosphate Battery Packs. Available online: https://b2b.baidu.com/land?url=https%3A%2F%2Fwww.china.cn%2Fxudianchi%2F4058648339.html%3Fbdb2b8a2d%3D2444756561&query=500kwh+%E5%82%A8%E8%83%BD%E7%94%B5%E6%B1%A0%E4%BB%B7%E6%A0%BC&from=b2b_straight&category=%E6%B0%B4%E6%9A%96%E7%94%B5%E5%B7%A5%3B%E7%94%B5%E6%B1%A0%3B%E8%93%84%E7%94%B5%E6%B1%A0 (accessed on 15 August 2020).
Figure 1.
Linear approximations of the demand and supply curves.

Figure 2.
Piece-wise quadratic charging/discharging functions.

Figure 3.
(a) Dynamic adjustment process (charging) when supply is greater than demand, (b) dynamic adjustment process (discharging) when supply is less than demand.
Figure 3.
(a) Dynamic adjustment process (charging) when supply is greater than demand, (b) dynamic adjustment process (discharging) when supply is less than demand.

Figure 4.
The total generation and consumption data of the 7 × 24-h period: (a) with low irradiation and (b) with high irradiation.
Figure 4.
The total generation and consumption data of the 7 × 24-h period: (a) with low irradiation and (b) with high irradiation.

Figure 5.
(a) Evolution of local trading price, and (b) comparison of total profit, total cost, and social welfare.
Figure 5.
(a) Evolution of local trading price, and (b) comparison of total profit, total cost, and social welfare.

Figure 6.
Comparison of the hourly optimal local trading price: (a) with low irradiation and (b) with high irradiation.
Figure 6.
Comparison of the hourly optimal local trading price: (a) with low irradiation and (b) with high irradiation.

Figure 7.
Comparison of the hourly social welfare: (a) with low irradiation and (b) with high irradiation.
Figure 7.
Comparison of the hourly social welfare: (a) with low irradiation and (b) with high irradiation.

Figure 8.
Effects of the maximum storage capacity.

Figure 9.
Effects of the charging and discharging thresholds.

Figure 10.
Economy of using energy storage over one year.

Figure 11.
Total economic benefit and cost over year.


Table 1.
Summary of the results of two 7 × 24-h scenarios.
| With Low Irradiation | No Storage Device | With Storage Devices | Relative Difference |
|---|---|---|---|
| Total cost for buyers (×105 $) | 1.2541 | 1.2463 | −0.62% |
| Total profit for sellers (×105 $) | 0.5617 | 0.5722 | 1.87% |
| Social welfare (×104 $) | −6.9245 | −6.7408 | 2.65% |
| With High Irradiation | No Storage Device | With Storage Devices | Relative Difference |
| Total cost for buyers (×105 $) | 1.2126 | 1.1942 | −1.52% |
| Total profit for sellers (×105 $) | 1.2413 | 1.2571 | 1.27% |
| Social welfare (×104 $) | 0.2872 | 0.6289 | 118.98% |
© 2020 by the authors. Licensee MDPI, Basel, Switzerland. This article is an open access article distributed under the terms and conditions of the Creative Commons Attribution (CC BY) license (http://creativecommons.org/licenses/by/4.0/).
Share and Cite
MDPI and ACS Style
Zhang, C.; Wang, Y.; Yang, T. Iterative Auction for P2P Renewable Energy Trading with Dynamic Energy Storage Management. Energies 2020, 13, 4963. https://0-doi-org.brum.beds.ac.uk/10.3390/en13184963
AMA Style
Zhang C, Wang Y, Yang T. Iterative Auction for P2P Renewable Energy Trading with Dynamic Energy Storage Management. Energies. 2020; 13(18):4963. https://0-doi-org.brum.beds.ac.uk/10.3390/en13184963
Chicago/Turabian StyleZhang, Chen, Yong Wang, and Tao Yang. 2020. "Iterative Auction for P2P Renewable Energy Trading with Dynamic Energy Storage Management" Energies 13, no. 18: 4963. https://0-doi-org.brum.beds.ac.uk/10.3390/en13184963
Note that from the first issue of 2016, this journal uses article numbers instead of page numbers. See further details here.