
Assessing the Vulnerability and Adaptation Needs of Mozambique’s Health Sector to Climate: A Comprehensive Study
 , , , , ,
Abstract
:1. Introduction
2. Materials and Methods
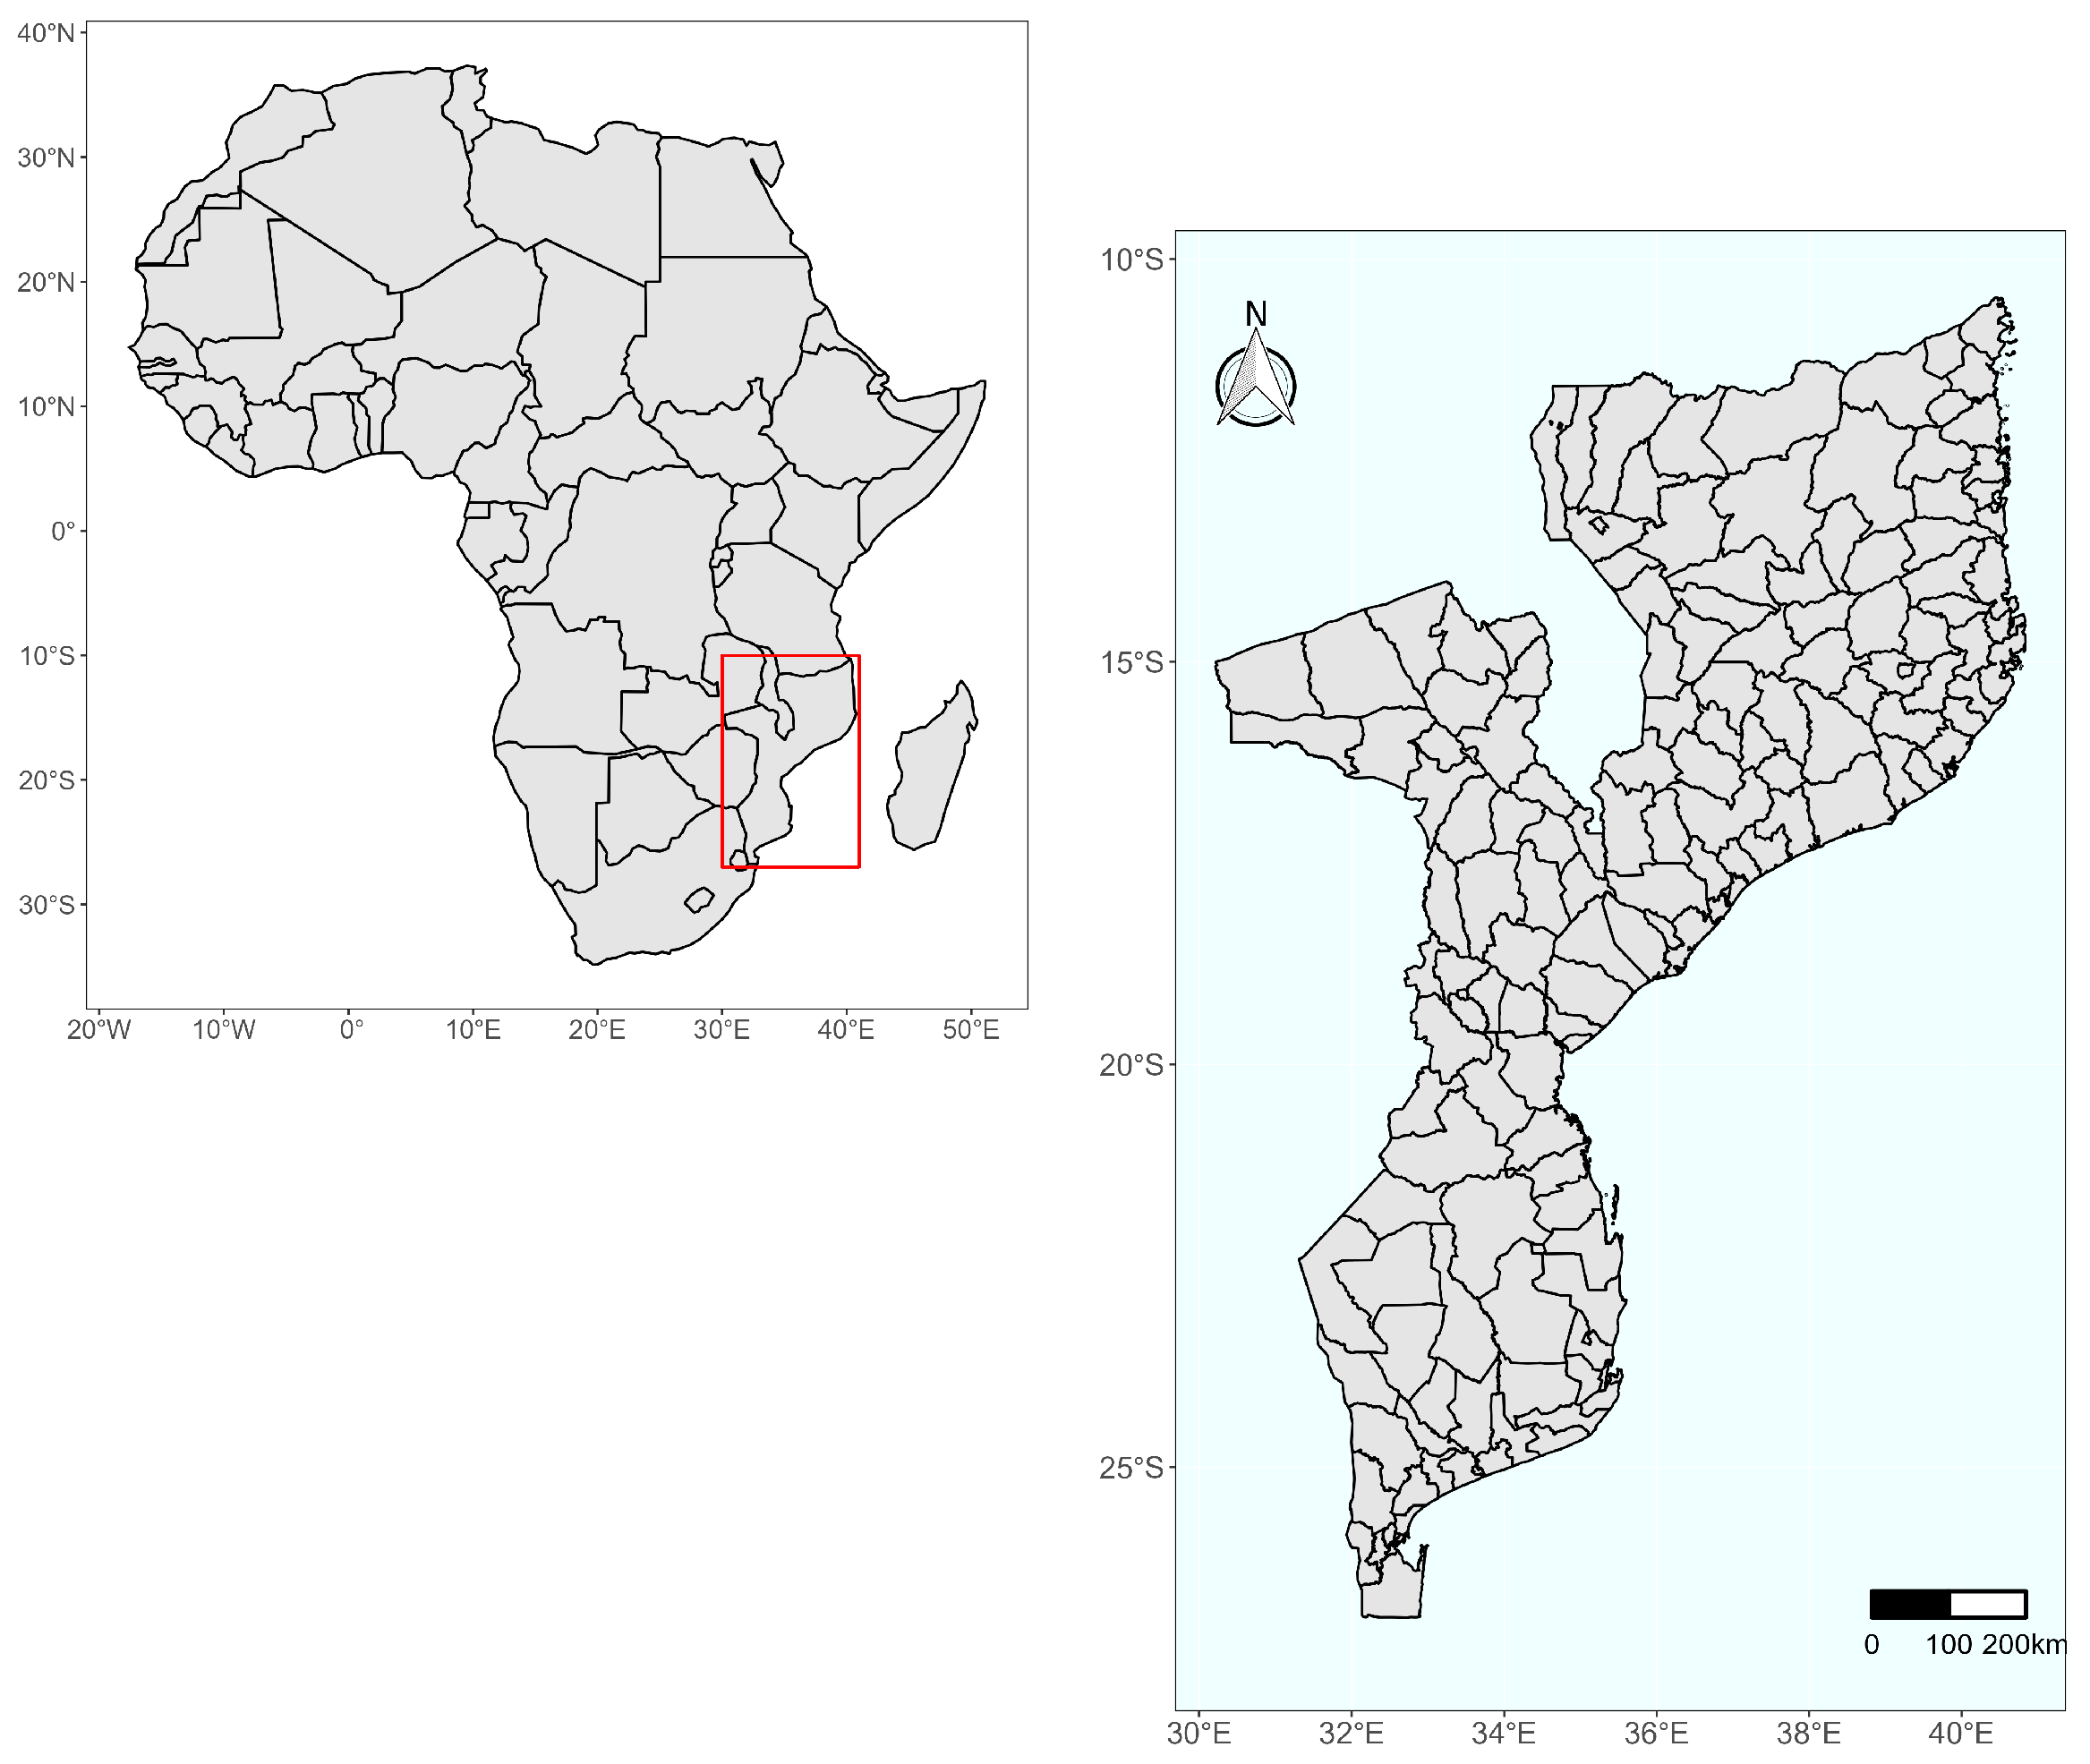
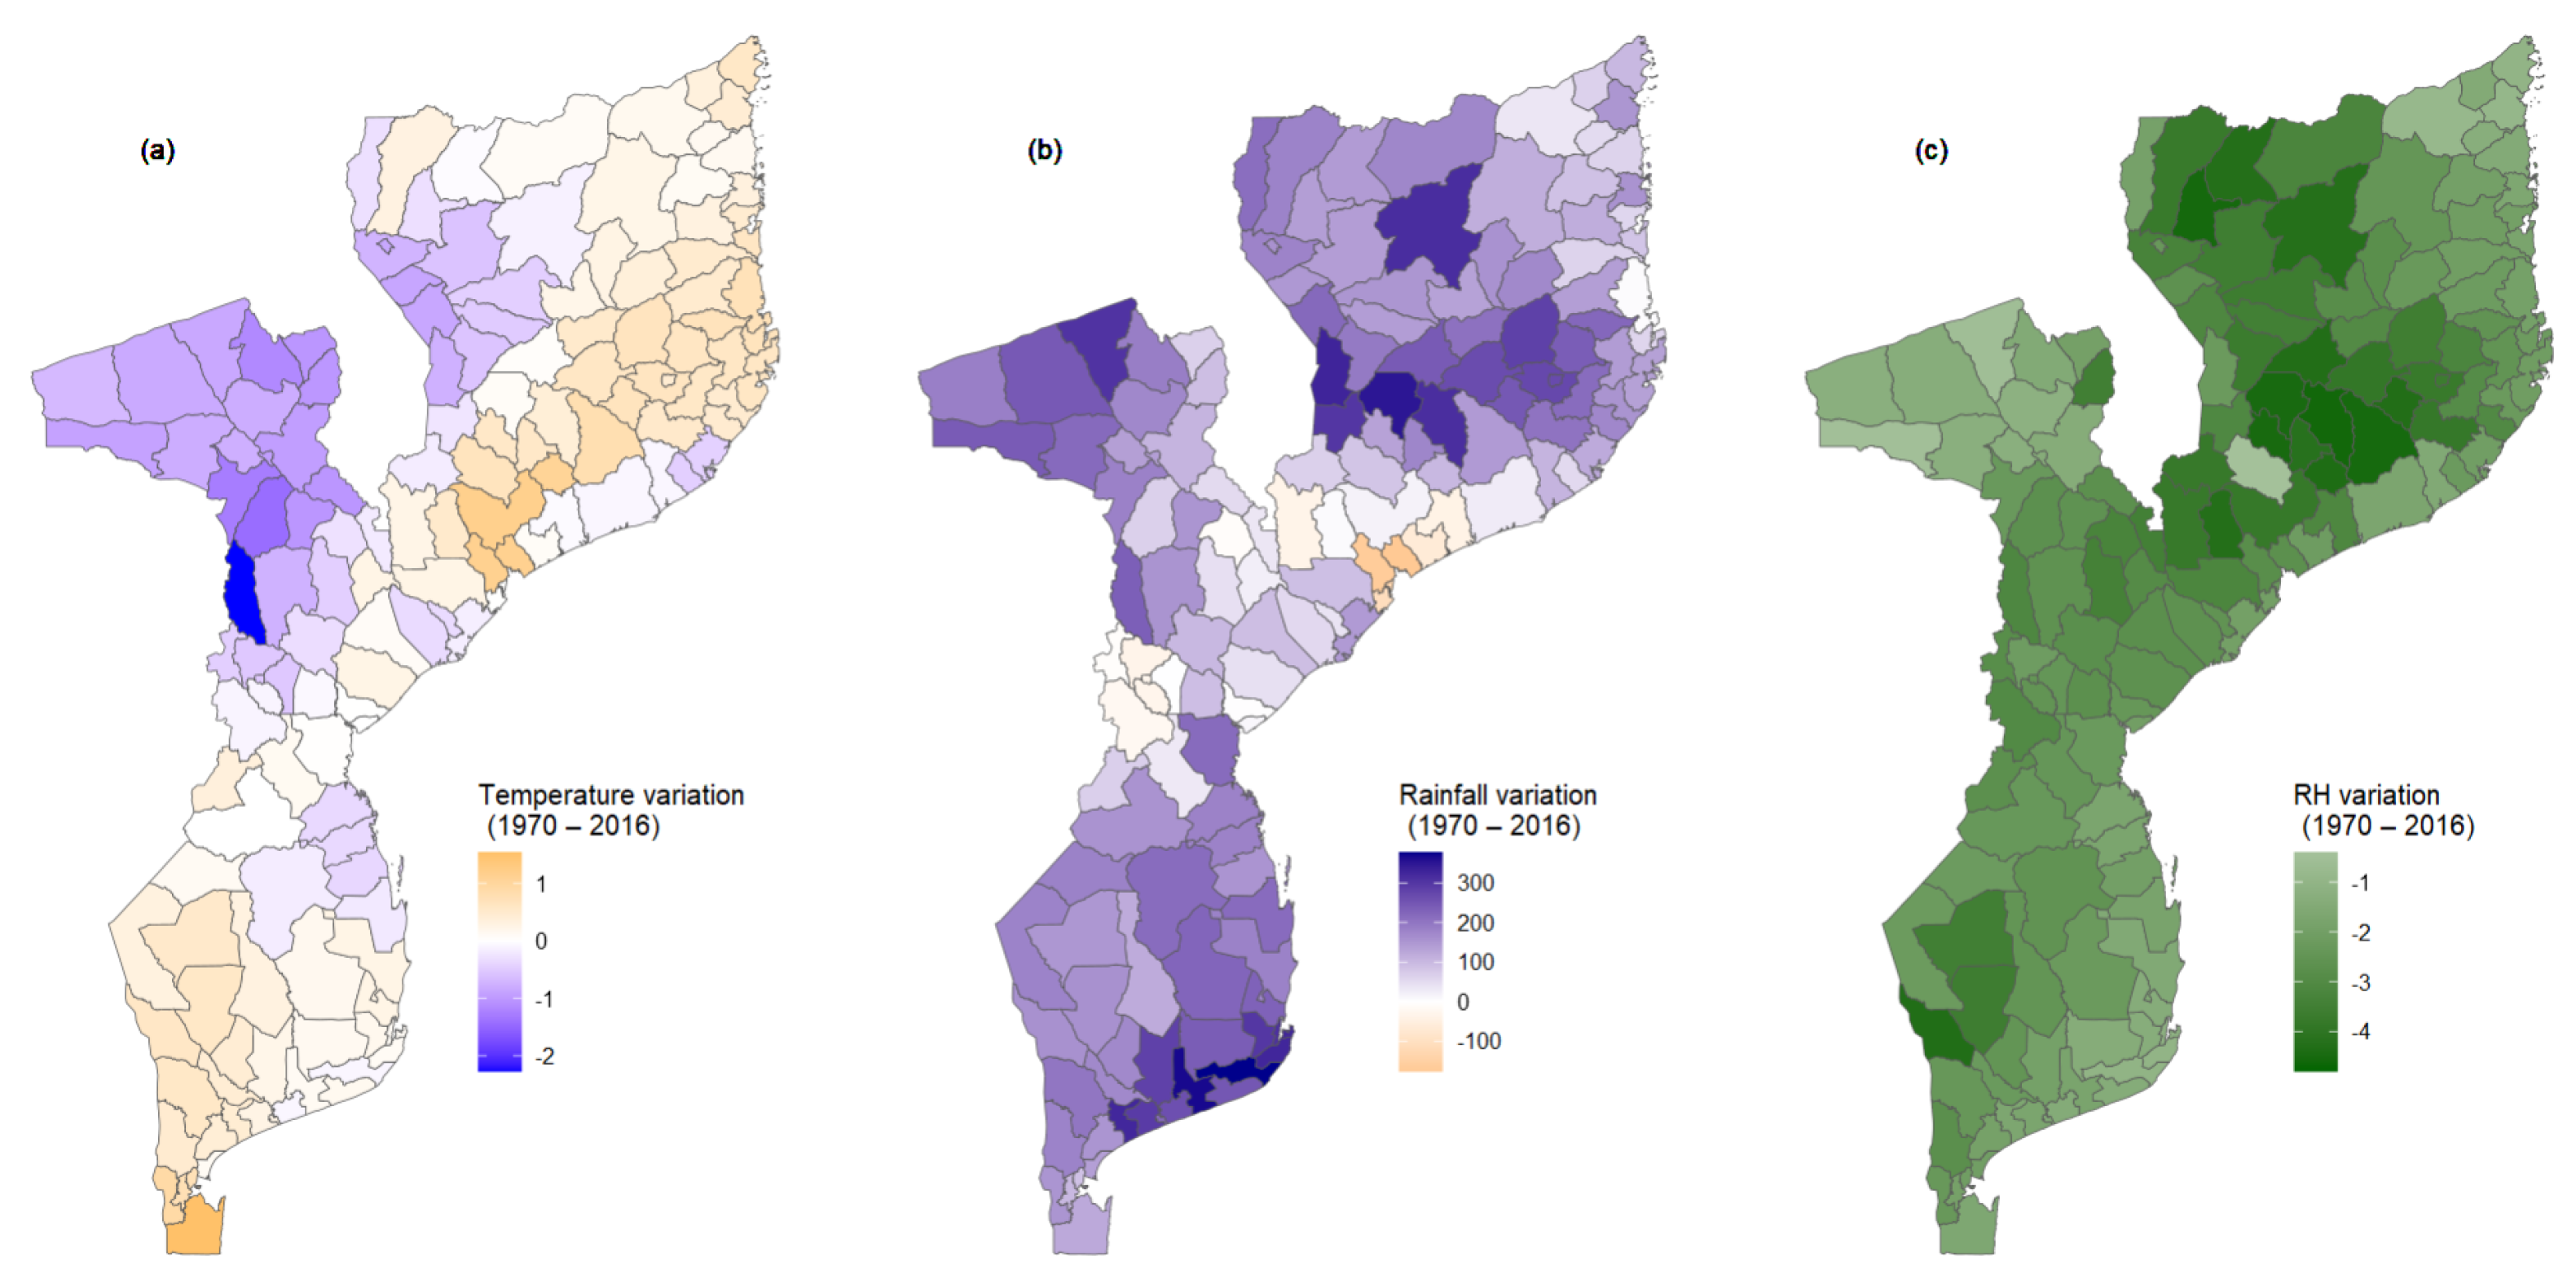
2.1. Study Area and Climate
2.2. Study Design
2.3. Data Source
2.3.1. Climate Data
2.3.2. Epidemiological Data
2.3.3. Socio-Economic Data
2.4. Data Analysis
2.4.1. Vulnerability Assessment Model

| Vulnerability Determinant | Components | Indicators | Data Source |
|---|---|---|---|
| Changes on rainfall, temperature and RH | Average temperature variation (1970–2016) | NOAA | |
| Exposure | Average rainfall variation (1970–2016) | MSWEP | |
| Average variation in the RH (1970–2016) | ECMWF | ||
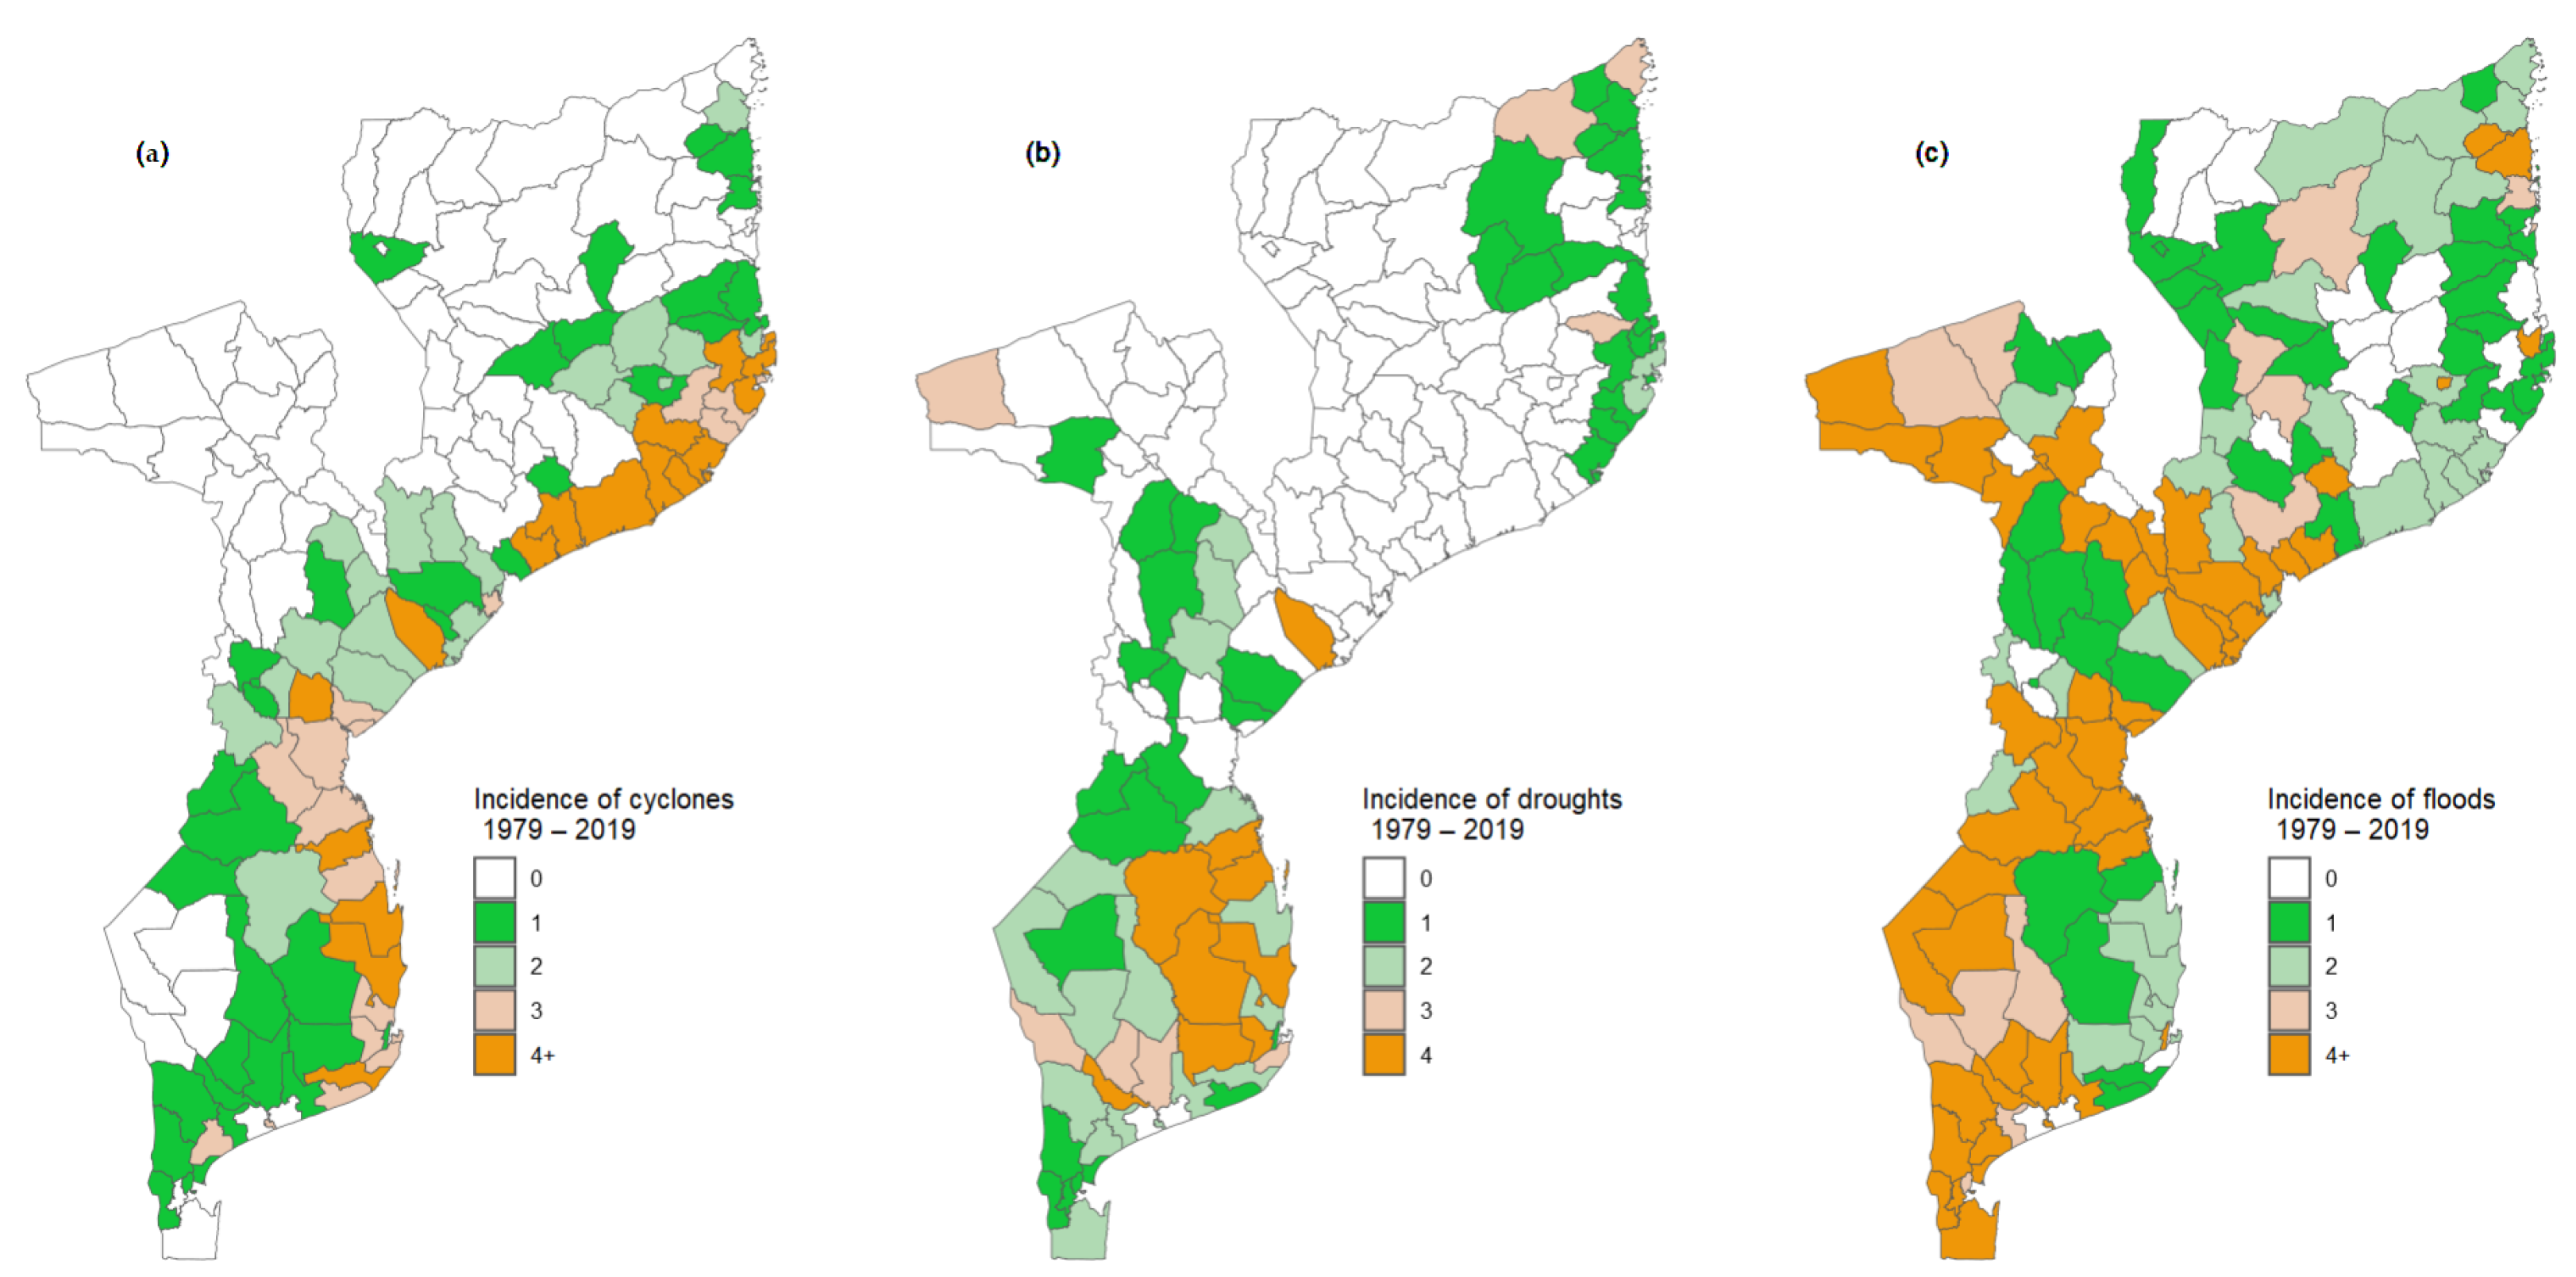
| Extreme events | Historical data on the frequency of floods, droughts and cyclones (1979–2019) | DesInventar data [27]. | |
| Sensitivity | Natural capital (Ecosystem/Geography—Risks) | Frequency of cholera outbreaks (2014–2019) | MISAU |
| Frequency of food insecurity episodes (2016–2019) | |||
| Natural capital (Demography and vulnerable population) | Population density (2017) | ||
| Percent of children under five in the district (2017) | |||
| Percent of children aged 5–15 years in the district (2017) | Census data [33] | ||
| Percent of women in the district (2017) | |||
| Percent of elderly people (over 60 years old) in the district (2017) | |||
| Vulnerable population due to health conditions | HIV positivity rate (2017–2018) | ||
| Rate of reported cases of tuberculosis (2017–2018) | |||
| Average number of cases of acute and chronic malnutrition per 100,000 inhabitants (2017–2018) | MISAU (National Directorate for Public Health) | ||
| Average number of cases of malaria per 100 inhabitants (2017–2018) | |||
| Average number of reported cases of diarrheal diseases per 100,000 inhabitants (2017–2018) | |||
| Financial resources | Per capita public sector health expenditure (2018) | MISAU (division of administration and finance) | |
| Health services | Ratio of the total number of inhabitants to the total number of health units in the district (2018) | Census data [33] and SARA report [34] | |
| Percentage of population living within the coverage radius of a health facility (2018) | |||
| Human resources | Ratio of medical workers per 100,000 inhabitants | MISAU (division of human resource) | |
| Adaptive capacity | Ratio of nursing workers per 100,000 inhabitants | ||
| Ratio of workers in the midwifery area per 100,000 inhabitants (2018) | |||
| Number of inhabitants per health elementary multipurpose agents (2019) | MISAU (National Directorate for Public Health) and census data [33] | ||
| Water and sanitation | Percentage of population with access to safe water sources (2017) | Census data [33] | |
| Percentage of population with access to safe latrines (2017) | |||
| Social capital (Social determinants of health) | Percentage of literate population, men (2017) | Census data [33] | |
| Percentage of population with primary education, men (2017) | |||
| Percentage of population with secondary education, men (2017) | |||
| Percentage of literate population, women (2017) | |||
| Percentage of population with primary education, women (2017) | |||
| Percentage of population with secondary education, women (2017) | |||
| Per capita expenditure (2014) | National household budget survey report [35] |
3. Results
3.1. Exposure
3.2. Exposure, Sensitivity, and Adaptive Capacity Index
3.3. Adaptive Capacity Determinants
3.3.1. Access to Health Services
3.3.2. Human Resources for Health Services
3.3.3. Water and Sanitation
3.4. Health Vulnerability Index
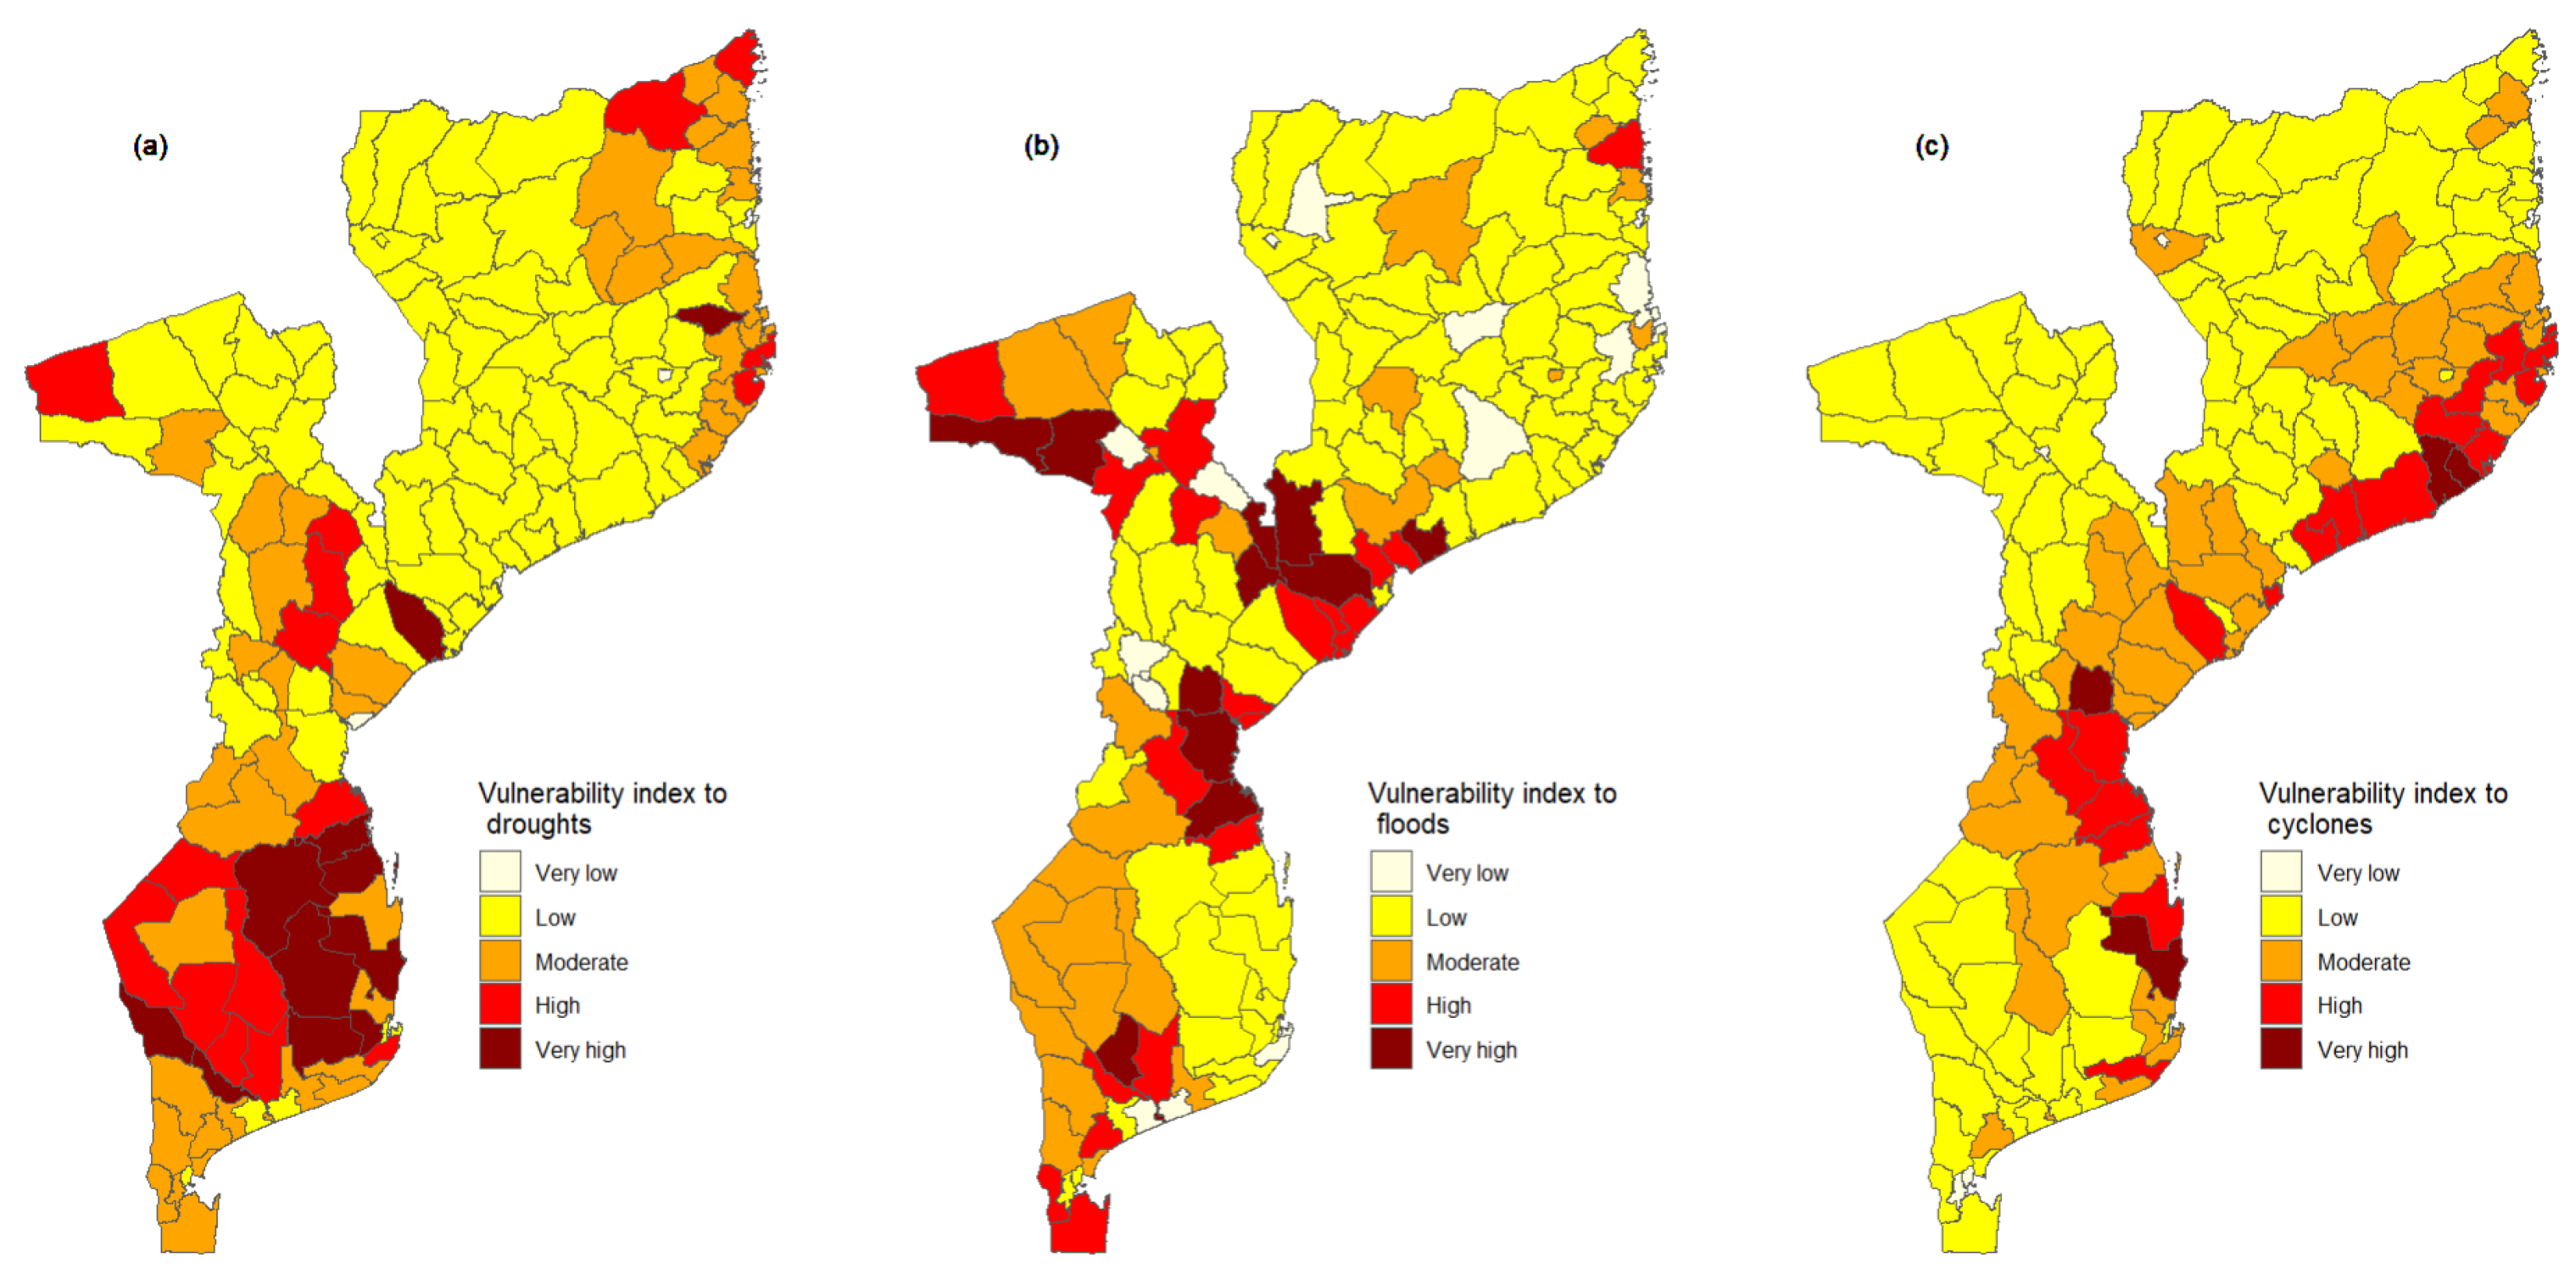
3.5. Vulnerability Index to Droughts, Floods and Cyclones
4. Discussion
5. Conclusions
Author Contributions
Funding
Institutional Review Board Statement
Informed Consent Statement
Data Availability Statement
Acknowledgments
Conflicts of Interest
Appendix A


| Code | District Name | Code | District Name | Code | District Name | Code | District Name |
|---|---|---|---|---|---|---|---|
| 1 | Cidade de Lichinga | 42 | Memba | 82 | Changara | 123 | Mabote |
| 2 | Cuamba | 43 | Mogincual | 83 | Chifunde | 124 | Massinga |
| 3 | Lago | 44 | Mogovolas | 84 | Chiuta | 125 | Cidade de Maxixe |
| 4 | Chimbonila | 45 | Moma | 85 | Macanga | 126 | Morrumbene |
| 5 | Majune | 46 | Monapo | 86 | Magoe | 127 | Panda |
| 6 | Mandimba | 47 | Mossuril | 87 | Maravia | 128 | Vilankulo |
| 7 | Marrupa | 48 | Muecate | 88 | Moatize | 129 | Zavala |
| 8 | Maua | 49 | Murrupula | 89 | Mutarara | 130 | Matola |
| 9 | Mavago | 50 | Nacala Porto | 90 | Tsangano | 131 | Boane |
| 10 | Mecanhelas | 51 | Nacala Velha | 91 | Zumbo | 132 | Magude |
| 11 | Mecula | 75 | Luabo | 92 | Doa | 133 | Manhica |
| 12 | Metarica | 76 | Mocubela | 93 | Marara | 134 | Marracuene |
| 13 | Muembe | 77 | Molumbo | 94 | Cidade de Chimoio | 135 | Matutuine |
| 14 | N‘Gauma | 78 | Mulevala | 95 | Barue | 136 | Moamba |
| 15 | Nipepe | 79 | Cidade de Tete | 96 | Gondola | 137 | Namaacha |
| 16 | Sanga | 80 | Angonia | 97 | Guro | 138 | KaMpfumo |
| 17 | Cidade de Pemba | 81 | Cahora Bassa | 98 | Machaze | 139 | Nlhamankulu |
| 18 | Ancuabe | 82 | Changara | 99 | Macossa | 140 | Kamaxakeni |
| 19 | Balama | 83 | Chifunde | 100 | Manica | 141 | Kamavota |
| 20 | Chiure | 84 | Chiuta | 101 | Mossurize | 142 | Kamubukwana |
| 21 | Ibo | 85 | Macanga | 102 | Tambara | 143 | Katembe |
| 22 | Macomia | 86 | Magoe | 103 | Macate | 144 | Kanyaka |
| 23 | Mecufi | 87 | Maravia | 104 | Vanduzi | 145 | Gorongosa |
| 24 | Meluco | 88 | Moatize | 105 | Cidade da Beira | 146 | Maringue |
| 25 | Mocimboa da Praia | 89 | Mutarara | 106 | Buzi | 147 | Sussundenga |
| 26 | Montepuez | 90 | Tsangano | 107 | Caia | 148 | Xai-Xai |
| 27 | Mueda | 91 | Zumbo | 108 | Chemba | 149 | Bilene |
| 28 | Muidumbe | 92 | Doa | 109 | Cheringoma | 150 | Chibuto |
| 29 | Namuno | 93 | Marara | 110 | Chibabava | 151 | Chicualacuala |
| 30 | Nangade | 94 | Cidade de Chimoio | 111 | Dondo | 152 | Chigubo |
| 31 | Palma | 95 | Barue | 112 | Machanga | 153 | Chokwe |
| 32 | Metuge | 96 | Gondola | 113 | Marromeu | 154 | Guija |
| 33 | Quissanga | 97 | Guro | 114 | Muanza | 155 | Mabalane |
| 34 | Cidade de Nampula | 98 | Machaze | 115 | Nhamatanda | 156 | Mandlakaze |
| 35 | Angoche | 75 | Luabo | 116 | Cidade de Inhambane | 157 | Massangena |
| 36 | Erati | 76 | Mocubela | 117 | Funhalouro | 158 | Massingir |
| 37 | Ilha de Moçambique | 77 | Molumbo | 118 | Govuro | 159 | Limpopo |
| 38 | Lalaua | 78 | Mulevala | 119 | Homoí ne | 160 | Chongoene |
| 39 | Malema | 79 | Cidade de Tete | 120 | Inharrime | 161 | Mapai |
| 40 | Meconta | 80 | Angonia | 121 | Inhassoro | ||
| 41 | Mecuburi | 81 | Cahora Bassa | 122 | Jangamo |
References
- Monday, I.F. Investigating Effects of Climate Change on Health Risks in Nigeria. In Environmental Factors Affecting Human Health; Uher, I., Ed.; IntechOpen: Rijeka, Croatia, 2019; Chapter 2. [Google Scholar] [CrossRef]
- IPCC. Climate Change 2001: The Scientific Basis. Contribution of Working Group 1 to the Third Assessment Report of the Intergovernmental Panel on Climate Change; Technical Report; Cambridge University Press: Cambridge, UK; New York, NY, USA, 2001. [Google Scholar]
- Schleussner, C.F.; Donges, J.F.; Donner, R.V.; Schellnhuber, H.J. Armed-conflict risks enhanced by climate-related disasters in ethnically fractionalized countries. Proc. Natl. Acad. Sci. USA 2016, 113, 9216–9221. [Google Scholar] [CrossRef]
- Jafino, B.A.; Walsh, B.; Rozenberg, J.; Hallegatte, S. Revised Estimates of the Impact of Climate Change on Extreme Poverty by 2030; Working Paper; Work Bank: Washington, DC, USA, 2020. [Google Scholar]
- WMO. Climate Change Triggers Food Insecurity, Poverty and Displacement in Africa. 2021. Available online: https://www.un.org/africarenewal/magazine/climate-change-triggers-food-insecurity-poverty-and-displacement-africa (accessed on 14 February 2023).
- Rother, H.A. Controlling and preventing climate-sensitive noncommunicable diseases in urban sub-Saharan Africa. Sci. Total Environ. 2020, 722, 137772. [Google Scholar] [CrossRef] [PubMed]
- Parihar, R.S.; Bal, P.K.; Thapliyal, A.; Saini, A. Climate Change Projections and its Impacts on Potential Malaria Transmission Dynamics in Uttarakhand. J. Commun. Dis. 2022, 54, 47–53. [Google Scholar] [CrossRef]
- Parihar, R.S.; Bal, P.K.; Saini, A.; Mishra, S.K.; Thapliyal, A. Potential future malaria transmission in Odisha due to climate change. Sci. Rep. 2022, 12, 9048. [Google Scholar] [CrossRef]
- Campbell-Lendrum, D.; Manga, L.; Bagayoko, M.; Sommerfeld, J. Climate change and vector-borne diseases: What are the implications for public health research and policy? Philos. Trans. R. Soc. B Biol. Sci. 2015, 370, 20130552. [Google Scholar] [CrossRef] [PubMed]
- Semenza, J.C.; Rocklöv, J.; Ebi, K.L. Climate Change and Cascading Risks from Infectious Disease. Infect. Dis. Ther. 2022, 11, 1371–1390. [Google Scholar] [CrossRef]
- Young, H.; Cornforth, R.; Petty, C. Climate and Health in Africa: Research and Policy Needs; Technical Report; Walker Institute: Reading, UK, 2019. [Google Scholar] [CrossRef]
- UNDRR. Global Assessment Report on Disaster Risk Reduction; Technical Report; United Nations Office for Disaster Risk Reduction: Geneva, Switerzland, 2019. [Google Scholar]
- Unicef. Cyclone Gombe: Impacto das Mudanças climáTicas nas Mulheres e Raparigas em Moçambique. 2019. Available online: https://www.unicef.org/mozambique/historias/cyclone-gombe-impacto-das-mudan%C3%A7as-clim%C3%A1ticas-nas-mulheres-e-raparigas-em-mo%C3%A7ambique (accessed on 14 February 2022).
- Masters, J. CAfrica’s Hurricane Katrina: Tropical Cyclone Idai Causes an Extreme Catastrophe. 2019. Available online: https://www.wunderground.com/cat6/Africas-Hurricane-Katrina-Tropical-Cyclone-Idai-Causes-Extreme-Catastrophe (accessed on 15 February 2022).
- ACSS. Cyclones and More Frequent Storms Threaten Africa. 2022. Available online: https://africacenter.org/spotlight/cyclones-more-frequent-storms-threaten-africa/ (accessed on 15 February 2022).
- WHO. Tropical cyclone Idai Mozambique—Situation Report. 6 April 2019. Available online: https://www.afro.who.int/sites/default/files/2019-05/WHOSitRep1Mozambique06-07-2019.pdf (accessed on 10 May 2023).
- WHO. Tropical Cyclones Idai and Kenneth Mozambique—National Situation Report. 2 August 2019. Available online: https://www.afro.who.int/sites/default/files/2019-08/SitRep%208_MOZ_15%20%20t%2028%20Jul%202019_ENG.pdf (accessed on 10 May 2023).
- Unicef. Cyclone Idai and Kenneth Cause Devastation and Suffering in Mozambique. 2019. Available online: https://www.unicef.org/mozambique/en/cyclone-idai-and-kenneth (accessed on 10 May 2023).
- Suit, K.C.; Choudhary, V. Mozambique Agricultural Sector Risk Assessment; Technical Report; The World Bank Group: Washington, DC, USA, 2015. [Google Scholar]
- Parkinson, V. Climate Learning for African Agriculture: The Case of Mozambique; University of Greenwich: London, UK, 2013; pp. 1–62. [Google Scholar]
- Coetzee, K. Climate Change and Trade: The Challenges for Southern Africa. S. Afr. J. Int. Aff. 2010, 18, 133–137. [Google Scholar] [CrossRef]
- MIMAIP. Elaboração do Plano de Ordenamento do Espaço Marítimo [Preparation of the Maritime Spatial Planning Plan]; Technical Report; Ministério do Mar, Águas Interiores e Pesca: Maputo, Mozambique, 2020. [Google Scholar]
- Uele, D.I.; Lyra, G.B.; Oliveira, J.F.d. Variabilidade espacial e intranual das chuvas na região sul de Moçambique, África Austral. Rev. Bras. Meteorol. 2017, 32, 473–484. [Google Scholar] [CrossRef]
- WHO. Protecting Health from Climate Change: Vulnerability and Adaptation Assessment; World Health Organization: Geneva, Switzerland, 2013.
- Fritzsche, K.; Schneiderbauer, S.; Bubeck, P.; Kienberger, S.; Buth, M.; Zebisch, M.; Kahlenborn, W. The Vulnerability Sourcebook: Concept and Guidelines for Standardised Vulnerability Assessments; Technical Report; GIZ and EURAC—Institute for Applied Remote Sensing: Berlin, Germany, 2014. [Google Scholar]
- Hersbach, H.; Bell, B.; Berrisford, P.; Hirahara, S.; Horányi, A.; Muñoz-Sabater, J.; Nicolas, J.; Peubey, C.; Radu, R.; Schepers, D.; et al. The ERA5 global reanalysis. R. Meteorol. Soc. 2020, 146, 1999–2049. [Google Scholar] [CrossRef]
- United Nations Office for Disaster Risk Reduction. Desinventar Sendai 10.1.2-User Manual Administration and Data Management. 2019. Available online: https://www.desinventar.net/documentation/DISendai_DataManagement_2019-2.pdf (accessed on 26 July 2023).
- Shah, K.U.; Dulal, H.B.; Johnson, C.; Baptiste, A. Understanding livelihood vulnerability to climate change: Applying the livelihood vulnerability index in Trinidad and Tobago. Geoforum 2013, 47, 125–137. [Google Scholar] [CrossRef]
- Luh, J.; Christenson, E.C.; Toregozhina, A.; Holcomb, D.A.; Witsil, T.; Hamrick, L.R.; Ojomo, E.; Bartram, J. Vulnerability assessment for loss of access to drinking water due to extreme weather events. Clim. Chang. 2015, 133, 665–679. [Google Scholar] [CrossRef]
- Su, J.G.; Morello-Frosch, R.; Jesdale, B.M.; Kyle, A.D.; Shamasunder, B.; Jerrett, M. An Index for Assessing Demographic Inequalities in Cumulative Environmental Hazards with Application to Los Angeles, California. Environ. Sci. Technol. 2009, 43, 7626–7634. [Google Scholar] [CrossRef] [PubMed]
- Hahn, M.B.; Riederer, A.M.; Foster, S.O. The Livelihood Vulnerability Index: A pragmatic approach to assessing risks from climate variability and change—A case study in Mozambique. Glob. Environ. Chang. 2009, 19, 74–88. [Google Scholar] [CrossRef]
- R Core Team. R: A Language and Environment for Statistical Computing; R Foundation for Statistical Computing: Vienna, Austria, 2022. [Google Scholar]
- Instituto Nacional de Estatística. IV Recenseamento Geral da População e Habitação 2017-Resultados Definitivos [IV General Census of Population and Housing 2017-Definitive Results]; Technical Report; Instituto Nacional de Estatística-Direcção de Estatísticas Demográficas, Vitais e Sociais: Maputo, Mozambique, 2019. Available online: http://www.ine.gov.mz/iv-rgph-2017/mocambique/censo-2017-brochura-dos-resultados-definitivos-do-iv-rgph-nacional.pdf/at_download/file (accessed on 10 May 2022).
- Ministério da Saúde. Service Availability and Readiness Assessment (SARA) 2018: Inventário Nacional; Ministério da Saúde: Maputo, Mozambique, 2018. [Google Scholar]
- Instituto Nacional de Estatística. Relatório Final do Inquérito ao Orçamento Familiar—IOF 2014/2015; Technical Report; Instituto Nacional de Estatística-Direcção de Estatísticas Demográficas, Vitais e Sociais: Maputo, Mozambique, 2015. Available online: http://www.ine.gov.mz/operacoes-estatisticas/inqueritos/inquerito-sobre-orcamento-familiar/relatorio-final-do-inquerito-ao-orcamento-familiar-iof-2014-15 (accessed on 10 May 2022).
- Adger, W.; Agrawala, S.; Mirza, M.; Conde, C.; O’Brien, K.; Pulhin, J.; Pulwarty, R.; Smit, B.; Takahashi, K. Assessment of adaptation practices, options, constraints and capacity. Climate change 2007: Impacts, adaptation and vulnerability. In Contribution of Working Group II to the Fourth Assessment Report of the Intergovernmental Panel on Climate Change; Cambridge University Press: Cambridge, UK, 2007; pp. 717–743. [Google Scholar]
- Schröter, D.; Polsky, C.; Patt, A.G. Assessing vulnerabilities to the effects of global change: An eight step approach. Mitig. Adapt. Strateg. Glob. Chang. 2005, 10, 573–595. [Google Scholar] [CrossRef]
- Rao, C.A.R.; Raju, B.M.K.; Rao, A.V.M.S.; Rao, K.V.; Rao, V.U.M.; Ramachandran, K.; Venkateswarlu, B.; Sikka, A.K.; Rao, M.S.; Maheswari, M.; et al. A district level assessment of vulnerability of Indian agriculture to climate change. Curr. Sci. 2016, 110, 1939–1946. [Google Scholar]
- Field, C.B.; Barros, V.; Stocker, T.F.; Dahe, Q. Managing the Risks of Extreme Events and Disasters to Advance Climate Change Adaptation: Special Report of the Intergovernmental Panel on Climate Change; Cambridge University Press: Cambridge, UK, 2012. [Google Scholar]
- O’Brien, K.; Leichenko, R.; Kelkar, U.; Venema, H.; Aandahl, G.; Tompkins, H.; Javed, A.; Bhadwal, S.; Barg, S.; Nygaard, L.; et al. Mapping vulnerability to multiple stressors: Climate change and globalization in India. Glob. Environ. Chang. 2004, 14, 303–313. [Google Scholar] [CrossRef]
- Downing, T.E. Choosing Methods in Assessments of Vulnerable Food Systems; Working Paper; Stockholm Environment Institute: Stockholm, Sweden, 2008; Available online: https://docplayer.net/12441701-Choosing-methods-in-assessments-of-vulnerable-food-systems.html (accessed on 8 August 2023).
- Krellenberg, K.; Welz, J. Assessing Urban Vulnerability in the Context of Flood and Heat Hazard: Pathways and Challenges for Indicator-Based Analysis. Soc. Indic. Res. 2017, 132, 709–731. [Google Scholar] [CrossRef]
- Truong, D.D.; Dat, T.T.; Hang, N.D.; Huan, L.H. Vulnerability Assessment of Climate Change in Vietnam: A Case Study of Binh Chanh District, Ho Chi Minh City. Front. Environ. Sci. 2022, 10, 880254. [Google Scholar] [CrossRef]
- Nguyen, T.T.; Bonetti, J.; Rogers, K.; Woodroffe, C.D. Indicator-based assessment of climate-change impacts on coasts: A review of concepts, methodological approaches and vulnerability indices. Ocean Coast. Manag. 2016, 123, 18–43. [Google Scholar] [CrossRef]
- Gbetibouo, G.A.; Ringler, C.; Hassan, R. Vulnerability of the South African farming sector to climate change and variability: An indicator approach. Nat. Resour. Forum 2010, 34, 175–187. [Google Scholar] [CrossRef]
- Mavume, A.F.; Banze, B.E.; Macie, O.A.; Queface, A.J. Analysis of Climate Change Projections for Mozambique under the Representative Concentration Pathways. Atmosphere 2021, 12, 588. [Google Scholar] [CrossRef]
- Cabral, P.; Augusto, G.; Akande, A.; Costa, A.; Amade, N.; Niquisse, S.; Atumane, A.; Cuna, A.; Kazemi, K.; Mlucasse, R.; et al. Assessing Mozambique’s exposure to coastal climate hazards and erosion. Int. J. Disaster Risk Reduct. 2017, 23, 45–52. [Google Scholar] [CrossRef]
- Mondlane, A. Floods and droughts in Mozambique–the paradoxical need of strategies for mitigation and coping with uncertainty. WIT Trans. Ecol. Environ. 2004, 7, 371–379. [Google Scholar] [CrossRef]
- Silva, J.A.; Eriksen, S.; Ombe, Z.A. Double Exposure in Mozambique’s Limpopo River Basin. Geogr. J. 2010, 176, 6–24. [Google Scholar] [CrossRef]
- Mongo, E.; Cambaza, E.; Nhambire, R. Outbreak of cholera due to cyclone Idai in central Mozambique. In Evaluation of Health Services; IntechOpen: Rijeka, Croatia, 2019. [Google Scholar]
- Mugabe, V.A.; Gudo, E.S.; Inlamea, O.F.; Kitron, U.; Ribeiro, G.S. Natural disasters, population displacement and health emergencies: Multiple public health threats in Mozambique. BMJ Glob. Health 2021, 6, e006778. [Google Scholar] [CrossRef] [PubMed]
- Secretariado de Técnico de Segurança Alimentar e Nutricional. Relatório da Avaliação da Situação de Insegurança Alimentar e Nutricional Aguda Póschoque de Abril—Maio de 2019 [Post-Shock Acute Food and Nutrition Insecurity Situation Assessment Report April–May 2019]. 2019. Available online: https://reliefweb.int/sites/reliefweb.int/files/resources/Relatorio%20de%20%20AVASAN_Junho2019_final.pdf (accessed on 26 February 2022).
- Atanga, R.A.; Tankpa, V. Climate Change, Flood Disaster Risk and Food Security Nexus in Northern Ghana. Front. Sustain. Food Syst. 2021, 5, 706721. [Google Scholar] [CrossRef]
- SETSAN. Relatório da Monitoria da Segurança Alimentar e Nutricional em Moçambique (Versão Final); Technical Report; Ministery of Agriculture: Maputo, Mozambique, 2007. [Google Scholar]
- Smit, B.; Pilifosova, O.; Burton, I.; Challenger, B.; Huq, S.; Klein, R.; Yohe, G.; Adger, W.; Downing, T.; Harvey, E. Adaptation to climate change in the context of sustainable development and equity. In Climate Change 2001: Impacts, Adaptation and Vulnerability; Cambridge University Press: Cambridge, UK, 2001; pp. 877–912. [Google Scholar]
- Smith, J.B.; Lenhart, S.S. Climate change adaptation policy options. Clim. Res. 1996, 6, 193–201. [Google Scholar] [CrossRef]
- INS, INE, and ICFI. Moçambique Inquérito Demográfico e de Saúde 2011 [Mozambique Demographic Health Survey 2011]; Technical Report; INS, INE, and ICFI: Calverton, MD, USA, 2013; Available online: https://dhsprogram.com/pubs/pdf/fr266/fr266.pdf (accessed on 10 May 2020).
- dos Anjos Luis, A.; Cabral, P. Geographic accessibility to primary healthcare centers in Mozambique. Int. J. Equity Health 2016, 15, 1–13. [Google Scholar] [CrossRef]
- Chao, S.; Kostermans, K. Improving Health for the Poor in Mozambique: The Fight Continues; Technical Report; The World Banck: Washington, DC, USA, 2002. [Google Scholar]
- Bao, X.; Zhang, F. How Accurate Are Modern Atmospheric Reanalyses for the Data-Sparse Tibetan Plateau Region? J. Clim. 2019, 32, 7153–7172. [Google Scholar] [CrossRef]
- MICOA. Estratégia Nacional de Adaptação e Mitigação de Mudanças Climáticas [National Strategy for Adaptation and Mitigation of Climate Change]; Technical Report; Ministério para a Coordenação Ambiental [Ministry for Environemntal Coordinantion]: Maputo, Mozambique, 2012; Available online: https://www.biofund.org.mz/wp-content/uploads/2019/01/1547562128-Estrategia%20Nacional%20de%20Adaptacao%20e%20%20Mitigacao%20das%20Mudancas%20Climaticas%202013-2025.pdf (accessed on 10 May 2022).
- UNICEF. Massive Flooding in Mozambique, Malawi and Zimbabwe. 2019. Available online: https://www.unicef.org/stories/massive-flooding-malawi-mozambique-and-zimbabwe (accessed on 9 September 2022).


Disclaimer/Publisher’s Note: The statements, opinions and data contained in all publications are solely those of the individual author(s) and contributor(s) and not of MDPI and/or the editor(s). MDPI and/or the editor(s) disclaim responsibility for any injury to people or property resulting from any ideas, methods, instructions or products referred to in the content. |
© 2024 by the authors. Licensee MDPI, Basel, Switzerland. This article is an open access article distributed under the terms and conditions of the Creative Commons Attribution (CC BY) license (https://creativecommons.org/licenses/by/4.0/).
Share and Cite
Muleia, R.; Maúre, G.; José, A.; Maholela, P.; Adjei, I.A.; Karim, M.R.; Trigo, S.; Kutane, W.; Inlamea, O.; Kazembe, L.N.; et al. Assessing the Vulnerability and Adaptation Needs of Mozambique’s Health Sector to Climate: A Comprehensive Study. Int. J. Environ. Res. Public Health 2024, 21, 532. https://0-doi-org.brum.beds.ac.uk/10.3390/ijerph21050532
Muleia R, Maúre G, José A, Maholela P, Adjei IA, Karim MR, Trigo S, Kutane W, Inlamea O, Kazembe LN, et al. Assessing the Vulnerability and Adaptation Needs of Mozambique’s Health Sector to Climate: A Comprehensive Study. International Journal of Environmental Research and Public Health. 2024; 21(5):532. https://0-doi-org.brum.beds.ac.uk/10.3390/ijerph21050532
Chicago/Turabian StyleMuleia, Rachid, Genito Maúre, Américo José, Plácida Maholela, Isaac Akpor Adjei, Md. Rezaul Karim, Sónia Trigo, Waltaji Kutane, Osvaldo Inlamea, Lawrence N. Kazembe, and et al. 2024. "Assessing the Vulnerability and Adaptation Needs of Mozambique’s Health Sector to Climate: A Comprehensive Study" International Journal of Environmental Research and Public Health 21, no. 5: 532. https://0-doi-org.brum.beds.ac.uk/10.3390/ijerph21050532