Article

How the Ethylene Biosynthesis Pathway of Semi-Halophytes Is Modified with Prolonged Salinity Stress Occurrence?

by
Miron Gieniec
1,
Zbigniew Miszalski
1,
Piotr Rozpądek
2,
Roman J. Jędrzejczyk
2,
Małgorzata Czernicka
3 and
Michał Nosek
4,*
1
W. Szafer Institute of Botany, Polish Academy of Sciences, Lubicz 46, 31-512 Kraków, Poland
2
Małopolska Centre of Biotechnology, Jagiellonian University, Gronostajowa 7a, 30-387 Kraków, Poland
3
Department of Plant Biology and Biotechnology, Faculty of Biotechnology and Horticulture, University of Agriculture in Krakow, Al. Mickiewicza 21, 31-120 Kraków, Poland
4
Institute of Biology and Earth Sciences, University of the National Education Commission, Krakow, Podchorążych 2, 30-084 Kraków, Poland
*
Author to whom correspondence should be addressed.
Int. J. Mol. Sci. 2024, 25(9), 4777; https://0-doi-org.brum.beds.ac.uk/10.3390/ijms25094777
Submission received: 19 March 2024 / Revised: 16 April 2024 / Accepted: 24 April 2024 / Published: 27 April 2024
(This article belongs to the Special Issue Molecular Regulatory Mechanisms of Salinity Tolerance in Plants 2.0)

Abstract

:
The mechanism of ethylene (ET)–regulated salinity stress response remains largely unexplained, especially for semi-halophytes and halophytes. Here, we present the results of the multifaceted analysis of the model semi-halophyte Mesembryanthemum crystallinum L. (common ice plant) ET biosynthesis pathway key components’ response to prolonged (14 days) salinity stress. Transcriptomic analysis revealed that the expression of 3280 ice plant genes was altered during 14-day long salinity (0.4 M NaCl) stress. A thorough analysis of differentially expressed genes (DEGs) showed that the expression of genes involved in ET biosynthesis and perception (ET receptors), the abscisic acid (ABA) catabolic process, and photosynthetic apparatus was significantly modified with prolonged stressor presence. To some point this result was supported with the expression analysis of the transcript amount (qPCR) of key ET biosynthesis pathway genes, namely ACS6 (1-aminocyclopropane-1-carboxylate synthase) and ACO1 (1-aminocyclopropane-1-carboxylate oxidase) orthologs. However, the pronounced circadian rhythm observed in the expression of both genes in unaffected (control) plants was distorted and an evident downregulation of both orthologs’ was induced with prolonged salinity stress. The UPLC-MS analysis of the ET biosynthesis pathway rate-limiting semi-product, namely of 1-aminocyclopropane-1-carboxylic acid (ACC) content, confirmed the results assessed with molecular tools. The circadian rhythm of the ACC production of NaCl-treated semi-halophytes remained largely unaffected by the prolonged salinity stress episode. We speculate that the obtained results represent an image of the steady state established over the past 14 days, while during the first hours of the salinity stress response, the view could be completely different.

1. Introduction

In their natural habitats, plants are continuously exposed to alternating stresses and among them, the occurrence of osmotic stresses; in particular, the impact of salinity stress has significantly increased in recent years. According to the data of the FAO Land and Plant Nutrition Management Service, soils affected by increased salinity currently constitute more than 6% of the total cultivated area (nearly 400 million hectares), and this share increases by about 1–2% annually. The harmful effect of increased salinity applies to about 30% of the irrigated lands devoted to major crop agriculture and it is responsible for a monetary loss of approx. 27.3 billion USD per year [1]. This phenomenon results mainly from deforestation, intensive fertilization, rainfall absence, and irrigation with low-purity water. The water used in irrigation contains on average up to 200–500 mg of soluble salts per litre and, according to Parihar et al. (2015) [2], a hectare of crops in many locations may receive from 3 to 5 tons of salt per year. The elevated salinity- or drought-induced osmotic stress can lead to the disruption of water management in plant cells and, as a consequence, cell shrinking or swelling can be observed [3]. Interestingly, the low water potential of high salinity-affected areas is often not the result of low water content, since these regions are often characterized by a moderate amount of precipitation [4]. In many places with salinity-affected soils, there is plenty of water; however, contamination with large amounts of soluble salts drastically decreases soil water potential and heavily disturbs water uptake. Plants exposed to salinity stress have to “cope” with two problems: besides limited water availability, they have to deal with high concentrations of ions, usually Na+ and Cl, which can be toxic [5]. Despite the difficulties associated with water uptake and harmful ion concentrations, many plant species have developed mechanisms that allow vegetation in conditions of osmotic stress. Plants of areas naturally affected by high salinity, known as halophytes, have developed mechanisms allowing an undisturbed execution of the developmental programme under salinity stress. Halophytes’ tolerance to salinity stress mainly results from sophisticated osmoregulation, the accumulation of osmoregulatory substances, namely osmolytes, which allow the stabilization of cell structures when exposed to elevated salinity without interfering with the central metabolism of the cell. Osmoregulatory substances like glutamic acid and betaines (derivatives of glycine, proline, γ-aminobutyric acid, and δ-amino valeric acid) can be synthesized or taken from the environment. Such mechanisms are not working in the so-called glycophytes (literally sweet plants), which are susceptible to salinity stress, and even a slight increase in ion concentration may disrupt their developmental programme execution [6,7]. On the other hand, plants growing in dry areas, similarly affected by osmotic stress effects, can execute their developmental programme by employing specialized adaptations involving delay (desiccation postponement) and/or protection (desiccation tolerance) mechanisms against water loss. One of the strategies exploited by plants struggling with osmotic stress (drought or salinity) is also the implementation of CAM (Crassulacean acid metabolism) photosynthesis. CAM-performing plants fix carbon dioxide (CO2) during the night in the form of malate and then refix this in the light during the following day [8]. Nevertheless, all plants, C3 and CAM, are equipped with a Rubisco enzyme responsible for the final CO2 fixing [9]. High water use efficiency (WUE), and consequently, the limitation and delay of drying, makes CAM an attractive modification that seems to be an excellent remedy for the aforementioned environmental stressors. Some plants with the capability of shifting between C3 and CAM photosynthetic mode are valuable research objects. The daily rhythm of their photosynthetic activity is strongly dependent on their photochemical activity and the regulation of the production of many metabolites and, among others, also some phytohormones. It was shown that phytohormones like ABA can induce CAM metabolism [10,11,12].
Plants are continuously exposed to at least a few unfriendly environmental conditions, which are referred to as stressors. The response to both abiotic and biotic stressors requires well-tuned interaction which cannot be performed without phytohormone commitment. Evidence gathered throughout at least the last two decades indicates ethylene (ET) is an important modulator of plant response to both abiotic and biotic stresses [1,10,13]. This simple gaseous olefine has been recognized as one of the major plant hormones for almost a century [14,15,16]. Its production occurs in all known plant tissues and is often used in agricultural practice. Besides being used in response to a wide variety of stresses, ET is involved in a diverse array of plant growth and developmental processes, including germination, leaf and flower senescence, leaf abscission, cell elongation, fruit ripening, and nodulation [1,17]. The ET biosynthesis pathway is relatively simple: methionine is converted first to S-adenosylomethionine (SAM) and in the next step to 1-aminocyclopropane-1-carboxylic acid (ACC), the immediate precursor of ET and 5′-methylthioadenosine (MTA), and next, ACC is converted to ET, CO2, and cyanide. Two main enzymes, ACC synthase (ACS) and ACC oxidase (ACO), are involved in this biosynthesis pathway. In past years, the role of CO2 as a fundamental regulator for the last step of ET biosynthesis was confirmed [18,19,20,21].
A vast number of experimental works confirmed a key modulator role for ET during the salinity response of many crops, e.g., grapevine [22], maize [23], and tomato [24]. In addition to the positive role, evidence confirming ET as the negative regulator in the plant–salinity stress interaction has also been provided [25]. Gharbi et al. (2017) [24] suggested that ET applied before salinity stress may support plant adaption to forthcoming disturbances, probably by stomatal conductance maintenance, improved water use efficiency (WUE), and osmotic adjustment. It is worth mentioning that ET-induced enhanced tolerance to salinity stress through the enhanced expression of enzymatic antioxidants was also suggested [26]. On the other hand, the inhibition of ET receptors in some plant species has been demonstrated. The authors indicated that it can be a factor in changed, decreased plant tolerance to salinity stress depending on the type of inhibited receptor or receptors [27,28,29,30]. In the ET biosynthesis pathway, one of the crucial and also rate-limiting enzymes is 1-aminocyclopropane-1-carboxylic acid (ACC) synthase (ACS). In some plant species under salinity stress, the level of ACS transcripts decreases dramatically. Also, the activity of another enzyme engaged in ET biosynthesis, ACC oxidase, and the level of ACO transcripts are mostly increased [31].
Most studies regarding ET involvement in salinity stress concern the response of crops, which are mostly glycophytes. In our opinion, while this approach is economically justified, it narrows the field of view since it concentrates on the mechanism occurring exclusively in plants susceptible to elevated salinity and the employment of halophytes and semi-halophytes brings an even more interesting background for such analysis. This approach allows insight into ET-dependent regulatory mechanisms in plants whose natural life cycle is inextricably connected with the presence of osmotic stress, either in the form of high salinity or drought. The main aim of our study was to determine how the key components of the ET biosynthetic pathway are modified by the ongoing presence of high salt concentrations in semi-halophytes. To achieve this, the employed semi-halophyte model, namely the common ice plant (Mesembryanthemum crystallinum L.), was subjected to multifaceted analysis on the 14th day of the salinity stress episode. M. crystallinum was also analysed as a plant resistant to different heavy metals [32,33,34]. Moreover, the common ice plant is a well-recognized CAM facultative plant model with an extremely high plasticity of photosynthetic apparatus. Recent reports confirmed that the common ice plant’s mesophyll cells rapidly (up to 24 h) undergo the process of functional CAM withdrawal, involving broad rearrangements of PSI (photosystem I) and PSII (photosystem II) protein expression, chloroplast ultrastructure, and photochemistry performance in response to salinity stress removal [35,36,37,38,39]. The features mentioned above of the plant model allow the study of another important aspect determining the regulation of ET biosynthesis, and consequently also affecting the ET regulatory system, parallel to changes in the intracellular concentration of CO2.

2. Results

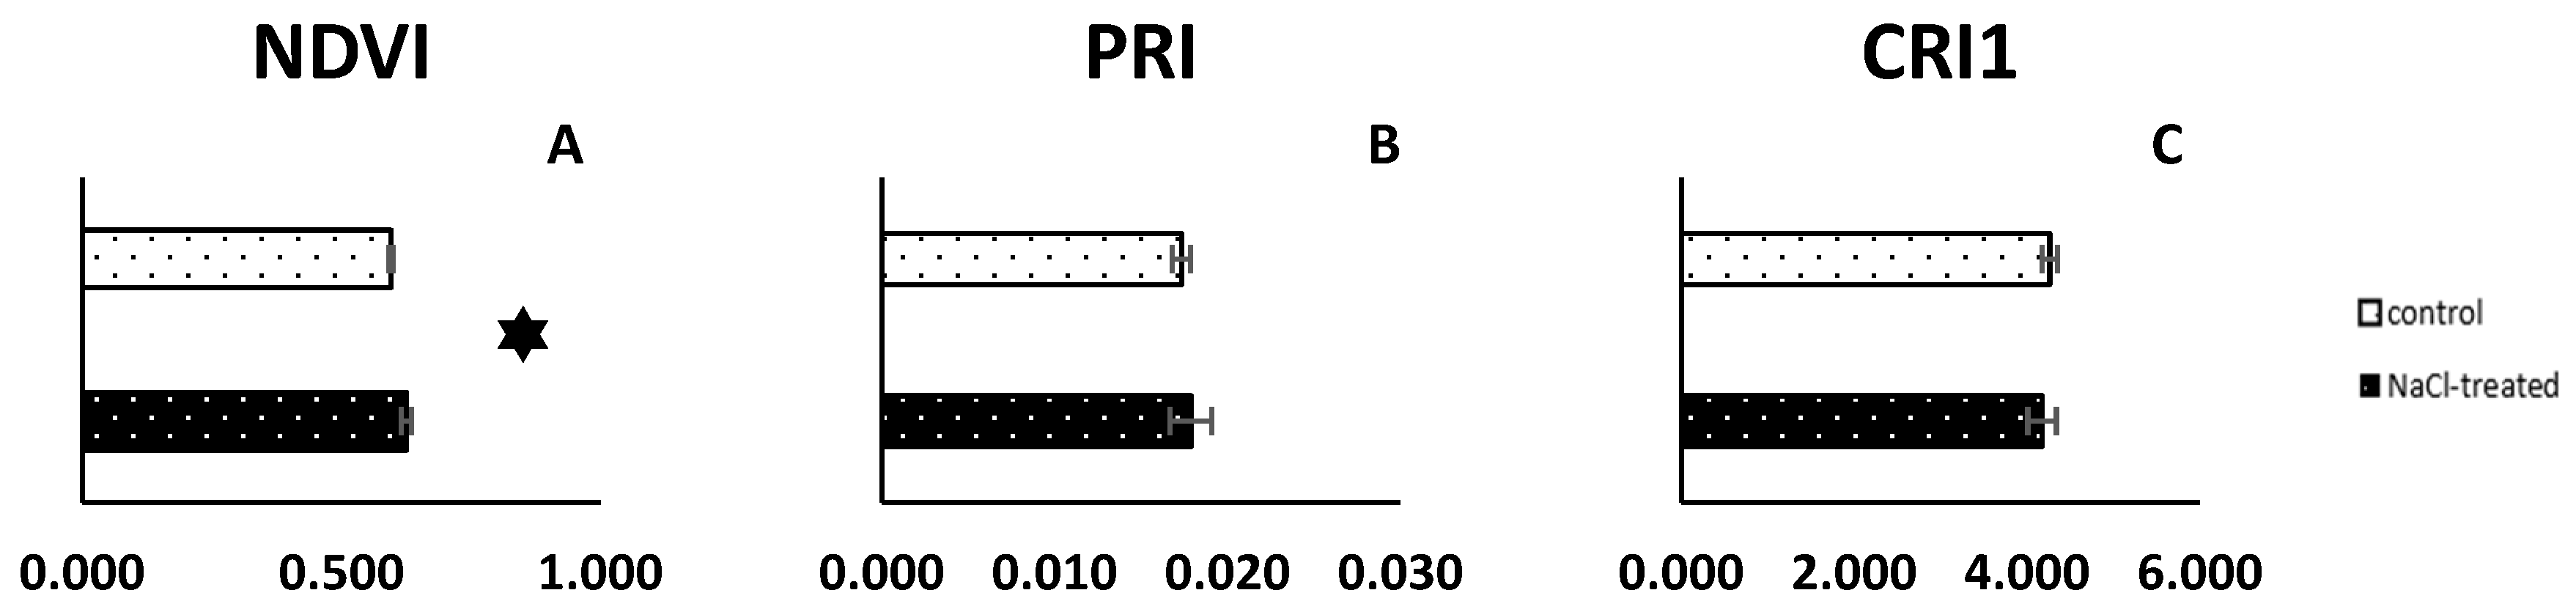
2.1. Reflectance Parameters Results

In the control C3 plants, the normalized difference vegetation index (NDVI) parameter value was significantly lower than in the NaCl-treated plants (0.59 and 0.63, respectively) (Figure 1A). No statistically significant differences in the photochemical reflectance index (PRI) and carotenoid reflectance index 1 (CRI1) parameters between control and NaCl-treated plants were observed on the 14th day of the experiment. PRI 0.017 and 0.018 and CRI 4.26 and 4.20 mean values were measured for control and NaCl-treated plants, respectively (Figure 1B,C).

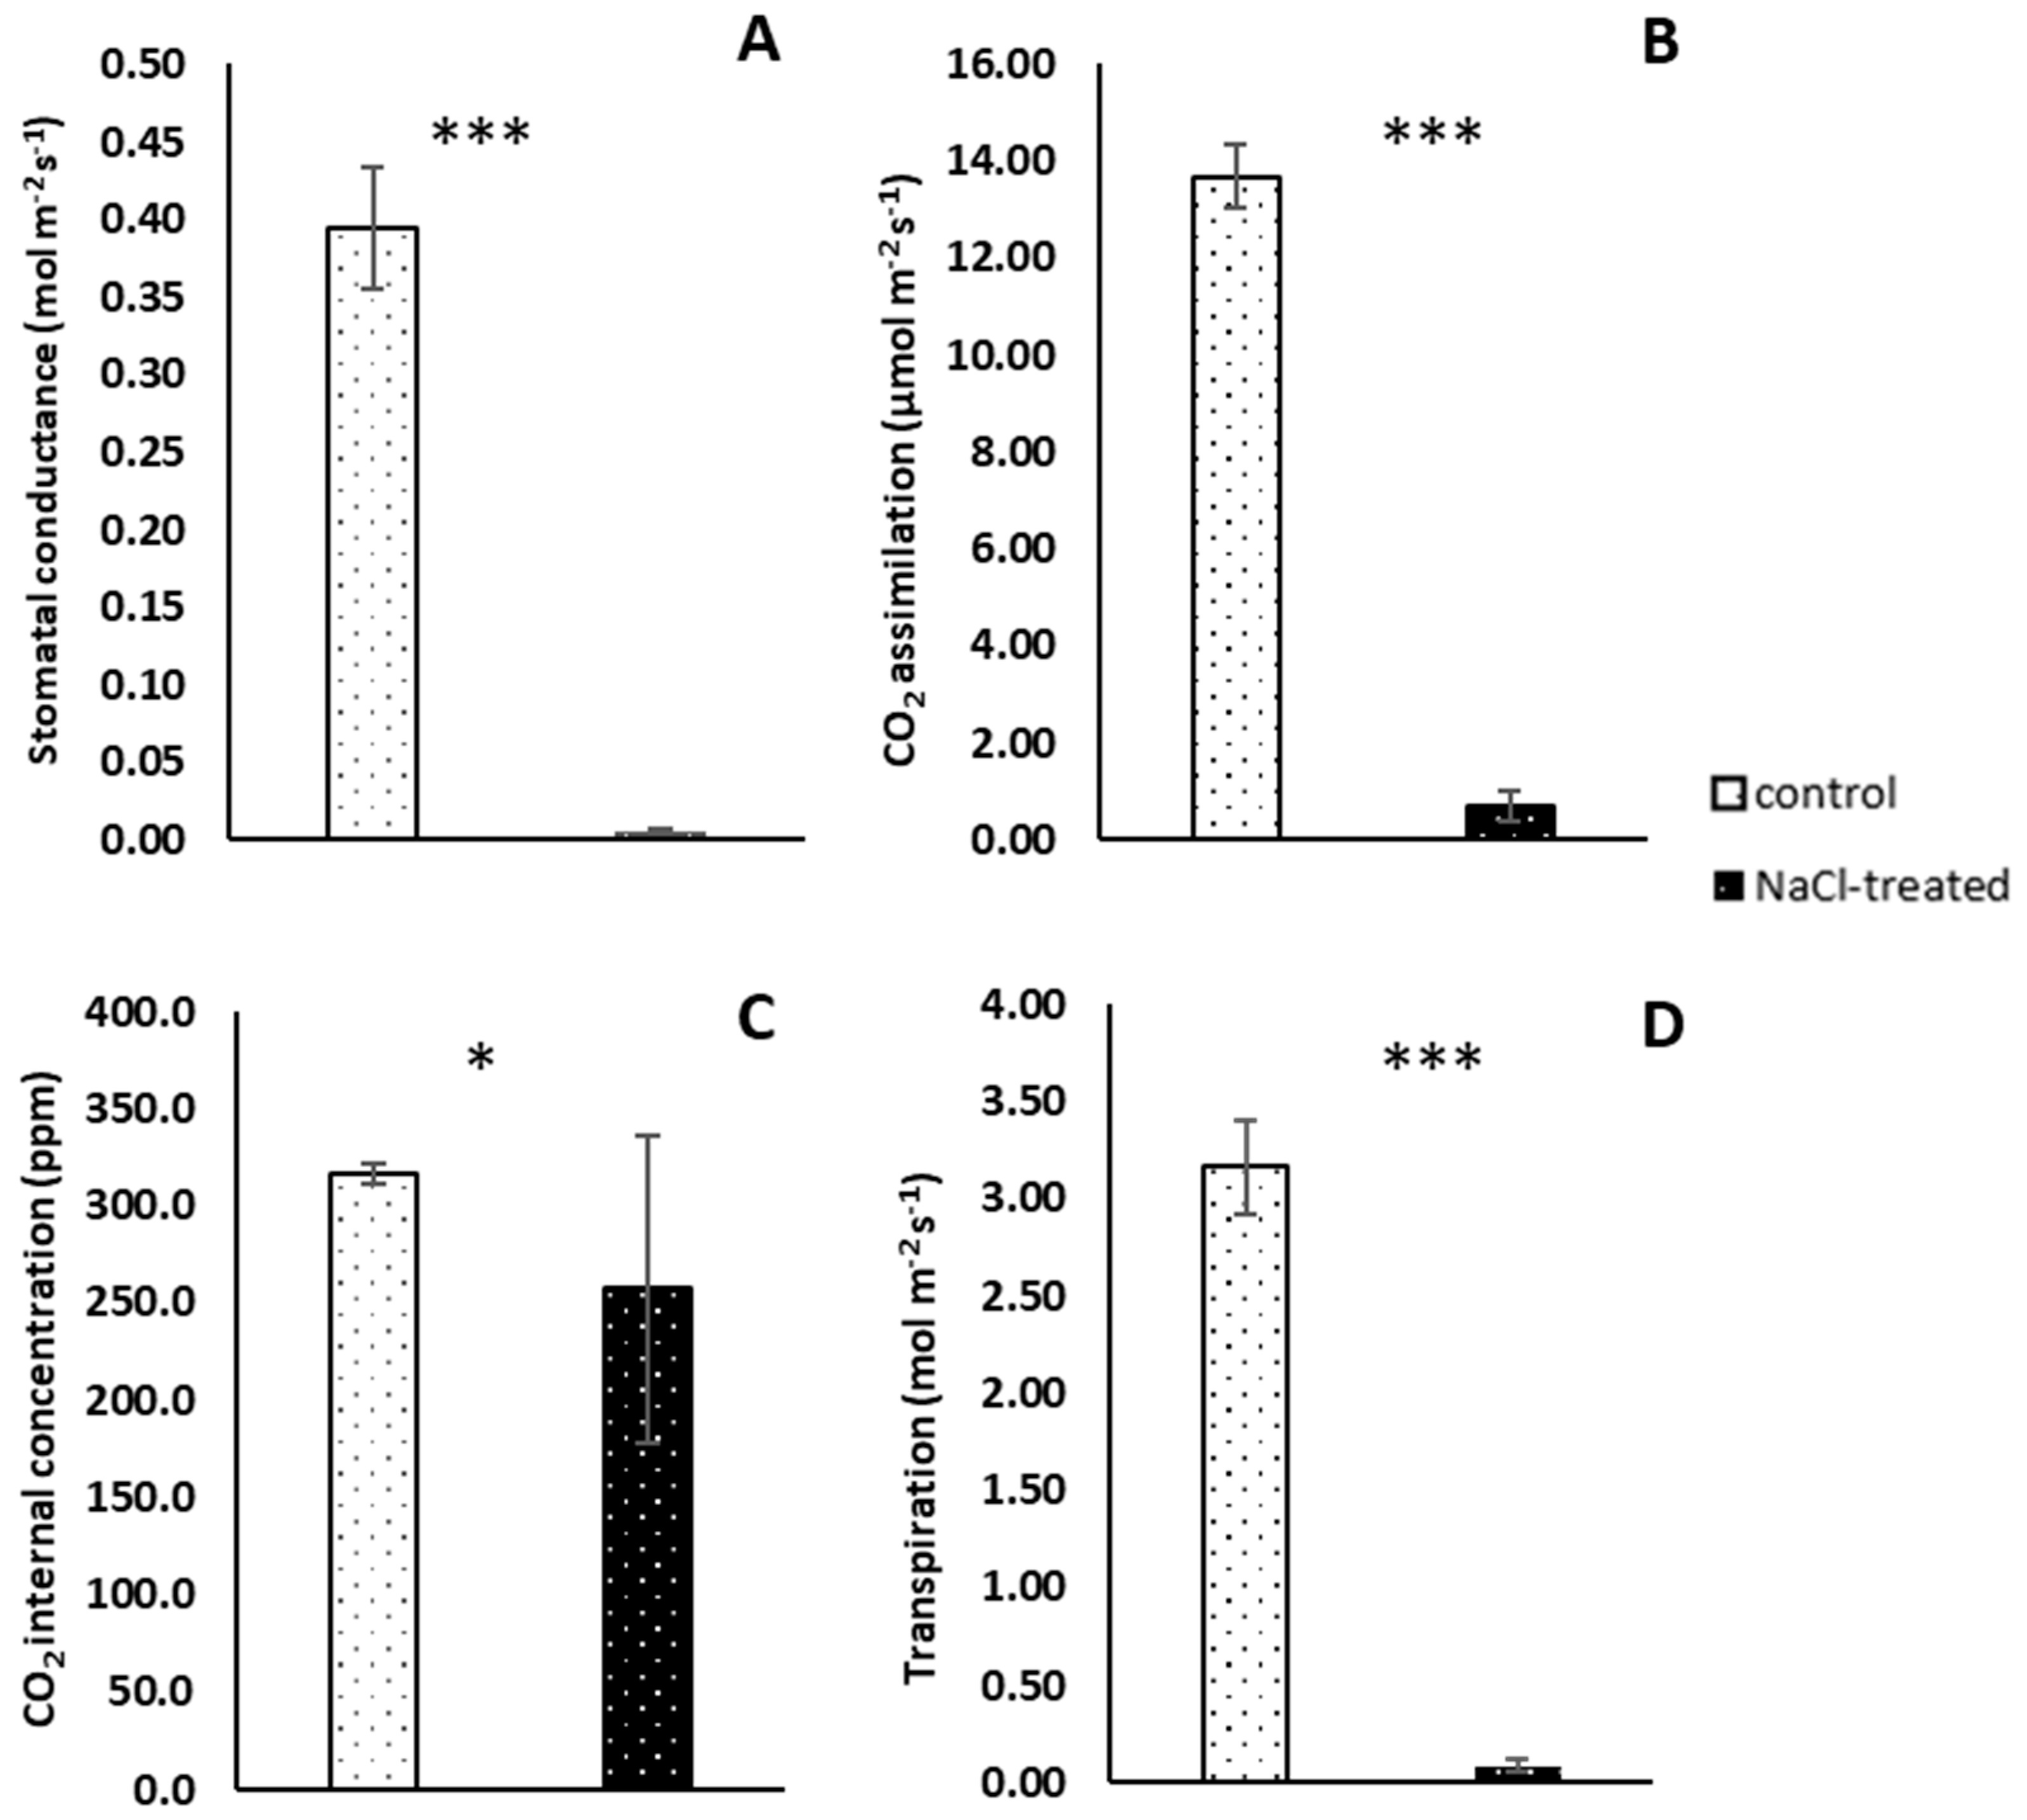
2.2. Gaseous Exchange

Measurements of gas exchange parameters indicated that in the leaves of NaCl-treated plants, the photochemical activity was inhibited between 10.00 a.m. and 4.00 p.m. Whereas the value of stomatal conductance achieved in control plants was 0.394 mol m−2 s−1, in treated plants stomatal conductance was not observed (Figure 2A). Similar results in the case of transpiration rate (for control plants 3.16 mol m−2 s−1) and CO2 assimilation rate (13.69 and 0.72 µmol m−2 s−1 for control and treated plants, respectively) have been observed (Figure 2B,D). A higher concentration of internal CO2 in the leaves of control plants in comparison to treated plants has been demonstrated. However, in this case, an increased level of CO2 concentration (256.9 ppm) has been measured in NaCl-treated plants. This value is over 0.8 times lower than in control plants (Figure 2C).

2.3. Genome-Wide Identification of Expressed Genes in M. crystallinum under Salinity Stress

RNA sequencing of 16 cDNA libraries, i.e., eight biological replicates gained from the control (C3) and NaCl-treated (CAM) plants, was performed on the Illumina NovaSeq 6000 platform. For each sample over 6.3 Gbp total read bases and over 41 billion reads were generated (Supplementary Table S1). A higher number of clean reads was generated in the NaCl-treated samples (in total 332,922,540 clean reads and 50.3 Gbp, with an average of 6.3 Gbp per sample). For the C3 samples, 1% fewer clean reads were obtained (in total 329,964,332 clean reads and 49.9 Gbp, with an average of 6.3 Gbp per sample). The average GC content was approximately 46% both in CAM and C3. The clean reads from all samples were subjected to a de novo assembly of transcriptome resulting in 129,206 identified unigenes and 150,442 identified transcripts with an N50 of 1403 bp (Supplementary Table S2).
Based on the read counts mapped to the set of assembled transcripts for each sample separately, an analysis of differential gene expression profiles between the two experimental groups was performed, using edgeR, DeSeq2, and Limma packages. The analysis of the Venn diagram enabled the identification of 3280 genes that were differentially expressed (DEGs—differently expressed genes) in all three tools used (Figure 3A). It was found that the direction of changes in the level of gene expression is the same regardless of the selected tool (Supplementary Figure S1, Supplementary Data S1). A total of 1918 (58%) genes were downregulated, while 1362 (42%) were upregulated in NaCl-treated when compared to control plants.
To better elucidate the biological functions of the DEGs in M. crystallinum, they were functionally annotated with gene ontology (GO) terms and classified as biological process (BP), molecular function (MF), and cellular component (CC). Among DEGs annotated with GO terms, 482 DEGs were assigned to 40 BP terms, 526 DEGs to 40 MF terms, and 1025 DEGs to 21 CC terms (Figure 3B–D, Supplementary Data S2).
Among DEGs assigned to 21 CC terms, the largest group was related to an integral component of membrane (GO:0016021), extracellular region (GO:0005576), cell wall (GO:0005618), plastid envelope (GO:0009526), and chloroplast thylakoid membrane (GO:0009535) (Figure 3B). Over 91% of DEGs were characterized by down-expression and these were genes related mainly to photosystem I, photosystem II, chloroplast thylakoid membrane, and envelope, as well as plant-type vacuole, aleuorone grain, and glycine cleavage complex (Table 1, Supplementary Data S2).
The dominant BP and MF subcategories for which upregulated genes in NaCl-treated (CAM) plants were assigned were response to abscisic acid (GO:0009737), response to water deprivation (GO:0009414), fatty acid biosynthetic process (GO:0006633), nitric oxide biosynthetic process (GO:0006809), DNA-binding transcription factors activity (GO:0003700), and flavine adenine dinucleotide binding (GO:0050660), respectively (Figure 3C,D, Supplementary Data S2). For those downregulated in NaCl-treated plant genes, the dominant enriched BP and MF subcategories included circadian rhythm (GO:0007623), photosynthesis light harvesting (GO:0009765), hydrogen peroxide catabolic process (GO:0042744), reductive pentose-phosphate cycle (GO:0019253), starch catabolic process (GO:0005983) and chlorophyll-binding (GO:0020037), iron-binding (GO:0005506), monooxygenase activity (GO:0004497), polysaccharide binding (GO:0030247), and ribulose-bisphosphate carboxylase activity (GO:0016984), respectively.
The functional analysis of DEGs under NaCl treatment allowed the identification of ET-related genes (ERGs) as well as those involved in the abscisic acid (ABA) catabolic process, nitric oxide biosynthetic process, regulation of stomatal movement, reductive pentose-phosphate cycle, glycine catabolic process, and also those involved in chlorophyll-binding, photosystem I, photosystem II, starch binding, and plant-type vacuole (Table 1).
Among the 3280 DEGs, we detected 15 ET-related genes (ERGs), of which 12 were upregulated in NaCl-treated plants including 1-aminocyclopropane-1-carboxylate oxidase (ACO), ethylene receptor (ETR), protein reversion-to-ethylene sensitivity 1 (RTE1), and ethylene-responsive transcription factors, i.e., RAP2.3, RAP2.4, RAP2.12, ERF61, ERF80, and AP2LI and WRKY transcription factor 23 (WRKY23) (Table 1, Supplementary Data S2). We found that the RAV2 (AP2/ERF and B3 domain-containing transcription repressor RAV2) gene was downregulated in the NaCl-treated samples.
Most DEGs assigned to the abscisic acid (ABA) catabolic process (GO:0046345) accumulated higher transcript levels under salt stress, i.e., phosphoenolpyruvate carboxylase kinase 1 (PPCK1), protein C2-domain ABA-related 4 (CAR4), homeobox-leucine zipper protein ATHB-7 (ATHB7), homeobox protein BEL1 homolog (BEL1 and BELH1), protein phosphatase 2C (P2C24, P2C37, and P2C56), fructose-bisphosphate aldolase 2 (ALFC2), aquaporin PIP2-2 (PIP22), protein early-responsive to dehydration 7 (ERD7), annexin D4 (ANXD4), galactinol synthase 2 (GOLS2), Ninja-family protein AFP2 (AFP2), primary amine oxidase (AMO), serine/threonine-protein kinases (SAPK2, SRK2I, and CIPK1, and Y1141), calcium-dependent protein kinases (CRK, CDPKO), membrane proteins (RMR41, CRPM4, HHP1, and ECP44), and ABA-related transcription factors (AP2L1, SRM1, MYB88, MYBS3, MY102, NAP2, and NAC2) (Table 1).
However, abscisic acid 8′-hydroxylase (ABAH2, ABAH4) and RNA-binding protein CP29B (CP29B) genes were downregulated under NaCl treatment.
Two genes involved in the nitric oxide biosynthetic process, i.e., encoded nitric oxide synthase (NOS) and primary amine oxidase (AMO), as well as 10 genes related to the regulation of stomatal movement, i.e., encoded beta carbonic anhydrase (BCA1, BCA2, and CAH2), protein phosphatase 2C (P2C37 and P2C56), serine/threonine-protein kinase SRK2I (SRK21), protein zinc induced facilitator-like 1 (ZIFL1), potassium channel AKT1 (AKT1), sodium/hydrogen exchanger 2 (NHX2), and transcription factor MYB61, were overexpressed in NaCl-treated plants (Table 1).
Salt stress in M. crystallinum decreased the expression of genes related to the reductive pentose-phosphate cycle (Benson–Calvin cycle), photosynthesis, glycine catabolic process, and starch binding and localized in the vacuole.
For the reductive pentose-phosphate cycle, it was possible to detect six DEGs encoding ribulose bisphosphate carboxylase small chain (RBS1, RBS3, RBS4, RBS5, and RBS6), three phosphoribulokinase (KPPR) genes, and Rubisco accumulation factor 1.2 (RAF2), glyceraldehyde-3-phosphate dehydrogenase GAPB (G3PB), and sedoheptulose-1,7-bisphosphatase (S17P) genes (Table 1).
The largest group of DEGs characterized by reduced expression levels under salt stress were genes related to photosynthesis, including genes related to chlorophyll-binding a-b (CB2A, CB2D, CB4C, CB21, CB23, and CB27), photosystem I reaction centre (PSAD and PSAH), and photosystem II, i.e., RNA-binding protein CP29B and oxygen-evolving enhancer protein 3-1 genes (Table 1). Moreover, a large group of downregulated genes were chloroplast-encoded genes.
Among the downregulated genes involved in the glycine catabolic process, there were mitochondrial genes such as glycine cleavage system H protein (GCSH), aminomethyltransferase (GCST), and glycine dehydrogenase (GCSP) (Table 1).
The expression of two genes related to starch binding, i.e., 4-alpha-glucanotransferase DPE2 and phosphoglucan phosphatase DSP4, was suppressed by NaCl treatment.
We observed negative changes in the expression of genes related to the vacuole, i.e., protein NRT1/ PTR family 8.3 (PTR2), vacuolar cation/proton exchanger 3 (CAX3), two-pore calcium channel protein 1 (TPC1), aquaporin (TIP11 and TIP21), KDEL-tailed cysteine endopeptidase (CEP1), cyanidin 3-O-glucoside 5-O-glucosyltransferase (AA5GT), and transporters (ABC transporters, nitrate transporter 2.5, aluminium-activated malate transporters, sugar transporter ERD6-like, Na/Ca exchanger NCL, and organic cation/carnitine transporter 3) (Table 1).

2.4. Gene Expression Analysis

To determine how salinity stress occurrence affects the expression profile of genes involved in the ET biosynthesis pathway, ACO and ACS, in leaves of M. crystallinum plants, quantitative PCR was employed. Our analyses showed that the daily courses of the transcript amounts of enzymes directly involved in ET biosynthesis, precisely ACS6 and ACO1, were disturbed by a salinity stress episode (Figure 4). A comparison of ACS6 daily expression in control (C3) and NaCl-treated (CAM) plants suggests at least some stress-induced modification. Our analyses revealed statistically significant differences in the expression level of genes between control and NaCl-treated plants in three out of five analysed time points (Figure 4A). Increased ACS6 expression was measured in C3 plants at 12:00, 6 p.m., and 00:00. In the case of ACO1, the salinity-induced modification was even more evident (Figure 4B). In salinity-stressed (+NaCl, CAM) plants, the expression of ACO1 was downregulated in all analysed time points in comparison to control plants. While in CAM plants ACO1 expression levels were more or less similar, in C3 plants the 24-h course of expression showed a clear differentiation between analysed time points with the highest expression reaching an over 6-fold increase in comparison to NaCl-treated plants at 00:00 a.m. (18 h past the start point). In control plants, the daily course of ACS6 and ACO1 expression was found to be similar; however, in the case of the latter gene, the increase in expression in a daily rhythm was delayed by 6 h.
Although products of ACS10 expression are not directly involved in the ET biosynthesis pathway we also estimated the daily course of this gene expression profile. A significant difference between control and salinity-stressed (CAM) plants was observed in only one out of six analysed time points, precisely at 12:00 (6 h past the beginning of the cycle) (Supplementary Figure S2). In this case, the salinity stress impact on the ACS10 daily expression course was rather scarce.

2.5. ACC Content Analysis

1-aminocycloprapane-1-carboxylic acid (ACC) is the immediate precursor of ET in plants. ACC is synthesized by the ACS enzyme from S-adenosyl-L-methionine (SAM) and later converted to ET by the ACO enzyme. To determine how salinity stress occurrence affects the profile of ACC biosynthesis in M. crystallinum, a liquid chromatography-mass spectroscopy method was employed. In three out of five analysed time points, we found no statistically significant differences in ACC amount between control and salinity-treated plants. However, in stress-affected plants we found significantly lower amounts of ACC at 6.00 am (Figure 5). While in control plants the ACC concentration ranged between 36 and 43 pmol g−1 and reached its maximum after 24 h from the start point, in NaCl-treated (CAM) plants it ranged from 29 to 42 pmol g−1 with a maximum at 6 p.m. (Figure 5).

3. Discussion

To discuss the role of salinity on chosen phytohormones an evaluation of the general condition of the plants is necessary. NDVI, PRI, and CRI values are related to the level of plant stress. Reflectance measurements enable the estimation of part of the light reflected from the leaf surface. Higher values of NDVI (in the range from −1.0 to 1.0) indicate better plant condition. We also know that higher values for PRI and CRI parameters can be related to an elevated stress level in plants [40,41,42]. The analysis of reflectance parameters did not show significant discrepancies between control (C3) and NaCl-treated plants (CAM). Also, NDVI values between 0.5 and 1.0 indicated good conditions of not only control, but also NaCl-treated plants. No significant differences between PRI and CRI suggest that treated plants can cope with salinity stress and 14 days of NaCl irrigation do not influence photochemical apparatus efficiency. Nevertheless, gas exchange measurements proved CAM photosynthesis mode occurrence in plants treated for 14 days with NaCl solution. M. crystallinum CAM-performing plants exhibit a specific pattern of day/night CO2 assimilation different than that of C3. During the day, the stomata of CAM plants remain mostly closed and, as a consequence, the assimilation of external CO2 and transpiration is inhibited. The CO2 is absorbed during the night and fixed mainly by the cytoplasmic phosphoenolpyruvate carboxylase (PEPC) enzyme and later, during the day, carbon is successively used as a substrate in the Calvin–Benson–Bassham (CBB) cycle [43]. The obtained results are a confirmation of these processes in NaCl-treated leaves. Other than in the leaves of control plants, which realize C3 photosynthesis and assimilate CO2 during the day, transpiration and total CO2 assimilation in NaCl-treated plants was inhibited. Internal CO2 present in CAM plants has been fixed during the night and its level decreases as the photosynthesis process progresses during the day. Mentioned observations were also confirmed via transcriptome analysis. As we know, photosynthetic activity (CO2 fixation) in CAM plants is much lower compared to C3 plants [44,45]. Thus, we may expect that the expression of genes responsible for small subunits (nuclear-encoded) will be lower, as will also be the case for other enzymes taking part in the Calvin cycle. All identified genes of a small chain of D-ribulose 1,5-bisphosphate carboxylase/oxygenase (Rubisco), the main enzyme engaged in carbon dioxide absorption in C3 photosynthesis mode, are downregulated in treated plants. Also, a lower expression level of the chloroplastic Rubisco accumulation factor 1.2 gene was noted. Rubisco is a bifunctional enzyme responsible not only for CO2 fixation. This enzyme also plays a crucial role in the photorespiration process (oxygen fixing in light conditions) whose product is, among others, glycine, a substrate for the synthesis of glutathione, which is a factor involved in a protected process under different plant stresses [46,47]. This process serves as an energy sink preventing the over-reduction of the photosynthetic electron transport chain, especially under stress conditions that lead to reduced rates of photosynthetic CO2 assimilation. We suppose that two-week salinity stress could induce this process in M. crystallinum plants. The downregulation of genes of enzymes involved in the glycine catabolic process can protect against glycine degradation and lower the abundance of this substrate. According to previous research [38,39], we know that 2-week salinity stress induction via NaCl solution leads to a change in photosynthetic type from C3 to CAM in M. crystallinum plants. This approach does not cause irreversible damage to our model plant machinery. Nevertheless, salt conditions also influence changes in metabolic machinery, signalling pathways, hormonal and gene expression regulation in halophyte plants [47]. Following lower photosynthetic activity, a lower amount of photosynthetic machinery in CAM plants is also expected. Thus, all genes encoding proteins necessary for chla and chlb binding in thylakoids in reaction centres and photosynthetic antennae are expressed in lower amounts. The same expectation can also explain lower reductase protochlorofilides, and proteins necessary for PSI (photosystem I) building. The inactivation of both PSII (photosystem II) and PSI (photosystem I) by increasing the cytosol’s NaCl levels has been described earlier [48,49].
In addition, genes responsible for NO synthesis like nitric oxide synthase are activated. Several metabolic processes can be controlled by this molecule, but the most important are the protection of plants against the undesirable effects of free radicals, the modulation of stress resistance gene expression, and finally, programmed cell death. Among different phytohormones, the gaseous olefin ethylene (ET), next to salicylic acid (SA), abscisic acid (AB), and jasmonic acid (JA), is usually mentioned when plant interactions with both biotic and abiotic environmental stressors are discussed [50,51,52]. We detected that over fifty genes involved in response to ABA have been activated. As ABA is one of the most important factors controlling stomatal aperture, we can suspect that a sensitive system which allows the control of excess transpiration is necessary in plants exposed to salinity. In addition to this, salinity stress in M. crystallinum induces CAM metabolism that is the opposite of the C3 plant stomata daily opening/closing rhythm. As shown in our experiments, this needs a higher expression of genes responsible for ABA. This process involves the binding of ABA to PYR/RCAR receptors [53,54]. Genes responsible for ABA catabolic processes are strongly lowered. Again, this would indicate that ABA-responsible mechanisms are necessary in plants exposed to salinity (CAM).
In our opinion, for all plant–environmental interactions in which ET is involved, it is particularly important to understand the contribution of this phytohormone in response to salinity stress. Experimental data obtained mostly from transgenic plant analyses show that salinity stress affects almost all components of both ET biosynthesis, as well as the signal transduction pathway. The increase in ET-responsive genes transcription factors and ET receptors together with the decrease in transcription repressors could point out the fact that plants exposed to salinity are better prepared to respond to different biotic and abiotic stresses. Thus, due to exposure to salinity, tested plants can be prepared for other stresses in a mechanism known as the cross-tolerance mechanism. In the context of expression level fluctuations of the gene involved in the ET biosynthesis and signalling pathway under salinity stress, A. thaliana seems to be the best characterized plant [1]. Based on the expression profile related to ET synthesis, perception, and action, we suppose that prolonged salinity stress influences ET activation. Nevertheless, this factor does not affect semi-halophyte M. crystallinum plants so strongly as to induce a burst of ET biosynthesis. We detected a higher level of 1-aminocyclopropane-1-carboxylate oxidase gene expression, a gene of the key enzyme responsible for the catalysis of ET biosynthesis from ACC substrate synthesis [55]. The increase in ACO transcript numbers was also observed in tobacco [29]. Short and long salinity stress induced the upregulation of genes engaged in ET biosynthesis in cotton (Gossypium) like ETR, EIN, and ERF [26]. Surprisingly, in our analysis the expression of the ACO5 gene was decreased. A similar observation was made during the analysis of Plantago major transcriptomic profiling [56]. A higher level of expression in NaCl-treated plants was also described in the case of the ethylene response 1 (ETR-1) gene. ETR is a receptor localized in the endoplasmic reticulum and constitutes the negative regulator of the ET signalling pathway [56]. Nevertheless, ETR genes expression was inhibited under salinity stress in A. thaliana. Moreover, A. thaliana mutants with an etr loss-of-function were more tolerant to salinity stress. In our opinion, salinity treatment was not so intensive a stress factor as to induce the complete ET perception and signalling pathway, but genes of some factors responsible for plant response under stress conditions were activated. Among them, the most important are transcription factors (TFs) able to interact with other genes to activate or repress their transcription. The largest number of TFs belong to the ET response factors (ERFs) superfamily. In M. crystallinum NaCl-treated plants, some genes of TFs were upregulated. RAP2-3, RAP2-4, and RAP2-12 [57,58] are factors responsible for positively regulating low oxygen, oxidative, osmotic, and drought stress and most importantly, ET-mediated development. RAP2-12 gene overexpression resulted in a lower concentration of H2O2 and increased accumulation of proline in Arabidopsis under salinity stress [59]. Similar to RAP, ERF61 and ERF80 play a crucial role in the stress response of plants [60]. On the contrary, the expression of ERF53, responsible for the positive regulation of response under heat stress, was lower in CAM plants, similar to the AP2/ERF gene, whose product also plays a crucial role in positive stress response. These findings can indicate that during the leaves material collection, plants were at the stage of adaptation and the development of proper mechanisms for salinity stress after a temporary increase in ET biosynthesis during NaCl-treatment. Our theory is supported by the downregulation of RTE-1 gene expression. RTE-1 protein is another negative regulator of ET. ET induces the overexpression of the RTE-1 gene and the product of this process induces a decrease plant sensitivity to ET [61]. Nevertheless, the influence of salinity stress is confirmed by the overexpression of the WRK23 gene. The WRK23 protein confers tolerance to NaCl-stress in A. thaliana [62].
ET is derived from the amino acid methionine, which is converted to S-adenosylmethionine (SAM) by S-adenosylmethionine synthase. SAM is converted to 1-aminocyclopropane-1-carboxylic acid (ACC) ACC synthase (ACS) and then ACC is converted to CO2 and cyanide by ACC oxidase (ACO). In most plant species, ACS is encoded by multigene families, which are differentially regulated by various environmental and developmental factors. In tomato (Solanum lycopersicum, syn. Lycopersicon esculentum), nine ACS genes have been cloned and their expression studied. LeACS6 transcripts normally accumulate in non-ripening fruit. The Arabidopsis thaliana genome encodes 12 ACS-like genes. ACS3 is a pseudogene with a short sequence, whereas ACS10 and 12 can complement the Escherichia coli aminotransferase mutant DL39 and are thus aminotransferases [63,64]. According to the TAIR database, the product of ACS6 gene expression in A. thaliana tissues is involved in, among others, the ACC biosynthesis process, whereas the ACS10 protein does not have ACC synthase activity. Both ACS6 and ACS10 are expressed in leaves. The ACO1 gene is expressed in A. thaliana leaves apex and the ACO1 enzyme plays a crucial role in ET biosynthesis. ACO1 and ACS6 proteins are located in the cytoplasm (https://www.arabidopsis.org/index.jsp (accessed on 29 December 2022)) [65]. No changes in the expression level of the constitutive triple response 1 (CTR1) gene were detected. CTR1 is another ET negative regulator, whose expression level is usually regulated in plants under salinity stress. In ctr1 loss-of-function Arabidopsis mutants, higher salinity resistance was detected [66].
However, since ACC is a rate-limiting step in ET biosynthesis, ACS is considered a major target in determining the production of this phytohormone during stress response [31]. Most of the eight functional ACS genes found in A. thaliana, namely ACS1, ACS2, ACS5, ACS6, ACS7, and ACS8, as well as their respective homologs, were found to be upregulated during the salinity stress response in different plants, mostly glycophytes [67,68,69,70,71]. Moreover, Ellouzi et al. (2014) [72] reported that halophyte representatives, namely Cakile maritima and Thellungiella salsuginea responded to short-term salinity stress with intensive ACC accumulation, and somehow weaker ACC accumulation was described in the mentioned study for the glycophyte representative, namely A. thaliana. In all reported cases, ACC accumulation was assessed up to 72 h past salinity stress initiation. Thus, the mentioned studies unequivocally support the assumption that salinity stress induces the production of ACC, mainly by upregulated ACC gene expression. Here, we analysed the circadian rhythm of ACS6 homolog expression in salinity-stressed common ice plants. Contrary to the mentioned experimental data, we found that 14-day-long salinity stress resulted in ACS6 suppression in all time points of the analysed circadian rhythm. This result was, to some extent, supported by the ACC amount analysis, and we also found that 14-day long salinity stress presence had a minute effect on the circadian rhythm of ACC leaf concentration. Besides ACS, ACO represents the second key enzyme in the ET biosynthesis pathway. According to earlier studies, several ACO genes expression as well as protein activity were upregulated in response to salinity stress [70,73]. However, a different salinity stress response, precisely ACO1 downregulation, was described for wheat [74]. In our semi-halophyte model plant, we found a completely different salinity stress response of ACO gene family members. Similar to the ACS genes family member described earlier, 14-day-long salinity stress downregulated ACO1 expression in all time points of the analysed circadian rhythm. We believe that the insight presented here into the circadian rhythm of the expression of semi-halophyte ACS and ACO genes family members represents an image of the steady-state established past the 14-day-long salinity treatment. One can speculate that during the very first hours of salinity stress response, the circadian rhythm of the expression of an ice plant’s ACS and ACO orthologs, and resulting ACC concentration, could be completely different. Moreover, while experimental data suggest the precise control of ET biosynthesis, our results may simply indicate that at the analysed stage of stress response the common ice plant required no additional ET.

4. Materials and Methods

4.1. Plant Cultivation

M. crystallinum L. seeds from one set (from the collection of the Botanical Garden of the Technical University of Darmstadt, Germany) were sown onto soil substrate in a greenhouse under controlled conditions of light (250–300 μmol photons m−2 s−1 of photosynthetically active radiation (PhAR)), relative humidity (RH) (50–60%), and 16/8 h day/night period. The substrate implemented in the experiment was made of the market-available soil “Aro” and sand (grain size in the range of 1–2 mm) mixed in a 4:1 v/v ratio. Two weeks after sowing, each seedling with a fully developed second leaf pair was transferred to an individual 0.4 L pot with 360 ± 0.1 g of the mentioned substrate applied per pot. After 6 weeks, the plants were divided into two groups: the first group was irrigated with tap water (control), and the second group was irrigated with 0.4 M NaCl (NaCl-treated). After 14 days of treatment with 8-week-old plants, CAM development in the NaCl-treated plants was confirmed by the measurement of the diurnal Δ-malate, a hallmark of functional CAM photosynthesis expressed as the difference in cell sap malate concentration between the beginning and the end of the light phase. Δ-malate was measured according to the method previously described for Clusia hilariana Schltdl [75]. With the CAM presence confirmed, the fourth pair of leaves of the control and NaCl-treated plants were collected for transcriptome analysis (n = 8). To determine the diurnal regulation of ET biosynthesis in salinity stress-affected plants, for biochemical and molecular analysis, the mentioned leaf pairs of both control and NaCl-treated plants were collected every 6 h during a 24-h-long course (5 time points), immediately frozen in liquid nitrogen, ground, and then stored at −80 °C.

4.2. Reflectance Measurement

Reflectance parameters: normalized difference vegetation index (NDVI), photochemical reflectance index (PRI), and carotenoid reflectance index (CRI) measurements were performed on the fourth leaf pairs of control and NaCl-treated M. crystallinum L. plants (n = 4 for each type of plants) after 14 days from the start point of NaCl irrigation using handheld PolyPen RP410 (Photon Systems Instruments, Drasov, Czech Republic).

4.3. Gas Exchange Parameters Measurement

The measurement of the gas exchange was taken with the use of a gas analyser (Li-6400, Li-Cor, Lincoln, NE, USA) equipped with an LED light source (6400-02). The stomatal conductance, CO2 assimilation, transpiration, and internal CO2 concentration measurements were taken under conditions of photosynthetically active radiation (PAR). The measurements were made six times for three replicates of control and NaCl-treated M. crystallinum L. plants after 14 days from the start point of NaCl irrigation (1 replicate = 1 leaf of the fourth pair, 18 measurements in total for each parameter) between 10.00 a.m. and 4.00 p.m. The average value of all replicates for each parameter was calculated.

4.4. RNA Isolation

Total RNA was isolated from fine-powdered ice plant leaf tissues with an Aurum™ Total RNA Mini Kit (Bio-Rad, Hercules, CA, USA) according to the method previously described [39]. For the removal of DNA contamination, digestion with DNase I (DNA I Amplification Grade, Merck, Darmstadt, Germany) was used. Preliminary RNA purity and quantity were determined using a Biospec-Nano (Shimadzu, Japan). To assess the integrity and purity of the RNA, the extracted RNA was separated by electrophoresis on agarose (1.5%) gels stained with EtBr. The bands were visualised on a Molecular Imager® ChemiDoc™ XRS+ Imaging System (Bio-Rad, Hercules, CA, USA). For the transcriptome analysis, the quality of each isolated RNA sample/replicate was assessed with the Agilent 2100 Bioanalyser (Agilent, Santa Clara, CA, USA).

4.5. RNA Sequencing

The single sequencing library was prepared by a random fragmentation of the cDNA sample, followed by 5′ and 3′ adapter ligation. Sixteen cDNA libraries were prepared using the TrueSeq stranded mRNA Library Kit (Illumina, San Diego, CA, USA). Adapter-ligated fragments were then PCR amplified and gel purified. For cluster regeneration, the library was loaded into a flow cell where fragments were captured on a lawn of surface-bound oligos complementary to the library adapters. High-throughput RNA sequencing in PE151 (paired ends mode, with 151 bp read length) was performed by the Macrogen (Amsterdam, The Netherlands) using an Illumina NovaSeq6000 (Illumina, San Diego, CA, USA). All RNA-seq datasets generated for this study were deposited in the NCBI SRA database under BioProject PRJNA1089077.

4.6. Bioinformatics Analysis

Raw reads in the FASTQ format were subjected to qualitative analysis using the FastQC tool v. 0.11.5 (https://www.bioinformatics.babraham.ac.uk/projects/fastqc/ (accessed on 15 October 2022)) [76]. The Trinity program package [77] according to the RNA-seq experiment analysis protocol published in Nature Protocols [78] was used to analyse data. In addition, the Trimmomatic program was implemented [79] to remove adapters and cut off poor-quality readings. The quality filter was as follows: a Phred score (Q) = 20, minimal read length = 25 bp, and unpaired reads were excluded.
Next, cleaned reads were used for de novo assembly using the Trinity v2.4.0 (https://github.com/trinityrnaseq/trinityrnaseq/wiki (accessed on 20 July 2022)). The putative function of the assembled unigenes and transcripts was determined using the Trinotate ver. 3.1.0 (https://trinotate.github.io (accessed on 11 August 2022)) [80]. Protein coding regions for all transcripts were predicted using TransDecoder ver. 5.0.1 [78] and were identified using BLASTX and BLASTP. The identification of functional protein domains (HMMER/PFAM) was also carried out [81,82] and potential protein signals and transmembrane domains (SignalP/tmHMM) were predicted [83].
In the next step, the reads, for each sample separately, were mapped to a set of assembled transcripts using the Bowtie2 aligner [84]. The number of mapped reads to unigenes and transcripts for each library was calculated with RSEM [85] and normalisation was done by specifying the number of fragments per kilobase of exon per million mapped fragments (FPKM). Differentially expressed genes (DEGs) were calculated using EdgeR [86], Deseq2 [87], and Limma [88]. The p values were adjusted for multiple testing using the Benjamini–Hochberg method. A corrected p value of 0.05 and log2 fold-change of ±1 were set as the threshold for significant differential expression. The GO (gene ontology) enrichment of differentially expressed genes (DEGs) was carried out using the topGO package [89] from R ver. 3.6.3, and also the ClusterProfiler ver. 3.6.0 (http://www.bioconductor.org/packages/release/bioc/html/clusterProfiler.html (accessed on 10 November 2022)) [90].

4.7. qPCR

Reverse transcription was carried out on 1000 ng of total RNA with an iScript cDNA Synthesis Kit (Bio-Rad, Hercules, CA, USA). During qPCR, the samples were labelled with iQ™ SYBR® Green Supermix (Bio-Rad, Hercules, CA, USA) fluorescent dye. For a single reaction, 10–20 ng of cDNA and 150 nM of gene-specific primers were used (Supplementary Table S3). Each reaction consisted of 40 cycles and was performed in 4 repetitions. To test the amplification specificity, a dissociation curve was acquired by heating samples from 60 °C to 95 °C. The ubiquitin gene (Acc. no AF053563.1) was used as a housekeeping reference gene. The reaction efficiency was tested by serial dilutions of cDNAs with gene-specific primers. The expression was calculated using at least three reactions with an unstressed control (C3) from the first time point as calibrators according to a previously described method [91].

4.8. HPLC-MS Analysis of ACC Content

ACC content in M. crystallinum plants was measured according to the method described by Müller and Munne-Bosch (2011) [92] with some modifications. About 500 mg of frozen leaf material, previously ground in liquid nitrogen, was extracted with 5 mL of extraction solvent (methanol:isopropanol, 20:80 (v/v) with 1% of glacial acetic acid) using ultrasonication (4–7 °C) for 30 min in a 15 mL Falcon tube. After centrifugation (10,000 rpm for 15 min at 4 °C), the supernatant was collected and the pellet was re-extracted with 1 mL of extraction solvent and this step was repeated three times. Then, supernatants were combined and dried completely under a nitrogen stream and re-dissolved in 500 μL of methanol and filtered through a 0.22 μm PTFE filter (Waters, Milford, MA, USA). Samples (5 μL) were then analysed by UPLC/ESI-MS/MS. The HPLC analysis was conducted using a Shimadzu LCMS-2020 (JPN) system with an autosampler. Plant extract separation was carried out using a Kinetex 2.6 µm C18 100 × 2.1 mm column. The flow rate of the eluent was maintained at 0.400 mL/min. The gradient profile was as outlined in Müller and Munne-Bosch (2011) [92]. MS analysis was conducted with a Shimadzu quadrupole mass spectrometer in positive ion mode for ACC analysis. The MS settings included the following: DL temperature at 250 °C, HB temperature at 200 °C, detector voltage at 0.95 kV, oven temperature at 35 °C, and a nebulizing gas flow of 15 L/min. ACC concentration in plant tissues was quantified using the external standard calibration curve method, preparing five standard solutions ranging from 0.05 to 10 ng/µL.

4.9. Statistical Analyses

All statistical analyses of results were performed with Statistica 13 (Statsoft, Tulsa, OK, USA) software. For pairwise comparisons, the Student’s t-test was used. The data were subjected to a one-way analysis of variance (ANOVA).

5. Conclusions

The results collected in this report indicate that in semi-halophytes, the sustained stress of prolonged salinity stress does not have a significant impact on the main components of biosynthesis and molecular mechanisms involved in its regulation. It is possible that, at the analysed moment of plant–environment interaction, the involvement of such potent phytohormones and modifications implemented in ET production during the very first hours of the plant–environment interaction meets the current demand. The view emerging from the assessed results may represent the steady state that is established in semi-halophytes during prolonged salinity stress response.

Supplementary Materials

The supporting information can be downloaded at: https://0-www-mdpi-com.brum.beds.ac.uk/article/10.3390/ijms25094777/s1.

Author Contributions

M.G.—formal analysis, writing—original draft preparation, and data curation; Z.M.—supervision, funding acquisition, conceptualization, writing—review and editing, and project administration; P.R.—conceptualization, investigation, and writing—review and editing; R.J.J.—formal analysis, writing—original draft preparation, methodology, and validation; M.C.—formal analysis, software, visualization, and writing—review and editing; M.N.—conceptualization, project administration, writing—original draft preparation, and validation. All authors have read and agreed to the published version of the manuscript.

Funding

This research was supported by the National Science Centre (NCN, Poland) OPUS 19 Project No. 2019/35/B/NZ9/01544.

Institutional Review Board Statement

Not applicable.

Informed Consent Statement

Not applicable.

Data Availability Statement

Data is contained within the article or Supplementary Material.

Conflicts of Interest

The authors declare no conflict of interest.

References

  1. Riyazuddin, R.; Verma, R.; Singh, K.; Nisha, N.; Keisham, M.; Bhati, K.K.; Kim, S.T.; Gupta, R. Ethylene: A master regulator of salinity stress tolerance in plants. Biomolecules 2020, 10, 959. [Google Scholar] [CrossRef] [PubMed]
  2. Parihar, P.; Singh, S.; Singh, R.; Singh, V.P.; Prasad, S.M. Effect of salinity stress on plants and its tolerance strategies: A review. Environ. Sci. Pollut. Res. 2015, 22, 4056–4075. [Google Scholar] [CrossRef] [PubMed]
  3. Mager, W.H.; de Boer, A.H.; Siderius, M.H.; Voss, H.P. Cellular responses to oxidative and osmotic stress. Cell Stress Chaperones 2000, 5, 73–77. [Google Scholar] [CrossRef] [PubMed]
  4. Acosta-Motos, J.R.; Ortuño, M.F.; Bernal-Vicente, A.; Diaz-Vivancos, P.; Sanchez-Blanco, M.J.; Hernandez, J.A. Plant responses to salt stress: Adaptive mechanisms. Agronomy 2017, 7, 18. [Google Scholar] [CrossRef]
  5. Munns, R.; Tester, M. Mechanisms of salinity tolerance. Annu. Rev. Plant Biol. 2008, 59, 651–681. [Google Scholar] [CrossRef] [PubMed]
  6. Hellebusi, J.A. Osmoregulation. Annu. Rev. Plant Physiol. 1976, 27, 485–505. [Google Scholar] [CrossRef]
  7. Ozturk, M.; Turkyilmaz Unal, B.; García-Caparrós, P.; Khursheed, A.; Gul, A.; Hasanuzzaman, M. Osmoregulation and Its Actions during the Drought Stress in Plants. Physiol. Plant. 2021, 172, 1321–1335. [Google Scholar] [CrossRef]
  8. Libik-Konieczny, M.; Kuźniak, E.; Surówka, E.; Ślesak, I.; Nosek, M.; Miszalski, Z. Crassulacean acid metabolism and its role in plant acclimatization to abiotic stresses and defence against pathogens. In Progress in Botany; Springer: Berlin/Heidelberg, Germany, 2019; pp. 1–30. [Google Scholar]
  9. Gonçalves, A.Z.; Latansio, S.; Detmann, K.C.; Marabesi, M.A.; Neto, A.A.C.; Aidar, M.P.M.; DaMatta, F.M.; Mercier, H. What does the RuBisCO activity tell us about a C(3)-CAM plant? Plant Physiol. Biochem. 2020, 147, 172–180. [Google Scholar] [CrossRef] [PubMed]
  10. Guan, Q.; Tan, B.; Kelley, T.M.; Tian, J.; Chen, S. Physiological Changes in Mesembryanthemum crystallinum During the C3 to CAM Transition Induced by Salt Stress. Front. Plant Sci. 2020, 11, 283. [Google Scholar] [CrossRef]
  11. Wakamatsu, A.; Mori, I.C.; Matsuura, T.; Taniwaki, Y.; Ishii, R.; Yoshida, R. Possible roles for phytohormones in controlling the stomatal behavior of Mesembryanthemum crystallinum during the salt-induced transition from C3 to Crassulacean acid metabolism. J. Plant Physiol. 2021, 262, 153448. [Google Scholar] [CrossRef]
  12. Taybi, T.; Cushman, J.C. Abscisic acid signaling and protein synthesis requirements for phosphoenolpyruvate carboxylase transcript induction in the common ice plant. J. Plant Physiol. 2002, 159, 1235–1243. [Google Scholar] [CrossRef]
  13. Großkinsky, D.K.; Tafner, R.; Moreno, M.V.; Stenglein, S.A.; de Salamone, I.E.G.; Nelson, L.M.; Novák, O.; Strnad, M.; van der Graaff, E.; Roitsch, T. Cytokinin production by Pseudomonas fluorescens G20-18 determines biocontrol activity against Pseudomonas syringae in Arabidopsis. Sci. Rep. 2016, 6, 23310. [Google Scholar] [CrossRef]
  14. Wilkinson, S.; Davies, W.J. Drought, ozone, ABA and ethylene: New insights from cell to plant to community. Plant Cell Environ. 2010, 33, 510–525. [Google Scholar] [CrossRef]
  15. Taiz, L.; Zeiger, E. Plant Physiology, 2nd ed.; Palgrave Press: London, UK, 2012. [Google Scholar]
  16. Xu, J.; Zhang, S. Ethylene biosynthesis and regulation in plants. In Ethylene in Plants; Wen, C.K., Ed.; Springer: Dordrecht, The Netherlands, 2015; pp. 1–25. [Google Scholar]
  17. Sang-Dong, Y.; Younghee, C.; Jen, S. Emerging connections in the ethylene signaling network. Trend. Plant Sci. 2009, 14, 270–279. [Google Scholar]
  18. De Wild, H.; Otma, E.C.; Peppelenbos, W. Carbon dioxide action on ethylene biosynthesis of preclimacteric and climacteric pear fruit. J. Exp. Bot. 2013, 54, 1537–1544. [Google Scholar] [CrossRef]
  19. Guo, H.; Sun, Y.; Li, Y.; Zhang, W.; Ge, F. Elevated CO2 decreases the response of the ethylene signalling pathway in Medicago truncatula and increases the abundance of the pea aphid. New Phytol. 2014, 201, 279–291. [Google Scholar] [CrossRef] [PubMed]
  20. Kazan, K. Diverse roles of jasmonates and ethylene in abiotic stress tolerance. Trends Plant Sci. 2015, 20, 219–229. [Google Scholar] [CrossRef] [PubMed]
  21. AbdElgawad, H.; Zinta, G.; Hegab, M.M.; Pandey, R.; Asard, H.; Abuelsoud, W. High salinity induces different oxidative stress and antioxidant responses in maize seedlings organs. Front. Plant Sci. 2016, 7, 276. [Google Scholar] [CrossRef]
  22. Xu, L.; Xiang, G.; Sun, Q.; Ni, Y.; Jin, Z.; Gao, Z.; Yao, Y. Melatonin enhances salinity tolerance by promoting MYB108A-mediated ethylene biosynthesis in grapevines. Hortic. Res. 2019, 6, 114. [Google Scholar] [CrossRef]
  23. Freitas, V.S.; de Souza Miranda, R.; Costa, J.H.; de Oliveira, D.F.; de Oliveira Paula, S.; de Castro Miguel, E.; Freire, R.S.; Prisco, J.T.; Gomes-Filho, E. Ethylene triggers salinity tolerance in maize genotypes by modulating polyamine catabolism enzymes associated with H2O2 production. Environ. Exp. Bot. 2018, 145, 75–86. [Google Scholar] [CrossRef]
  24. Gharbi, E.; Martínez, J.P.; Benahmed, H.; Lepoint, G.; Vanpee, B.; Quinet, M.; Lutts, S. Inhibition of ethylene synthesis reduces salinity-tolerance in tomato wild relative species Solanum chilense. J. Plant Physiol. 2017, 210, 24–37. [Google Scholar] [CrossRef]
  25. Yang, C.; Ma, B.; He, S.J.; Xiong, Q.; Duan, K.X.; Yin, C.C.; Chen, H.; Lu, X.; Chen, S.H.; Zhang, J.H. MAOHUZI6/ETHYLENE INSENSITIVE3-LIKE1 and ETHYLENE INSENSITIVE3-LIKE2 regulate ethylene response of roots and coleoptiles and negatively affect salinity tolerance in rice. Plant Physiol. 2015, 169, 148–165. [Google Scholar] [CrossRef] [PubMed]
  26. Peng, Z.; He, S.; Gong, W.; Sun, J.; Pan, Z.; Xu, F.; Lu, Y.; Du, X. Comprehensive analysis of differentially expressed genes and transcriptional regulation induced by salt stress in two contrasting cotton genotypes. BMC Genom. 2014, 15, 760. [Google Scholar] [CrossRef] [PubMed]
  27. Zhou, H.L.; Cao, W.H.; Cao, Y.R.; Liu, J.; Hao, Y.J.; Zhang, J.S.; Chen, S.Y. Roles of ethylene receptor NTHK1 domains in plant growth, stress response and protein phosphorylation. FEBS Lett. 2006, 580, 1239–1250. [Google Scholar] [CrossRef] [PubMed]
  28. Cao, W.H.; Liu, J.; He, X.J.; Mu, R.L.; Zhou, H.L.; Chen, S.Y.; Zhang, J.S. Modulation of ethylene responses affects plant salinity-stress responses. Plant Physiol. 2007, 143, 707–719. [Google Scholar] [CrossRef] [PubMed]
  29. Chen, T.; Liu, J.; Lei, G.; Liu, Y.F.; Li, Z.G.; Tao, J.J.; Hao, Y.J.; Cao, Y.R.; Lin, Q.; Zhang, W.K.; et al. Effects of tobacco Ethylene receptor mutations on receptor kinase activity, plant growth and stress responses. Plant Cell Physiol. 2009, 50, 1636–1650. [Google Scholar] [CrossRef] [PubMed]
  30. Lei, G.; Shen, M.; Li, Z.G.; Zhang, B.; Duan, K.X.; Wang, N.; Cao, Y.R.; Zhang, W.K.; Ma, B.; Ling, H.Q.; et al. EIN2 regulates salinity stress response and interacts with a MA3 domain-containing protein ECIP1 in Arabidopsis. Plant Cell Environ. 2011, 34, 1678–1692. [Google Scholar] [CrossRef] [PubMed]
  31. Tao, J.; Chen, H.; Ma, B.; Zhang, W.; Chen, S.; Zhang, J. The role of ethylene in plants under salinity stress. Front. Plant Sci. 2015, 6, 1059. [Google Scholar] [CrossRef]
  32. Kholodova, V.; Volkov, K.; Kuznetsov, V. Adaptation of the common ice plant to high copper and zinc concentrations and their potential using for phytoremediation. Russ. J. Plant Physiol. 2005, 52, 748–757. [Google Scholar] [CrossRef]
  33. Amari, T.; Ghnaya, T.; Debez, A.; Taamali, M.; Ben Youssef, N.; Lucchini, G.; Sacchi, G.A.; Abdelly, C. Comparative Ni tolerance and accumulation potentials between Mesembryanthemum crystallinum (halophyte) and Brassica juncea: Metal accumulation, nutrient status and photosynthetic activity. J. Plant Physiol. 2014, 171, 1634–1644. [Google Scholar] [CrossRef]
  34. Śliwa-Cebula, M.; Kaszycki, P.; Kaczmarczyk, A.; Nosek, M.; Lis-Krzyścin, A.; Miszalski, Z. The Common Ice Plant (Mesembryanthemum crystallinum L.)–Phytoremediation Potential for Cadmium and Chromate-Contaminated Soils. Plants 2020, 9, 1230. [Google Scholar] [CrossRef] [PubMed]
  35. Niewiadomska, E.; Bilger, W.; Gruca, M.; Mulisch, M.; Miszalski, Z.; Krupinska, K. CAM-related changes in chloroplastic metabolism of Mesembryanthemum crystallinum L. Planta 2011, 233, 275–285. [Google Scholar] [CrossRef]
  36. Winter, K.; Holtum, J.A.M. Facultative crassulacean acid metabolism (CAM) plants: Powerful tools for unravelling the functional elements of CAM photosynthesis. J. Exp. Bot. 2014, 65, 3425–3441. [Google Scholar] [CrossRef] [PubMed]
  37. Winter, K. Ecophysiology of constitutive and facultative CAM photosynthesis. J. Exp. Bot. 2019, 70, 6495–6508. [Google Scholar] [CrossRef] [PubMed]
  38. Nosek, M.; Gawrońska, K.; Rozpądek, P.; Szechyńska-Hebda, M.; Kornaś, A.; Miszalski, Z. Withdrawal from functional Crassulacean acid metabolism (CAM) is accompanied by changes in both gene expression and activity of antioxidative enzymes. J. Plant Physiol. 2018, 229, 151–157. [Google Scholar] [CrossRef] [PubMed]
  39. Nosek, M.; Gawrońska, K.; Rozpądek, P.; Sujkowska-Rybkowska, M.; Miszalski, Z.; Kornaś, A. At the edges of photosynthetic metabolic plasticity-on the rapidity and extent of changes accompanying salinity stress-induced CAM photosynthesis withdrawal. Int. J. Mol. Sci. 2021, 22, 8426. [Google Scholar] [CrossRef] [PubMed]
  40. Rouse, J.W.; Haas, R.H.; Schell, J.A.; Deering, D.W.; Harlan, J.C. Monitoring the Vernal Advancement of Natural Vegetation; Final report; NASA/GCSFC: Greenbelt, MD, USA, 1974. [Google Scholar]
  41. Gamon, J.A.; Peñuelas, J.; Field, C.B. A narrow-waveband spectral index that tracks diurnal changes in photosynthetic efficiency. Remote Sens. Environ. 1992, 41, 35–44. [Google Scholar] [CrossRef]
  42. Gitelson, A.A.; Gritz, Y.; Merzlyak, M.N. Relationships between leaf chlorophyll content and spectral reflectance and algorithms for non-destructive chlorophyll assessment in higher plant leaves. J. Plant Physiol. 2003, 160, 271–282. [Google Scholar] [CrossRef] [PubMed]
  43. Winter, K.; Gademann, R. Daily changes in CO2 and water vapor exchange, chlorophyll fluorescence, and leaf water relations in the halophyte Mesembryanthemum crystallinum during the induction of crassulacean acid metabolism in response to high NaCl salinity. Plant Physiol. 1991, 95, 768–776. [Google Scholar] [CrossRef]
  44. Szarek, S.R.; Ting, I.P. Photosynthetic Efficiency of CAM Plants in Relation to C3 and C4 Plants; Springer: Dordrecht, The Netherlands, 1975; pp. 289–297. [Google Scholar]
  45. Bhagwat, A.S. Photosynthetic carbon assimilation of C3, C4, and CAM pathways. In Handbook of Photosynthesis, 2nd ed.; Pessarakli, M., Ed.; Taylor and Francis Group: Tucson, AZ, USA, 2005; pp. 367–389. [Google Scholar]
  46. Wingler, A.; Lea, P.J.; Quick, W.P.; Leegood, R.C. Photorespiration: Metabolic pathways and their role in stress protection. Philos. Trans. R. Soc. Lond. Ser. B 2000, 355, 1517–1529. [Google Scholar] [CrossRef]
  47. Zhao, C.; Zhang, H.; Song, C.; Zhu, J.K.; Shabala, S. Mechanisms of plant responses and adaptation to soil salinity. Innovation 2020, 1, 100017. [Google Scholar] [PubMed]
  48. Volkov, V.; Wang, B.; Dominy, P.J.; Fricke, W.; Amtmann, A. Thellungiella halophila, a salt tolerant relative of Arabidopsis thaliana, possesses effective mechanisms to discriminate between potassium and sodium. Plant Cell Environ. 2004, 27, 1–14. [Google Scholar] [CrossRef]
  49. Percey, W.J.; Shabala, L.; Wu, Q.; Su, N.; Breadmore, M.C.; Guijt, R.M.; Bose, J.; Shabala, S. Potassium retention in leaf mesophyll as an element of salinity tissue tolerance in halophytes. Plant Physiol. Biochem. 2016, 109, 346–354. [Google Scholar] [CrossRef] [PubMed]
  50. Gómez-Cadenas, A.; Tadeo, F.R.; Primo-Millo, E.; Talón, M. Involvement of abscisic acid and ethylene in the responses of citrus seedlings to salinity shock. Physiol. Plant. 1998, 103, 475–484. [Google Scholar] [CrossRef]
  51. Mühlenbock, P.; Szechyńska-Hebda, M.; Płaszczyca, M.; Baudo, M.; Mateo, A.; Mullineaux, P.M.; Parker, J.E.; Karpińska, B.; Karpiński, S. Chloroplast signaling and LESION SIMULATING DISEASE1 regulate crosstalk between light acclimation and immunity in Arabidopsis. Plant Cell. 2008, 20, 2339–2356. [Google Scholar] [CrossRef] [PubMed]
  52. Arraes, F.B.M.; Beneventi, M.A.; de Sa, M.E.L.; Paixao, J.F.R.; Albuquerque, E.V.S.; Marin, S.R.R.; Purgatto, E.; Nepomuceno, A.L.; Grossi-de-Sa, M.F. Implications of ethylene biosynthesis and signaling in soybean drought stress tolerance. BMC Plant Biol. 2015, 15, 213. [Google Scholar] [CrossRef] [PubMed]
  53. Park, S.S.-Y.; Fung, P.; Nishimura, N.; Jensen, D.R.; Fujii, H.; Zhao, Y.; Lumba, S.; Santiago, J.; Rodrigues, A.; Chow, T.F.; et al. Abscisic acid inhibits type 2C protein phosphatases via the PYR/PYL Family of START proteins. Science 2009, 324, 1068–1069. [Google Scholar] [CrossRef] [PubMed]
  54. Osakabe, Y.; Yamaguchi-Shinozaki, K.; Shinozaki, K.; Tran, L.S.P. ABA control of plant macroelement membrane transport systems in response to water deficit and high salinity. New Phytol. 2014, 202, 35–49. [Google Scholar] [CrossRef] [PubMed]
  55. Müller, M.; Munné-Bosch, S. Ethylene response factors: A key regulatory hub in hormone and stress signaling. Plant Physiol. 2015, 169, 32–41. [Google Scholar] [CrossRef]
  56. Huang, J.; Huang, Z.; Zhou, X.; Xia, C.; Imran, M.; Wang, S.; Xu, C.; Zha, M.; Liu, Y.; Zhang, C. Tissue-specific transcriptomic profiling of Plantago major provides insights for the involvement of vasculature in phosphate deficiency responses. Mol. Genet. Genom. 2019, 294, 159–175. [Google Scholar] [CrossRef]
  57. Lin, R.C.; Park, H.J.; Wang, H.Y. Role of Arabidopsis RAP2.4 in regulating light- and ethylene-mediated developmental processes and drought stress tolerance. Mol. Plant. 2008, 1, 42–57. [Google Scholar] [CrossRef] [PubMed]
  58. Papdi, C.; Perez-Salamo, I.; Joseph, M.P.; Giuntoli, B.; Bogre, L.; Koncz, C.; Szabados, L. The low oxygen, oxidative and osmotic stress responses synergistically act through the ethylene response factor VII genes RAP2.12, RAP2.2 and RAP2.3. Plant J. 2015, 82, 772–784. [Google Scholar] [CrossRef]
  59. Li, Y.; Zhang, H.; Zhang, Q.; Liu, Q.; Zhai, H.; Zhao, N.; He, S. An AP2/ERF gene, IbRAP2-12, from sweetpotato is involved in salinity and drought tolerance in transgenic Arabidopsis. J. Plant Sci. 2019, 281, 19–30. [Google Scholar] [CrossRef] [PubMed]
  60. Hsieh, E.-J.; Cheng, M.-C.; Lin, T.-P. Functional characterization of an abiotic stress-inducible transcription factor AtERF53 in Arabidopsis thaliana. Plant Mol. Biol. 2013, 82, 223–237. [Google Scholar] [CrossRef] [PubMed]
  61. Resnick, J.S.; Wen, C.K.; Shockey, J.A.; Chang, C. REVERSION-TO-ETHYLENE SENSITIVITY1, a conserved gene that regulates ethylene receptor function in Arabidopsis. Proc. Natl. Acad. Sci. USA 2006, 103, 7917–7922. [Google Scholar] [CrossRef]
  62. Li, S.; Zhou, X.; Chen, L.; Huang, W.; Yu, D. Functional characterization of Arabidopsis thaliana WRKY39 in heat stress. Mol. Cells 2010, 29, 475–483. [Google Scholar] [CrossRef]
  63. Argueso, C.T.; Hansen, M.; Kieber, J.J. Regulation of ethylene biosynthesis. J. Plant Growth Regul. 2007, 26, 92–105. [Google Scholar] [CrossRef]
  64. Lin, Z.; Zhong, S.; Grierson, D. Recent advances in ethylene research. J. Exp. Bot. 2009, 60, 3311–3336. [Google Scholar] [CrossRef]
  65. Available online: https://www.arabidopsis.org/index.jsp (accessed on 27 February 2024).
  66. Jiang, C.; Belfield, E.J.; Cao, Y.; Smith, J.A.; Harberd, N.P. An Arabidopsis soil-salinity-tolerance mutation confers ethylene-mediated enhancement of sodium/potassium homeostasis. Plant Cell 2013, 25, 3535–3552. [Google Scholar] [CrossRef]
  67. Wang, N.N.; Shih, M.C.; Li, N. The GUS reporter-aided analysis of the promoter activities of Arabidopsis ACC synthase genes AtACS4, AtACS5, and AtACS7 induced by hormones and stresses. J. Exp. Bot. 2005, 56, 909–920. [Google Scholar] [CrossRef]
  68. Achard, P.; Cheng, H.; De Grauwe, L.; Decat, J.; Schoutteten, H.; Moritz, T.; Van Der Straeten, D.; Peng, J.; Harberd, N.P. Integration of plant responses to environmentally activated phytohormonal signals. Science 2006, 311, 91–94. [Google Scholar] [CrossRef] [PubMed]
  69. Cao, W.H.; Liu, J.; Zhou, Q.Y.; Cao, Y.R.; Zheng, S.F.; Du, B.X.; Zhang, J.S.; Chen, S.Y. Expression of tobacco ethylene receptor NTHK1 alters plant responses to salt stress. Plant Cell Environ. 2006, 29, 1210–1219. [Google Scholar] [CrossRef] [PubMed]
  70. Peng, J.; Li, Z.; Wen, X.; Li, W.; Shi, H.; Yang, L.; Zhu, H.; Gou, H. Salt induced stabilization of EIN3/EIL1 confers salinity tolerance by deterring ROS accumulation in Arabidopsis. PLoS Genet. 2014, 10, e1004664. [Google Scholar] [CrossRef] [PubMed]
  71. Shen, X.; Wang, Z.; Song, X.; Xu, J.; Jiang, C.; Zhao, Y.; Ma, C.; Zhang, H. Transcriptomic profiling revealed an important role of cell wall remodelling and ethylene signalling pathway during salt acclimation in Arabidopsis. Plant Mol. Biol. 2014, 86, 303–317. [Google Scholar] [CrossRef] [PubMed]
  72. Ellouzi, H.; Hamed, K.B.; Hernandez, I.; Cela, J.; Muller, M.; Magne, C.; Abdelly, C.; Munne-Bosch, S. A comparative study of the early osmotic, ionic, redox and hormonal signaling response in leaves and roots of two halophytes and a glycophyte to salinity. Planta 2014, 240, 1299–1317. [Google Scholar] [CrossRef]
  73. Kukreja, S.; Nandwal, A.; Kumar, N.; Sharma, S.; Unvi, V.; Sharma, P. Plant water status, H2O2 scavenging enzymes, ethylene evolution and membrane integrity of Cicer arietinum roots as affected by salinity. Biol. Plant. 2005, 49, 305–308. [Google Scholar] [CrossRef]
  74. Chen, D.; Ma, X.; Li, C.; Zhang, W.; Xia, G.; Wang, M. A wheat aminocyclopropane-1-carboxylate oxidase gene, TaACO1, negatively regulates salinity stress in Arabidopsis thaliana. Plant Cell Rep. 2014, 33, 1815–1827. [Google Scholar] [CrossRef]
  75. Miszalski, Z.; Kornas, A.; Rozpądek, P.; Fischer-Schliebs, E.; Lüttge, U. Independent fluctuations of malate and citrate in the CAM species Clusia hilariana Schltdl. under low light and high light in relation to photoprotection. J. Plant Physiol. 2015, 170, 453–458. [Google Scholar] [CrossRef] [PubMed]
  76. Andrew, S. FastQC: A Quality Control Tool for High Throughput Sequence Data. 2010. Available online: http://www.bioinformatics.babraham.ac.uk/projects/fastqc (accessed on 29th May 2022).
  77. Grabherr, M.G.; Haas, B.J.; Yassour, M.; Levin, J.Z.; Thompson, D.A.; Amit, I.; Adiconis, X.; Fan, L.; Raychowdhury, R.; Zeng, Q.; et al. Full-length transcriptome assembly from RNA-Seq data without a reference genome. Nat. Biotechnol. 2011, 29, 644–652. [Google Scholar] [CrossRef]
  78. Haas, B.J.; Papanicolau, A.; Yassour, M.; Grabherr, M.; Blood, P.D.; Bowden, J.; Couger, M.B.; Eccles, D.; Li, B.; Lieber, M.; et al. De novo transcript sequence reconstruction from RNA-Seq: Reference generation and analysis with Trinity. Nat. Protocs. 2013, 8, 1494–1512. [Google Scholar] [CrossRef]
  79. Bolger, A.M.; Lohse, M.; Usadel, B. Trimmomatic: A flexible trimmer for Illumina Sequence Data. Bioinformatics 2014, 30, 2114–2120. [Google Scholar] [CrossRef] [PubMed]
  80. Das, S.; Mykles, D.L. A comparison of resources for the annotation of a de novo assembled transcriptome in the molting gland (Y-Organ) of the blackback land crab, Gecarcinus lateralis. Integr. Comp. Biol. 2016, 56, 1103–1112. [Google Scholar] [CrossRef] [PubMed]
  81. Finn, R.D.; Clements, J.; Eddy, S.R. HMMER web server: Interactive sequence similarity searching. Nucleic Acids Res. 2011, 39, 29–37. [Google Scholar] [CrossRef] [PubMed]
  82. Finn, R.D.; Bateman, A.; Clements, J.; Coggill, P.; Eberhardt, R.Y.; Eddy, S.R.; Heger, A.; Hetherington, K.; Holm, L.; Mistry, J.; et al. Pfam: The protein families database. Nucleic Acids Res. 2014, 42, 222–230. [Google Scholar] [CrossRef] [PubMed]
  83. Petersen, T.; Brunak, S.; von Heijne, G.; Nielsen, H. SignalP 4.0: Discriminating signal peptides from transmembrane regions. Nat. Methods 2011, 8, 785–786. [Google Scholar] [CrossRef] [PubMed]
  84. Langmead, B.; Trapnell, C.; Pop, M.; Salzberg, S. Ultrafast and memory-efficient alignment of short DNA sequences to the human genome. Genome Biol. 2009, 10, R25. [Google Scholar] [CrossRef] [PubMed]
  85. Li, B.; Dewey, C. RSEM: Accurate transcript quantification from RNA-Seq data with or without a reference genome. BMC Bioinform. 2011, 12, 323. [Google Scholar] [CrossRef] [PubMed]
  86. Robinson, M.D.; McCarthy, D.J.; Smyth, G.K. edgeR: A Bioconductor package for differential expression analysis of digital gene expression data. Bioinformatics 2010, 6, 139–140. [Google Scholar] [CrossRef] [PubMed]
  87. Love, M.I.; Huber, W.; Anders, S. Moderated estimation of fold change and dispersion for RNA-seq data with DESeq2. Genome Biol. 2014, 15, 550. [Google Scholar] [CrossRef]
  88. Ritchie, M.E.; Phipson, B.; Wu, D.; Hu, Y.; Law, C.W.; Shi, W.; Smyth, G.K. Limma powers differential expression analyses for RNA-sequencing and microarray studies. Nucleic Acids Res. 2015, 43, 7. [Google Scholar] [CrossRef]
  89. Alexa, A.; Rahnenfuhrer, J. topGO: Enrichment Analysis for Gene Ontology, R Package 2.26.0; R Project for Statistical Computing: Vienna, Austria, 2016. [Google Scholar]
  90. Yu, G.; Wang, L.G.; Han, Y.; He, Q.Y. clusterProfiler: An R package for comparing biological themes among gene clusters. OMICS 2012, 16, 284–287. [Google Scholar] [CrossRef] [PubMed]
  91. Pfaffl, M.W. A new mathematical model for relative quantification in real-time RT-PCR. Nucleic Acids Res. 2001, 29, e45. [Google Scholar] [CrossRef] [PubMed]
  92. Müller, M.; Munné-Bosch, S. Rapid and sensitive hormonal profiling of complex plant samples by liquid chromatography coupled to electrospray ionization tandem mass spectrometry. Plant Met. 2011, 7, 1–11. [Google Scholar] [CrossRef] [PubMed]
Figure 1. Reflectance parameters of control and 14 day NaCl-treated (+NaCl, CAM) Mesembryanthemum crystallinum L. plants. (A)—NDVI, normalized difference vegetation index; (B)—PRI, photochemical reflectance index; and (C)—CRI1, carotenoid reflectance index 1. Whiskers represent standard errors. The star indicate statistically significant differences between control and NaCl-treated plants (N = 4 for each experimental variant) according to the Student’s t-test. The absolute value for each parameter is given.
Ijms 25 04777 g001
Figure 2. Gas exchange parameters of control and 14 day NaCl-treated (+NaCl, CAM) Mesembryanthemum crystallinum L. plants: (A)—stomatal conductance; (B)—carbon dioxide assimilation rate; (C)—carbon dioxide internal concentration; and (D)—transpiration. Whiskers represent standard errors. The stars above indicate statistically significant differences between control and NaCl-treated plants (N = 3 for each type plant) according to the Student’s t-test (* p ≤ 0.05, *** p ≤ 0.005).
Ijms 25 04777 g002
Figure 3. The expression patterns of genes in control and NaCl-treated (+NaCl, CAM) Mesembryanthemum crystallinum L. leaves. (A) Venn diagram showing common and specific differential gene expression levels identified using edgeR, DeSeq2 and Limma tools. (BD) GO enrichment of DEGs in cellular component (CC) (B), biological process (BP) (C), and molecular function (D) categories, the x-axis indicates the number of genes and the y-axis indicates the GO terms.
Ijms 25 04777 g003
Figure 4. Expression of key genes involved in ethylene (ET) biosynthesis pathway, namely 1-aminocyclopropane-1-carboxylic acid (ACC) synthase 6 (ACS6) (A) and ACC oxidase 1 (ACO1) (B) orthologs analysed every 6 h during 24-h-long course in control and NaCl-treated (+NaCl, CAM) Mesembryanthemum crystallinum L. plants. NaCl treatment was applied for 14 days. Whiskers represent standard errors. The stars indicate statistically significant differences between control and NaCl-treated plants (N for ACS6 = 3; N for ACO1 = 4) at the specific time point according to the Student’s t-test (* p ≤ 0.05, *** p < 0.001).
Ijms 25 04777 g004
Figure 5. 1-aminocyclopropane-1-carboxylic acid (ACC) content analysed every 6 h during the 24-h-long course in control and NaCl-treated (+NaCl, CAM) Mesembryanthemum crystallinum L. plants. NaCl treatment was applied for 14 days. Whiskers represent standard errors. The stars above indicate statistically significant differences between control and NaCl-treated plants (N = 6) at the specific time point according to the Student’s t-test (*** p ≤ 0.005).
Ijms 25 04777 g005
Table 1. Genes related to ethylene (ET) (ERGs), abscisic acid (ABA) catabolic process, nitric oxide biosynthetic process, regulation of stomatal movement, reductive pentose-phosphate cycle, glycine catabolic process, chlorophyll binding, photosystem I, photosystem II, starch binding, and plant-type vacuole differentially expressed in Mesembryanthemum crystallinum L. leaves under NaCl treatment.
Gene NameAnnotated SpeciesDescriptionUnigene IDlog2 Fold Change NaCl-Treated vs. Controlp Value
Ethylene (ET)-related genes (ERGs)
ACOA. deliciosa1-aminocyclopropane-1-carboxylate oxidaseTRINITY_DN781753.02 × 10−24
TRINITY_DN699022.84 × 10−19
ACO5A. thaliana1-aminocyclopropane-1-carboxylate oxidaseTRINITY_DN31732−1.55 × 10⁻⁴
ETRP. persicaEthylene receptorTRINITY_DN296961.74 × 10−4
RTE1A. thalianaProtein reversion-to-ethylene sensitivity1TRINITY_DN304522.21 × 10−6
RAP2.12A. thalianaEthylene-responsive transcription factor RAP2-12TRINITY_DN114751.81 × 10−12
TRINITY_DN186632.43 × 10−7
RAP2.3A. thalianaEthylene-responsive transcription factor RAP2-3TRINITY_DN198541.52 × 10−8
RAP2.4A. thalianaEthylene-responsive transcription factor RAP2-4TRINITY_DN507621.34 × 10−4
ERF53A. thalianaEthylene-responsive transcription factor ERF053TRINITY_DN24801−2.09 × 10⁻¹⁰
ERF61A. thalianaEthylene-responsive transcription factor ERF061TRINITY_DN793492.94 × 10−12
ERF80A. thalianaEthylene-responsive transcription factor 9TRINITY_DN321882.08 × 10−4
AP2L1A. thalianaAP2-like ethylene-responsive transcription factor At1g16060TRINITY_DN251031.27 × 10−5
RAV2A. thalianaAP2/ERF and B3 domain-containing transcription repressor RAV2TRINITY_DN25847−4.47 × 10⁻¹³
WRKY23A. thalianaWRKY transcription factor 23TRINITY_DN334491.44 × 10−6
Abscisic acid (ABA) catabolic process (GO:0046345)
PPCK1A. thalianaPhosphoenolpyruvate carboxylase kinase 1TRINITY_DN293884.57 × 10−17
TRINITY_DN256413.71 × 10−7
ATHB7A. thalianaHomeobox-leucine zipper protein ATHB-7TRINITY_DN280562.61 × 10−17
TRINITY_DN236842.67 × 10−15
TRINITY_DN895462.41 × 10−17
TRINITY_DN297172.23 × 10−26
BEL1A. thalianaHomeobox protein BEL1 homologTRINITY_DN185152.12 × 10−13
BELH1A. thalianaBEL1-like homeodomain protein 1TRINITY_DN270691.94 × 10−21
CAR4A. thalianaProtein C2-domain ABA-related 4 TRINITY_DN247693.73 × 10−5
TRINITY_DN171842.74 × 10−12
P2C24A. thalianaProbable protein phosphatase 2C 24TRINITY_DN258463.93 × 10−20
P2C37A. thalianaProtein phosphatase 2C 37TRINITY_DN28121.25 × 10−8
P2C56A. thalianaProtein phosphatase 2C 56TRINITY_DN301872.08 × 10−11
ALFC2P. sativumFructose-bisphosphate aldolase 2TRINITY_DN128222.92 × 10−6
PIP22A. thalianaAquaporin PIP2-2TRINITY_DN162932.41 × 10−8
ERD7A. thalianaProtein early-responsive to dehydration 7TRINITY_DN110512.63 × 10−8
AFP2A. thalianaNinja-family protein AFP2TRINITY_DN377793.58 × 10−6
AMOA. thalianaPrimary amine oxidaseTRINITY_DN326422.85 × 10−4
TRINITY_DN330513.58 × 10−13
SAPK2O. sativaSerine/threonine-protein kinase SAPK2TRINITY_DN394762.92 × 10−12
SRK2IA. thalianaSerine/threonine-protein kinase SRK2ITRINITY_DN376251.22 × 10−6
CIPK1A. thalianaCBL-interacting serine/threonine-protein kinase 1TRINITY_DN293161.22 × 10−5
Y1141A. thalianaG-type lectin S-receptor-like serine/threonine-protein kinase At1g11410TRINITY_DN401721.62 × 10−14
CRKD. carotaCDPK-related protein kinaseTRINITY_DN400761.62 × 10−7
CDPKOO. sativaCalcium-dependent protein kinase 24TRINITY_DN326791.01 × 10−14
RMR41A. thalianaRemorin 4.1TRINITY_DN211791.13 × 10−5
AP2L1A. thalianaAP2-like ethylene-responsive transcription factor At1g16060TRINITY_DN251031.37 × 10−5
CRPM4A. thalianaCold-regulated 413 plasma membrane protein 4TRINITY_DN337101.77 × 10−5
RGLG2A. thalianaE3 ubiquitin-protein ligase RGLG2 TRINITY_DN338382.95 × 10−5
GBLPAA. thalianaReceptor for activated C kinase 1A TRINITY_DN36961.82 × 10−5
HHP1A. thalianaHeptahelical transmembrane protein 1TRINITY_DN402282.42 × 10−13
ECP44D. carotaPhosphoprotein ECPP44TRINITY_DN503181.81 × 10−4
ANXD4A. thalianaAnnexin D4TRINITY_DN593211.16 × 10−5
GOLS2A. thalianaGalactinol synthase 2TRINITY_DN630763.64 × 10−6
SRM1A. thalianaTranscription factor SRM1TRINITY_DN17241.36 × 10−8
MYB88A. thalianaTranscription factor MYB88TRINITY_DN280711.31 × 10−4
MYBS3O. sativaTranscription factor MYBS3TRINITY_DN99711.22 × 10−5
MY102A. thalianaTranscription factor MYB102TRINITY_DN368201.15 × 10−4
NAP2S.lycopersicumNAC domain-containing protein 2 TRINITY_DN232511.61 × 10−6
NAC2A. thalianaNAC domain-containing protein 2TRINITY_DN25281.58 × 10−6
AL7B4A. thalianaAldehyde dehydrogenase family 7 member B4TRINITY_DN496321.31 × 10−9
TRINITY_DN239051.27 × 10−4
CP29BA. thalianaRNA-binding protein CP29BTRINITY_DN42372−1.69 × 10⁻⁴
Abscisic acid catabolic process (GO:0046345), (+)-abscisic acid 8′-hydroxylase activity (GO:0010295)
ABAH2A. thalianaAbscisic acid 8′-hydroxylase 2TRINITY_DN51717−2.62 × 10⁻¹⁷
TRINITY_DN36601−2.39 × 10⁻²⁵
ABAH4A. thalianaAbscisic acid 8′-hydroxylase 4TRINITY_DN87577−7.42 × 10⁻¹⁸
Nitric oxide biosynthetic process (GO:0006809)
NOSA. thalianaNitric oxide synthaseTRINITY_DN395311.81 × 10−4
AMOA. thalianaPrimary amine oxidaseTRINITY_DN326422.85 × 10−4
TRINITY_DN330513.58 × 10−13
Regulation of stomatal movement (GO:0010119)
BCA1A. thalianaBeta carbonic anhydrase 1TRINITY_DN13832.24 × 10−15
TRINITY_DN165092.31 × 10−7
BCA2A. thalianaBeta carbonic anhydrase 2TRINITY_DN165092.69 × 10−5
TRINITY_DN13832.75 × 10−28
CAH2F. linearisCarbonic anhydrase 2TRINITY_DN383731.61 × 10−5
P2C37A. thalianaProtein phosphatase 2C 37TRINITY_DN28121.25 × 10−8
P2C56A. thalianaProtein phosphatase 2C 56TRINITY_DN301872.08 × 10−11
SRK2IA. thalianaSerine/threonine-protein kinase SRK2ITRINITY_DN394762.92 × 10−12
ZIFL1A. thalianaProtein zinc induced facilitator-like 1TRINITY_DN543062.42 × 10−12
TRINITY_DN385742.18 × 10−12
AKT1A. thalianaPotassium channel AKT1TRINITY_DN281542.11 × 10−5
NHX2A. thalianaSodium/hydrogen exchanger 2TRINITY_DN683701.41 × 10−20
MYB61A. thalianaTranscription factor MYB61TRINITY_DN314212.13 × 10−8
Reductive pentose-phosphate cycle (GO:0019253), ribulose-bisphosphate carboxylase activity (GO:0016984)
RBS1M. crystallinumRibulose bisphosphate carboxylase small chain 1TRINITY_DN71513−2.11 × 10⁻⁹
RBS3M. crystallinumRibulose bisphosphate carboxylase small chain 3TRINITY_DN28102−1.22 × 10⁻³
TRINITY_DN39730−1.51 × 10⁻³
RBS4M. crystallinumRibulose bisphosphate carboxylase small chain 4TRINITY_DN24229−3.25 × 10⁻⁷
RBS5M. crystallinumRibulose bisphosphate carboxylase small chain 5TRINITY_DN16432−4.04 × 10⁻¹⁷
RBS6M. crystallinumRibulose bisphosphate carboxylase small chain 6TRINITY_DN90082−1.99 × 10⁻¹³
RAF2A. thalianaRubisco accumulation factor 1.2, chloroplasticTRINITY_DN4605−1.13 × 10⁻²⁰
Reductive pentose-phosphate cycle (GO:0019253)
KPPRM. crystallinumPhosphoribulokinaseTRINITY_DN40068−1.66 × 10⁻⁷
TRINITY_DN78943−1.34 × 10⁻⁷
TRINITY_DN42604−1.23 × 10⁻⁵
G3PBA. thalianaGlyceraldehyde-3-phosphate dehydrogenase GAPBTRINITY_DN43620−1.71 × 10⁻³
S17PT. aestivumSedoheptulose-1,7-bisphosphataseTRINITY_DN88837−1.22 × 10⁻⁵
Glycine catabolic process (GO:0006546)
GCSHF. anomalaGlycine cleavage system H protein, mitochondrialTRINITY_DN54747−2.14 × 10⁻¹⁰
M. crystallinumTRINITY_DN70038−1.83 × 10⁻¹²
GCSTM. crystallinumAminomethyltransferase, mitochondrialTRINITY_DN22073−1.72 × 10⁻⁶
TRINITY_DN78482−1.34 × 10⁻¹⁴
GCSPS. tuberosumGlycine dehydrogenase (decarboxylating), mitochondrialTRINITY_DN92007−2.11 × 10⁻⁶
TRINITY_DN95999−1.95 × 10⁻⁹
Chlorophyll binding (GO:0016168), chloroplast thylakoid membrane (GO:0009535), photosystem I (GO:0009522), photosystem II (GO:0009523), photosynthesis, light harvesting (GO:0009765)
CB2AS. oleraceaChlorophyll a-b binding proteinTRINITY_DN60950−3.36 × 10⁻⁴
TRINITY_DN38282−3.02 × 10⁻³
TRINITY_DN4800−4.26 × 10⁻⁵
CB2DS. lycopersicumChlorophyll a-b binding protein 1DTRINITY_DN22522−4.65 × 10⁻¹²
TRINITY_DN30304−2.51 × 10⁻⁵
TRINITY_DN40637−3.72 × 10⁻⁴
TRINITY_DN68714−4.12 × 10⁻⁴
TRINITY_DN80965−2.34 × 10⁻⁴
TRINITY_DN30304−2.82 × 10⁻³
TRINITY_DN11494−2.93 × 10⁻³
CB4CA. thalianaChlorophyll a-b binding protein CP29.3TRINITY_DN42750−1.67 × 10⁻⁴
CB21S. latifoliaChlorophyll a-b binding proteinTRINITY_DN38282−2.75 × 10⁻²⁴
TRINITY_DN51262−2.66 × 10⁻²⁰
R. sativusChlorophyll a-b binding of LHCII type 1 proteinTRINITY_DN63494−3.02 × 10⁻⁵
TRINITY_DN69269−1.82 × 10⁻³
CB23N. tabacumChlorophyll a-b binding protein 36TRINITY_DN59686−2.93 × 10⁻⁷
TRINITY_DN38282−2.63 × 10⁻¹⁹
TRINITY_DN88301−2.42 × 10⁻¹⁰
CB27N. tabacumChlorophyll a-b binding protein 7TRINITY_DN27874−3.02 × 10⁻³
TRINITY_DN28870−3.84 × 10⁻⁶
TRINITY_DN30304−3.19 × 10⁻⁴
Photosystem II (GO:0009523), chloroplast thylakoid membrane (GO:0009535), photosynthesis, light harvesting (GO:0009765)
CP29BA. thalianaRNA-binding protein CP29BTRINITY_DN90726−3.12 × 10⁻¹²
TRINITY_DN42372−1.69 × 10⁻⁴
PSBQ1A. thalianaOxygen-evolving enhancer protein 3-1TRINITY_DN17369−1.63 × 10⁻⁶
Photosystem I reaction centre (GO:0009538), photosystem I (GO:0009522), chloroplast thylakoid membrane (GO:0009535)
PSADS. oleraceaPhotosystem I reaction centre subunit IITRINITY_DN59085−1.16 × 10⁻⁴
PSAHO. sativaPhotosystem I reaction centre subunit VITRINITY_DN14879−1.64 × 10⁻⁶
S. oleraceaTRINITY_DN53439−1.46 × 10⁻⁵
Chloroplast thylakoid membrane (GO:0009535)
PTAC5A. thalianaProtein disulphide isomerase pTAC5TRINITY_DN27918−1.31 × 10⁻¹⁹
PTA16A. thalianaProtein plastid transcriptionally active 16TRINITY_DN37868−1.38 × 10⁻⁸
CHLA. thalianaChloroplastic lipocalinTRINITY_DN16390−1.13 × 10⁻⁸
CG160A. thalianaProtein conserved in the green lineage 160TRINITY_DN24793−2.23 × 10⁻¹⁹
CAOA. thalianaChlorophyllide a oxygenaseTRINITY_DN21455−1.76 × 10⁻⁵
TRINITY_DN31549−2.53 × 10⁻⁴
O. sativaTRINITY_DN84817−2.53 × 10⁻⁷
DNJA6A. thalianaChaperone protein dnaJ A6TRINITY_DN32102−1.12 × 10⁻¹⁴
TL29A. thalianaThylakoid lumenal 29 kDa proteinTRINITY_DN35144−1.73 × 10⁻⁹
STR4A. thalianaRhodanese-like domain-containing protein 4TRINITY_DN20986−2.53 × 10⁻⁴
STR9A. thalianaRhodanese-like domain-containing protein 9TRINITY_DN59649−2.53 × 10⁻⁷
ABA2S. oleraceaZeaxanthin epoxidaseTRINITY_DN87513−1.82 × 10⁻⁵
CUT1AA. thalianaProtein curvature thylakoid 1ATRINITY_DN32471−1.36 × 10⁻⁴
CRR3A. thalianaProbable NAD(P)H dehydrogenase subunit CRR3TRINITY_DN50182−1.21 × 10⁻⁸
NDF5A. thalianaProtein NDH-dependent cyclic electron flow 5TRINITY_DN61095−2.14 × 10⁻²²
NDHKE. globusNAD(P)H-quinone oxidoreductaseTRINITY_DN6819−1.22 × 10⁻¹³
Protochlorophyllide reductase activity (GO:0016630)
PORAA. thalianaProtochlorophyllide reductase ATRINITY_DN13370−2.74 × 10⁻⁷
C. sativusProtochlorophyllide reductaseTRINITY_DN26265−1.77 × 10⁻⁴
TRINITY_DN68683−1.72 × 10⁻¹²
PORBH. vulgareProtochlorophyllide reductase BTRINITY_DN40740−1.74 × 10⁻¹⁰
Starch binding (GO:2001070)
DPE2A. thaliana4-alpha-glucanotransferase DPE2TRINITY_DN29808−3.31 × 10⁻⁷
DSP4C. sativaPhosphoglucan phosphatase DSP4, amyloplastic TRINITY_DN33943−4.31 × 10⁻²⁰
Plant-type vacuole (GO:0000325)
PTR2A. thalianaProtein NRT1/ PTR family 8.3TRINITY_DN38391−2.02 × 10−8
CAX3A. thalianaVacuolar cation/proton exchanger 3TRINITY_DN38001−1.19 × 10⁻¹⁵
TRINITY_DN40895−1.53 × 10⁻¹¹
TPC1A. thalianaTwo pore calcium channel protein 1TRINITY_DN6810−1.54 × 10⁻⁶
TIP11A. thalianaAquaporin TIP1-1TRINITY_DN35041−1.35 × 10⁻⁵
TIP21A. thalianaAquaporin TIP2-1TRINITY_DN40936−3.41 × 10⁻¹⁴
CEP1A. thalianaKDEL-tailed cysteine endopeptidase CEP1TRINITY_DN11687−2.23 × 10⁻³³
TRINITY_DN28528−1.92 × 10⁻⁷
TRINITY_DN29270−2.03 × 10⁻²⁵
AA5GTD. caryophyllusCyanidin 3-O-glucoside 5-O-glucosyltransferase (acyl-glucose)TRINITY_DN39241−3.53 × 10⁻⁹
TRINITY_DN39972−2.41 × 10⁻⁸
AB3CA. thalianaABC transporter C family member 3TRINITY_DN40021−1.17 × 10⁻⁵
AB8CA. thalianaABC transporter C family member 8TRINITY_DN40157−5.16 × 10−49
NRT25A. thalianaHigh affinity nitrate transporter 2.5TRINITY_DN77992−2.11 × 10⁻⁴
ALMTCA. thalianaAluminium-activated malate transporter 12TRINITY_DN33933−1.43 × 10⁻²¹
ALMT2A. thalianaAluminium-activated malate transporter 2TRINITY_DN21972−1.44 × 10⁻⁶
ERDL6A. thalianaSugar transporter ERD6-like 6TRINITY_DN56467−2.11 × 10⁻³
NCLA. thalianaSodium/calcium exchanger NCLTRINITY_DN63539−3.31 × 10−12
RNHX1A. thalianaPutative ribonuclease H protein At1g65750TRINITY_DN15507−3.01 × 10⁻¹⁰
CYSEPV. mungoVignainTRINITY_DN33759−1.92 × 10⁻⁶
OCT3A. thalianaOrganic cation/carnitine transporter 3TRINITY_DN35062−3.98 × 10⁻¹⁶
Disclaimer/Publisher’s Note: The statements, opinions and data contained in all publications are solely those of the individual author(s) and contributor(s) and not of MDPI and/or the editor(s). MDPI and/or the editor(s) disclaim responsibility for any injury to people or property resulting from any ideas, methods, instructions or products referred to in the content.

