
High-Spatial-Resolution Benchtop X-ray Fluorescence Imaging through Bragg-Diffraction-Based Focusing with Bent Mosaic Graphite Crystals: A Simulation Study

Abstract
:1. Introduction
2. Results and Discussion
2.1. X-ray Focusing for Small-Animal XFI Applications Using Bent Mosaic Crystals
2.2. XFI Sensitivity Analysis: In Silico Mouse Model
2.2.1. Palladium () and Barium () XFI at low-dose Mode with SDDs
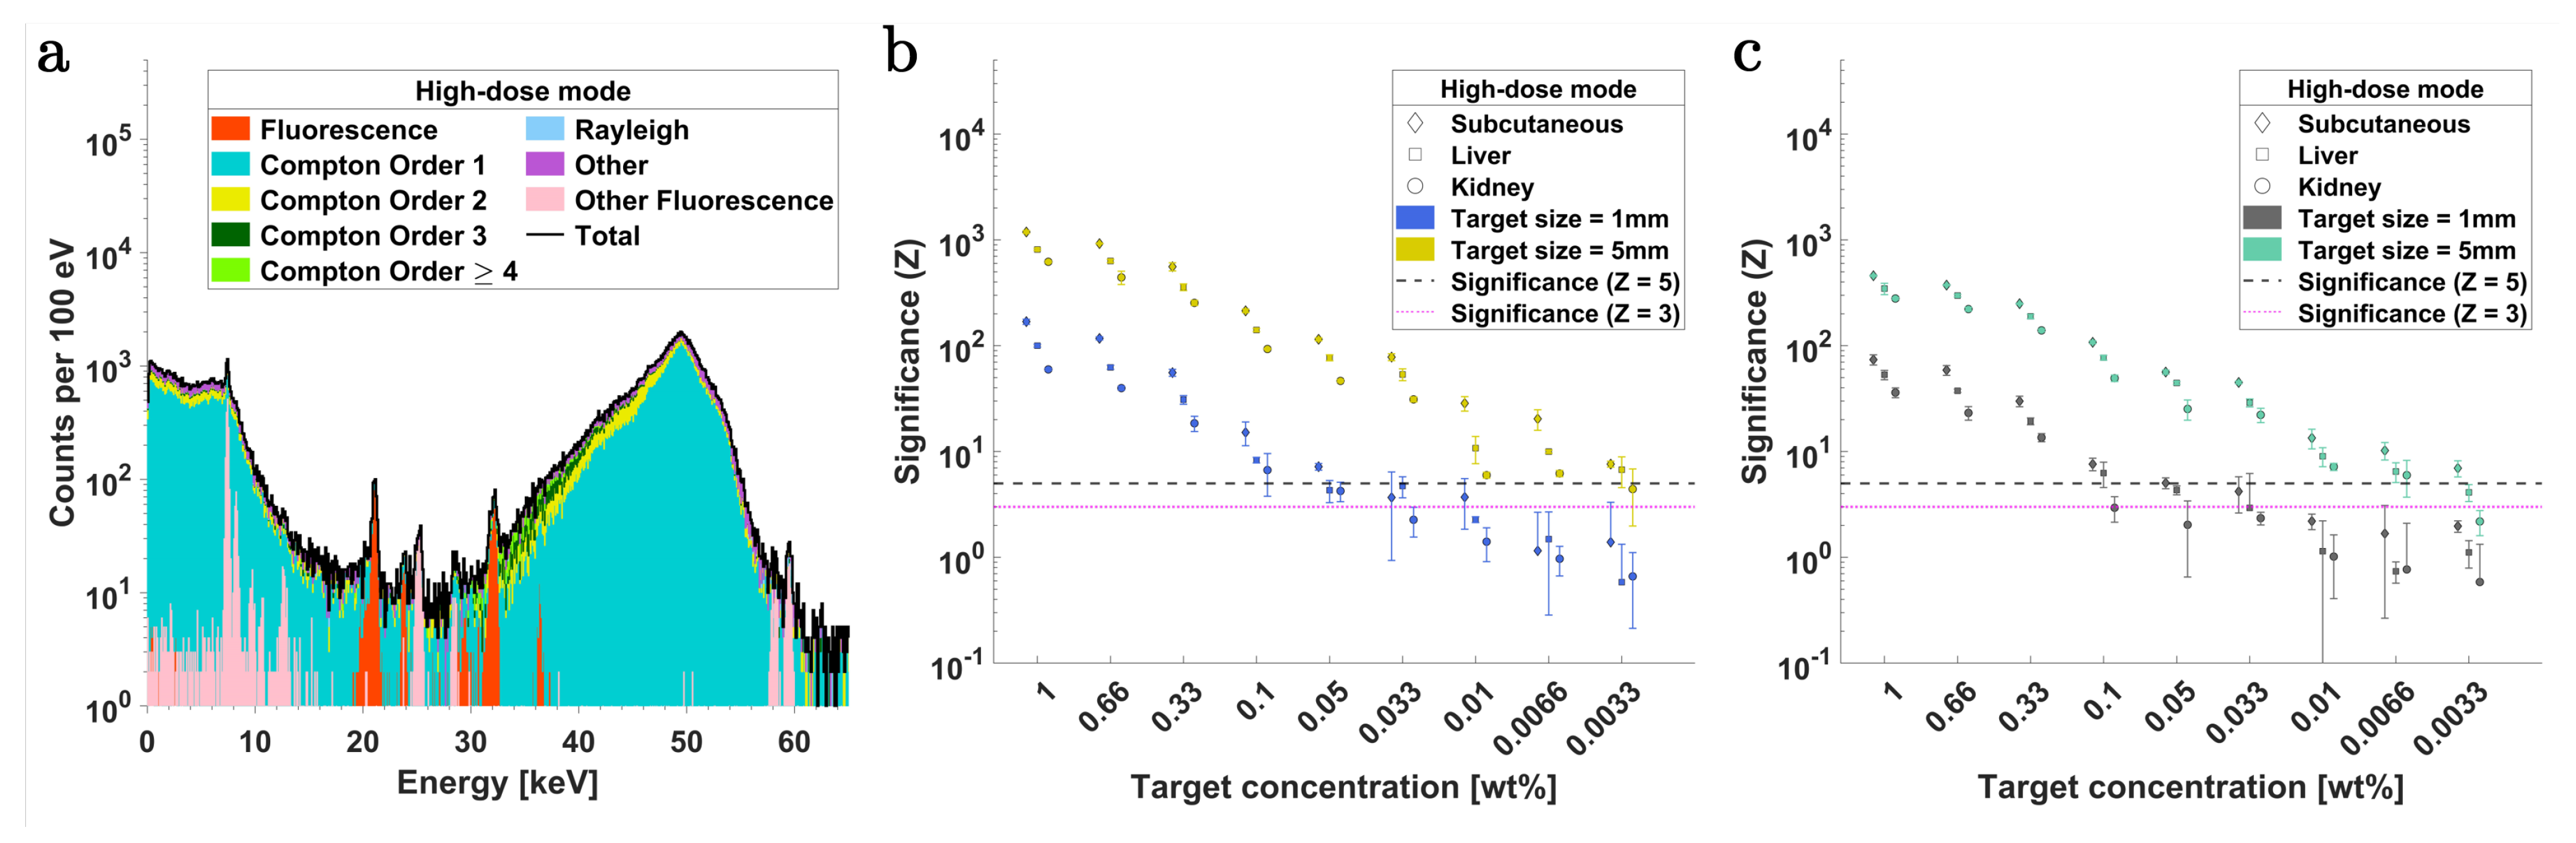
2.2.2. Palladium () and Barium () XFI at high-dose Mode with SDDs
2.2.3. Barium () XFI at low-dose Mode with CdTe Detectors
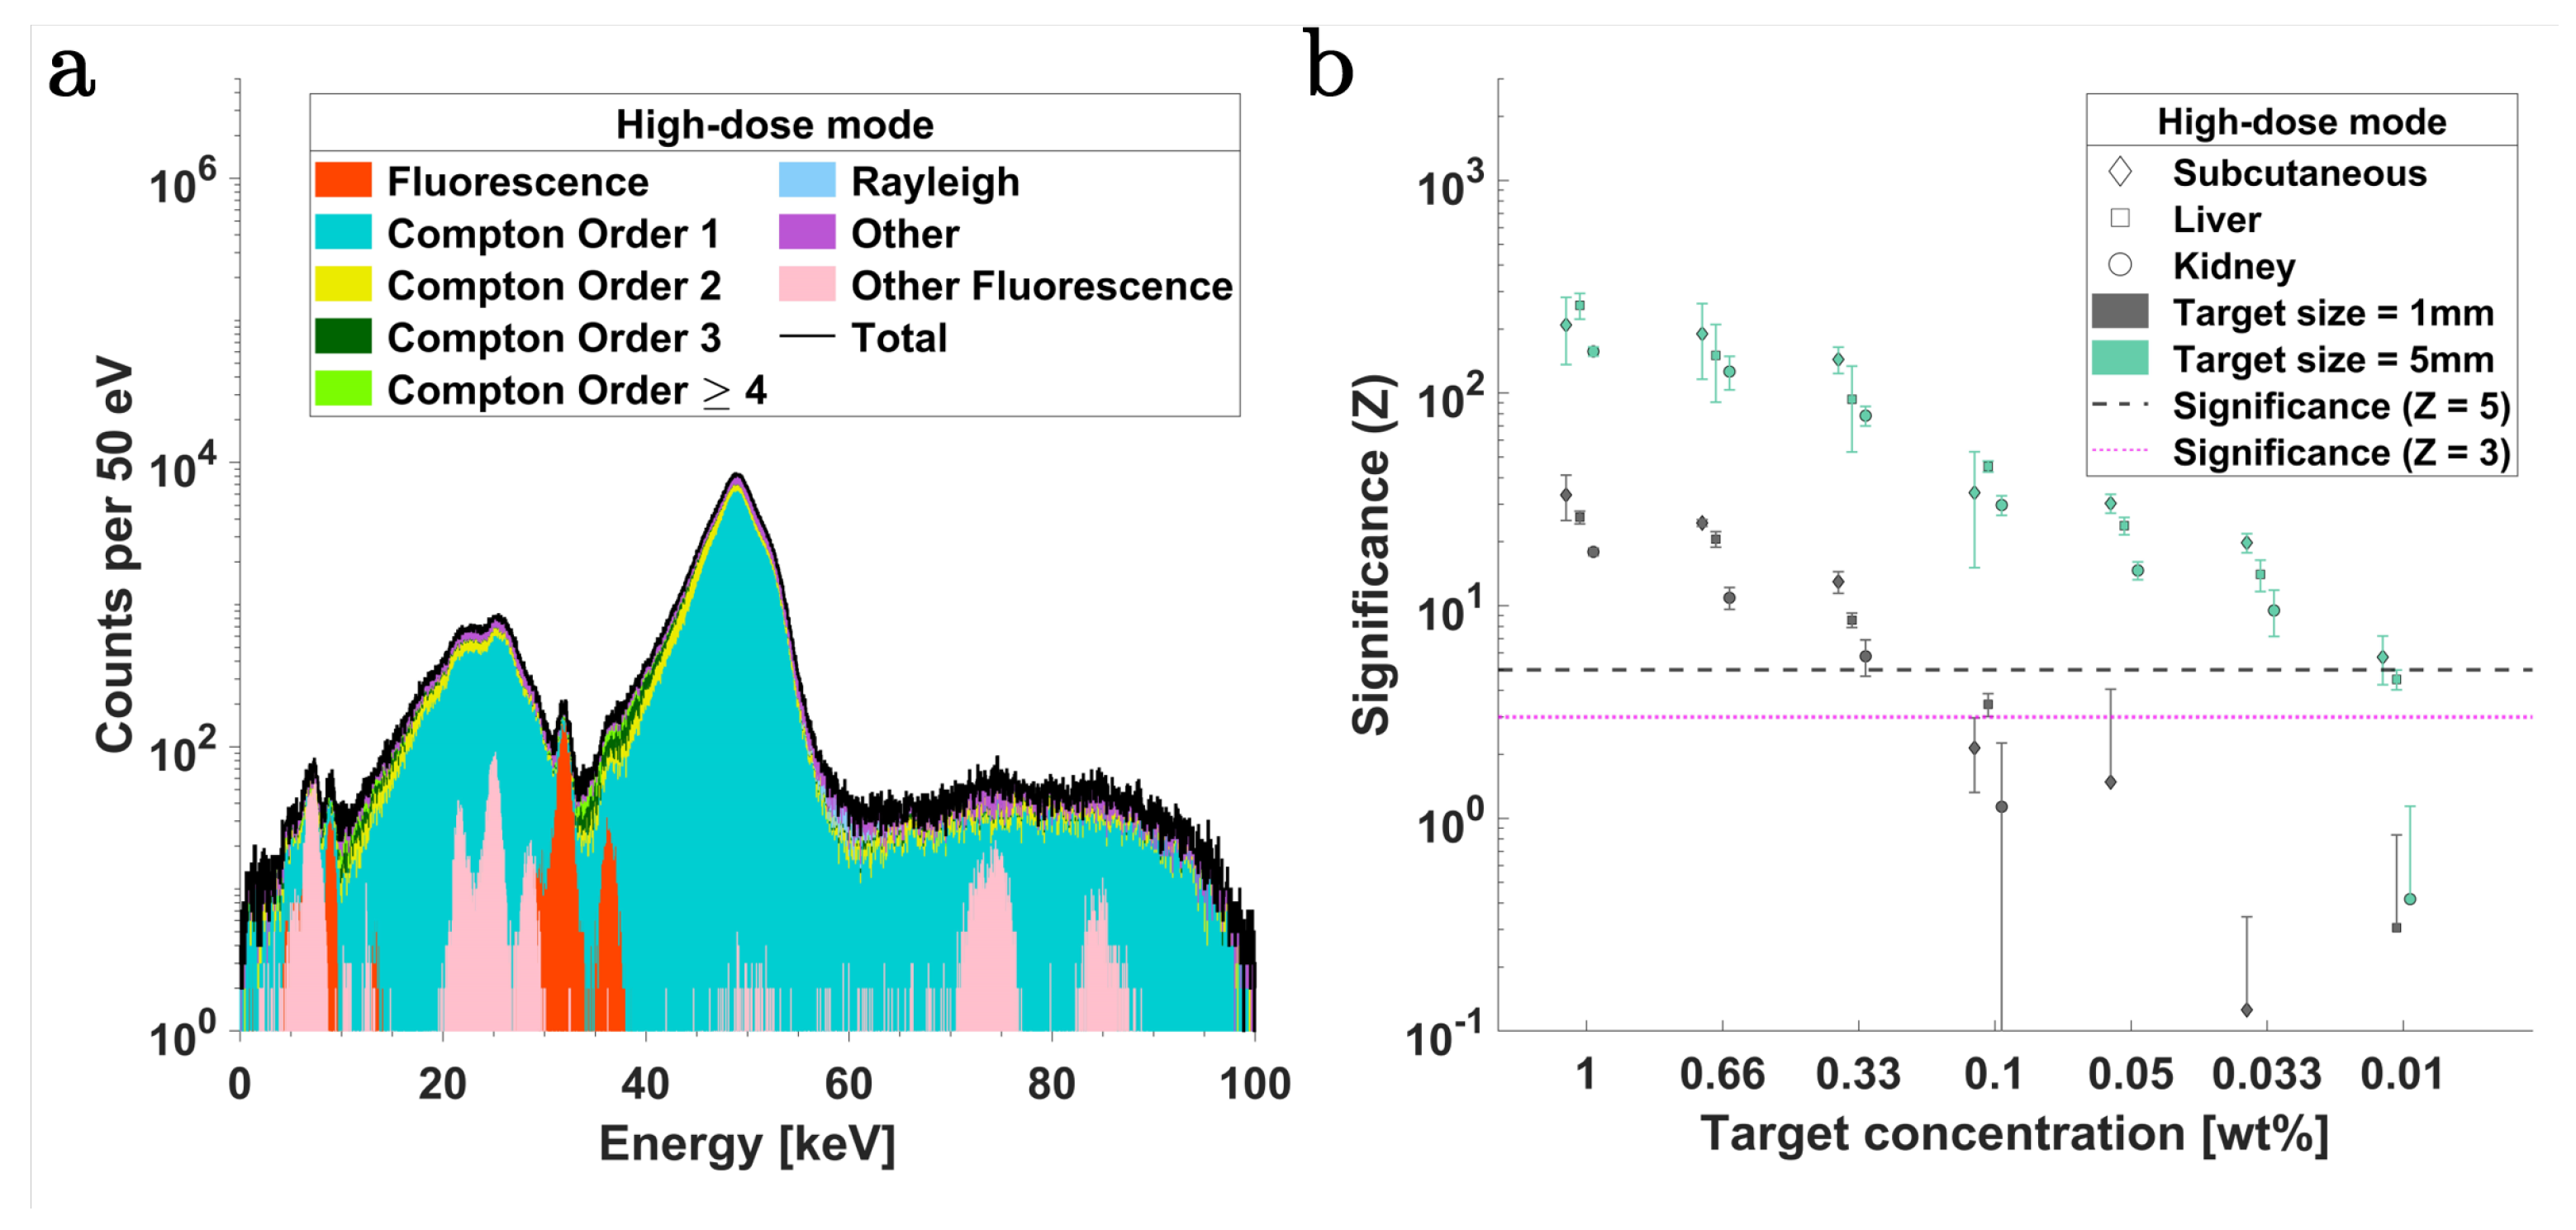
2.2.4. Barium () XFI at high-dose Mode with CdTe Detectors
2.3. Radiation Dose
3. Materials and Methods
3.1. Monte Carlo (MC) Simulation and Setup
3.1.1. Bragg Reflection Process in Geant4
3.1.2. X-ray Source Model
3.1.3. Converging Optics with Bent HOPG/HAPG Crystals
3.1.4. Rocking Curve Analysis
3.1.5. Tumor-Bearing Mouse Model
3.1.6. Detector Model
3.2. Procedure for In Silico XFI Analysis
3.2.1. Imaging Modes
3.2.2. Tumor Lesion Targets
3.2.3. Contrast Agents and Concentrations
3.2.4. Detector Arrangement and Positioning
3.2.5. Radiation Dose
3.3. Statistical Analysis
4. Conclusions
Supplementary Materials
Author Contributions
Funding
Institutional Review Board Statement
Informed Consent Statement
Data Availability Statement
Conflicts of Interest
Abbreviations
| CT | Computed tomography |
| CdTe | Cadmium telluride |
| EM | Electromagnetic |
| ENC | Equivalent noise charge |
| FWHM | Full width at half maximum |
| GrO | Graphite optics |
| HAPG | Highly annealed pyrolytic graphite |
| HOPG | Highly oriented pyrolytic graphite |
| ICP-MS | Inductively coupled plasma mass spectrometry |
| ID | Injected dose |
| MC | Monte Carlo |
| MRI | Magnetic resonance imaging |
| MTD | Maximum-tolerated dose |
| NPs | Nanoparticles |
| OVCA | Orthotopic ovarian cancer |
| PET | Positron emission tomography |
| SDD | Silicon drift detector |
| SPECT | Single-photon emission computed tomography |
| XFCT | X-ray fluorescence computed tomography |
| XFI | X-ray fluorescence imaging |
| XLCT | X-ray luminescence computed tomography |
| XRF | X-ray fluorescence |
| Atomic number | |
| Z | Significance |
References
- James, M.L.; Gambhir, S.S. A molecular imaging primer: Modalities, imaging agents, and applications. Physiol. Rev. 2012, 92, 897–965. [Google Scholar] [CrossRef] [PubMed]
- Lauber, D.T.; Fülöp, A.; Kovács, T.; Szigeti, K.; Máthé, D.; Szijártó, A. State of the art in vivo imaging techniques for laboratory animals. Lab. Anim. 2017, 51, 465–478. [Google Scholar] [CrossRef] [PubMed]
- Carragher, N.O.; Brunton, V.G.; Frame, M.C. Combining imaging and pathway profiling: An alternative approach to cancer drug discovery. Drug Discov. Today 2012, 17, 203–214. [Google Scholar] [CrossRef] [PubMed]
- Levenson, R.M.; Lynch, D.T.; Kobayashi, H.; Backer, J.M.; Backer, M.V. Multiplexing with multispectral imaging: From mice to microscopy. ILAR J. 2008, 49, 78–88. [Google Scholar] [CrossRef] [PubMed]
- Beckmann, N.; Kneuer, R.; Gremlich, H.U.; Karmouty-Quintana, H.; Blé, F.X.; Müller, M. In vivo mouse imaging and spectroscopy in drug discovery. NMR Biomed. Int. J. Devoted Dev. Appl. Magn. Reson. In Vivo 2007, 20, 154–185. [Google Scholar] [CrossRef] [PubMed]
- Serkova, N.J.; Glunde, K.; Haney, C.R.; Farhoud, M.; De Lille, A.; Redente, E.F.; Simberg, D.; Westerly, D.C.; Griffin, L.; Mason, R.P. Preclinical applications of multi-platform imaging in animal models of cancer. Cancer Res. 2021, 81, 1189–1200. [Google Scholar] [CrossRef]
- Cook, N.; Jodrell, D.I.; Tuveson, D.A. Predictive in vivo animal models and translation to clinical trials. Drug Discov. Today 2012, 17, 253–260. [Google Scholar] [CrossRef] [PubMed]
- Pogue, B.W.; Zhang, R.; Cao, X.; Jia, J.M.; Petusseau, A.; Bruza, P.; Vinogradov, S.A. Review of in vivo optical molecular imaging and sensing from x-ray excitation. J. Biomed. Opt. 2021, 26, 010902. [Google Scholar] [CrossRef]
- Staufer, T.; Grüner, F. Review of development and recent advances in biomedical X-ray fluorescence imaging. Int. J. Mol. Sci. 2023, 24, 10990. [Google Scholar] [CrossRef]
- Körnig, C.; Staufer, T.; Schmutzler, O.; Bedke, T.; Machicote, A.; Liu, B.; Liu, Y.; Gargioni, E.; Feliu, N.; Parak, W.J.; et al. In-situ X-ray fluorescence imaging of the endogenous iodine distribution in murine thyroids. Sci. Rep. 2022, 12, 2903. [Google Scholar] [CrossRef]
- Keinänen, O.; Fung, K.; Brennan, J.M.; Zia, N.; Harris, M.; van Dam, E.; Biggin, C.; Hedt, A.; Stoner, J.; Donnelly, P.S.; et al. Harnessing 64Cu/67Cu for a theranostic approach to pretargeted radioimmunotherapy. Proc. Natl. Acad. Sci. USA 2020, 117, 28316–28327. [Google Scholar] [CrossRef] [PubMed]
- Keinänen, O.; Brennan, J.M.; Membreno, R.; Fung, K.; Gangangari, K.; Dayts, E.J.; Williams, C.J.; Zeglis, B.M. Dual radionuclide theranostic pretargeting. Mol. Pharm. 2019, 16, 4416–4421. [Google Scholar] [CrossRef] [PubMed]
- Ahmad, M.; Pratx, G.; Bazalova, M.; Xing, L. X-ray luminescence and X-ray fluorescence computed tomography: New molecular imaging modalities. IEEE Access 2014, 2, 1051–1061. [Google Scholar] [CrossRef]
- Pratx, G.; Carpenter, C.M.; Sun, C.; Xing, L. X-ray luminescence computed tomography via selective excitation: A feasibility study. IEEE Trans. Med. Imaging 2010, 29, 1992–1999. [Google Scholar] [CrossRef]
- Staufer, T.; Körnig, C.; Liu, B.; Liu, Y.; Lanzloth, C.; Schmutzler, O.; Bedke, T.; Machicote, A.; Parak, W.J.; Feliu, N.; et al. Enabling X-ray fluorescence imaging for in vivo immune cell tracking. Sci. Rep. 2023, 13, 11505. [Google Scholar] [CrossRef] [PubMed]
- Ungerer, A.; Staufer, T.; Schmutzler, O.; Körnig, C.; Rothkamm, K.; Grüner, F. X-ray-Fluorescence Imaging for In Vivo Detection of Gold-Nanoparticle-Labeled Immune Cells: A GEANT4 Based Feasibility Study. Cancers 2021, 13, 5759. [Google Scholar] [CrossRef] [PubMed]
- Kahl, H.; Staufer, T.; Körnig, C.; Schmutzler, O.; Rothkamm, K.; Grüner, F. Feasibility of monitoring tumor response by tracking nanoparticle-labelled T cells using X-ray fluorescence imaging—A numerical study. Int. J. Mol. Sci. 2021, 22, 8736. [Google Scholar] [CrossRef] [PubMed]
- Shaker, K.; Vogt, C.; Katsu-Jiménez, Y.; Kuiper, R.V.; Andersson, K.; Li, Y.; Larsson, J.C.; Rodriguez-Garcia, A.; Toprak, M.S.; Arsenian-Henriksson, M.; et al. Longitudinal in-vivo X-ray fluorescence computed tomography with molybdenum nanoparticles. IEEE Trans. Med. Imaging 2020, 39, 3910–3919. [Google Scholar] [CrossRef] [PubMed]
- Larsson, J.C.; Vogt, C.; Vågberg, W.; Toprak, M.S.; Dzieran, J.; Arsenian-Henriksson, M.; Hertz, H.M. High-spatial-resolution X-ray fluorescence tomography with spectrally matched nanoparticles. Phys. Med. Biol. 2018, 63, 164001. [Google Scholar] [CrossRef]
- Grüner, F.; Blumendorf, F.; Schmutzler, O.; Staufer, T.; Bradbury, M.; Wiesner, U.; Rosentreter, T.; Loers, G.; Lutz, D.; Richter, B.; et al. Localising functionalised gold-nanoparticles in murine spinal cords by X-ray fluorescence imaging and background-reduction through spatial filtering for human-sized objects. Sci. Rep. 2018, 8, 16561. [Google Scholar] [CrossRef]
- Arsana, K.G.; Saladino, G.M.; Brodin, B.; Toprak, M.S.; Hertz, H.M. Laboratory Liquid-Jet X-ray Microscopy and X-ray Fluorescence Imaging for Biomedical Applications. Int. J. Mol. Sci. 2024, 25, 920. [Google Scholar] [CrossRef]
- Li, L.; Zhang, S.; Zhang, W.; Lu, H. Full-field in vivo imaging of nanoparticles using benchtop cone-beam XFCT system with pixelated photon counting detector. Phys. Med. Biol. 2023, 68, 035020. [Google Scholar] [CrossRef] [PubMed]
- Jayarathna, S.; Moktan, H.; Cho, S.H. Use of the fully spectroscopic pixelated cadmium telluride detector for benchtop X-ray fluorescence computed tomography. IEEE Access 2022, 10, 105074–105083. [Google Scholar] [CrossRef] [PubMed]
- Zhang, S.; Li, L.; Chen, J.; Chen, Z.; Zhang, W.; Lu, H. Quantitative imaging of Gd nanoparticles in mice using benchtop cone-beam X-ray fluorescence computed tomography system. Int. J. Mol. Sci. 2019, 20, 2315. [Google Scholar] [CrossRef] [PubMed]
- Jung, S.; Kim, T.; Lee, W.; Kim, H.; Kim, H.S.; Im, H.J.; Ye, S.J. Dynamic in vivo X-ray fluorescence imaging of gold in living mice exposed to gold nanoparticles. IEEE Trans. Med. Imaging 2019, 39, 526–533. [Google Scholar] [CrossRef] [PubMed]
- Li, Y.; Saladino, G.M.; Shaker, K.; Svenda, M.; Vogt, C.; Brodin, B.; Hertz, H.M.; Toprak, M.S. Synthesis, Physicochemical Characterization, and Cytotoxicity Assessment of Rh Nanoparticles with Different Morphologies-as Potential XFCT Nanoprobes. Nanomaterials 2020, 10, 2129. [Google Scholar] [CrossRef] [PubMed]
- Hertz, H.M.; Larsson, J.C.; Lundström, U.; Larsson, D.H.; Vogt, C. Laboratory x-ray fluorescence tomography for high-resolution nanoparticle bio-imaging. Opt. Lett. 2014, 39, 2790–2793. [Google Scholar] [CrossRef] [PubMed]
- Shaker, K.; Larsson, J.C.; Hertz, H.M. Quantitative predictions in small-animal X-ray fluorescence tomography. Biomed. Opt. Express 2019, 10, 3773–3788. [Google Scholar] [CrossRef] [PubMed]
- Saladino, G.M.; Vogt, C.; Li, Y.; Shaker, K.; Brodin, B.; Svenda, M.; Hertz, H.M.; Toprak, M.S. Optical and X-ray fluorescent nanoparticles for dual mode bioimaging. ACS Nano 2021, 15, 5077–5085. [Google Scholar] [CrossRef]
- Saladino, G.M.; Kilic, N.I.; Brodin, B.; Hamawandi, B.; Yazgan, I.; Hertz, H.M.; Toprak, M.S. Carbon quantum dots conjugated rhodium nanoparticles as hybrid multimodal contrast agents. Nanomaterials 2021, 11, 2165. [Google Scholar] [CrossRef]
- Goldberg, K.A. Derivation of closed-form ellipsoidal X-ray mirror shapes from Fermat’s principle. J. Synchrotron Radiat. 2022, 29, 991–996. [Google Scholar] [CrossRef] [PubMed]
- Grigorieva, I.; Antonov, A.; Gudi, G. Graphite optics—Current opportunities, properties and limits. Condens. Matter 2019, 4, 18. [Google Scholar] [CrossRef]
- Legall, H.; Stiel, H.; Arkadiev, V.; Bjeoumikhov, A. High spectral resolution X-ray optics with highly oriented pyrolytic graphite. Opt. Express 2006, 14, 4570–4576. [Google Scholar] [CrossRef]
- Bartkoski, D.A.; Bar-David, A.; Kleckner, M.; Mirkovic, D.; Tailor, R.; Moradi-Kurdestany, J.; Borukhin, S.; Harel, Z.; Burshtein, Z.; Zuck, A.; et al. Analysis of a novel X-ray lens for converging beam radiotherapy. Sci. Rep. 2021, 11, 19180. [Google Scholar] [CrossRef]
- Baumann, J.; Körnig, C.; Staufer, T.; Schlesiger, C.; Schmutzler, O.; Grüner, F.; Malzer, W.; Kanngießer, B. Enabling Coarse X-ray Fluorescence Imaging Scans with Enlarged Synchrotron Beam by Means of Mosaic Crystal Defocusing Optics. Int. J. Mol. Sci. 2022, 23, 4673. [Google Scholar] [CrossRef]
- Müller, B.H.; Hoeschen, C.; Grüner, F.; Arkadiev, V.A.; Johnson, T.R. Molecular imaging based on x-ray fluorescent high-Z tracers. Phys. Med. Biol. 2013, 58, 8063. [Google Scholar] [CrossRef] [PubMed]
- Gerlach, M.; Anklamm, L.; Antonov, A.; Grigorieva, I.; Holfelder, I.; Kanngießer, B.; Legall, H.; Malzer, W.; Schlesiger, C.; Beckhoff, B. Characterization of HAPG mosaic crystals using synchrotron radiation. J. Appl. Crystallogr. 2015, 48, 1381–1390. [Google Scholar] [CrossRef]
- Anklamm, L.; Schlesiger, C.; Malzer, W.; Grötzsch, D.; Neitzel, M.; Kanngießer, B. A novel von Hamos spectrometer for efficient X-ray emission spectroscopy in the laboratory. Rev. Sci. Instrum. 2014, 85, 053110. [Google Scholar] [CrossRef] [PubMed]
- Zastrau, U.; Woldegeorgis, A.; Förster, E.; Loetzsch, R.; Marschner, H.; Uschmann, I. Characterization of strongly-bent HAPG crystals for von-Hámos X-ray spectrographs. J. Instrum. 2013, 8, P10006. [Google Scholar] [CrossRef]
- Zastrau, U.; Brown, C.; Döppner, T.; Glenzer, S.; Gregori, G.; Lee, H.; Marschner, H.; Toleikis, S.; Wehrhan, O.; Förster, E. Focal aberrations of large-aperture HOPG von-Hamos X-ray spectrometers. J. Instrum. 2012, 7, P09015. [Google Scholar] [CrossRef]
- Uschmann, I.; Nothelle, U.; Förster, E.; Arkadiev, V.; Langhoff, N.; Antonov, A.; Grigorieva, I.; Steinkopf, R.; Gebhardt, A. High efficiency, high quality X-ray optic based on ellipsoidally bent highly oriented pyrolytic graphite crystal for ultrafast X-ray diffraction experiments. Appl. Opt. 2005, 44, 5069–5075. [Google Scholar] [CrossRef]
- Grigorieva, I.; Antonov, A. HOPG as powerful X-ray optics. X-ray Spectrom. Int. J. 2003, 32, 64–68. [Google Scholar] [CrossRef]
- Beckhoff, B.; Kanngießer, B. Improvement of the Detection sensitivity of EDXRF Trace Element Analysis by means of efficient X-ray focusing based on strongly curved HOPG crystals. Adv. X-ray Anal. 1995, 39, 109–117. [Google Scholar] [CrossRef]
- Beckhoff, B.; Laursen, J. Bent and flat highly oriented pyrolytic graphite crystals as small bragg angle monochromators in thin-specimen energy-dispersive XRF analysis. X-ray Spectrom. 1994, 23, 7–18. [Google Scholar] [CrossRef]
- Dunning, C.; Bazalova-Carter, M. Optimization of a table-top X-ray fluorescence computed tomography (XFCT) system. Phys. Med. Biol. 2018, 63, 235013. [Google Scholar] [CrossRef] [PubMed]
- Dunning, C.A.; Bazalova-Carter, M. Sheet beam X-ray fluorescence computed tomography (XFCT) imaging of gold nanoparticles. Med. Phys. 2018, 45, 2572–2582. [Google Scholar] [CrossRef] [PubMed]
- Sjölin, M.; Danielsson, M. Improved signal-to-noise ratio for non-perpendicular detection angles in X-ray fluorescence computed tomography (XFCT). Phys. Med. Biol. 2014, 59, 6507. [Google Scholar] [CrossRef] [PubMed]
- Bazalova, M.; Kuang, Y.; Pratx, G.; Xing, L. Investigation of X-ray fluorescence computed tomography (XFCT) and K-edge imaging. IEEE Trans. Med. Imaging 2012, 31, 1620–1627. [Google Scholar] [CrossRef] [PubMed]
- Allison, J.; Amako, K.; Apostolakis, J.; Arce, P.; Asai, M.; Aso, T.; Bagli, E.; Bagulya, A.; Banerjee, S.; Barrand, G.; et al. Recent developments in Geant4. Nucl. Instrum. Methods Phys. Res. Sect. A Accel. Spectrom. Detect. Assoc. Equip. 2016, 835, 186–225. [Google Scholar] [CrossRef]
- Allison, J.; Amako, K.; Apostolakis, J.; Araujo, H.; Dubois, P.A.; Asai, M.; Barrand, G.; Capra, R.; Chauvie, S.; Chytracek, R.; et al. Geant4 developments and applications. IEEE Trans. Nucl. Sci. 2006, 53, 270–278. [Google Scholar] [CrossRef]
- Agostinelli, S.; Allison, J.; Amako, K.A.; Apostolakis, J.; Araujo, H.; Arce, P.; Asai, M.; Axen, D.; Banerjee, S.; Barrand, G.; et al. GEANT4—A simulation toolkit. Nucl. Instrum. Methods Phys. Res. Sect. A Accel. Spectrom. Detect. Assoc. Equip. 2003, 506, 250–303. [Google Scholar] [CrossRef]
- Liu, Y.; Li, J.; Chen, M.; Chen, X.; Zheng, N. Palladium-based nanomaterials for cancer imaging and therapy. Theranostics 2020, 10, 10057. [Google Scholar] [CrossRef] [PubMed]
- Miller, M.A.; Askevold, B.; Mikula, H.; Kohler, R.H.; Pirovich, D.; Weissleder, R. Nano-palladium is a cellular catalyst for in vivo chemistry. Nat. Commun. 2017, 8, 15906. [Google Scholar] [CrossRef] [PubMed]
- Shi, S.; Chen, X.; Wei, J.; Huang, Y.; Weng, J.; Zheng, N. Platinum (IV) prodrug conjugated Pd@ Au nanoplates for chemotherapy and photothermal therapy. Nanoscale 2016, 8, 5706–5713. [Google Scholar] [CrossRef] [PubMed]
- Chen, M.; Tang, S.; Guo, Z.; Wang, X.; Mo, S.; Huang, X.; Liu, G.; Zheng, N. Core–Shell Pd@ Au nanoplates as theranostic agents for in-vivo photoacoustic imaging, ct imaging, and photothermal therapy. Adv. Mater. 2014, 26, 8210–8216. [Google Scholar] [CrossRef] [PubMed]
- Reissig, F.; Hübner, R.; Steinbach, J.; Pietzsch, H.J.; Mamat, C. Facile preparation of radium-doped, functionalized nanoparticles as carriers for targeted alpha therapy. Inorg. Chem. Front. 2019, 6, 1341–1349. [Google Scholar] [CrossRef]
- Meagher, M.J.; Leone, B.; Turnbull, T.L.; Ross, R.D.; Zhang, Z.; Roeder, R.K. Dextran-encapsulated barium sulfate nanoparticles prepared for aqueous dispersion as an X-ray contrast agent. J. Nanopart. Res. 2013, 15, 1–10. [Google Scholar] [CrossRef]
- Noreen, R.; Pineau, R.; Chien, C.C.; Cestelli-Guidi, M.; Hwu, Y.; Marcelli, A.; Moenner, M.; Petibois, C. Functional histology of glioma vasculature by FTIR imaging. Anal. Bioanal. Chem. 2011, 401, 795–801. [Google Scholar] [CrossRef]
- Dogdas, B.; Stout, D.; Chatziioannou, A.F.; Leahy, R.M. Digimouse: A 3D whole body mouse atlas from CT and cryosection data. Phys. Med. Biol. 2007, 52, 577. [Google Scholar] [CrossRef]
- Digimouse: 3D Mouse Atlas, Biomedical Imaging Group, University of Southern California. Available online: https://neuroimage.usc.edu/neuro/Digimouse (accessed on 1 January 2023).
- del Rio, M.S.; Gambaccini, M.; Pareschi, G.; Taibi, A.; Tuffanelli, A.; Freund, A.K. Focusing properties of mosaic crystals. In Proceedings of the Crystal and Multilayer Optics, San Diego, CA, USA, 21–22 July 1998; SPIE: Bellingham, WA, USA, 1998; Volume 3448, pp. 246–255. [Google Scholar]
- Šmíd, M.; Pan, X.; Falk, K. X-ray spectrometer simulation code with a detailed support of mosaic crystals. Comput. Phys. Commun. 2021, 262, 107811. [Google Scholar] [CrossRef]
- Raytracing Code mmpxrt for X-ray Spectrometers with Mosaic Crystals. Written 2017–2020, Michal Smid. Available online: https://gitlab.hzdr.de/smid55/mmpxrt (accessed on 1 March 2023).
- Ashton, J.R.; West, J.L.; Badea, C.T. In vivo small animal micro-CT using nanoparticle contrast agents. Front. Pharmacol. 2015, 6, 256. [Google Scholar] [CrossRef] [PubMed]
- Behling, R.; Grüner, F. Diagnostic X-ray sources—Present and future. Nucl. Instrum. Methods Phys. Res. Sect. A Accel. Spectrometers Detect. Assoc. Equip. 2018, 878, 50–57. [Google Scholar] [CrossRef]
- Pfeiffer, D.; Pfeiffer, F.; Rummeny, E. Advanced X-ray imaging technology. Mol. Imaging Oncol. 2020, 216, 3–30. [Google Scholar]
- Navarro, K.L.; Huss, M.; Smith, J.C.; Sharp, P.; Marx, J.O.; Pacharinsak, C. Mouse anesthesia: The art and science. ILAR J. 2021, 62, 238–273. [Google Scholar] [CrossRef] [PubMed]
- Ewald, A.J.; Werb, Z.; Egeblad, M. Monitoring of vital signs for long-term survival of mice under anesthesia. Cold Spring Harb. Protoc. 2011, 2011, pdb.prot5563. [Google Scholar] [CrossRef]
- X-ray WorX Microfocus X-ray Tube XWT-225-XC. Available online: https://x-ray-worx.com/wp-content/uploads/2023/07/TPDS-Product-Line-XC_V3.4_07-2023-1.pdf (accessed on 25 November 2023).
- Verhaegen, F.; Granton, P.; Tryggestad, E. Small animal radiotherapy research platforms. Phys. Med. Biol. 2011, 56, R55. [Google Scholar] [CrossRef] [PubMed]
- Valcourt, D.M.; Kapadia, C.H.; Scully, M.A.; Dang, M.N.; Day, E.S. Best practices for preclinical in vivo testing of cancer nanomedicines. Adv. Healthc. Mater. 2020, 9, 2000110. [Google Scholar] [CrossRef] [PubMed]
- Hubrecht, R.C.; Carter, E. The 3Rs and humane experimental technique: Implementing change. Animals 2019, 9, 754. [Google Scholar] [CrossRef] [PubMed]
- Dobrovolskaia, M.A.; McNeil, S.E. Understanding the correlation between in vitro and in vivo immunotoxicity tests for nanomedicines. J. Control. Release 2013, 172, 456–466. [Google Scholar] [CrossRef]
- Pisa, A.; Frontera, F.; Loffredo, G.; Pellicciotta, D.; Auricchio, N. Laue lens development for hard X-rays (> 60 keV). Exp. Astron. 2005, 20, 219–228. [Google Scholar] [CrossRef]
- Pisa, A.; Frontera, F.; De Chiara, P.; Loffredo, G.; Pellicciotta, D.; Landini, G.; Franceschini, T.; Silvestri, S.; Andersen, K.; Courtois, P.; et al. Feasibility study of a Laue lens for hard x rays for space astronomy. In Proceedings of the Advances in Computational Methods for X-ray and Neutron Optics, Denver, CO, USA, 3–5 August 2004; SPIE: Bellingham, WA, USA, 2004; Volume 5536, pp. 39–48. [Google Scholar]
- Boone, J.M.; Velazquez, O.; Cherry, S.R. Small-animal X-ray dose from micro-CT. Mol. Imaging 2004, 3, 149–158. [Google Scholar] [CrossRef] [PubMed]
- Parkins, C.; Fowler, J.; Maughan, R.; Roper, M. Repair in mouse lung for up to 20 fractions of X rays or neutrons. Br. J. Radiol. 1985, 58, 225–241. [Google Scholar] [CrossRef]
- Amptek Silicon Drift Detector XR-100FastSDD. Available online: https://www.amptek.com/-/media/ametekamptek/documents/resources/products/user-manuals/xr100-1mm-fastsdd-user-manual-b4.pdf?la=en&revision=24e8eb09-6164-48ba-8336-e572f84bf5c1 (accessed on 15 December 2023).
- Amptek Cadmium Telluride Detector XR-100CdTe. 2017. Available online: https://www.amptek.com/-/media/ametekamptek/documents/resources/products/user-manuals/xr100-cdte-user-manual-b2.pdf?la=en&revision=c7533c8d-5c70-4172-a1e0-3582edb70d5e (accessed on 15 December 2023).
- Allison, J.; Apostolakis, J.; Bagulya, A.; Champion, C.; Elles, S.; Garay, F.; Grichine, V.; Howard, A.; Incerti, S.; Ivanchenko, V.; et al. Geant4 electromagnetic physics for high statistic simulation of LHC experiments. Proc. J. Phys. Conf. Ser. Iop Publ. 2012, 396, 022013. [Google Scholar] [CrossRef]
- Ivanchenko, V.; Apostolakis, J.; Bagulya, A.V.; Abdelouahed, H.B.; Black, R.; Bogdanov, A.; Burkhard, H.; Chauvie, S.; Cirrone, G.A.P.; Cuttone, G.; et al. Recent improvements in geant4 electromagnetic physics models and interfaces. Prog. Nucl. Sci. Technol. 2011, 2, 898–903. [Google Scholar] [CrossRef]
- Guan, F.; Asai, M.; Bartkoski, D.A.; Kleckner, M.; Harel, Z.; Salehpour, M. Adding the X-ray Bragg reflection physical process in crystal to the Geant4 Monte Carlo simulation toolkit, part I: Reflection from a crystal slab. Precis. Radiat. Oncol. 2023, 7, 59–66. [Google Scholar] [CrossRef]
- Schlesiger, C.; Anklamm, L.; Malzer, W.; Gnewkow, R.; Kanngießer, B. A new model for the description of X-ray diffraction from mosaic crystals for ray-tracing calculations. J. Appl. Crystallogr. 2017, 50, 1490–1497. [Google Scholar] [CrossRef]
- Freund, A.K.; Munkholm, A.; Brennan, S. X-ray diffraction properties of highly oriented pyrolytic graphite. In Proceedings of the Optics for High-Brightness Synchrotron Radiation Beamlines II, Denver, CO, USA, 6–7 August 1996; SPIE: Bellingham, WA, USA, 1996; Volume 2856, pp. 68–79. [Google Scholar]
- Schneider, J.R. Diffraction properties of a copper mosaic crystal: Model calculations based on γ-ray diffractometry. J. Appl. Crystallogr. 1975, 8, 195–201. [Google Scholar] [CrossRef]
- Zachariasen, W.H. Theory of X-ray Diffraction in Crystals; Dover Books on Physics and Mathematical Physics; Wiley: Hoboken, NJ, USA, 1945. [Google Scholar]
- Ohler, M.; Sanchez del Rio, M.; Tuffanelli, A.; Gambaccini, M.; Taibi, A.; Fantini, A.; Pareschi, G. X-ray topographic determination of the granular structure in a graphite mosaic crystal: A three-dimensional reconstruction. J. Appl. Crystallogr. 2000, 33, 1023–1030. [Google Scholar] [CrossRef]
- Rosentreter, T.; Müller, B.; Schlattl, H.; Hoeschen, C. Experimental investigation of a HOPG crystal fan for X-ray fluorescence molecular imaging. In Proceedings of the Medical Imaging 2017: Physics of Medical Imaging, Orlando, FL, USA, 3–16 February 2017; SPIE: Bellingham, WA, USA, 2017; Volume 10132, pp. 1444–1456. [Google Scholar]
- Guentert, O.; Cvikevich, S. Preferred orientation and its effect on the (hk) reflections in X-ray patterns of pyrolytic graphites. Carbon 1964, 1, 309–313. [Google Scholar] [CrossRef]
- Haschke, M. Laboratory Micro-X-ray Fluorescence Spectroscopy; Springer International Publishing: Cham, Switzerland, 2014; Volume 55. [Google Scholar]
- Antonov, A.; Baryshev, V.; Grigoryeva, I.; Kulipanov, G.; Shchipkov, N. Focusing shaped pyrographite monochromators in synchrotron radiation experiments. Nucl. Instrum. Methods Phys. Res. Sect. A Accel. Spectrom. Detect. Assoc. Equip. 1991, 308, 442–446. [Google Scholar] [CrossRef]
- Application Notes: Amptek Silicon Drift Detector XR-100FastSDD. Available online: https://www.amptek.com/-/media/ametekamptek/documents/resources/application-notes/high-sensitivity-detectors-for-xrf.pdf?la=en&revision=9d04dd37-c2ea-4f89-ad58-55579a8574b1 (accessed on 15 December 2023).
- Application Note ANCZT-2 Rev. 3. Charge Trapping in XR-100T-CdTe and -CZT Detectors. Available online: https://www.amptek.com/-/media/ametekamptek/documents/resources/application-notes/charge-trapping-in-cdte-and-czt.pdf?la=en&revision=6aab2ea7-e5be-43bd-97c5-bc2407f1503a. (accessed on 15 December 2023).
- Redus, R.H.; Pantazis, J.A.; Pantazis, T.J.; Huber, A.C.; Cross, B.J. Characterization of CdTe detectors for quantitative X-ray spectroscopy. IEEE Trans. Nucl. Sci. 2009, 56, 2524–2532. [Google Scholar] [CrossRef]
- Schoonjans, T.; Brunetti, A.; Golosio, B.; Del Rio, M.S.; Solé, V.A.; Ferrero, C.; Vincze, L. The xraylib library for X-ray–matter interactions. Recent developments. Spectrochim. Acta Part B At. Spectrosc. 2011, 66, 776–784. [Google Scholar] [CrossRef]


| m [°] | Thickness [μm] | [°] | [mrad/%] | [%] | [32] [°] | [32]/ [32] [mrad/%] | Crystal [32] | |||
|---|---|---|---|---|---|---|---|---|---|---|
| 59 keV | 8.03 keV | 59 keV | 8.03 keV | 59 keV | 8.03 keV | 8.03 keV | 8.03 keV | |||
| 0.12 | 80 | 0.3 | 0.6 | 0.5/9.5 | 2.2/21 | 16.5 | 46.5 | 0.6 | 0.85/8.2 | HOPG (Thin films) |
| 0.24 | 100 | 0.6 | 0.8 | 0.7/6.4 | 2.8/20 | 10.8 | 34.7 | 0.8 | 1/6.95 | HOPG (Thin films) |
| 0.46 | 120 | 1.25 | 1.2 | 1/4.4 | 3.4/16.2 | 6 | 24.4 | 0.9 | 1.1/6.8 | HOPG (Thin films) |
| m [°] | Projection/Cross-Section [mm] | [#] | [keV] | [keV] | [%] | [%] |
|---|---|---|---|---|---|---|
| 0.84/0.6 | 14 | 5.8 | 8.9 | 9.7 | 15 | |
| 1.1/0.64 | 6.5 | 7.1 | 10.6 | 11.9 | 17.9 | |
| 1.5/0.8 | 2.6 | 9.4 | 11 | 15.8 | 18.4 | |
| Direct X-rays | - | 1 | 16.5 | - | 27.7 | - |
| Parameter | Value | |
|---|---|---|
| Ellipsoidal GrO | Planar GrO | |
| Mosaic spread m | 0.12, 0.24, 0.46 | 0.12, 0.24, 0.46 |
| Crystal thickness T | 80, 100, 120 | 80, 100, 120 |
| Peak energy [keV] | 59 | 59/8.03 |
| Bragg angle | 1.79 | 1.79/13.29 |
| Diffraction order n | 1 | 1 |
| Miller indices | 002 | 002 |
| Lattice spacing [nm] | 0.3354 | 0.3354 |
Disclaimer/Publisher’s Note: The statements, opinions and data contained in all publications are solely those of the individual author(s) and contributor(s) and not of MDPI and/or the editor(s). MDPI and/or the editor(s) disclaim responsibility for any injury to people or property resulting from any ideas, methods, instructions or products referred to in the content. |
© 2024 by the authors. Licensee MDPI, Basel, Switzerland. This article is an open access article distributed under the terms and conditions of the Creative Commons Attribution (CC BY) license (https://creativecommons.org/licenses/by/4.0/).
Share and Cite
Kumar, K.; Fachet, M.; Hoeschen, C. High-Spatial-Resolution Benchtop X-ray Fluorescence Imaging through Bragg-Diffraction-Based Focusing with Bent Mosaic Graphite Crystals: A Simulation Study. Int. J. Mol. Sci. 2024, 25, 4733. https://0-doi-org.brum.beds.ac.uk/10.3390/ijms25094733
Kumar K, Fachet M, Hoeschen C. High-Spatial-Resolution Benchtop X-ray Fluorescence Imaging through Bragg-Diffraction-Based Focusing with Bent Mosaic Graphite Crystals: A Simulation Study. International Journal of Molecular Sciences. 2024; 25(9):4733. https://0-doi-org.brum.beds.ac.uk/10.3390/ijms25094733
Chicago/Turabian StyleKumar, Kunal, Melanie Fachet, and Christoph Hoeschen. 2024. "High-Spatial-Resolution Benchtop X-ray Fluorescence Imaging through Bragg-Diffraction-Based Focusing with Bent Mosaic Graphite Crystals: A Simulation Study" International Journal of Molecular Sciences 25, no. 9: 4733. https://0-doi-org.brum.beds.ac.uk/10.3390/ijms25094733