
Protection of Si Nanowires against Aβ Toxicity by the Inhibition of Aβ Aggregation

 and
and 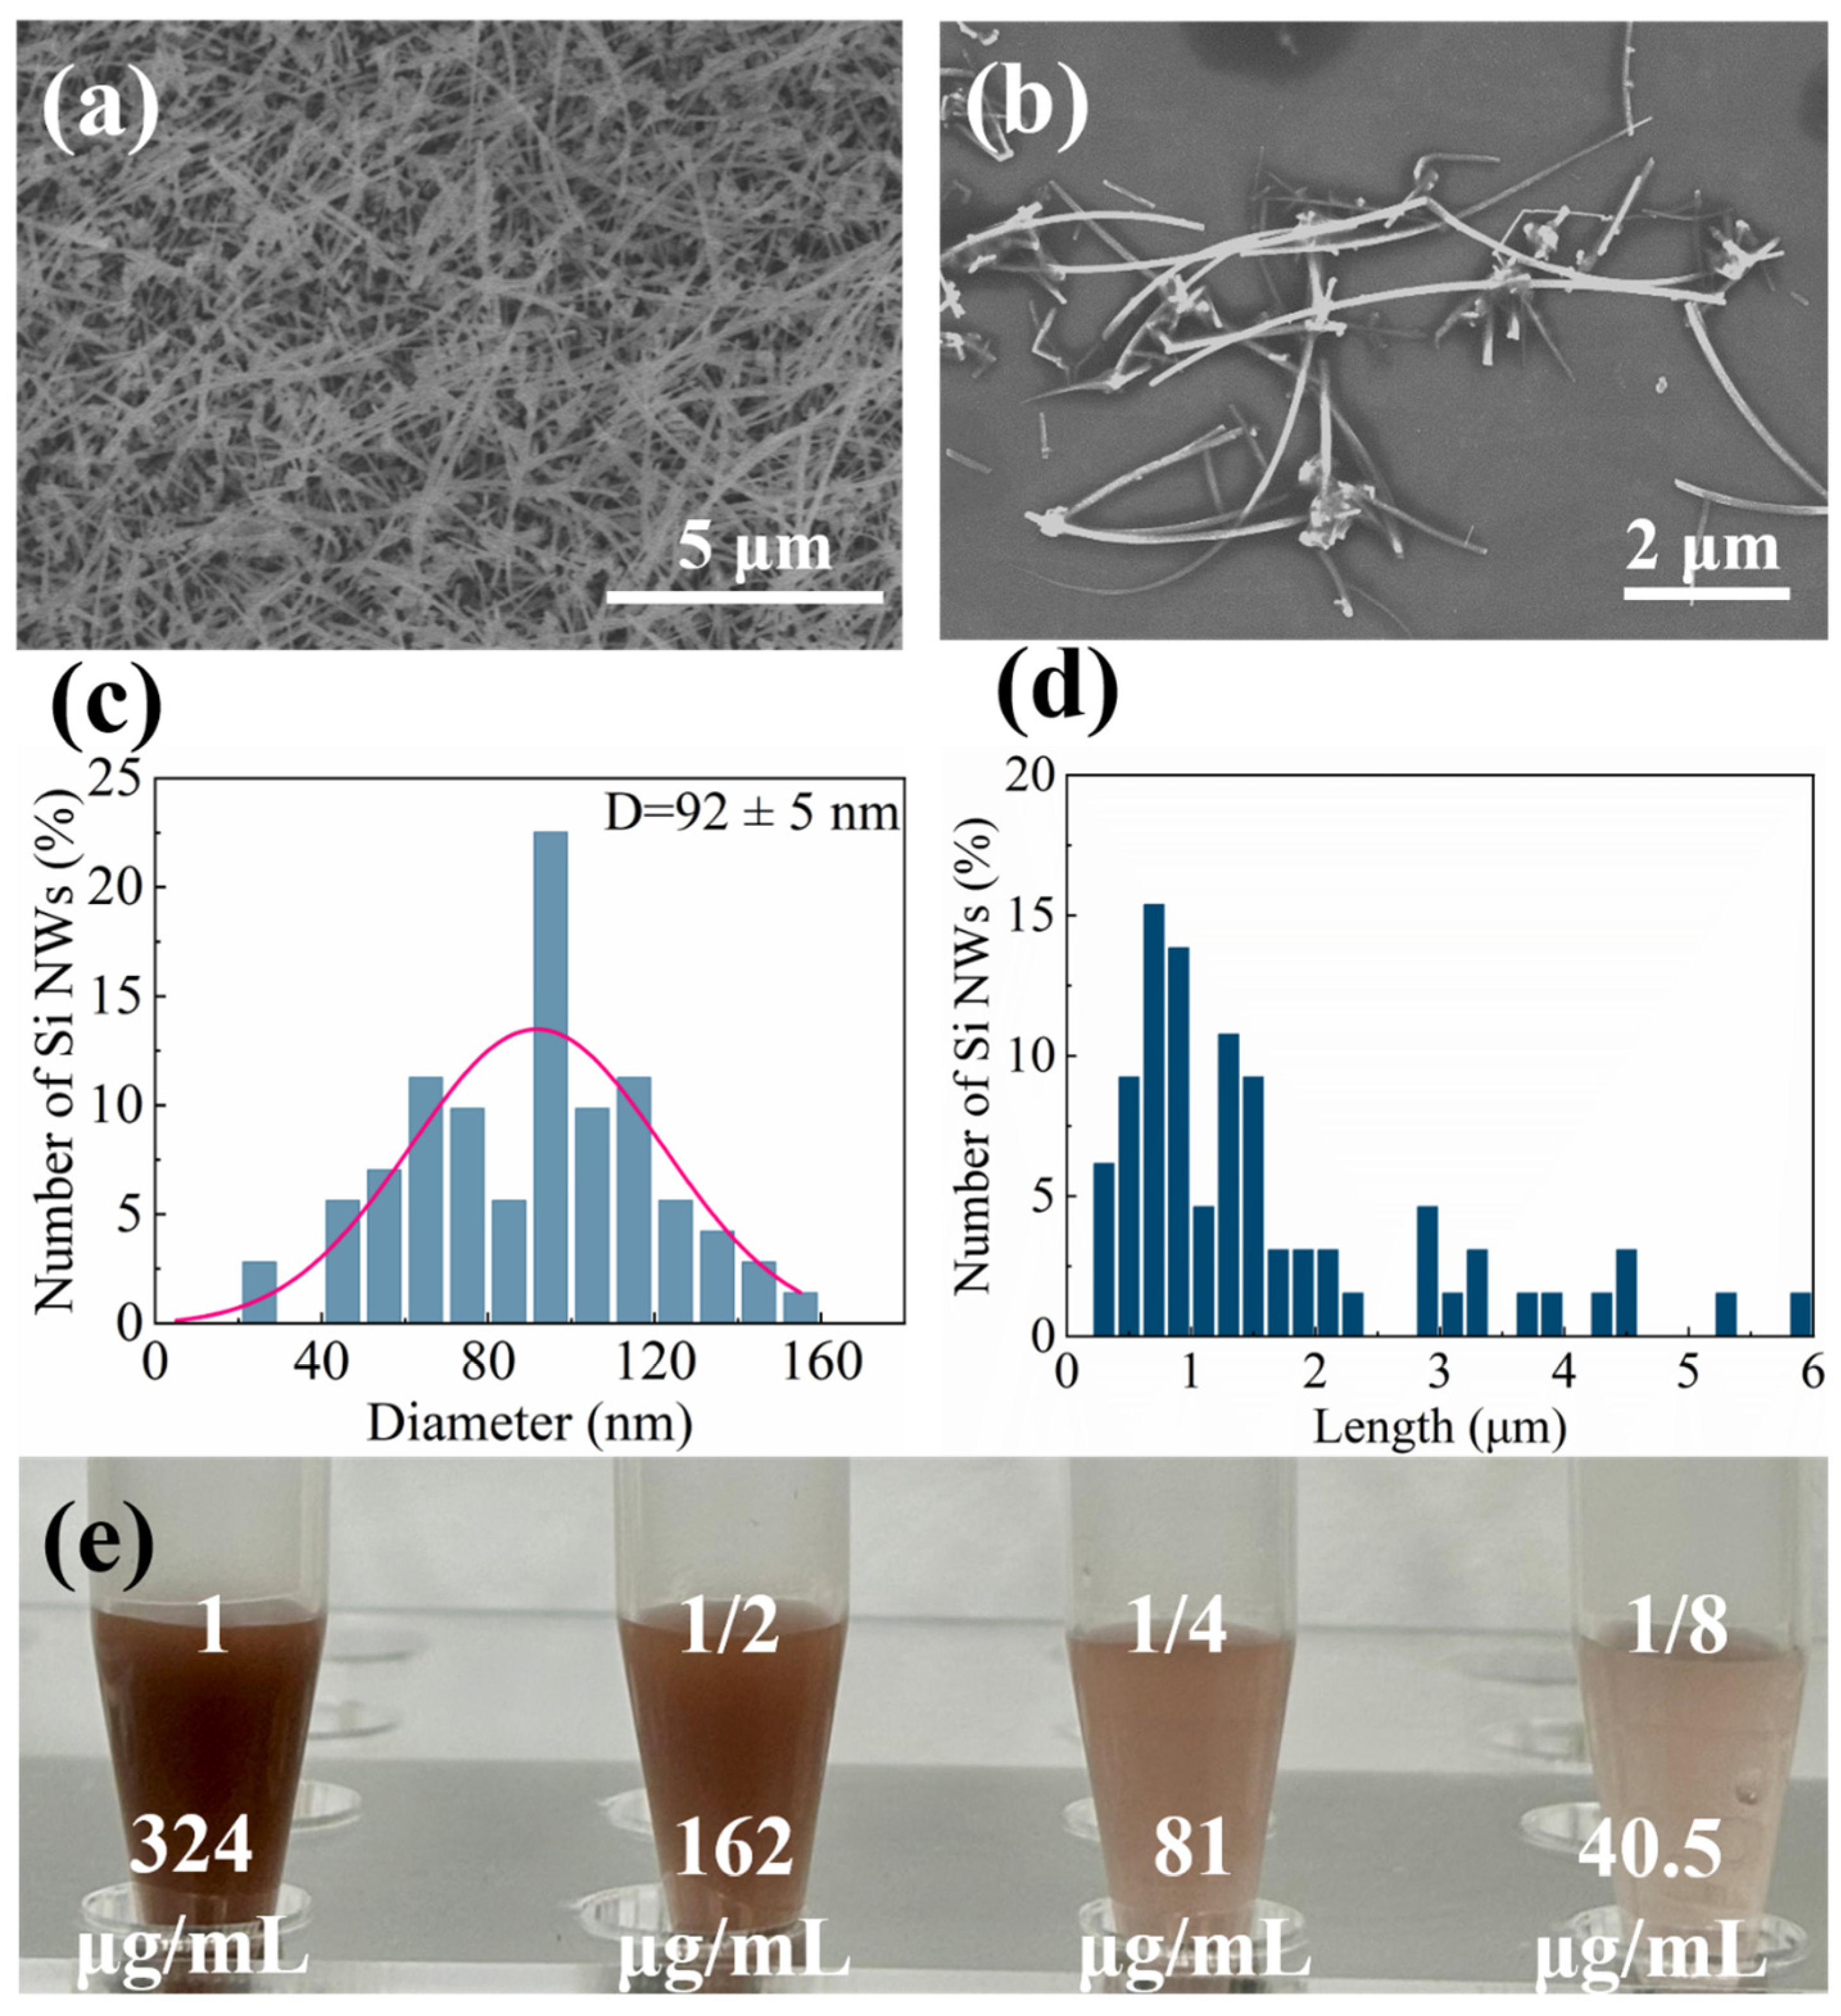
Abstract
:1. Introduction
2. Results and Discussion
2.1. Characterization of Si NWs
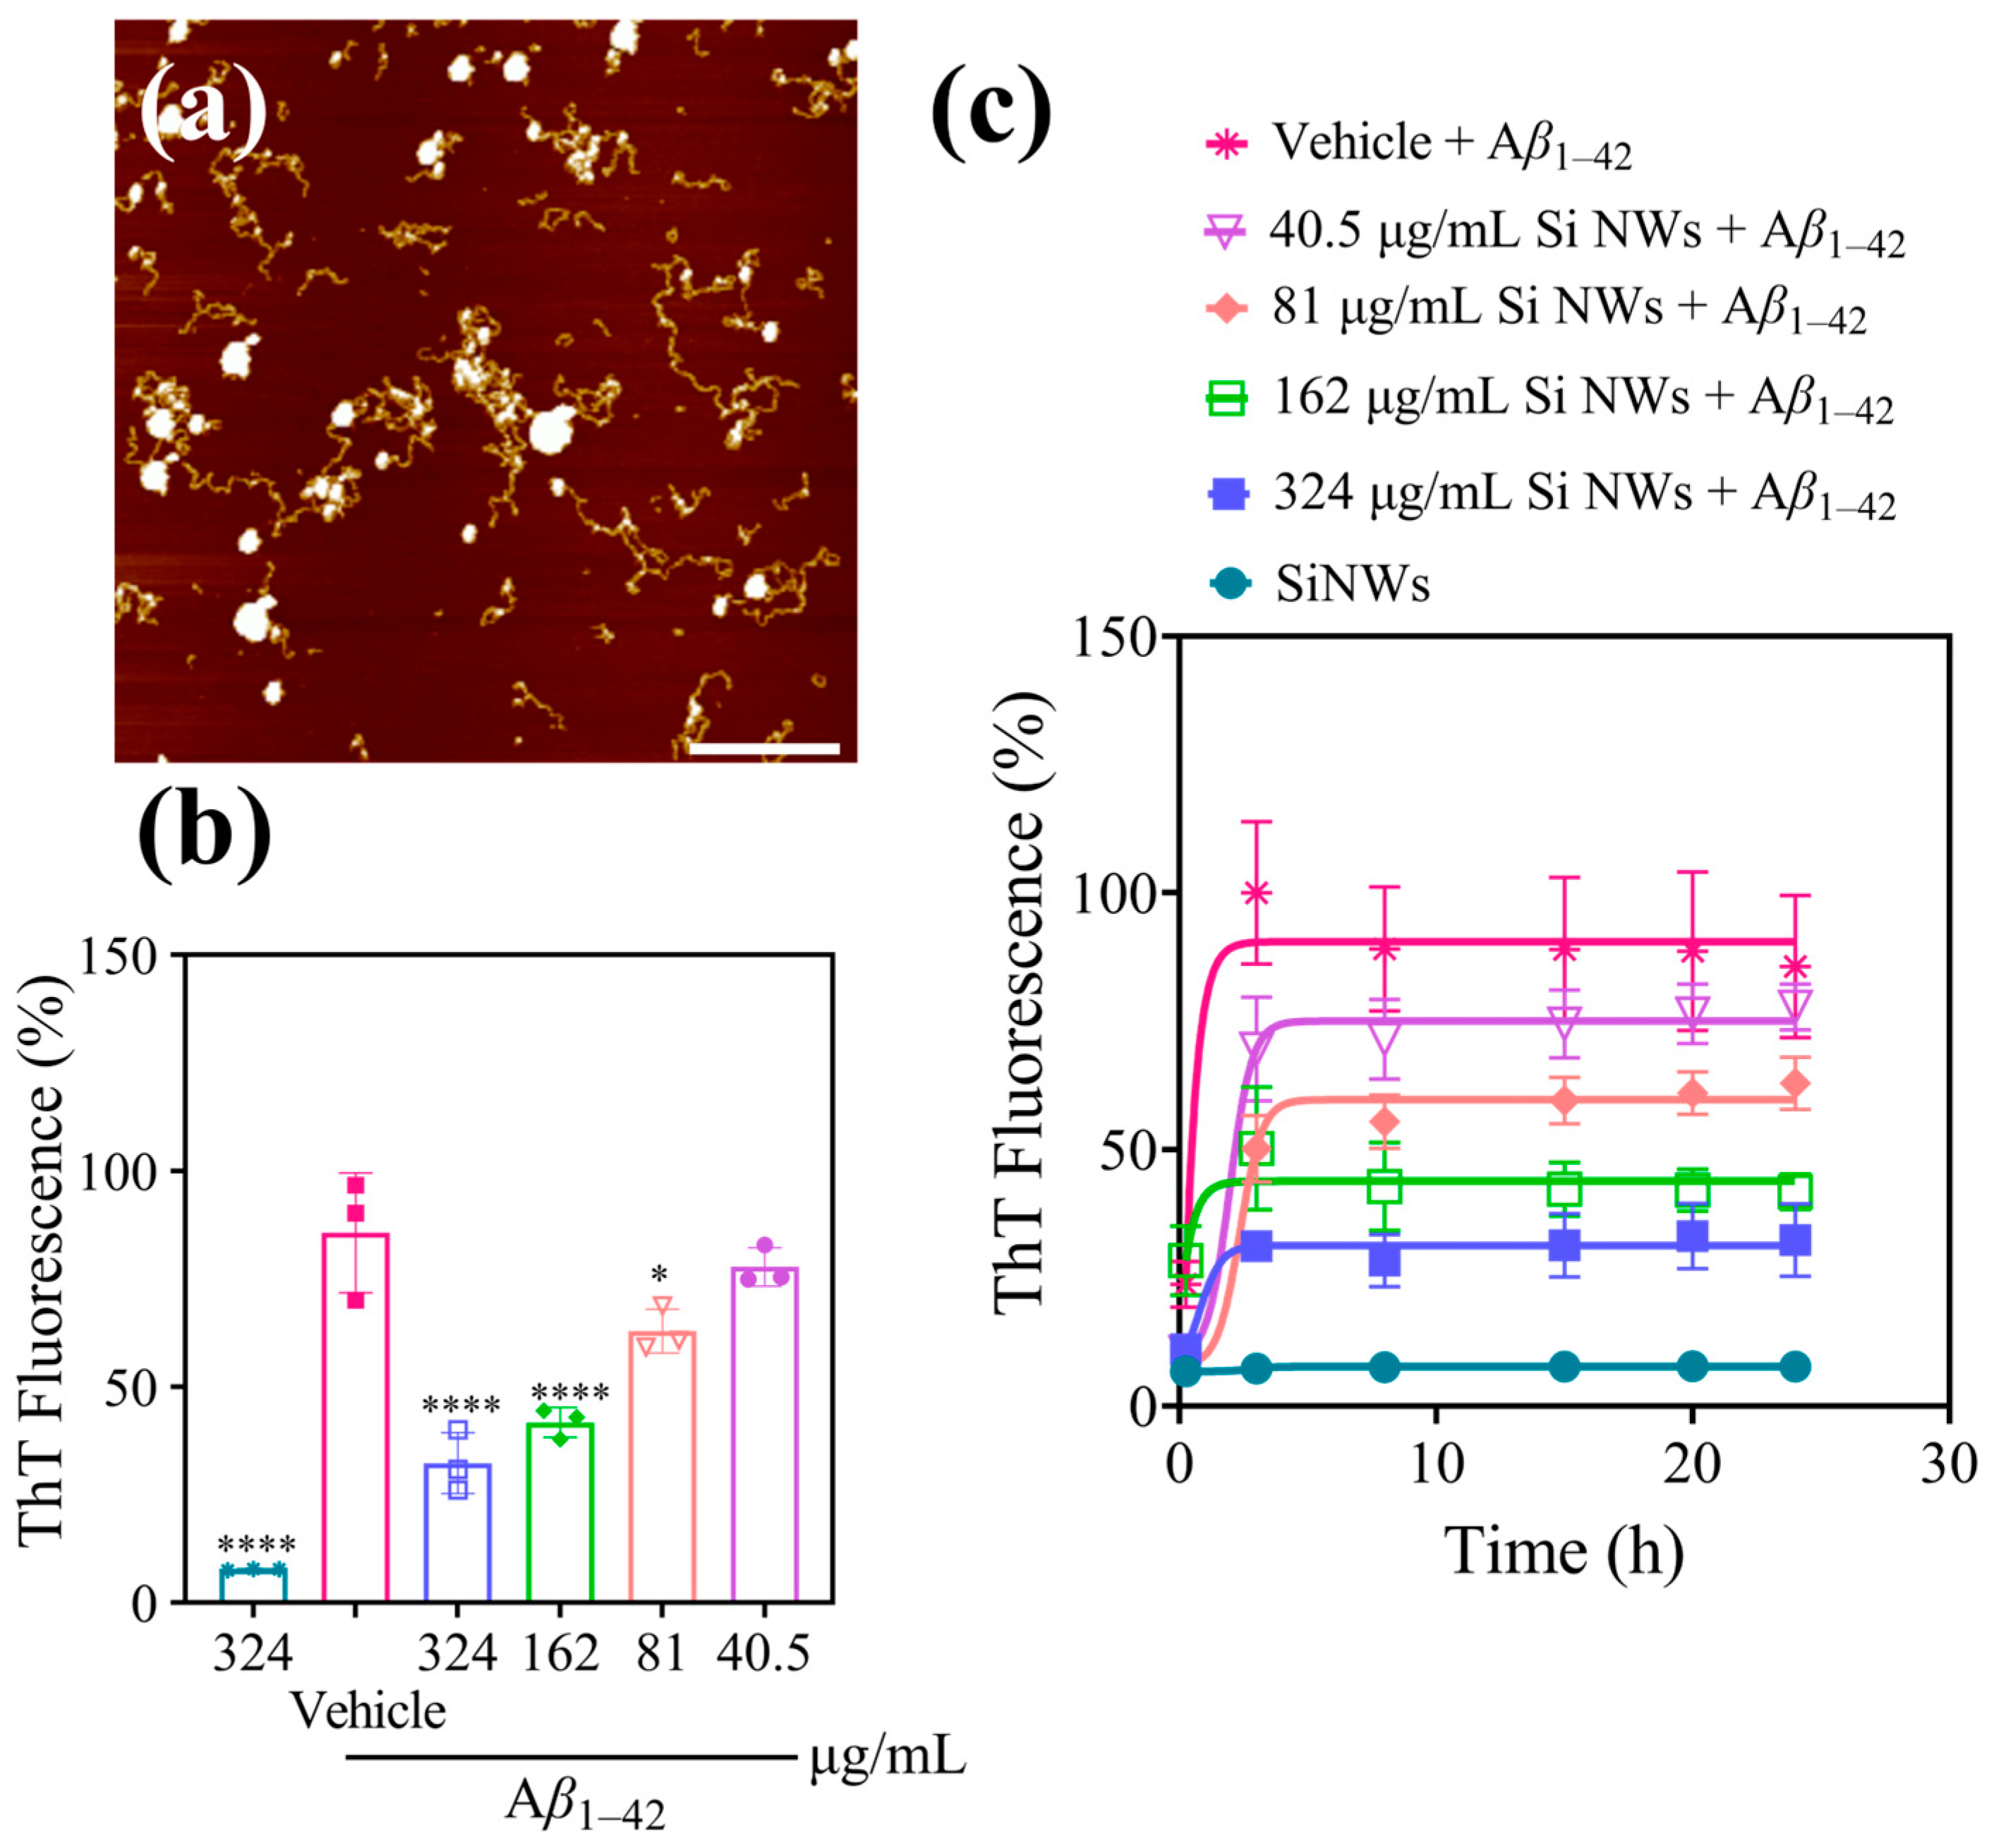
2.2. Inhibition and Remodeling of Aβ1–42 Fibrils by Si NWs
2.3. Si NWs Reduce the Toxicity of Preformed Oligomers of Aβ1–42 In Vitro
2.4. Discussion
3. Experimental Methods
3.1. Synthesis and Transfer of Si NWs
3.2. Preparation of Aβ1–42 Fibrils
3.3. Preparation of Aβ1–42 Oligomers
3.4. ThT Fluorescence
3.5. TEM Imaging
- 0 h Aβ1–42: Undiluted mixed solution representing initial conditions.
- 1 h Aβ1–42: A 1:1 (v/v) dilution representing 1 h incubation (oligomers).
- 24 h Aβ1–42: A 1:2 (v/v) dilution representing 24 h incubation (fibrils).
3.6. AFM Imaging
3.7. PC12 Cell Culture
3.8. Measurement of Cell Viability
3.9. FDA/PI Double Staining Method
3.10. ATR-FTIR Spectroscopy
4. Conclusions
Author Contributions
Funding
Institutional Review Board Statement
Informed Consent Statement
Data Availability Statement
Acknowledgments
Conflicts of Interest
References
- DeTure, M.A.; Dickson, D.W. The neuropathological diagnosis of Alzheimer′s disease. Mol. Neurodegener. 2019, 14, 32. [Google Scholar] [CrossRef] [PubMed]
- Sokolowski, J.D.; Mandell, J.W. Phagocytic Clearance in Neurodegeneration. Am. J. Pathol. 2011, 178, 1416–1428. [Google Scholar] [CrossRef] [PubMed]
- Riemer, J.; Kins, S. Axonal Transport and Mitochondrial Dysfunction in Alzheimer′s Disease. Neurodegener. Dis. 2013, 12, 111–124. [Google Scholar] [CrossRef]
- Liu, M.; Ye, Y. beta-Amyloid Peptide and Alzheimers’ Disease. Chemistry 2002, 65, 458–462. [Google Scholar]
- Iadanza, M.G.; Jackson, M.P.; Hewitt, E.W.; Ranson, N.A.; Radford, S.E. A new era for understanding amyloid structures and disease. Nat. Rev. Mol. Cell Biol. 2018, 19, 755–773. [Google Scholar] [CrossRef] [PubMed]
- Selkoe, D.J. Soluble oligomers of the amyloid β-protein impair synaptic plasticity and behavior. Behav. Brain Res. 2008, 192, 106–113. [Google Scholar] [CrossRef]
- Mallesh, R.; Juhee, k.; Gharai, P.K.; Gupta, V.; Roy, R.; Ghosh, S. Controlling Amyloid Beta Peptide Aggregation and Toxicity by Protease-Stable Ligands. ACS Bio Med Chem Au 2023, 3, 158–173. [Google Scholar] [CrossRef] [PubMed]
- Fukunaga, S.; Ueno, H.; Yamaguchi, T.; Yano, Y.; Hoshino, M.; Matsuzaki, K. GM1 Cluster Mediates Formation of Toxic Aβ Fibrils by Providing Hydrophobic Environments. Biochemistry 2012, 51, 8125–8131. [Google Scholar] [CrossRef] [PubMed]
- Kim, S.T.; Weaver, D.F. Theoretical studies on Alzheimer’s disease: Structures of β-amyloid aggregates. THEOCHEM-J. Mol. Struct. 2000, 527, 127–138. [Google Scholar] [CrossRef]
- Santoro, A.; Grimaldi, M.; Buonocore, M.; Stillitano, I.; D’Ursi, A.M. Exploring the Early Stages of the Amyloid Aβ(1-42) Peptide Aggregation Process: An NMR Study. Pharmaceuticals 2021, 14, 732. [Google Scholar] [CrossRef] [PubMed]
- Milordini, G. A Structural Approach to Investigate Glycation Effect on Protein Aggregation. Ph.D.Thesis, King’s College London, London, UK, 2019. [Google Scholar]
- Cheignon, C.; Tomas, M.; Bonnefont-Rousselot, D.; Faller, P.; Hureau, C.; Collin, F. Oxidative stress and the amyloid beta peptide in Alzheimer’s disease. Redox Biol. 2018, 14, 450–464. [Google Scholar] [CrossRef] [PubMed]
- Neumann, U.; Machauer, R.; Shimshek, D.R. The β-secretase (BACE) inhibitor NB-360 in preclinical models: From amyloid-β reduction to downstream disease-relevant effects. Br. J. Pharmacol. 2019, 176, 3435–3446. [Google Scholar] [CrossRef] [PubMed]
- Beher, D.; Clarke, E.E.; Wrigley, J.D.J.; Martin, A.C.L.; Nadin, A.; Churcher, I.; Shearman, M.S. Selected non-steroidal anti-inflammatory drugs and their derivatives target γ-secretase at a novel site: Evidence for an allosteric mechanism. J. Biol. Chem. 2004, 279, 43419–43426. [Google Scholar] [CrossRef] [PubMed]
- Ding, L.; Meng, Y.; Zhang, H.Y.; Yin, W.C.; Yan, Y.; Cao, Y.P. Prophylactic active immunization with a novel epitope vaccine improves cognitive ability by decreasing amyloid plaques and neuroinflammation in APP/PS1 transgenic mice. Neurosci. Res. 2017, 119, 7–14. [Google Scholar] [CrossRef] [PubMed]
- Jang, J.; Park, C.B. Magnetoelectric dissociation of Alzheimer’s β-amyloid aggregates. Sci. Adv. 2022, 8, eabn1675. [Google Scholar] [CrossRef]
- Li, H.Y.; Luo, Y.; Derreumaux, P.; Wei, G.H. Carbon Nanotube Inhibits the Formation of β-Sheet-Rich Oligomers of the Alzheimer’s Amyloid-β(16-22) Peptide. Biophys. J. 2011, 101, 2267–2276. [Google Scholar] [CrossRef] [PubMed]
- Lin, D.D.; Qi, R.X.; Li, S.J.; He, R.Y.; Li, P.; Wei, G.H.; Yang, X.J. Interaction Dynamics in Inhibiting the Aggregation of Aβ Peptides by SWCNTs: A Combined Experimental and Coarse-Grained Molecular Dynamic Simulation Study. ACS Chem. Neurosci. 2016, 7, 1232–1240. [Google Scholar] [CrossRef] [PubMed]
- Lin, D.D.; Qian, Z.Y.; Bagnani, M.; Hernández-Rodríguez, M.A.; Corredoira-Vázquez, J.; Wei, G.H.; Carlos, L.D.; Mezzenga, R. Probing the Protein Folding Energy Landscape: Dissociation of Amyloid-β Fibrils by Laser-Induced Plasmonic Heating. ACS Nano 2023, 17, 9429–9441. [Google Scholar] [CrossRef] [PubMed]
- Zhang, J.Q.; Zhu, S.S.; Jin, P.P.; Huang, Y.T.; Dai, Q.Q.; Zhu, Q.Y.; Wei, P.F.; Yang, Z.L.; Zhang, L.; Liu, H.; et al. Graphene oxide improves postoperative cognitive dysfunction by maximally alleviating amyloid beta burden in mice. Theranostics 2020, 10, 11908–11920. [Google Scholar] [CrossRef] [PubMed]
- Lin, D.; Qi, R.; Xie, L.; Li, S.; Wei, G.; Yang, X. Studies of the Interaction between Aβ Peptides and Carbon Nano-Materials. Biophys. J. 2017, 112, 137a. [Google Scholar] [CrossRef]
- Luo, J.H.; Wärmländer, S.; Yu, C.H.; Muhammad, K.; Gräslund, A.; Abrahams, J.P. The Aβ peptide forms non-amyloid fibrils in the presence of carbon nanotubes. Nanoscale 2014, 6, 6720–6726. [Google Scholar] [CrossRef] [PubMed]
- Lin, D.D.; Lei, J.T.; Li, S.J.; Zhou, X.F.; Wei, G.H.; Yang, X.J. Investigation of the Dissociation Mechanism of Single-Walled Carbon Nanotube on Mature Amyloid-β Fibrils at Single Nanotube Level. J. Phys. Chem. B 2020, 124, 3459–3468. [Google Scholar] [CrossRef] [PubMed]
- Yoo, C.J.; Lee, U.; Kim, Y.J.; Park, J.; Yoo, Y.M. Dose-Dependent Cytotoxicity of Gold Nanoparticles on Human Neural Progenitor Cells and Rat Brain. J. Nanosci. Nanotechnol. 2019, 19, 5441–5447. [Google Scholar] [CrossRef] [PubMed]
- Muller, A.P.; Ferreira, G.K.; Pires, A.J.; Silveira, G.D.; de Souza, D.L.; Brandolfi, J.D.; de Souza, C.T.; Paula, M.M.S.; Silveira, P.C.L. Gold nanoparticles prevent cognitive deficits, oxidative stress and inflammation in a rat model of sporadic dementia of Alzheimer’s type. Mater. Sci. Eng. 2017, 77, 476–483. [Google Scholar] [CrossRef] [PubMed]
- De Stefano, L.; Rotiroti, L.; Rea, I.; Moretti, L.; Di Francia, G.; Massera, E.; Lamberti, A.; Arcari, P.; Sanges, C.; Rendina, I. Porous silicon-based optical biochips. J. Opt. A-Pure Appl. Opt. 2006, 8, S540–S544. [Google Scholar] [CrossRef]
- Zadorozhnyi, I.; Hlukhova, H.; Kutovyi, Y.; Handziuk, V.; Naumova, N.; Offenhaeusser, A.; Vitusevich, S. Towards pharmacological treatment screening of cardiomyocyte cells using Si nanowire FETs. Biosens. Bioelectron. 2019, 137, 229–235. [Google Scholar] [CrossRef] [PubMed]
- Wu, W.L.; Li, J. Biomedical Characteristics of silicon rubber. J. Clin. Rehabil. Tissue Eng. Res. 2007, 11, 145–147. [Google Scholar]
- Dubrovskii, V.G.; Sibirev, N.V.; Cirlin, G.E.; Soshnikov, I.P.; Chen, W.H.; Larde, R.; Cadel, E.; Pareige, P.; Xu, T.; Grandidier, B.; et al. Gibbs-Thomson and diffusion-induced contributions to the growth rate of Si, InP, and GaAs nanowires. Phys. Rev. B 2009, 79, 205316. [Google Scholar] [CrossRef]
- Chen, W.H.; Lardé, R.; Cadel, E.; Xu, T.; Grandidier, B.; Nys, J.P.; Stiévenard, D.; Pareige, P. Study of the effect of gas pressure and catalyst droplets number density on silicon nanowires growth, tapering, and gold coverage. J. Appl. Phys. 2010, 107, 084902. [Google Scholar] [CrossRef]
- Chen, W.H.; Cabarrocas, P.R.I. Insights into gold-catalyzed plasma-assisted CVD growth of silicon nanowires. Appl. Phys. Lett. 2016, 109, 043108. [Google Scholar] [CrossRef]
- Puglisi, R.A.; Bongiorno, C.; Caccamo, S.; Fazio, E.; Mannino, G.; Neri, F.; Scalese, S.; Spucches, D.; La Magna, A. Chemical Vapor Deposition Growth of Silicon Nanowires with Diameter Smaller Than 5 nm. ACS Omega 2019, 4, 17967–17971. [Google Scholar] [CrossRef]
- Tan, Y.; Coyle, R.C.; Barrs, R.W.; Silver, S.E.; Li, M.; Richards, D.J.; Lin, Y.L.; Jiang, Y.W.; Wang, H.J.; Menick, D.R.; et al. Nanowired human cardiac organoid transplantation enables highly efficient and effective recovery of infarcted hearts. Sci. Adv. 2023, 9, eadf2898. [Google Scholar] [CrossRef] [PubMed]
- Peng, F.; Su, Y.Y.; Wei, X.P.; Lu, Y.M.; Zhou, Y.F.; Zhong, Y.L.; Lee, S.T.; He, Y. Silicon-Nanowire-Based Nanocarriers with Ultrahigh Drug-Loading Capacity for In Vitro and In Vivo Cancer Therapy. Angew. Chem. Int. Ed. 2013, 52, 1457–1461. [Google Scholar] [CrossRef] [PubMed]
- Kim, W.; Ng, J.K.; Kunitake, M.E.; Conklin, B.R.; Yang, P.D. Interfacing silicon nanowires with mammalian cells. J. Am. Chem. Soc. 2007, 129, 7228–7229. [Google Scholar] [CrossRef]
- Shalek, A.K.; Robinson, J.T.; Karp, E.S.; Lee, J.S.; Ahn, D.R.; Yoon, M.H.; Sutton, A.; Jorgolli, M.; Gertner, R.S.; Gujral, T.S.; et al. Vertical silicon nanowires as a universal platform for delivering biomolecules into living cells. Proc. Natl. Acad. Sci. USA 2010, 107, 1870–1875. [Google Scholar] [CrossRef]
- Shalek, A.K.; Gaublomme, J.T.; Wang, L.L.; Yosef, N.; Chevrier, N.; Andersen, M.S.; Robinson, J.T.; Pochet, N.; Neuberg, D.; Gertner, R.S.; et al. Nanowire-Mediated Delivery Enables Functional Interrogation of Primary Immune Cells: Application to the Analysis of Chronic Lymphocytic Leukemia. Nano Lett. 2012, 12, 6498–6504. [Google Scholar] [CrossRef] [PubMed]
- Sulatskaya, A.I.; Lavysh, A.V.; Maskevich, A.A.; Kuznetsova, I.M.; Turoverov, K.K. Thioflavin T fluoresces as excimer in highly concentrated aqueous solutions and as monomer being incorporated in amyloid fibrils. Sci. Rep. 2017, 7, 2146. [Google Scholar] [CrossRef]
- van Gerresheim, E.F.; Herring, A.; Gremer, L.; Müller-Schiffmann, A.; Keyvani, K.; Korth, C. The interaction of insoluble Amyloid-β with soluble Amyloid-β dimers decreases Amyloid-β plaque numbers. Neuropathol. Appl. Neurobiol. 2021, 47, 603–610. [Google Scholar] [CrossRef]
- Faridi, A.; Sun, Y.; Okazaki, Y.; Peng, G.; Gao, J.; Kakinen, A.; Faridi, P.; Zhao, M.; Javed, I.; Purcell, A.W.; et al. Mitigating Human IAPP Amyloidogenesis In Vivo with Chiral Silica Nanoribbons. Small 2018, 14, e1802825. [Google Scholar] [CrossRef]
- Zhou, W.; Dai, X.C.; Fu, T.M.; Xie, C.; Liu, J.; Lieber, C.M. Long Term Stability of Nanowire Nanoelectronics in Physiological Environments. Nano Lett. 2014, 14, 1614–1619. [Google Scholar] [CrossRef] [PubMed]
- Zörgiebel, F.; Pregl, S.; Römhildt, L.; Opitz, J.; Weber, W.; Mikolajick, T.; Baraban, L.; Cuniberti, G. Schottky barrier-based silicon nanowire pH sensor with live sensitivity control. Nano Res. 2014, 7, 263–271. [Google Scholar] [CrossRef]
- Lin, S.Y.; Chu, H.L. Fourier transform infrared spectroscopy used to evidence the prevention of β-sheet formation of amyloid β(1-40) peptide by a short amyloid fragment. Int. J. Biol. Macromol. 2003, 32, 173–177. [Google Scholar] [CrossRef] [PubMed]
- Sarroukh, R.; Goormaghtigh, E.; Ruysschaert, J.M.; Raussens, V. ATR-FTIR: A “rejuvenated” tool to investigate amyloid proteins. Biochim. Et Biophys. Acta-Biomembr. 2013, 1828, 2328–2338. [Google Scholar] [CrossRef] [PubMed]
- Allen, J.E.; Hemesath, E.R.; Perea, D.E.; Lensch-Falk, J.L.; Li, Z.Y.; Yin, F.; Gass, M.H.; Wang, P.; Bleloch, A.L.; Palmer, R.E.; et al. High-resolution detection of Au catalyst atoms in Si nanowires. Nat. Nanotechnol. 2008, 3, 168–173. [Google Scholar] [CrossRef] [PubMed]
- Shen, Y.; Zhao, X.C.; Gong, R.L.; Ngo, E.; Maurice, J.L.; Cabarrocas, P.R.I.; Chen, W.H. Influence of the Electron Beam and the Choice of Heating Membrane on the Evolution of Si Nanowires’ Morphology in In Situ TEM. Materials 2022, 15, 5244. [Google Scholar] [CrossRef] [PubMed]
- Xiang, S.; Liu, F.; Lin, J.; Chen, H.; Huang, C.; Chen, L.; Zhou, Y.; Ye, L.; Zhang, K.; Jin, J.; et al. Fucoxanthin Inhibits β-Amyloid Assembly and Attenuates β-Amyloid Oligomer-Induced Cognitive Impairments. J. Agric. Food Chem. 2017, 65, 4092–4102. [Google Scholar] [CrossRef] [PubMed]
- Solntseva, E.I.; Bukanova, J.V. Use-dependent inhibition of glycine-activated chloride current in rat neurons by β-amyloid peptide pretreated with hexafluoroisopropanol. NeuroReport 2017, 28, 579–583. [Google Scholar] [CrossRef] [PubMed]
- Huang, C.; Xu, D.; Zhang, K.; Shentu, J.; Yan, S.; Wu, D.; Wang, Q.; Cui, W. A11-positive β-amyloid Oligomer Preparation and Assessment Using Dot Blotting Analysis. J. Vis. Exp. 2018, 135, e57592. [Google Scholar]


Disclaimer/Publisher’s Note: The statements, opinions and data contained in all publications are solely those of the individual author(s) and contributor(s) and not of MDPI and/or the editor(s). MDPI and/or the editor(s) disclaim responsibility for any injury to people or property resulting from any ideas, methods, instructions or products referred to in the content. |
© 2024 by the authors. Licensee MDPI, Basel, Switzerland. This article is an open access article distributed under the terms and conditions of the Creative Commons Attribution (CC BY) license (https://creativecommons.org/licenses/by/4.0/).
Share and Cite
Zhao, X.; Mou, C.; Xu, J.; Cui, W.; Shi, Y.; Wang, Y.; Luo, T.; Guo, W.; Ye, J.; Chen, W. Protection of Si Nanowires against Aβ Toxicity by the Inhibition of Aβ Aggregation. Molecules 2024, 29, 1980. https://0-doi-org.brum.beds.ac.uk/10.3390/molecules29091980
Zhao X, Mou C, Xu J, Cui W, Shi Y, Wang Y, Luo T, Guo W, Ye J, Chen W. Protection of Si Nanowires against Aβ Toxicity by the Inhibition of Aβ Aggregation. Molecules. 2024; 29(9):1980. https://0-doi-org.brum.beds.ac.uk/10.3390/molecules29091980
Chicago/Turabian StyleZhao, Xuechun, Chenye Mou, Jiayi Xu, Wei Cui, Yijing Shi, Yangzhe Wang, Tian Luo, Wei Guo, Jichun Ye, and Wanghua Chen. 2024. "Protection of Si Nanowires against Aβ Toxicity by the Inhibition of Aβ Aggregation" Molecules 29, no. 9: 1980. https://0-doi-org.brum.beds.ac.uk/10.3390/molecules29091980