Article

Sensitive Silver-Enhanced Microplate Apta-Enzyme Assay of Sb3+ Ions in Drinking and Natural Waters

by
Nadezhda S. Komova
,
Kseniya V. Serebrennikova
,
Anna N. Berlina
*,
Anatoly V. Zherdev
and
Boris B. Dzantiev
A.N. Bach Institute of Biochemistry, Research Center of Biotechnology of the Russian Academy of Sciences, Leninsky Prospect 33, 119071 Moscow, Russia
*
Author to whom correspondence should be addressed.
Submission received: 1 September 2023 / Revised: 5 October 2023 / Accepted: 6 October 2023 / Published: 7 October 2023
(This article belongs to the Special Issue The Development and Applications of Aptamers)

Abstract

:
The toxic effects of antimony pose risks to human health. Therefore, simple analytical techniques for its widescale monitoring in water sources are in demand. In this study, a sensitive microplate apta-enzyme assay for Sb3+ detection was developed. The biotinylated aptamer A10 was hybridized with its complementary biotinylated oligonucleotide T10 and then immobilized on the surface of polysterene microplate wells. Streptavidin labeled with horseradish peroxidase (HRP) bound to the biotin of a complementary complex and transformed the 3,3′,5,5′-tetramethylbenzidine substrate, generating an optical signal. Sb3+ presenting in the sample bounded to an A10 aptamer, thus releasing T10, preventing streptavidin-HRP binding and, as a result, reducing the optical signal. This effect allowed for the detection of Sb3+ with a working range from 0.09 to 2.3 µg/mL and detection limit of 42 ng/mL. It was established that the presence of Ag+ at the stage of A10/T10 complex formation promoted dehybridization of the aptamer A10 and the formation of the A10/Sb3+ complex. The working range of the Ag+-enhanced microplate apta-enzyme assay for Sb3+ was determined to be 8–135 ng/mL, with a detection limit of 1.9 ng/mL. The proposed enhanced approach demonstrated excellent selectivity against other cations/anions, and its practical applicability was confirmed through an analysis of drinking and spring water samples with recoveries of Sb3+ in the range of 109.0–126.2% and 99.6–106.1%, respectively.

Graphical Abstract

1. Introduction

At present, environmental pollution by heavy metals and metalloids is an extremely important problem. Antimony, as one of most dangerous pollutants of the biosphere, poses a significant problem due to its contamination of the environment, especially water bodies [1]. Antimony has trivalent and pentavalent states; however, the toxicity and poisonousness of Sb(III) is much higher [2]. The main sources of antimony causing its widespread pollution are the production of semiconductors and batteries, textiles, glass and ceramics and the action of coal-fired power plants and metal mining enterprises [3]. Another way Sb3+ enters into the human body is its release from polyethylene terephthalate packages, whose production requires antimony (III) oxide [4,5]. Upon entry to the human body through the respiratory tract, skin contact or the food chain, antimony degrades protein and carbohydrate metabolism and damages the liver, heart and nervous system [6], which confirms the demand for monitoring drinking water to assess the content of heavy metal ions [7], in particular antimony. In this regard, the maximum permissible concentration of total antimony in drinking water is 6 ng/mL, as established by the U.S. Environmental Protection Agency (EPA) [8], but the World Health Organization set the maximum permissible level of antimony in drinking water at 20 ng/mL [9].
The analytical techniques used for Sb3+ detection are atomic absorption spectrometry [10], inductively coupled plasma with mass spectrometry [11,12] and electrochemical analysis [13]. Although these methods are characterized by high sensitivity and selectivity, the need for expensive sophisticated equipment and long-term preparation of samples restricts their application. Therefore, simple and sensitive techniques for Sb3+ detection are an important area of development.
Currently, colorimetric methods deserve special attention as they offer a visual assessment of color change, allowing an easy readout of analytical signals. Colorimetric techniques for Sb3+ detection using indicator dyes [14,15,16] and nanoparticles [17,18,19] were developed. The application of dyes such as bis [2-(5-chloro-2-pyridylazo)-5-diethylaminophenolato]cobalt(III), bromopyrogallol red and pyrene causes the formation of complexes with Sb3+ and is followed by photo- or fluorometric detection. However, despite the simplicity and cost-effectiveness of these methods, they have insufficient selectivity and reproducibility and cannot ensure the detection of Sb3+ concentrations at the MPC level. Nanoparticle-based colorimetric methods are more usable, but they are sensitive to interfering components of matrixes [20]. Alternatively, the colorimetric method based on aptamers, due to their unique properties, can significantly expand the possibilities of determining heavy metal ions. Aptamers are short single-stranded oligonucleotides that are characterized by high affinity and specificity for their specific analytes, and their low production cost makes aptamers relevant analytical reagents [21,22]. Aptamer-based assays have confirmed effectiveness for the detection of heavy metal ions, as summarized in the reviews [23,24].
In particular, a homogeneous colorimetric technique for the detection of Sb3+ based on the aggregation of aptamer-modified gold nanoparticles, accompanied by a rapid color transition from pink to blue, was developed [19]. Aptamer A10 was used as the receptor molecule, forming a complex with Sb3+ due to interaction with hydroxyl groups of adenine residues [25,26]. However, the detection limit of this assay was 10 ng/mL, which does not reach the established MPC levels. In this regard, an important and urgent task is to find new and better analysis formats that provide the required level of detectable concentrations. One such method is a simple microplate format of an assay for highly sensitive determination. Some microplate methods using aptamers and nanozymes have been previously reported and developed for the determination of various analytes [27,28]. The application of aptamers in these methods provides high specificity and reproducibility, as well as excellent storage stability, and the use of nanozymes allows for increased assay sensitivity. Thus, these advantages have been used to develop approaches for the analysis of the commonest heavy metal ions [29,30,31]. Several microplate colorimetric aptamer-based methods have been developed, including one for the detection of cadmium using gold-nanoparticle-modified MoS2 [29] and one for detecting lead ions, involving graphene/Fe3O4-AuNP composites and the recognition element [31], and rolling circle amplification as a signal amplifier has been proposed for mercury ion detection [30]. However, to the best of our knowledge, the creation of a microplate aptamer-based assay for the determination of Sb3+ ions has not previously been reported.
In this study, a microplate apta-enzyme assay for Sb3+ detection with a low detection limit is reported for the first time. The proposed microplate method is based on the destruction of a complex of complementary aptamers due to the affinity of aptamer A10 toward antimony ions. Compared with the nanozyme-based approaches described above, this assay is implemented using simple and readily available materials and combines the widely used horseradish peroxidase as a label and specific aptamer recognition. To reach high sensitivity, the assay conditions were varied, including the amount of immobilized biotinylated complementary complex, concentration of streptavidin and incubation time. In addition, the effect of Ag+ on the analytical performance of Sb3+ detection was investigated. The ability of the developed assay to selectively distinguish Sb3+ from other cations and anions and its practical applicability for drinking and spring water sample testing were studied.

2. Results and Discussion

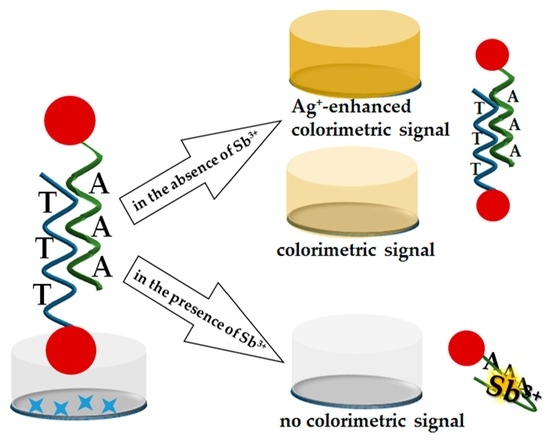
2.1. Principle of Sb3+ Detection

The scheme of the designed microplate apta-enzyme assay using Sb3+-specific aptamer A10 and complementary oligonucleotide T10 is shown on Figure 1. In this assay, the aptamer A10 and complementary T10 oligonucleotide, both biotinylated at the 5′ end, were used. Firstly, streptavidin was adsorbed in the microplate wells (Figure 1, 1), and then the preliminary formed complementary biotinylated A10/T10 complex was immobilized (Figure 1, 2) through high-affinity biotin–streptavidin interaction. The binding of the A10/T10 complex to the immobilized streptavidin was made possible by the biotinylated end of A10 or T10, and both variants stored the Sb3+ binding ability of the A10 aptamer. Next, incubation with HRP-streptavidin (Figure 1, 4) led to its binding to the free biotin of the A10/T10 complex. At the next stage, the addition of TMB substrate promoted the development of blue color (Figure 1, 5), which turned yellow after stopping the reaction with sulfuric acid (Figure 1, 6).
The presence of Sb3+ led to a switching of the A10 aptamer structure, resulting in the formation of the A10/Sb3+ complex. At the same time, the bonds of the immobilized A10/T10 complex were broken [19,25]. In the case of immobilization of the A10/T10 complex via the biotinylated end of T10, the resulting A10/Sb3+ complex was removed after washing the microplate. If the A10/T10 complex was immobilized via the biotinylated end of A10, the formed A10/Sb3+ complex remained on the microplate, and T10 was removed during washing. In both cases, washing the microplates reduced the number of HRP-streptavidin binding sites, causing a decrease in the following transformation of the TMB substrate and the registered intensity of the blue color.

2.2. Characterization of the Apta-Assay Components via CD Spectroscopy

The CD spectrum of the aptamer A10 had a large positive peak at 270 nm and a negative minimum at 248 nm (Figure 2a, black line), which is consistent with previous findings [32,33]. Thus, the conformation of the single-stranded oligonucleotide was characterized by a large positive band in the range of 260–270 nm due to base stacking and a negative band at 240 nm due to polynucleotide helicity [34,35]. The CD spectrum of the oligonucleotide T10 had a positive peak near 275 nm and a less intense band at 227 nm (Figure 2a, red line). The positive peaks at 282 and 260 nm and a negative peak at 247 nm (Figure 2a, blue line) confirmed the formation of the A10/T10 complex, which accords with the spectrum of the B-form conformation of the double-stranded oligonucleotide [36]. To confirm the formation of the A10/Sb3+ complex, the spectra of the A10 aptamer (Figure 2b), the T10 oligonucleotide (Figure 2d) and the A10/T10 complex (Figure 2c) with Sb3+ were recorded. The intensity of the positive band at 218 nm decreased after the addition of Sb3+ to the A10 aptamer, and the intensity of the band at 275 nm increased significantly (Figure 2b), similarly to the change in the CD spectrum for the A10/T10 complex with Sb3+ (Figure 2c). The interaction of Sb3+ with the T10 oligonucleotide was not associated with spectral changes (Figure 2d). The results of CD spectroscopy confirm the feasibility of the proposed assay and demonstrate its applicability for the detection of Sb3+.

2.3. Optimization of the Microplate Apta-Enzyme Assay Conditions

To optimize the conditions of the microplate apta-enzyme assay for sensitive Sb3+ detection, the concentrations of streptavidin and the A10/T10 complex as well as incubation time were varied. First, the effect of the concentration of the A10/T10 complex on the analytical signal in the absence of Sb3+ was investigated. According to Figure 3a, as the concentration of the A10/T10 complex increased up to 5 µg/mL, the optical density at 450 nm (OD450) gradually grew. After this, OD450 no longer increased, which indicates the saturation value for the A10/T10 complex. Therefore, 5 μg/mL was chosen as the optimal concentration of the A10/T10 complex. In addition, consistent immobilization of the biotinylated A10 aptamer (2.5 μg/mL) and biotinylated T10 oligonucleotide (2.5 μg/mL) to assemble the A10/T10 complex into the microplate wells was tested. However, it was found that the immobilization of the pre-formed complex showed better binding of A10/T10 and reduced analysis time due to the absence of an additional step.
At the next stage, the effect of the concentration of streptavidin, which provides the required number of binding sites for the A10/T10 complex, was investigated (Figure 3b). The streptavidin concentration of 5 μg/mL showed the highest difference between OD450 values in the absence of Sb3+ and in its presence at a fixed concentration, 10 µg/mL. The ΔOD450 data for a concentration of 5 μg/mL were compared with the data for 1 and 10 μg/mL using Student’s t-test, which confirmed the significance of differences (p < 0.05). In addition, the comparison of detection limits of Sb3+ showed the lowest value (42 ng/mL) for 5 μg/mL immobilized streptavidin, which was chosen as the optimal concentration.
Finally, the incubation time of Sb3+ solutions was studied, which influenced the disruption of the A10/T10 complex and the formation of the A10/Sb3+ complex. The OD450 reached a plateau at 45 min, and this value was selected as an optimal time for incubation of the Sb3+ solution.
As a result, the optimal conditions for the microplate apta-enzyme assay were defined as follows: 5 μg/mL streptavidin, 5 μg/mL A10/T10 complex and 45 min of incubation time for Sb3+.

2.4. Analytical Performance of the Microplate Apta-Enzyme Assay of Sb3+

Under the optimal conditions, solutions with different concentrations of Sb3+ were tested (Figure 4a). The color intensity reached the maximum in the absence of Sb3+, and the color of solution was bright yellow. With an increase in the concentration of Sb3+, the intensity of the color weakened accordingly. However, the presence of a background signal, even at high concentrations of Sb3+, was observed, which is possibly due to the nonspecific effect of the biotinylated T10 oligonucleotide remaining on the microplate wells. The optical densities at 450 nm in response to Sb3+ concentrations varying from 0.5 ng/mL to 10 µg/mL are shown in Figure 4a. A linear relationship (Figure 4b) between the OD450 value and the logarithmic concentrations of Sb3+ was acquired, which corresponded to 40–10,000 ng/mL with a correlation coefficient R2 = 0.9906. The detection limit was calculated as the blank signal (in the absence of Sb3+) minus 3σ (where σ is the standard deviation of the signal) and determined to be 42 ng/mL, which is higher than the MPCs recommended for drinking water.

2.5. Ag+-Enhanced Microplate Apta-Enzyme Assay for Sb3+ Detection

Since the obtained detection limit did not reach the maximum permissible concentration for Sb3+ in drinking water, the other metal ions were considered as enhancing agents to provide high sensitivity. It is known that the introduction of metal ions into duplexes of oligonucleotides leads to new properties of the formed metal–aptamer systems. Thus, it was found that the addition of Ag+ ions to the A10/T10 complex led to the formation of a metallo-DNA system without changes in the canonical hybridization of the Watson–Crick duplex [37]. At the same time, the affinity of adenine–thymine binding was reduced [38], which thereby promoted the dehybridization of the A10 aptamer and more efficient formation of the A10/Sb3+ complex.
First, the effect of Ag+ and Sb3+ on the catalytic activity of horseradish peroxidase was tested to exclude artifacts that may change the assay results. The absence of the inhibition of this process in the presence of these metal ions was shown. To determine the optimal amount of Ag+, the addition of different concentrations of Ag+ was tested and detection limits of Sb3+ were calculated (Figure 5). The most pronounced increase in the detection limit of Sb3+ was observed at a Ag+ concentration of 10 µg/mL, which was chosen as the optimal concentration of the enhancing agent. The significance of the increase in the analytical signal at a concentration of 10 μg/mL was compared with the values at 5 and 20 μg/mL using Student’s t-test, which confirmed the significance of the deviation (p < 0.05).
The calibration curve for the Ag+-enhanced microplate apta-enzyme assay was plotted in the range of 0.5 ng/mL–10 µg/mL (Figure 6a). A linear relationship (Figure 6b) between OD450 and the logarithmic concentrations of Sb3+ was acquired, which corresponded to 13.7–1111 ng/mL and was regressed to y = 0.22 − 0.058x (R2 = 0.9822).The detection limit for the enhanced assay was determined to be 1.9 ng/mL, which is 22 times lower than that of the previous variant. In addition, the achieved detection limit turned out to be 3–10 times lower than the recommended values of MPC for drinking water established by international organizations.

2.6. Selectivity of Ag+-Enhanced Microplate Apta-Enzyme Assay

The selectivity of the Ag+-enhanced microplate apta-enzyme assay of Sb3+ was investigated. The target ion was compared with other toxic cations, such as Pb2+, Hg2+, Cd2+, Cu2+, Zn2+, As3+, Ni2+, Co2+, Cr3+, Sn4 and Mo2+. In addition, cations (Ca2+, Na+, Mg2+) and anions (Cl, NO3−, SO42−) presenting in high amounts in water were tested using the developed assay. As follows from Figure 7, the results show that most of the ions tested did not have a noticeable effect on the determination of Sb3+. However, insignificant nonspecific changes were observed in the presence of Ni2+, Sn4+ and Mo2+ ions, which may have an effect on the determination of Sb3+ ions. The effect of these ions was observed at 0.1 μg/mL, while the allowable concentration of nickel and molybdenum ions in drinking water is 0.07 and 0.01 μg/mL, respectively. In the case of Sn4+, its presence in this form is practically impossible and, in addition, the Sn4+ content in drinking water is not standardized. Thus, the proposed system showed satisfactory selectivity with respect to antimony ions.

2.7. Water Sample Analysis

The effectiveness of the developed Ag+-enhanced assay was studied via analysis of drinking and spring water samples. Since the results of the standard ICP-MS reference method do not show the presence of the analyte, the water samples were spiked with different concentrations of Sb3+. The calculated analytical recoveries were within acceptable ranges of 109–126% and 99.6–112% for drinking and spring water, respectively (Table 1), which is consistent with published results for the determination of heavy metals in analytical practice [39,40,41]. Thus, the development of a colorimetric assay [41] based on the regulation of the oxidase-mimicking activity of Mn3O4 nanoparticles by oligonucleotides for mercury and cadmium ions in actual environmental water samples achieved a detection rate in the range of 85.7 to 105.21% for mercury ions and 81.7 to 113.4% for cadmium ions. The work [40] demonstrates a mean recovery of samples in the range of 94.6–124% via an ultrasensitive aptamer-based biosensor for arsenic(III) detection. Thus, the results indicate the potential application of the Ag+-enhanced microplate apta-enzyme assay for Sb3+ detection in water samples.

2.8. Comparison with Other Methods

The comparison of different methods for Sb3+ detection in Table 2 demonstrates the advantages of the developed Ag+-enhanced microplate apta-enzyme assay in relation to both instrumental and colorimetric methods. The LOD of the proposed method (1.9 ng/mL) is comparable to that of flame atomic absorption (emission) spectrometry [42,43], inductively coupled plasma mass spectrometry [12,44], excimer fluorescence [16] and surface-enhanced Raman scattering [45,46], which require the use of expensive equipment. In addition, the proposed method demonstrates more advantageous sensitivity compared to the very small number of low-tech methods available for the determination of Sb3+ [19,47].

3. Materials and Methods

3.1. Chemicals and Materials

The aptamer 5′-biotin-AA-AAA-AAA-AA-3′ (A10) and the complementary oligonucleotide 5′-biotin-TT-TTT-TTT-TT-3′ (T10) were synthesized by Syntol (Moscow, Russia). Aqueous solutions of Sb3+, Ag+, Hg2+, Pb2+, Cd2+, Cu2+, Zn2+, As3+, Ni2+, Co2+, Cr3+, Sn4+, Mo2+, Cl- and SO42- were purchased from the Center of Standardization of Samples and High-Purity Substances (Saint Petersburg, Russia). The streptavidin and horseradish-peroxidase-labeled streptavidin (HRP-Streptavidin) were from IMTEK (Moscow, Russia). The bovine serum albumin and Tween-20 were obtained from Sigma-Aldrich (St. Louis, MO, USA). The 3,3′,5,5′-tetramethyl benzidine (TMB), sulfuric acid and salts for buffer solutions were purchased from Chimmed (Moscow, Russia). All solutions were prepared using the Simplicity Water Purification System from Millipore (Bedford, MA, USA). The 96-well transparent polystyrene high bind 9018 plates were obtained from Corning Costar (Corning, NY, USA).

3.2. Formation of A10/T10 and A10/Ag+/T10 Complexes

The biotinylated A10 aptamer and T10 oligonucleotide were dissolved at the final concentration of 5 µg/mL in 20 mM Tris-HCl buffer containing 150 mM NaCl, 1 mM MgCl2 and 1 mM CaCl2. To form a complementary aptamer complex, the reaction mixture was heated at 95 °C for 5 min and kept at room temperature (RT) for 15 min.
To obtain the A10/Ag+/T10 complex, Ag+ solution at the final concentration of 10 µg/mL was added to the mixture of A10 aptamer and T10 oligonucleotide (2.5 µg/mL for both compounds) in the same buffer solution, followed by heating at 95 °C for 5 min and cooling to RT for 15 min.

3.3. Circular Dichroism Measurement

Circular dichroism (CD) spectra were recorded using the CD spectrometer Chirascan from Applied Photophysics (Leatherhead, UK). The CD spectra were collected at RT in the range of 200–320 nm with 3 repetitions. The investigated aptamer and the complementary complex were preliminary prepared in 20 mM Tris-HCl buffer containing 150 mM NaCl, 1 mM MgCl2 and 1 mM CaCl2, annealed at 95 °C for 5 min and cooled down to RT.

3.4. Microplate Apta-Enzyme Assay

A total of 100 μL of streptavidin at a concentration of 5.0 μg/mL in 50 mM phosphate-buffered saline, pH 7.4 (PBS), was applied to the wells of the microplate and incubated overnight at 4 °C. Then, the microplate was washed three times with 10 mM PBS containing 0.05% detergent Tween-20 (PBST). The microplate wells were covered with 150 μL of 1% BSA (blocking buffer) prepared in 50 mM PBS for 30 min at 37 °C in a thermostat TC-1/80 (Russia). After three washes with PBST, 100 μL of freshly prepared A10/T10 complementary complex, 5 µg/mL in 20 mM Tris-HCl buffer, pH 7.6, was added in the wells. The microplates were incubated for 1 h at 37 °C and then washed with PBST three times. At the next stage, 100 μL of solutions containing different concentrations of Sb3+ were added into the wells. After 1 h of incubation at 37 °C and triple washing, 100 μL of horseradish-peroxidase-labeled streptavidin (1:5000 dilution in PBST) was added to the wells and incubated again for 1 h at 37 °C. The unbound HRP-labeled streptavidin was removed and washed three times with PBST and once with distilled water. The final steps were the addition of 100 mL of TMB substrate solution and incubation for 15 min at RT. The catalytic reaction was stopped by the addition of 50 μL of 1 M H2SO4 per well. Then, the optical density at 450 nm as a colored product of peroxidase-induced oxidation of TMB was measured using an EnSpire multimode plate reader from PerkinElmer (USA). The plotting of (optical density—Sb3+ concentration) dependence was carried out using Origin 9 software (OriginLab Corporation, Northampton, MA, USA).
The Ag+-enhanced microplate apta-enzyme assay was carried out using the A10/Ag+/T10 complex, as described above.

3.5. Preparation and Analysis of Water Samples

Samples of drinking and spring water with the pH adjusted to 8.5 were filtered through a syringe filter with a pore size of 0.2 µm (Sartorius, Germany). According to ICP-MS data (quadrupole mass spectrometer Nexion 300D, Perkin Elmer (Waltham, MA, USA)), the used water samples were reliably free of Sb3+. The method’s description is provided in [49]. The results of the water analysis using the ICP-MS technique have been published in our previous works on heavy metal detection; see supplementary information in [49,50]. A series of Sb3+-spiked water samples were prepared at concentrations of 10, 50 and 100 ng/mL with the addition of a Sb3+ standard solution (0.1 mg/mL in the Milli-Q water). Then, spiked water samples were analyzed with the developed microplate apta-enzyme assay.

4. Conclusions

A sensitive microplate apta-enzyme assay for Sb3+ detection was proposed for the first time. The main principle of this approach is based on the formation of a specific complex of the A10 aptamer with Sb3+, leading to a reduction in the recorded transformation of the TMB substrate. It was found that Ag+ promoted dehybridization of the A10 complex of the complementary oligonucleotide and the formation of the A10/Sb3+ complex. Under optimized conditions, the results show that the analytical performance was enhanced by up to 22 times in the presence of Ag+. The achieved detection limit, 1.9 ng/mL, is 3–10 times lower than the established MPC values. The main benefits of the developed assay are its (i) low detection limit; (ii) cost-efficiency and (iii) simplicity. Additionally, this assay relies on available materials, such as conjugates of streptavidin with horseradish peroxidase and combinations of biotinylated aptamers. Finally, the proposed assay was applied in spiked drinking water samples with satisfactory results.

Author Contributions

Conceptualization, N.S.K.; validation, A.N.B.; formal analysis, N.S.K. and K.V.S.; investigation, N.S.K.; resources, A.N.B.; writing—original draft preparation, N.S.K. and K.V.S.; writing—review and editing, N.S.K., K.V.S., A.N.B., A.V.Z. and B.B.D.; visualization, N.S.K.; supervision, A.V.Z. and B.B.D.; project administration, A.V.Z. and B.B.D.; funding acquisition, N.S.K. and B.B.D. All authors have read and agreed to the published version of the manuscript.

Funding

This work was financially supported by the Russian Science Foundation (grant № 22-23-00859).

Institutional Review Board Statement

Not applicable.

Informed Consent Statement

Not applicable.

Data Availability Statement

The data that support the findings of this study are available from the corresponding author upon request.

Acknowledgments

The measurements were carried out with equipment from the Shared-Access Equipment Center “Industrial Biotechnologies” of the Federal Research Center “Fundamentals of Biotechnology”, Russian Academy of Sciences.

Conflicts of Interest

The authors declare no conflict of interest.

Sample Availability

Not applicable.

References

  1. He, M.; Wang, N.; Long, X.; Zhang, C.; Ma, C.; Zhong, Q.; Wang, A.; Wang, Y.; Pervaiz, A.; Shan, J. Antimony speciation in the environment: Recent advances in understanding the biogeochemical processes and ecological effects. J. Environ. Sci. 2019, 75, 14–39. [Google Scholar] [CrossRef]
  2. Periferakis, A.; Caruntu, A.; Periferakis, A.-T.; Scheau, A.-E.; Badarau, I.A.; Caruntu, C.; Scheau, C. Availability, toxicology and medical significance of antimony. Int. J. Environ. Res. Public Health 2022, 19, 4669. [Google Scholar] [CrossRef] [PubMed]
  3. Zhang, Y.; Ding, C.; Gong, D.; Deng, Y.; Huang, Y.; Zheng, J.; Xiong, S.; Tang, R.; Wang, Y.; Su, L. A review of the environmental chemical behavior, detection and treatment of antimony. Environ. Technol. Innov. 2021, 24, 102026. [Google Scholar] [CrossRef]
  4. Westerhoff, P.; Prapaipong, P.; Shock, E.; Hillaireau, A. Antimony leaching from polyethylene terephthalate (PET) plastic used for bottled drinking water. Water Res. 2008, 42, 551–556. [Google Scholar] [CrossRef]
  5. Koyuncu, M.; Alwazeer, D. Determination of trace elements, heavy metals, and antimony in polyethylene terephthalate–bottled local raw cow milk of Iğdır region in Turkey. Environ. Monit. Assess. 2019, 191, 666. [Google Scholar] [CrossRef]
  6. Bolan, N.; Kumar, M.; Singh, E.; Kumar, A.; Singh, L.; Kumar, S.; Keerthanan, S.; Hoang, S.A.; El-Naggar, A.; Vithanage, M.; et al. Antimony contamination and its risk management in complex environmental settings: A review. Environ. Int. 2022, 158, 106908. [Google Scholar] [CrossRef]
  7. Wang, Z.; Luo, P.; Zha, X.; Xu, C.; Kang, S.; Zhou, M.; Nover, D.; Wang, Y. Overview assessment of risk evaluation and treatment technologies for heavy metal pollution of water and soil. J. Clean. Prod. 2022, 379, 134043. [Google Scholar] [CrossRef]
  8. World Health Organization. Guidelines for Drinking-Water Quality, 4th ed.; World Health Organization: Geneva, Switzerland, 2011. [Google Scholar]
  9. US EPA. National Primary Drinking Water Regulations; US EPA: Washington, DC, USA, 2009. [Google Scholar]
  10. Masac, J.; Machynak, L.; Lovic, J.; Beinrohr, E.; Cacho, F. On-line electrochemical preconcentration and electrochemical hydride generation for determination of antimony by high-resolution continuum source atomic absorption spectrometry. Talanta 2021, 223, 121767. [Google Scholar] [CrossRef]
  11. Li, P.; Chen, Y.-J.; Hu, X.; Lian, H.-Z. Magnetic solid phase extraction for the determination of trace antimony species in water by inductively coupled plasma mass spectrometry. Talanta 2015, 134, 292–297. [Google Scholar] [CrossRef]
  12. Dong, L.; Wang, W.; Ning, Y.; Deng, X.; Gao, Y. Detection of trace antimony by vanadium (IV) ion assisted photochemical vapor generation with inductively coupled plasma mass spectrometry measurement. Anal. Chim. Acta 2023, 1251, 341006. [Google Scholar] [CrossRef]
  13. Hamza, A.; Alsaggaf, W.T.; Ahmad, W.; El-Shahawi, M.S. A highly selective electrochemical sensor for trace determination and speciation of antimony (III & V) in water and soil samples using 2-thenoyltrifluoroacetone. Chem. Pap. 2020, 74, 2917–2927. [Google Scholar] [CrossRef]
  14. Mizuguchi, H.; Matsuda, Y.; Mori, T.; Uehara, A.; Ishikawa, Y.; Endo, M.; Shida, J. Visual Colorimetry For Trace Antimony(V) by Ion-Pair Solid-Phase Extraction with Bis[2-(5-Chloro-2-Pyridylazo)-5-Diethylaminophenolato]cobalt(III) on a PTFE Type Membrane Filter. Anal. Sci. 2008, 24, 219–223. [Google Scholar] [CrossRef] [PubMed]
  15. Rath, S.; Jardim, W.F.; Dórea, J.G. A simple spectrophotometric procedure for the determination of antimony (III) and (V) in antileishmanial drugs. Fresenius’ J. Anal. Chem. 1997, 358, 548–550. [Google Scholar] [CrossRef]
  16. Wang, Y.; Huang, Y.; Wang, L.; Ni, H.; Cao, Z.; Wu, M. A pyrene-based probe for antimony with special excimer fluorescence. Z. Für Anorg. Und Allg. Chem. 2020, 646, 1303–1308. [Google Scholar] [CrossRef]
  17. Tolessa, T.; Tan, Z.-Q.; Liu, J.-F. Hydride generation coupled with thioglycolic acid coated gold nanoparticles as simple and sensitive headspace colorimetric assay for visual detection of Sb(III). Anal. Chim. Acta 2018, 1004, 67–73. [Google Scholar] [CrossRef]
  18. Refera, B.; Bekana, D.; Temesgen, A.; Teju, E.; Jabessa, A. Bioinspired gold nanoparticles-based colorimetric nanosensor for detection of antimony in plastic bottled water. Res. Chem. Intermed. 2023, 49, 3227–3244. [Google Scholar] [CrossRef]
  19. Berlina, A.N.; Komova, N.S.; Zherdev, A.V.; Gaur, M.S.; Dzantiev, B.B. Colorimetric technique for antimony detection based on the use of gold nanoparticles conjugated with poly-A oligonucleotide. Appl. Sci. 2019, 9, 4782. [Google Scholar] [CrossRef]
  20. Bilge, S.; Karadurmus, L.; Sınağ, A.; Ozkan, S.A. Green synthesis and characterization of carbon-based materials for sensitive detection of heavy metal ions. TrAC Trends Anal. Chem. 2021, 145, 116473. [Google Scholar] [CrossRef]
  21. Qi, X.; Yan, X.; Zhao, Y.; Li, L.; Wang, S. Highly sensitive and specific detection of small molecules using advanced aptasensors based on split aptamers: A review. TrAC Trends Anal. Chem. 2020, 133, 116069. [Google Scholar] [CrossRef]
  22. Kumar Kulabhusan, P.; Hussain, B.; Yüce, M. Current Perspectives On Aptamers As Diagnostic Tools And Therapeutic Agents. Pharmaceutics 2020, 12, 646. [Google Scholar] [CrossRef]
  23. Shin, W.-R.; Ahn, G.; Lee, J.-P.; Oh, I.-H.; Ahn, J.-Y.; Kim, Y.-H.; Chae, S. Recent Advances in Engineering Aptamer-based Sensing and Recovery of Heavy Metals and Rare Earth Elements for Environmental Sustainability. Chem. Eng. J. 2023, 472, 144742. [Google Scholar] [CrossRef]
  24. Khoshbin, Z.; Rouhi, N.; Abnous, K.; Taghdisi, S.M.; Verdian, A. Chapter 5—Aptamer-based analysis of heavy metal ions. In Aptamers for Food Applications; Dong, Y., Ed.; Academic Press: Cambridge, MA, USA, 2023; pp. 127–137. [Google Scholar]
  25. Li, Y.; Liu, J.-M.; Han, F.; Jiang, Y.; Yan, X.-P. Probing interactions of antimony species with DNA by short column capillary electrophoresis coupled with inductively coupled plasma mass spectrometry. J. Anal. At. Spectrom. 2011, 26, 94–99. [Google Scholar] [CrossRef]
  26. Zhakenovich, A.Y.; Valentina, Y.; Ruben, S.; Spataru, T.; Bykov, A. Synthesis and X-ray study the complexes of ATP with Sb (III) and Bi (III). J. Chem 2016, 10, 195–197. [Google Scholar] [CrossRef]
  27. Sheng, Y.-M.; Liang, J.; Xie, J. Indirect competitive determination of tetracycline residue in honey using an ultrasensitive gold-nanoparticle-linked aptamer assay. Molecules 2020, 25, 2144. [Google Scholar] [CrossRef]
  28. Xie, J.; Tang, M.-Q.; Chen, J.; Zhu, Y.-H.; Lei, C.-B.; He, H.-W.; Xu, X.-H. A sandwich ELISA-like detection of C-reactive protein in blood by citicoline-bovine serum albumin conjugate and aptamer-functionalized gold nanoparticles nanozyme. Talanta 2020, 217, 121070. [Google Scholar] [CrossRef]
  29. Tao, Z.; Wei, L.; Wu, S.; Duan, N.; Li, X.; Wang, Z. A colorimetric aptamer-based method for detection of cadmium using the enhanced peroxidase-like activity of Au–MoS2 nanocomposites. Anal. Biochem. 2020, 608, 113844. [Google Scholar] [CrossRef]
  30. Wu, S.; Yu, Q.; He, C.; Duan, N. Colorimetric aptasensor for the detection of mercury based on signal intensification by rolling circle amplification. Spectrochim. Acta Part A Mol. Biomol. Spectrosc. 2020, 224, 117387. [Google Scholar] [CrossRef]
  31. Tao, Z.; Zhou, Y.; Duan, N.; Wang, Z. A colorimetric aptamer sensor based on the enhanced peroxidase activity of functionalized graphene/Fe3O4-AuNPs for detection of lead (II) ions. Catalysts 2020, 10, 600. [Google Scholar] [CrossRef]
  32. Chen, Y.; Tao, G.; Lin, R.; Pei, X.; Liu, F.; Li, N. Pre-incubation of auric acid with DNA is unnecessary for the formation of DNA-templated gold nanoclusters. Chem. Asian J. 2016, 11, 1677–1681. [Google Scholar] [CrossRef]
  33. He, W.; Huang, K. Poly-adenine DNA as the high-affinity goalkeeper of mesoporous silica nanoparticles for molecular encapsulation and signal-amplification detection. Surf. Interfaces 2021, 23, 100933. [Google Scholar] [CrossRef]
  34. Das, A.; Bhadra, K.; Achari, B.; Chakraborty, P.; Kumar, G.S. Interaction of aristololactam-β-D-glucoside and daunomycin with poly(A): Spectroscopic and calorimetric studies. Biophys. Chem. 2011, 155, 10–19. [Google Scholar] [CrossRef]
  35. Basu, A.; Jaisankar, P.; Kumar, G.S. 9-O-N-aryl/arylalkyl amino carbonyl methyl substituted berberine analogues induce self-structure in polyadenylic acid. RSC Adv. 2012, 2, 7714–7723. [Google Scholar] [CrossRef]
  36. Vorlíčková, M.; Kejnovská, I.; Bednářová, K.; Renčiuk, D.; Kypr, J. Circular dichroism spectroscopy of DNA: From duplexes to quadruplexes. Chirality 2012, 24, 691–698. [Google Scholar] [CrossRef]
  37. Santamaría-Díaz, N.; Méndez-Arriaga, J.M.; Salas, J.M.; Galindo, M.A. Highly stable double-stranded DNA containing sequential silver(I)-mediated 7-deazaadenine/thymine Watson–Crick base pairs. Angew. Chem. Int. Ed. 2016, 55, 6170–6174. [Google Scholar] [CrossRef] [PubMed]
  38. Escher, D.; Müller, J. Silver(I) Coordination in silver(I)-mediated homo base pairs of 6-pyrazolylpurine in DNA duplexes involves the Watson–Crick edge. Chem. A Eur. J. 2020, 26, 16043–16048. [Google Scholar] [CrossRef] [PubMed]
  39. Zhang, L.; Morita, Y.; Sakuragawa, A.; Isozaki, A. Inorganic speciation of As(III, V), Se(IV, VI) and Sb(III, V) in natural water with GF-AAS using solid phase extraction technology. Talanta 2007, 72, 723–729. [Google Scholar] [CrossRef] [PubMed]
  40. Wu, Y.; Liu, L.; Zhan, S.; Wang, F.; Zhou, P. Ultrasensitive aptamer biosensor for arsenic(iii) detection in aqueous solution based on surfactant-induced aggregation of gold nanoparticles. Analyst 2012, 137, 4171–4178. [Google Scholar] [CrossRef] [PubMed]
  41. Wang, J.; Wang, J.; Zhou, P.; Tao, H.; Wang, X.; Wu, Y. Oligonucleotide-induced regulation of the oxidase-mimicking activity of octahedral Mn(3)O(4) nanoparticles for colorimetric detection of heavy metals. Mikrochim. Acta 2020, 187, 99. [Google Scholar] [CrossRef]
  42. Unutkan, T.; Koyuncu, İ.; Diker, C.; Fırat, M.; Büyükpınar, Ç.; Bakırdere, S. Accurate and sensitive analytical strategy for the determination of antimony: Hydrogen Assisted t-shaped slotted quartz tube-atom trap-flame atomic absorption spectrometry. Bull. Environ. Contam. Toxicol. 2019, 102, 122–127. [Google Scholar] [CrossRef]
  43. Zhu, Z.; Yang, C.; Yu, P.; Zheng, H.; Liu, Z.; Xing, Z.; Hu, S. Determination of antimony in water samples by hydride generation coupled with atmospheric pressure glow discharge atomic emission spectrometry. J. Anal. At. Spectrom. 2019, 34, 331–337. [Google Scholar] [CrossRef]
  44. Moreno-Andrade, I.; Regidor-Alfageme, E.; Durazo, A.; Field, J.A.; Umlauf, K.; Sierra-Alvarez, R. LC-ICP-OES method for antimony speciation analysis in liquid samples. J. Environ. Sci. Health Part A 2020, 55, 457–463. [Google Scholar] [CrossRef] [PubMed]
  45. Panarin, A.Y.; Khodasevich, I.A.; Gladkova, O.L.; Terekhov, S.N. Determination of Antimony By Surface-Enhanced Raman Spectroscopy. Appl. Spectrosc. 2014, 68, 297–306. [Google Scholar] [CrossRef] [PubMed]
  46. Yu, Y.; Zhou, Z.; Zhang, C.; Song, X.; Song, X.; Zhang, Z. Antimony speciation on a dithiothreitol-functionalized two-dimensional Au@Ag array by surface-enhanced Raman spectroscopy. Sens. Actuators B Chem. 2022, 373, 132607. [Google Scholar] [CrossRef]
  47. Tighe, M.; Edwards, M.M.; Cluley, G.; Lisle, L.; Wilson, S.C. Colorimetrically determining total antimony in contaminated waters and screening for antimony speciation. J. Hydrol. 2018, 563, 84–91. [Google Scholar] [CrossRef]
  48. Moustafa, I.M.I.; Amin, A.S.; Darwish, E. A novel bulk optode for ultra-trace detection of antimony coupled with spectrophotometry in food and environmental samples. Talanta Open 2023, 7, 100197. [Google Scholar] [CrossRef]
  49. Komova, N.S.; Serebrennikova, K.V.; Berlina, A.N.; Zherdev, A.V.; Dzantiev, B.B. Low-tech test for mercury detection: A new option for water quality assessment. Chemosensors 2022, 10, 413. [Google Scholar] [CrossRef]
  50. Berlina, A.N.; Komova, N.S.; Zherdev, A.V.; Dzantiev, B.B. Combination of phenylboronic acid and oligocytosine for selective and specific detection of lead(ii) by lateral flow test strip. Anal. Chim. Acta 2021, 1155, 338318. [Google Scholar] [CrossRef]
Figure 1. Schematic representation of microplate apta-enzyme assay for Sb3+ detection. (1)—sorption of streptavidin, (2)—binding of the A10/T10 complex, (3)—binding of Sb3+, (4)—binding of streptavidin labeled with horseradish peroxidase, (5)—addition of TMB, (6)—stopping oxidation by addition of H2SO4.
Molecules 28 06973 g001
Figure 2. (a) CD spectra of A10 aptamer, T10 oligonucleotide and A10/T10 complex; (b) CD spectra of A10 aptamer before and after addition of Sb3+; (c) CD spectra of A10/T10 complex before and after addition of Sb3+; (d) CD spectra of T10 oligonucleotide before and after addition of Sb3+. Concentrations of A10 and T10 were 500 µg/mL. Concentration of Sb3+ was 100 µg/mL.
Molecules 28 06973 g002
Figure 3. (a) Influence of the A10/T10 complex concentration on the registered OD450 in the proposed assay. Experimental conditions were 10 μg/mL streptavidin, no Sb3+. (b) Influence of streptavidin concentration on the registered OD450. Experimental conditions were 5 μg/mL A10/T10 complex, 10 µg/mL of Sb3+. The curve shows the difference between OD450 in the absence and in the presence of Sb3+. Error bars show the standard deviations for three replicate measurements.
Molecules 28 06973 g003
Figure 4. (a) Dependence of the optical density on Sb3+ concentration. Inset: photo of microplate wells for the same concentrations of Sb3+; (b) linear range of the calibration curve for Sb3+ detection. Error bars show the standard deviation for three replicate measurements.
Molecules 28 06973 g004
Figure 5. Effect of Ag+ concentration on optical density for the proposed microplate apta-enzyme assay. Experimental conditions were 5 μg/mL A10/T10 complex, 10 μg/mL streptavidin. The curve shows the difference between OD450 in the absence and in the presence of Sb3+. Error bars show the standard deviation for three replicate measurements.
Molecules 28 06973 g005
Figure 6. (a) Calibration curve for Sb3+ detection using the Ag+-enhanced microplate apta-enzyme assay. Inset: photo of microplate wells for the same concentrations of Sb3+. (b) Linear range of the calibration curve. Error bars show the standard deviation for three replicate measurements.
Molecules 28 06973 g006
Figure 7. Selectivity of the developed Ag+-enhanced microplate apta-enzyme assay for Sb3+ ions concerning other cations and anions. The concentration of each ion was 100 ng/mL. Error bars show the standard deviation for three replicate measurements.
Molecules 28 06973 g007
Table 1. Detection of Sb3+ in water samples using Ag+-enhanced microplate apta-enzyme assay (n = 3).
SamplesAdded, ng/mLFound, ng/mLRecovery, %
Drinking water10.010.9 ± 0.3109.0 ± 2.8
50.063.1 ± 0.2126.2 ± 0.3
100115.0 ± 0.2115.0 ± 0.2
Spring water10.011.2 ± 0.3112.0 ± 2.7
50.049.8 ± 0.799.6 ± 1.4
100106.1 ± 1.1106.1 ± 1.0
Table 2. Parameters of the detection of Sb3+ for various methods.
MethodLOD, ng/mLProbeRef.
Sophisticated Instrumental Methods
Inductively coupled plasma–optical emission spectrometry24.9–32.3water, basal culture medium, anaerobic sludge plus basal medium[44]
Ion-assisted photochemical vapor generation with inductively coupled plasma mass spectrometry0.0047lake and river water[12]
Bulk optode coupled with spectrophotometry using 6-(4-(2,4-dihydroxyphenyl)diazenyl)phenyl)−2-oxo-4-phenyl-1,2-dihydro pyridine-3-carbo-nitrileas a ionophore0.85tap, domestic, sea, ground, lake water, blood plasma, urine[48]
Surface-enhanced Raman scattering using silvered porous silicon and phenylfluorone1-[45]
T-shaped slotted quartz tube–atom trap–flame atomic absorption spectrometry0.75mineral water[42]
Excimer fluorescence using pyrene as a sensing probe160-[16]
Hydride generation coupled with atmospheric pressure glow discharge atomic emission spectrometry0.14groundwater[43]
Surface-enhanced Raman spectroscopy using dithiothreitol-functionalized two-dimensional Au@Ag array1natural water[46]
Low-tech methods
Colorimetric method based on the development of a yellow potassium iodoantimonite complex600water samples from mine adits[47]
Colorimetric detection using gold nanoparticles modified with poly-adenine aptamer10drinking water[19]
Ag+-enhanced microplate apta-enzyme assay using poly-adenine aptamer1.9drinking and spring waterThis work
Disclaimer/Publisher’s Note: The statements, opinions and data contained in all publications are solely those of the individual author(s) and contributor(s) and not of MDPI and/or the editor(s). MDPI and/or the editor(s) disclaim responsibility for any injury to people or property resulting from any ideas, methods, instructions or products referred to in the content.

